2 minute read
Distribution of Child Poverty


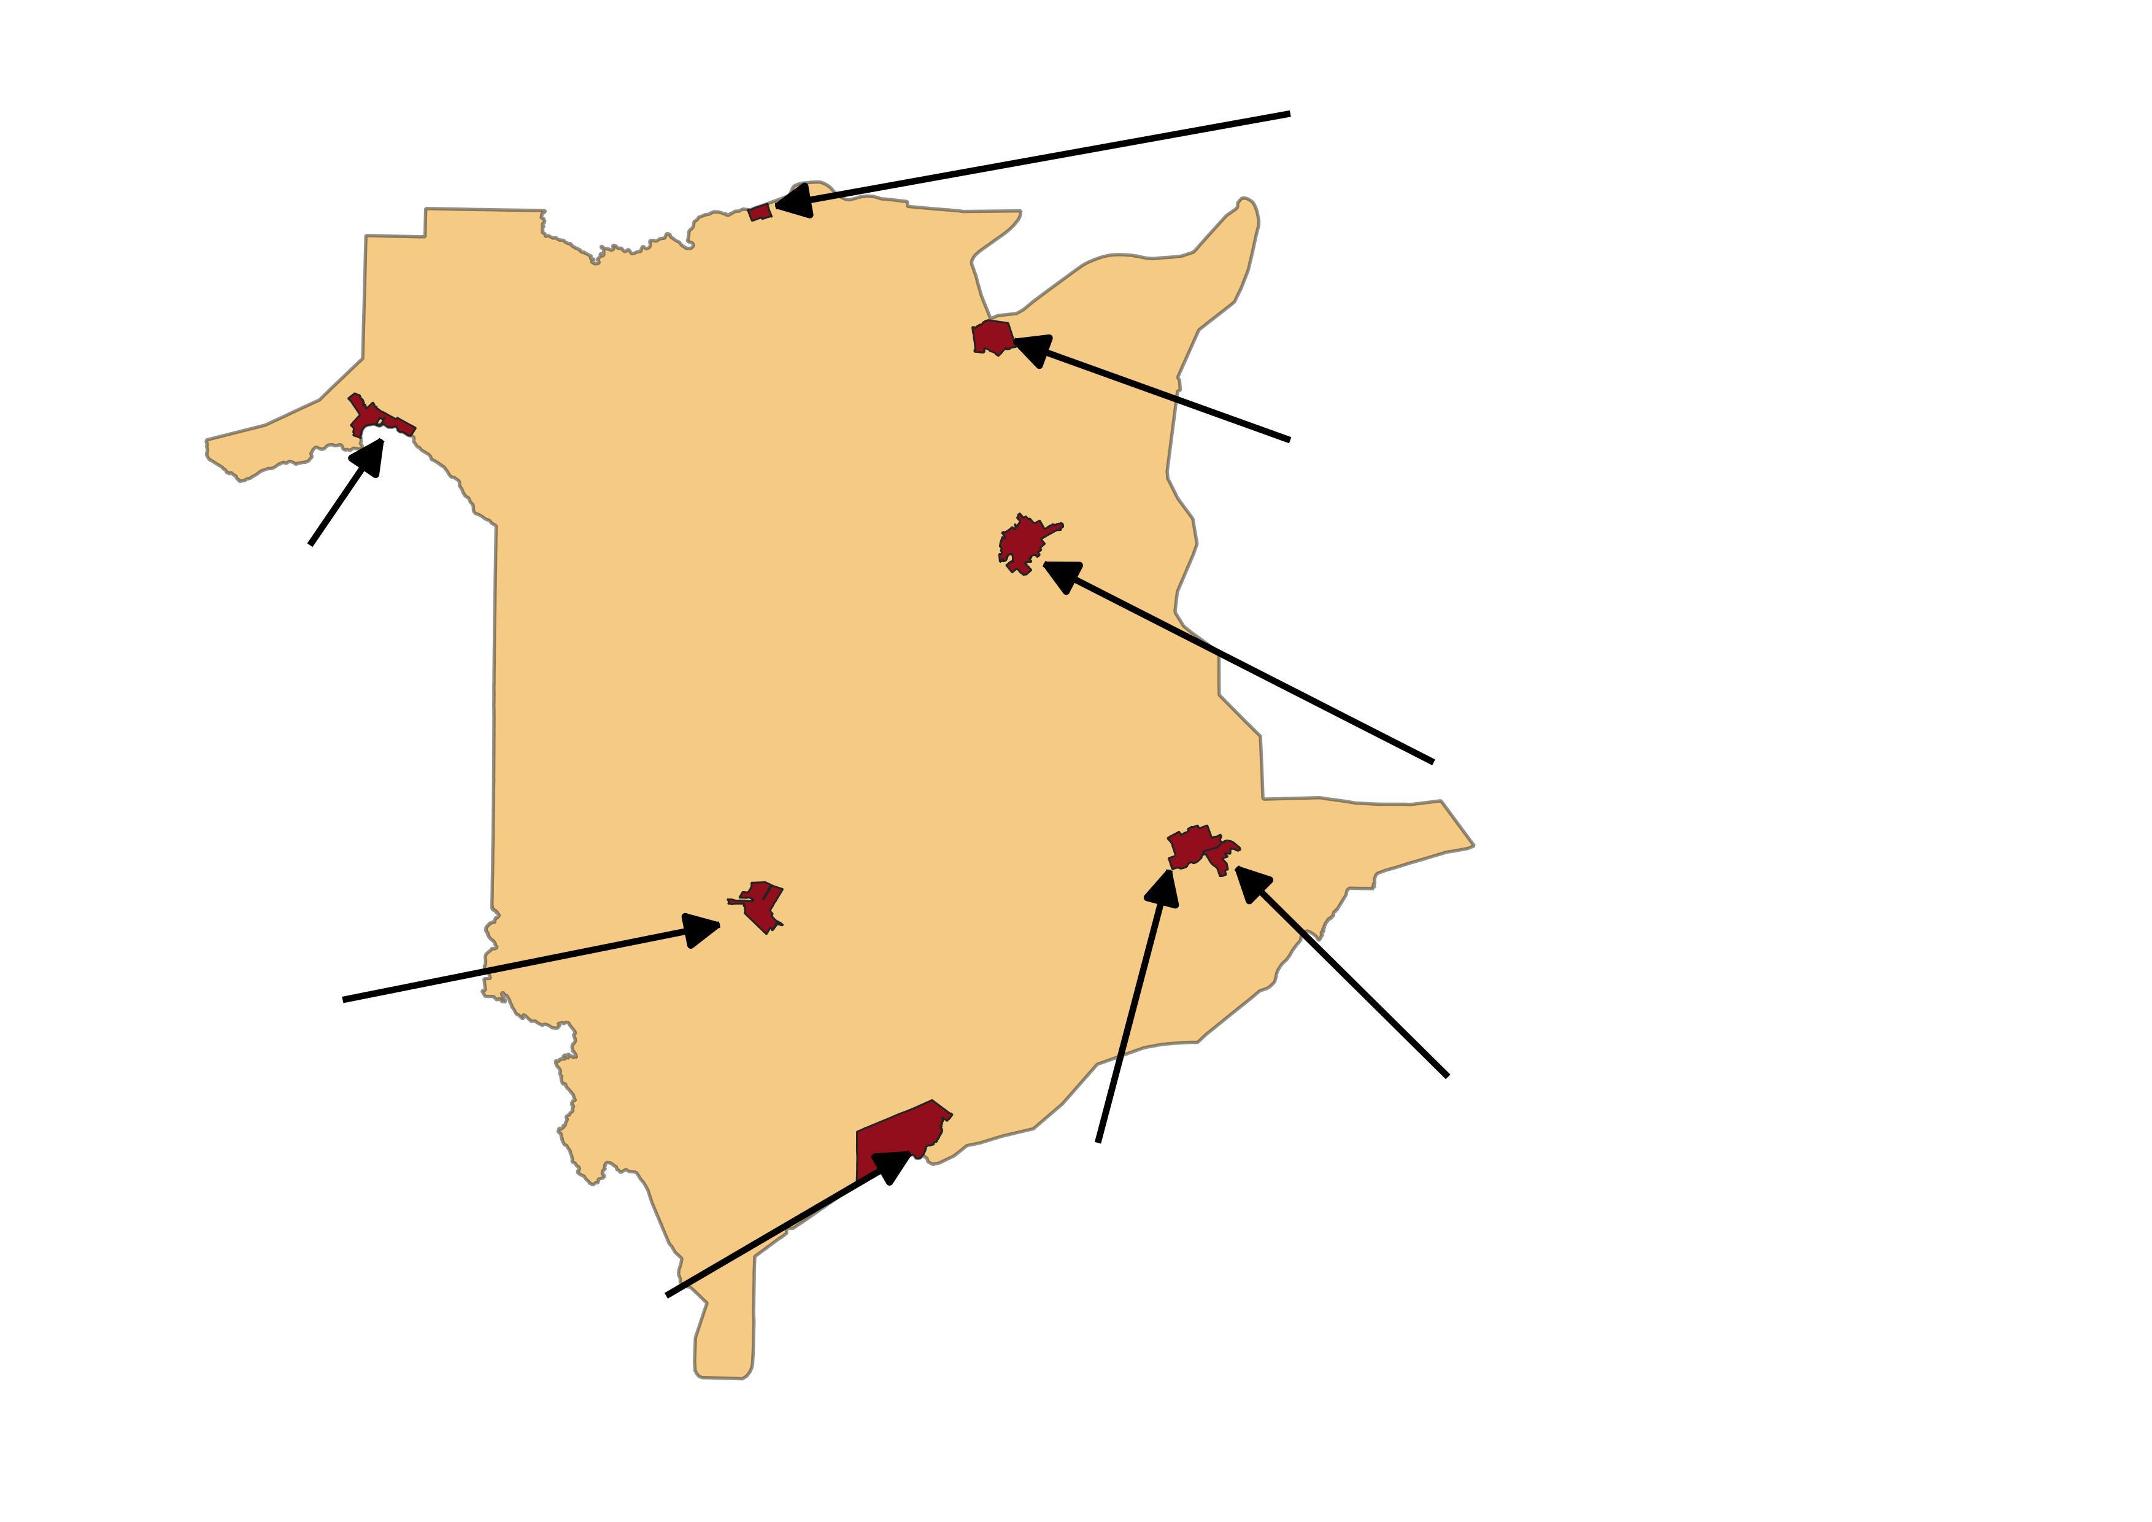
Child poverty rates are unevenly distributed across New Brunswick?s eight cities, from a high of over 30%in Campbellton, Bathurst, and Saint John, to a low of 12.2%in Dieppe.[20] The highest child poverty rates in New Brunswick are found in the northern part of the province (i.e., Campbellton at 35.8%and Bathurst at 32.6%), however, high child poverty rates are not only a problem in northern communities. Saint John - the province's most southern city - has the third highest poverty rate at 32.4%.
Figure 8: Populat ion and Child Povert y Rat es in New Brunsw ick Cit ies
Campbellton Population: 6,883 Child Poverty Rate: 35.8%
Edmundston Population: 16,500 Child Poverty Rate: 22.0%
Fredericton Population: 58,220 Child Poverty Rate: 25.5%
Saint John Population: 67,575 Child Poverty Rate: 32.4% Bathurst Population: 11,897 Child Poverty Rate: 32.6%
Miramichi Population: 17,537 Child Poverty Rate: 23.1%
Dieppe Moncton Population: 25,364 Population: 71,886 Child Poverty Rate: 12.2% Child Poverty Rate: 26.0%
Source: Population - 2016 Census, Statistics Canada; Poverty Rates - T1FF 2019 (CFLIM-AT)
[20] The poverty statistics for New Brunswick municipalities are reported at the postal city level. Postal cities are approximate; they may not exactly match the boundaries of Census subdivisions and/or municipalities. See Appendix Cfor a more extensive list of child poverty rates in different postal cities.
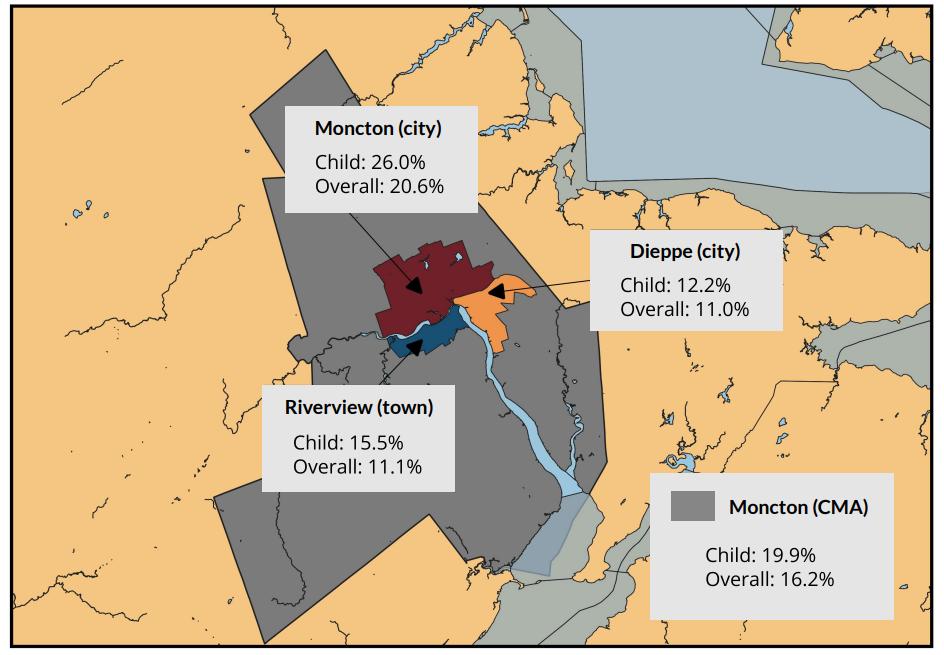
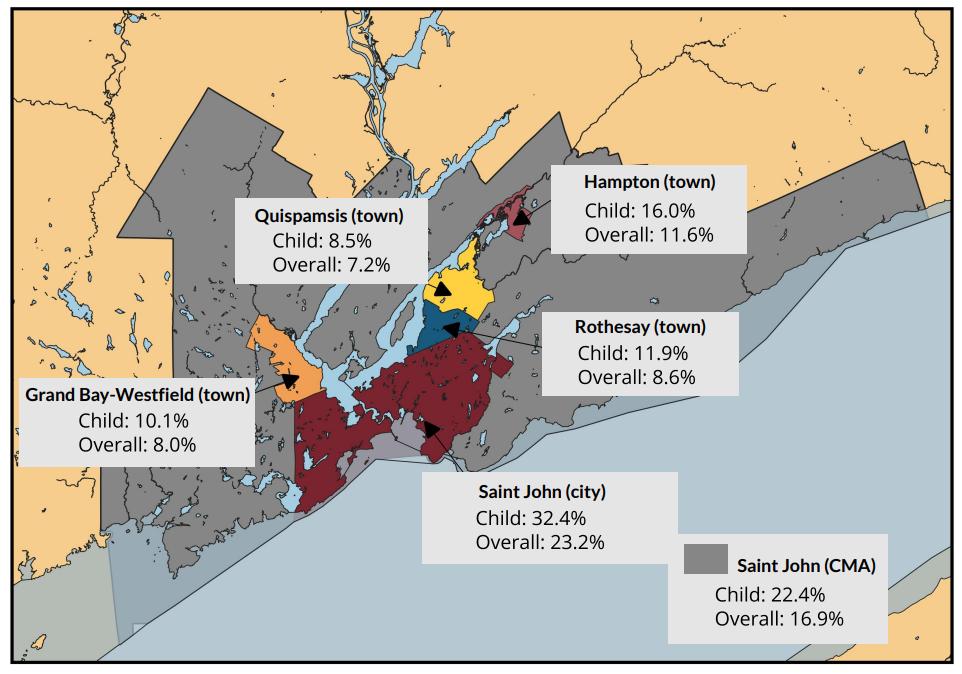
New Brunswick?s two Census Metropolitan Areas (CMAs) are Saint John and Moncton. Both CMAs see large discrepancies in child and overall poverty rates in the central city and neighbouring suburban municipalities. As an example, the city of Dieppe?s child poverty rate is less than half of the rate in the adjoining city of Moncton. There are even larger differences in child poverty rates between the city of Saint John and its neighbouring suburban towns. For instance, the child poverty rate in Saint John is over three times higher than the rate in Quispamsis.
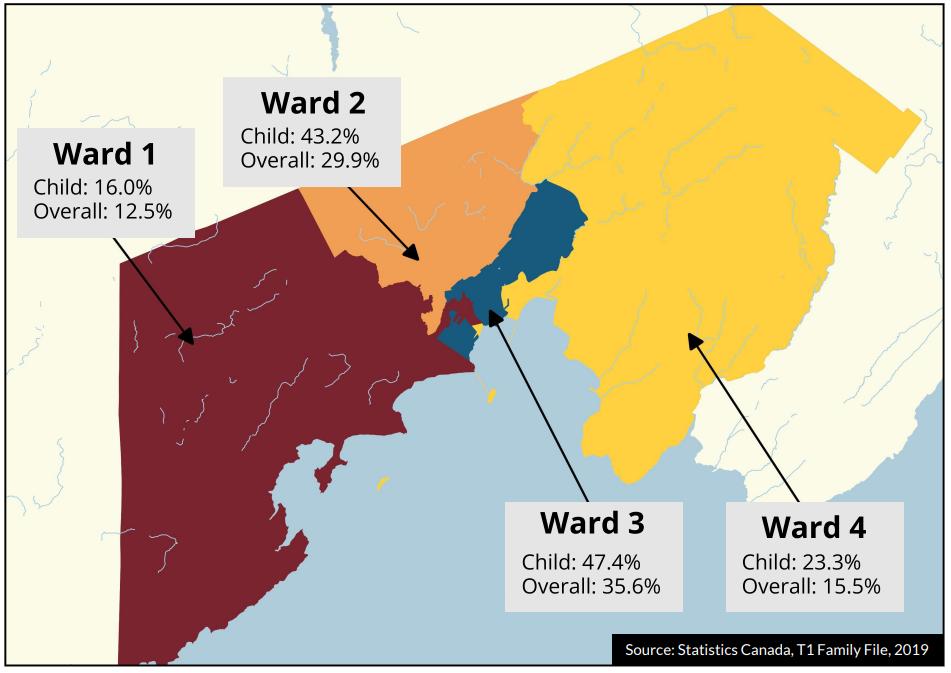
Within Saint John city limits, there are significant differences in the spatial distribution of child poverty. The child poverty rate in Ward 1 was below the provincial average, while the other wards had rates that exceeded it. Wards 2 and 3 had child poverty rates of more than 40%.
Child and Overall Povert y Rat es in Saint John's Municipal Wards