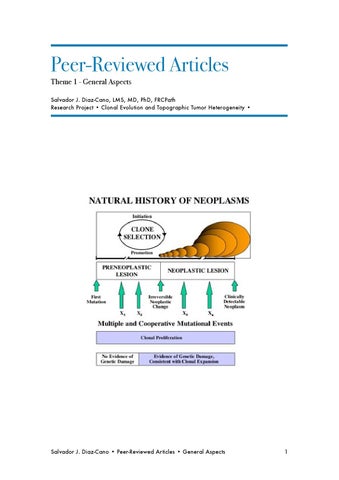
Peer-Reviewed Articles Theme 1 - General Aspects Salvador J. Diaz-Cano, LMS, MD, PhD, FRCPath Research Project • Clonal Evolution and Topographic Tumor Heterogeneity •
Salvador J. Diaz-Cano • Peer-Reviewed Articles • General Aspects
1
Contents DNA Mass Distribution
General Aspects
G0/G1
S
G2+M
G2
M
S
Apoptotic cells
G1 G0
Ki-67 +
2c
4c
Designing a Molecular Analysis of Clonality in Tumours. J Pathol 2000;191:343-344! Salvador J. Diaz-Cano
PCR Techniques for Clonality Assays. Diagn Mol Pathol 2001;10(1):24-33!
4 4
4
Salvador J. Diaz–Cano, M.D., Ph.D., Alfredo Blanes, M.D., Ph.D., and Hubert J. Wolfe, M.D. 4
Clonal Origin and Expansions in Neoplasms: Biologic and Technical Aspects Must Be Considered Together. Am J Pathol 2003;162(1):353-355! Lucia Pozo-Garcia, Salvador J. Diaz-Cano
Are PCR artifacts in microdissected samples preventable? Hum Pathol 2001;32(12):1415-1416! Salvador J. Diaz-Cano, MD, PhD
4 4
4 4
DNA extractions from formalin-fixed paraffin-embedded tissues: Protein digestion as a limiting step for retrieval of high-quality DNA Diagn Mol Pathol 1997;6(6):342-346! 4 Salvador J. Diaz-Cano, MD, PhD, Stephen P. Brady, MD
4
Influence of intratumour heterogeneity in the interpretation of marker results in phaeochromocytomas. J Pathol 1999;189:627-629! 4 Salvador J. Diaz-Cano, Alfredo Blanes Salvador J. Diaz-Cano • Peer-Reviewed Articles • General Aspects
4 2
Clonality in Kaposi’s sarcoma. N Engl J Med 1997;337:570-572! Salvador J. Diaz-Cano, M.D., Ph.D., Hubert J. Wolfe, M.D.
4 4
Analysis of clonality of atypical cutaneous lymphoid infiltrates associated with drug therapy by PCR/DGGE.Hum Pathol. 1999 Feb;30(2):130-6.! 5 Brady SP, Magro CM, Diaz-Cano SJ, Wolfe HJ.
5
PCR-based alternative for diagnosis of immunoglobulin heavy chain gene rearrangement: principles, practice, and polemics.Diagn Mol Pathol. 1996 Mar;5(1):3-9. Review.! 5 Diaz-Cano S.
Salvador J. Diaz-Cano • Peer-Reviewed Articles • General Aspects
5
3
DESIGNING A MOLECULAR ANALYSIS OF CLONALITY IN TUMOURS. J Pathol 2000;191:343-344 Salvador J. Diaz-Cano
PCR TECHNIQUES FOR CLONALITY ASSAYS.
Diagn Mol Pathol
2001;10(1):24-33 Salvador J. Diaz–Cano, M.D., Ph.D., Alfredo Blanes, M.D., Ph.D., and Hubert J. Wolfe, M.D.
CLONAL ORIGIN AND EXPANSIONS IN NEOPLASMS: BIOLOGIC AND TECHNICAL ASPECTS MUST BE CONSIDERED TOGETHER. Am J Pathol 2003;162(1):353-355 Lucia Pozo-Garcia, Salvador J. Diaz-Cano
ARE PCR ARTIFACTS IN MICRODISSECTED SAMPLES PREVENTABLE? Hum Pathol 2001;32(12):1415-1416 Salvador J. Diaz-Cano, MD, PhD
DNA EXTRACTIONS FROM FORMALIN-FIXED PARAFFINEMBEDDED TISSUES: PROTEIN DIGESTION AS A LIMITING STEP FOR RETRIEVAL OF HIGH-QUALITY DNA Diagn Mol Pathol 1997;6(6):342-346
Salvador J. Diaz-Cano, MD, PhD, Stephen P. Brady, MD
INFLUENCE OF INTRATUMOUR HETEROGENEITY IN THE INTERPRETATION OF MARKER RESULTS IN PHAEOCHROMOCYTOMAS. J Pathol 1999;189:627-629 Salvador J. Diaz-Cano, Alfredo Blanes
CLONALITY IN KAPOSI’S SARCOMA.
N Engl J Med
1997;337:570-572
Salvador J. Diaz-Cano, M.D., Ph.D., Hubert J. Wolfe, M.D.
Salvador J. Diaz-Cano • Peer-Reviewed Articles • General Aspects
4
ANALYSIS OF CLONALITY OF ATYPICAL CUTANEOUS LYMPHOID INFILTRATES ASSOCIATED WITH DRUG THERAPY BY PCR/DGGE.HUM PATHOL. 1999 FEB;30(2):130-6. Brady SP, Magro CM, Diaz-Cano SJ, Wolfe HJ.
PCR-BASED ALTERNATIVE FOR DIAGNOSIS OF IMMUNOGLOBULIN HEAVY CHAIN GENE REARRANGEMENT: PRINCIPLES, PRACTICE, AND POLEMICS.DIAGN MOL PATHOL. 1996 MAR;5(1):3-9. REVIEW. Diaz-Cano S.
Salvador J. Diaz-Cano • Peer-Reviewed Articles • General Aspects
5
Journal of Pathology J Pathol 2000; 191: 343±344.
Editorial
Designing a molecular analysis of clonality in tumours Salvador J. Diaz-Cano Department of Histopathology and Morbid Anatomy, St Bartholomew's and the Royal London School of Medicine and Dentistry, Whitechapel, London E1 1BB, UK
Abstract Clonality analysis is used to test malignant transformation and tumour progression. X-chromosome linked clonality assays have been employed for this purpose, but are subject to certain technical limitations. This paper reviews the issues involved and the controls that are necessary to ensure valid interpretation of such analyses. Keywords:
clonality; X-chromosome; lyonization; neoplasia
Clonality is an essential attribute of neoplasms and its analysis has been used to test malignant transformation and tumour progression [1,2]. Concordant patterns of genetic markers (X-linked or not) in different tumours suggest that a common progenitor contributed to those lesions and favour, therefore, a multifocal rather than a multicentric origin. These shared genetic alterations also suggest a common cellular origin for biphasic neoplasms [3]. Saxena et al. recently reported a monoclonal pattern in smooth muscle cells and blood vessels of sporadic angiomyolipoma, while the adipose tissue revealed a polyclonal pattern [4]. Based on these ®ndings the authors concluded that the polyclonal adipose tissue is probably metaplastic or reactive. This represents a good example of the application of clonality in tumour biology. However, some biological and technical issues arise from this article. X-linked clonality assays are based on DNA polymorphism and random X-chromosome inactivation (XCI) in females. Those features enable us to distinguish the maternally from the paternally inherited X-chromosomes [1,5,6]. The mechanisms leading to XCI have not been fully characterized, but DNA methylation might maintain the inactive state, once it is established during early embryogenesis. These methylation patterns are then transmitted by clonal inheritance through the strong preference of mammalian DNA (cytosine-5)-methyltransferase for hemimethylated DNA, involving the promoter regions of alleles on the inactive X-chromosome only [7]. Since XCI analysis is based on differential DNA methylation of one allele from X-chromosome genes (e.g. human androgen receptor gene), suboptimal enzymatic digestion and abnormal methylation can result in changes of clonality patterns. According to Lyon's hypothesis, all but one Xchromosomes in a cell are randomly inactivated during early embryogenesis, when the primordial cell pool may comprise as few as 16±30 cells [8]. Given that small number of embryo-destined cells, it reasonable to Copyright # 2000 John Wiley & Sons, Ltd.
expect unequal numbers of paternally- and maternallyinherited inactive X-chromosomes, although the Xchromosome is randomly inactivated in each cell. The average Lyonization ratio is close to 50 : 50 in large cell populations, although individual variation has been found [8]. Skewing towards one allele to an extent that meets the criteria for clonal derivation is consistent with early XCI during embryogenesis (Figure 1). This ®nding leads us to consider the selection of appropriate controls to assess the Lyonization ratio in each female. This ratio can also vary from tissue to tissue in the same individual, due to unequal splitting of the cells derived from the primordial cell pool, or to different methylation patterns in different tissues [6,9]. Controls for unequal Lyonization should thus ideally be the most closely related tissue thought not to be involved in the disease process. An essential require-
Figure 1. Methylation pattern of androgen receptor alleles in control samples. Only polymorphic and polyclonal controls (two allele bands in both undigested and digested samples) are considered informative for clonality assays (lanes 1 and 2). The remaining possibilities (lanes 3±8) should be excluded from clonality analyses, due to either monoclonal origin of controls (lanes 3±6) or absence of locus polymorphism (lanes 7and 8). U=undigested sample: D=digested sample
344
ment for clonality analysis is the identi®cation of a polymorphic locus in the normal control (Figure 1). In every case, the tumour sample must be compared with matched controls from the same patient to test the heterozygosity for the marker. Additionally, the individual variability and tissue-related Lyonization ratio require samples of close embryological origin. This feature must be maintained in the digested sample in those tests based on XCI (Figure 1). Positive allelic imbalances are determined case-bycase, using the skewed data normalized by the allele ratio in matched controls [1,6]. Allelic imbalance analysis is based on the allele ratio and requires densitometric analysis of both allele bands. Therefore, the allele ratio in the target DNA must be maintained in the ampli®cation product, which has to avoid the PCR plateau phase. At this level, any PCR ampli®cation bias should be considered, especially DNA degradation of the larger allele in formalin-®xed, paraf®n-embedded tissues and defective ampli®cation of repetitive CG-rich sequences [10±12]. Early XCI occurs randomly and results in a chessboard pattern of cells descended from a common progenitor, which may grow together like a clone (patch size mosaicism). This pattern represents an example of tissue heterogeneity that can also be present in tumours. Sample size is a limiting factor; the lower the cell number, the higher the probability of monoclonal patterns based on patch size mosaicism. This concept becomes particularly important in mixed tumours, where multiple microdissected samples from different tumour areas (i100 cells) and from controls are required to address the question. Monoclonal patterns support a neoplastic rather than a reactive or hyperplastic process, but are not diagnostic of it. Host cell contamination of tumour samples could give false heterozygous results that would require careful microdissection and microscopic control of the sample collection. However, the pitfalls mentioned above should be always excluded. Some of these considerations do not appear to have
Copyright # 2000 John Wiley & Sons, Ltd.
Editorial
been addressed in the paper of Saxena et al. [4], especially those concerning tests for digestion completion with restriction endonuclease; controls regarding both tumour heterogeneity and their methylation patterns; PCR bias in the ampli®cation of both alleles; tumour heterogeneity and patch size mosaicism; and the meaning of monoclonal and polyclonal patterns.
References 1. Diaz-Cano SJ, Blanes A, Wolfe HJ. PCR-based techniques for clonality analysis of neoplastic progression. Bases for its appropriate application in paraf®n-embedded tissues. Diagn Mol Pathol (in press). 2. Diaz-Cano SJ. Clonality studies in the analysis of adrenal medullary proliferations: application principles and limitations. Endocr Pathol 1998; 9: 301±316. 3. Zhuang Z, Lininger RA, Man YG, Albuquerque A, Merino MJ, Tavassoli FA. Identical clonality of both components of mammary carcinosarcoma with differential loss of heterozygosity. Mod Pathol 1997; 10: 354±362. 4. Saxena A, Alport EC, Custead S, Skinnider LF. Molecular analysis of clonality of sporadic angiomyolipoma. J Pathol 1999; 189: 79±84. 5. Sleddens HF, Oostra BA, Brinkmann AO, Trapman J. Trinucleotide repeat polymorphism in the androgen receptor gene (AR). Nucleic Acids Res 1992; 20: 1427. 6. Mutter GL, Boynton KA. X chromosome inactivation in the normal female genital tract: implications for identi®cation of neoplasia. Cancer Res 1995; 55: 5080±5084. 7. Lyon MF. Some milestones in the history of X-chromosome inactivation. Annu Rev Genet 1992; 26: 16±28. 8. Fialkow PJ. Primordial cell pool size and lineage relationships of ®ve human cell types. Ann Hum Genet 1973; 37: 39±48. 9. Kappler JW. The 5-methylcytosine content of DNA: tissue speci®city. J Cell Physiol 1971; 78: 33±36. 10. Mutter GL, Boynton KA. PCR bias in ampli®cation of androgen receptor alleles, a trinucleotide repeat marker used in clonality studies. Nucleic Acids Res 1995; 23: 1411±1418. 11. Diaz-Cano SJ, Brady SP. DNA extraction from formalin-®xed, paraf®n-embedded tissues: protein digestion as a limiting step for retrieval of high-quality DNA. Diagn Mol Pathol 1997; 6: 342±346. 12. Diaz-Cano SJ, de Miguel M, Blanes A, Tashjian R, Galera H, Wolfe HJ. Clonality as expression of distinctive cell kinetics patterns in nodular hyperplasias and adenomas of the adrenal cortex. Am J Pathol 2000; 156: 311±319.
J Pathol 2000; 191: 343±344.
Diagnostic Molecular Pathology 10(1): 24–33, 2001
© 2001 Lippincott Williams & Wilkins, Inc., Philadelphia
PCR Techniques for Clonality Assays Salvador J. Diaz–Cano, M.D., Hubert J. Wolfe, M.D.
Ph.D.,
Alfredo Blanes, M.D., Ph.D., and
Clonal overgrowths represent the hallmark of neoplastic proliferations, and their demonstration has been proved useful clinically for the diagnosis of malignant lymphomas based on the detection of specific and dominant immunoglobulin and/or T-cell receptor gene rearrangements. Nonrandom genetic alterations can also be used to test clonal expansions and the clonal evolution of neoplasms, especially analyzing hypervariable deoxyribonucleic acid (DNA) regions from patients heterozygous for a given marker. These tests rely basically on the demonstration of loss of heterozygosity (LOH) resulting from either hemizygosity (nonrandom interstitial DNA deletions) or homozygosity of mutant alleles observed in neoplasms. LOH analyses identify clonal expansions of a tumor cell population, and point to monoclonal proliferation when multiple and consistent LOH are demonstrated. Based on the methylation-related inactivation of one X chromosome in female subjects, X-linked markers (e.g., androgen receptor gene) will provide clonality information using LOH analyses after DNA digestion with methylation-sensitive restriction endonucleases. Therefore, both non-X-linked and X-linked analyses give complementary information, related and not related to the malignant transformation pathway respectively. Applied appropriately, these tools can establish the clonal evolution of tumor cell populations (tumor heterogeneity), identify early relapses, distinguish recurrent tumors from other metachronic neoplasms, and differentiate field transformation from metastatic tumor growths in synchronic and histologically identical neoplasms. Key Words: Clonality—X chromosome inactivation— Microsatellites—Tumor suppressor genes—Tumor progression—Paraffin-embedded tissues.
Conceptually, a clone is a group of genetically identical cells descended from one common ancestor. Currently, clonal derivation of cells is the hallmark of neoplasia and strongly implicates acquired somatic mutations giving survival advantage to a clonal cell population (22). Most somatic tissues are polyclonal unless a marked kinetic advantage within a subset of cells causes them to proliferate at the expense of surrounding tissues, resulting in monoclonal tissues. There are several tests to determine clonality. The markers for clone detection must define a readable and reliable feature linked to a particular cell type and must include karyotypic alterations and single point mutations, among others. The presence of a common and nonrandom alteration in all cells of a tumor confirm clonal origin, but requires in many instances fresh, unfixed tissue—a condition that cannot be met with preneoplasia. Molecular demonstration of a genetic lesion, as small as a point mutation, within all cells is evidence that a common progenitor cell contributed to that mutation. This approach applies only to that fraction of cases in which a “marker” mutation can be identified and fails specifically to identify clonal proliferation that may have taken place before the creation of a specific genetic lesion (Fig. 1). In addition, those particular marker features must also be transmitted to descendant cells and must not induce apoptosis. Under the latter circumstance, any genetic alteration does not result in a dominant clone (15). A given clone should show proliferative advantages over the remaining nonselected cell population to explain tumor growth. This proliferative advantage does not have to be related to a higher proliferation rate. Apoptotic indices lower than those required normally for regular turnover can increase the total cell number. The most important kinetic feature is the imbalance between cell proliferation and cell loss, ending in cellular overgrowth (15,20). Genetic alterations in a kinetically active tumor cell population lead to progressive clone selection and enhance genetic diversity in a given neoplasm as well. Therefore, the inherent genetic instability within a neoplasm results in heterogeneity in tissues derived from a single cell. As soon as the neoplastic transformation
Diagn Mol Pathol 10(1): 24–33, 2001.
From the Department of Pathology (S.J.D.-C., H.J.W.), Tufts University–New England Medical Center, Boston, Massachusetts, USA; St. Bartholomew’s and the Royal London School of Medicine and Dentistry (S.J.D.-C.), London, UK; and the University of Malaga (A.B.), Spain. Address correspondence and reprint requests to Dr. Salvador J. Diaz–Cano, Department of Histopathology & Morbid Anatomy, St Bartholomew’s and the London NHS Trust, Whitechapel, London E1 1BB, UK (e-mail: s.j.diaz-cano@mds.qmw.ac.uk).
24
PCR-BASED TECHNIQUES FOR CLONALITY ANALYSIS OF NEOPLASTIC PROGRESSION
FIG. 1. X-linked and non-X-linked clonality assays provide complementary information. This polyclonal tissue by X-linked analysis would be termed monoclonal for a given marker (black star) after neoplastic-related clonal expansion takes place.
takes place and neoplastic growth ensues, genetically identical cells no longer exist. Nevertheless, certain genetic markers can be used to test clonal expansions within a tumor cell sample. These include gene rearrangement analyses of immunoglobulin genes for B cells and T-cell receptor genes for T cells (3,16). We review the principles and requirements of the proper application of polymerase chain reaction (PCR) techniques in the detection of clonality using formalinfixed and paraffin-embedded material. Two main groups of techniques are presented: those based on the analysis of microsatellites (linked or not to X chromosome) and those related to gene rearrangements. Their potential applications in tumor pathology and pitfalls are summarized briefly. Lastly, some methodological recommendations to obtain reliable results are given. CLONALITY ASSAYS BASED ON MICROSATELLITE ANALYSIS Currently, successful clonality assays using paraffinembedded tissues are based mainly on analyses of widely dispersed, hypervariable regions composed of repetitive deoxyribonucleic acid (DNA) sequences (microsatellites) (36). Several of these microsatellites have been used extensively for DNA fingerprinting and are very useful in genetic linkage analyses, based on their high percentage of heterozygosity in the general population. The loss of heterozygosity (LOH) of a given genetic marker could be linked to loss of tumor suppressor genes (TSG) by DNA deletions (32–34), which would also contribute to the multistep carcinogenesis process selecting cells with growth advantages (44). This progression of genetic events has been found in most inherited cancer syndromes and plays an important role in sporadic cancer development.
25
Microsatellites have assumed an increasingly important role in this task because of their ubiquity, PCR “typability” (except for [dA] n multimers, whose size polymorphisms are difficult to type by PCR), Mendelian codominant inheritance, and extreme polymorphism (2,4). Microsatellites belong to the family of highly polymorphic and repetitive noncoding DNA sequences. It must be noted that, although widely distributed in the human genome, microsatellites are not uniformly spaced. For example, they are underrepresented in subtelomeric regions of chromosomes. Although their origin and function are not clear (36), their polymorphism has been demonstrated to be very useful in delineating cell lineage (2,4). The different length of these tandemly arranged repeats in the paternally and maternally inherited alleles explains their high polymorphic information content and obvious applications in genome mapping and positional cloning, personal identification, population genetic analysis, and the construction of human evolutionary trees. For clonality purposes, both X-linked and non-X-linked clonality assays can be designed. Tumor allelotyping (57,58)—the genotypic analysis of all human chromosome pairs for regions of interstitial deletion—is based conceptually on deletions of TSG alleles. The term allelic imbalance is associated closely with LOH and it is preferred when quantitation of minute DNA amounts is not reliable (6,7,18,48), like in paraffinembedded tissues after microdissection. Both findings are evidence of clonal expansion in a tumor cell population, regardless of the DNA region deleted. Conversely, if the selected polymorphic region is related to known TSG, there is high probability of mutation or function dysregulation of the corresponding gene. Such a situation can explain the growth advantage of the tumor cells carrying that genetic alteration. X-linked Clonality Analysis X-linked clonality analysis can be used only for clonality analysis in informative female subjects, does not assess tumor heterogeneity, and does not provide any data on the precise genetic alteration responsible for clonal proliferation (see Fig. 1). All methods of clonality analysis based on X chromosome inactivation (XCI) include the ability to determine the paternally derived X chromosome (Xp) from the maternally derived one (Xm). Many genes on the X chromosome are polymorphic and permit the distinction between maternally and paternally inherited X chromosomes. Their informativeness is related directly to the frequency of their polymorphism in a population, from 29% heterozygosity for hypoxanthine phosphoribosyl transferase to more than 90% for the human androgen receptor gene (26). According to Lyon’s hypothesis (41), all X chromosomes in a cell in excess of one are inactivated on a Diagn Mol Pathol, Vol. 10, No. 1, 2001
26
S. J. DIAN–CANO ET AL.
random basis during early embryogenesis. Inactivation of most, but not all, genes on one of the X chromosomes is mediated by a gene called Xist, and represents a gross imprinting of many genes to achieve a mammalian dose compensation for X-linked genes, which renders maternal and paternal chromosomes nonequivalent functionally. The mechanisms leading to XCI have not been characterized fully, but DNA methylation may maintain the inactive state once it is established. Approximately 60% of all Cytosine-phosphate-Guanidine (CpG) dinucleotides in the DNA of vertebrates are methylated at the C5 position, but the frequency at particular sites varies between cell types (31). These methylation patterns are transmitted by clonal inheritance through the strong preference of mammalian DNA (cytosine-5)—methyltransferase for hemimethylated DNA. Methylation patterns are established during gametogenesis and early embryogenesis (primordial cell pool of 16–30 cells) (23) and involve, among other DNA regions, promoter regions of alleles on the inactive X chromosome (Xi), whereas alleles on the active X chromosome (Xa) are normally unmethylated (41). Given the small number of embryodestined cells, it reasonable to expect unequal numbers of inactivated Xp and Xm, although X chromosome is inactivated randomly in each cell. Thus the Lyonization ratio (Xpa/Xma) in the population follows a binomial distribution. Allelic variation is determined by the number of progenitor cells at the moment of inactivation (variance observed ⳱ pq/N, where p and q are probabilities of inactivating a particular X [both 0.5] and N is the stem cell pool size). The average Lyonization ratio is close to 50:50 in large cell populations, although individual variation has been found (23), resulting in skewing toward one allele. This is the reason for using as controls for unequal Lyonization the most closely related tissue thought not to be involved in the disease process (14). The distinction of Xa from XI can be made by gene expression analysis (messenger ribonucleic acid and protein derive only from genes on Xa) or can be delineated at the DNA level using methylation-sensitive restriction endonucleases (Fig. 2). The last method can be performed in paraffin-embedded tissues, although it has the absolute requirement of invariable and differential methylation at the polymorphic locus in Xa and Xi. A perfect X-linked clonality assay would unite highly informative polymorphism with an absolute differential methylation pattern between Xa and Xi. Therefore, an informative locus amenable to PCR-based detection of nonrandom XCI must fulfill the following four criteria: 1. High frequency of heterozygosity 2. A site that is methylated differentially in Xa and Xi, and thus is subject to differential digestion by methylation-sensitive restriction endonucleases 3. Polymorphic and methylated regions that are in sufDiagn Mol Pathol, Vol. 10, No. 1, 2001
FIG. 2. Dual approach for the analysis of X-chromosome inactivation in females. (Left) Gene expression analyses are based on messenger ribonucleic acid (mRNA) and protein polymorphism from alleles located in the active X chromosome (Xa). (Right) Conversely, deoxyribonucleic acid (DNA) analysis provides information through the amplification of alleles located on inactive (methylated) X chromosome (Xi) after DNA digestion with methylationsensitive restriction endonucleases. PCR, polymerase chain reaction.
ficient proximity for amplification by one PCR primer set 4. A target that amplifies efficiently and reliably (Fig. 3). Noninvolved normal tissues related closely to the lesion must be tested simultaneously for unequal Lyonization in each particular patient. Several possible targets have been tested, but currently the best option is the human androgen receptor gene (55,56). This gene has a hypervariable CAG trinucleotide repeat in the coding region of its first exon, located less than 100 base pairs (bp) from four methylation sites recognized by HhaI, and known to be methylated on Xi but not on Xa (see Fig. 3). Non-X-linked Clonality Analysis These tests rely basically on the demonstration of LOH, resulting from either hemizygosity (nonrandom interstitial DNA deletions) or homozygosity of mutant alleles observed in neoplasms, but only provide information when the genetic marker represents or is linked to a TSG involved in the malignant transformation. These tests represent the first option to study tumor heterogeneity if several samples are taken from a single neoplasm (17), but two main problems must be considered. First, there is no specific sequence of genetic alterations for a given tumor, and therefore several genetic markers must be tested to get information on clonality. Different sequences of genetic alterations have been proposed for several tumor types and locations based on statistical
PCR-BASED TECHNIQUES FOR CLONALITY ANALYSIS OF NEOPLASTIC PROGRESSION
27
for that particular marker informs only on clonal expansion and cellular selection in genetically heterogeneous tumor cell populations. Only the accumulation of genetic lesions in TSG supports a monoclonal origin of tumors (15), especially if multiple samples from the same tumor show concordant genetic alteration (14,18) (see Methodological Aspects).
FIG. 3. (A) Structure of the androgen receptor (AR) gene (exon 1). A highly polymorphic CAG repeat sequence location 100 base pairs (bp) downstream of a potentially methylated CG island allows a reliable yield of both components in a single polymerase chain reaction amplification (between 250 and 300 bp). Both alleles can be differentiated easily by size, and can be amplified only from the inactive X chromosome (Xi, digestion-resistant allele) in the HhaI-digested sample. (B) Allelic patterns of AR gene in monoclonal and polyclonal tissues. The presence of a single allele in HhaI-digested samples (D) in informative cases (two alleles in undigested samples [U]) defines monoclonal tissues (left, right), whereas the retention of both alleles characterizes polyclonal ones (center). Each cell shows the allelic structure after HhaI digestion to emphasize that the polymerase chain reaction amplification comes from the intact allele only (methylated X chromosome). HMW, high molecular weight; LMW, low molecular weight.
analyses of case series (5,30,57), but the frequency of each genetic alteration is variable. Second, the background level of LOH in normal tissues has been reported to be between 4% and 20%, regardless of the detection system used (8,13,51,59). A similar LOH frequency must be assumed as background in the evaluation of tumor tissues (51). Considering the worst scenario of all genetic lesions being equally important and frequent (21), the probability of randomly finding coexisting genetic alterations in normal tissues would be 0.22 ⳱ 4.0 10−2 for two genetic loci, 0.23 ⳱ 8.0 10−3 for three genetic loci, and so on. No single genetic alteration of TSG proves by itself that a given proliferation is monoclonal: The LOH
CLONALITY ANALYSIS BASED ON SPECIFIC GENE REARRANGEMENTS This application will not be covered in detail because it is better known and applicable to malignant lymphomas only. It has been demonstrated to be useful in the diagnosis of malignant lymphomas, in which the presence of homogeneous-appearing lymphoid cell overgrowths are considered histologic evidence of clonal expansion and malignancy (3,10,16). Committed lymphoid precursors undergo unique sequential assembly of the heavy and light chains of immunoglobulin (B-cell precursors) and T-cell receptor chains (T-cell precursors) during their maturation (16). Their diversity is based on somatic DNA deletions, template-independent nucleotide additions, and specific splicing (39). These processes involve, in the case of immunoglobulin heavy chain, three highly variable regions, complementarity-determining regions, which separate four framework regions (FR) (10). The locations of DNA breaks are determined by short DNA sequences (7 and 9 bp) recognized by the recombination–activating proteins. The presence of length-specific spacer sequences provides the right splicing and determines the DNA rearrangement order (e.g., D-J and V-DJ in the case of immunoglobulin). Template-independent nucleotide additions give the final DNA rearrangement of immunoglobulin or T-cell receptor chains. All gene rearrangements in lymphoid precursors take place only in cells expressing terminal deoxynucleotidyl transferase (16). The PCR design for gene rearrangement detection has to consider the special situation of DNA sequence addition and deletion. It is particularly important for the primer binding regions, which must be located in less variable sequences (FR regions for immunoglobulin gene rearrangement) to avoid failed amplification resulting from their loss. This factor also helps to explain false-negative results in the detection of clonal rearrangement in well-differentiated lymphoid neoplasms (related to gene hypermutability). Complete rearrangements may be associated with the loss of inner FR regions (in B cells) and with ␦-chain (in T cells), the most sensitive primer binding regions to detect early rearrangement. Therefore, a broad approach is recommended for detecting clonal rearrangement, including at least two different set of primers (FR III–FR IV and FR I–FR IV) in B-cell lymphoid lesions (16), and several primer sets Diagn Mol Pathol, Vol. 10, No. 1, 2001
28
S. J. DIAN–CANO ET AL.
for the T-cell receptor ␥-chain in T-cell lymphoid lesions (3). All PCR-based analyses must be run with appropriate controls, including internal positive (provided by nonspecific amplifications of locus-homologous sequences), positive (lymphoid proliferation with clonal rearrangement), negative (polyclonal lymphoid proliferation), and technique efficiency (mixture of monoclonally and polyclonally rearranged DNA tested previously) (16). The last control is needed essentially for the clinical application of these tests when sensitivity is an absolute requirement (16). Their interpretation must also consider the presence of false-positive and false-negative cases, and their causes (3,16). It should be emphasized that clonal gene rearrangement does not mean malignancy, because even some benign conditions can show it. Furthermore, well-defined monoclonal PCR bands can be observed when the lymphoid DNA template is present in trace amounts. Nonamplifiable DNA may result from the failure of PCR amplification for technical reasons (contamination, highly fragmented DNA, etc.) or when the presence of rearranged DNA is less than the sensitivity level (approximately 1% of the total cell population). Lastly, oligoclonal proliferation (especially in immunodeficiency-related lymphomas) can result in smear patterns from overlapped clonal bands. GENERAL INTERPRETATION CRITERIA AND QUALITY CONTROLS OF CLONALITY MICROSATELLITE ANALYSES Two complementary aspects are evaluated with Xlinked and non-X-linked clonality analyses (see Fig. 1). XCI takes place early during embryologic development, usually before and unrelated to any genetic event involved in the malignant transformation. Therefore, it is really informing about clonality in tumors and precancerous conditions, although it is not able to inform on the specific molecular alterations. Different polymorphic regions have been related to TSG (recessive trait genes). Therefore, LOH analyses enable us to study the molecular pathways involved in the malignant transformation, and to test clonal expansion and tumor heterogeneity if various molecular markers are assessed in samples from different tumor areas. Moreover, the correlation of these molecular markers with other pathologic parameters (like tumor cell invasion, nuclear grade, proliferation indices, etc.) can help us to identify high-risk patients and to understand the process of multistep carcinogenesis. All nonrandom gene rearrangements, as markers of malignancy, fulfill the criteria mentioned for LOH analyses. Any molecular analysis must be run with appropriate controls, including known positive (monoclonal proliferations, homozygous for the marker) and negative (polyclonal proliferations, heterozygous for the marker) Diagn Mol Pathol, Vol. 10, No. 1, 2001
controls, and from embryologically related tissues for XCI analysis to exclude a skewed Lyonization ratio (18, 20,43). The PCR approach for microsatellite analysis (including both clonality assays) must amplify the right locus and accurately identify informative patients (two different alleles present in control tissues; Fig. 4). This issue becomes especially important for microsatellite analysis when the presence of extra bands is not exceptional, especially in cases of internal labeling. A sine qua non requirement for clonality analysis is the identification of a polymorphic locus in the normal control (see Fig. 4). In every case, the tumor sample must be compared with normal controls from the same patient to test patient heterozygosity for the marker—a feature that must be maintained in HhaI-digested samples in tests based on DNA methylation, such as XCI assays (Fig. 5). Patients with two identical alleles or showing skewed Lyonization in control tissues should be considered noninformative and should be excluded from clonality evaluation. Another cause of noninformative cases is the anomalous expansion or reduction of tandem repeats resulting from microsatellite instability that results in extra bands (see Fig. 4). True new bands, as true evidence of microsatellite instability, are located normally in the expected size range (usually approximately 100 bp), above or below the expected PCR product. Therefore, LOH and allelic imbalances of gene loci can be interpreted as evidence of monoclonal proliferation (for X-linked assays of templates digested by methylation-sensitive restriction enzyme, such as HhaI) or clonal expansion (for non-X-linked assays, including gene rearrangements), if noninformative cases have been excluded previously (see Fig. 1 and 4). Positive allelic
FIG. 4. Polymerase chain reaction-based analysis of microsatellites in clonality assays. Allelic polymorphism (P) in any given control identifies informative (I) patients (left). The tumor (T)–control (C) comparison allows case classification as normal (retention of heterozygosity [ROH]) or abnormal (loss of heterozygosity [LOH] and microsatellite instability [MSI]). Cases showing MSI could be either monoclonal or polyclonal and should be excluded from clonality assays. NP, no polymorphism; NI, noninformative patient.
PCR-BASED TECHNIQUES FOR CLONALITY ANALYSIS OF NEOPLASTIC PROGRESSION
FIG. 5. Gel patterns of androgen receptor (AR) alleles from controls. Only polyclonal controls (two-band pattern on HhaI-digested samples [D]) from tissues with AR– allelic polymorphism (two-band pattern on HhaIundigested samples [U]) are informative for X-linked clonality assays. Monoclonal controls (even from polymorphic tissues) and tissues with AR–allelic monomorphism lack informativeness for clonality purposes.
imbalances are determined case by case, in relation to the densitometric allelic ratio in the normal control (43), which requires a threshold of at least 4:1 in skewed data. The host cell contamination of tumor samples could give false heterozygous results that would require careful microdissection and microscopic control of the sample collection. APPLICATIONS AND PITFALLS Clonality assays can be useful in the analysis of different biologic processes. They have been used mainly in the study of malignant transformation and tumor progression. At this level, the complementary information provided by X-linked and non-X-linked markers contributes to the definition of the real nature of the lesion, as mentioned earlier. Monoclonal patterns would support the neoplastic nature, although they have been described in other proliferative processes such as aggressive fibromatosis (1) or focal nodular hyperplasia of the liver (25). Similarly, the polyclonal patterns reported in sacrococcygeal cystic teratomas suggest their hamartomatous nature, opposed to the monoclonal immature teratoma (54). The acquisition of additional genetic deletions in certain histologic areas favors a molecular progression as reported for the adenoma–carcinoma sequence in colon (52), or sporadic neuroendocrine tumors of the pancreas (45). The acquisition of genetic changes has been considered evidence of molecular progression that also results in tumor heterogeneity. Tests demonstrating those abnormalities only prove clonal expansions, but would support monoclonality if several markers from different tumor areas show concordant genetic alterations (15, 18).
29
The identity of synchronic or metachronic tumors can be tested at the molecular level using these clonality markers. Both extremes have been reported in tumors. Some coexistent tumors have revealed the same pattern of genetic markers (both X linked and non-X linked), suggesting that a common progenitor contributed to those lesions, and thus supporting a multifocal rather than a multicentric origin. This particular situation has been demonstrated in bladder tumors (18,53), human immunodeficiency virus-associated Kaposi’s sarcoma (47), disseminated peritoneal leiomyomatosis (46), or multifocal C-cell hyperplasias and nodular adrenal medullary hyperplasias associated with multiple endocrine neoplasia 2A (20a). In the case of malignant neoplasms, this shared genetic alteration would support a metastatic origin for the tumors (11), or a common cellular origin for biphasic neoplasms (60). Opposite findings have been reported for prostatic tumor foci when the heterogeneous genetic composition suggests either an independent evolution of those foci from a common progenitor or a completely different origin (28,29). Lastly, any well-characterized genetic alteration can be used for the early detection of recurrences, both local and systemic. These alterations pick clonal expansion from selected groups of cells, and they have been proposed as tools to study the resection margins in conservative surgery, as reported for head and neck squamous cell carcinomas (35). Likewise, the presence of minimal residual disease can be defined better at the molecular level by detecting circulating tumor cells with specific gene alterations, more frequently gene rearrangements, as reported for malignant lymphoma (16) or sarcomas of the Ewing family (12). These molecular studies should be interpreted with caution. Some considerations should be made to set the proper value of these techniques. These considerations include tumor cell heterogeneity, sample size, tissue control, restriction enzyme digestion and abnormal methylation, and artifactual allelic dropout. Tumor Cell Heterogeneity Tumor cell heterogeneity is linked to genetic instability and biologic progression. This genetic heterogeneity is often reflected in phenotypic expression. Examples include the presence of a Ki-ras point mutation in carcinomatous areas from adenomatous polyposis coli (APC)mutated sporadic colorectal adenomas (52). Similarly, mutations in cell cycle regulators (e.g., tumor protein 53, retinoblastoma, cyclins, cyclin-dependent kinases, and cyclin-dependent kinase inhibitors) have been related to either proliferative advantages or apoptotic dysregulation (9). So, it can explain their association with tumor grade as far as nuclear atypia (pleomorphism, chromatin features, and size variability) is expression of both proliferation and apoptosis. Tumor heterogeneity must be Diagn Mol Pathol, Vol. 10, No. 1, 2001
30
S. J. DIAN–CANO ET AL.
studied using several tumor samples of appropriate size from each tumor (see the following section). Sample Size Sample size is a limiting factor. To increase sample homogeneity and to avoid normal cell contamination, very small samples (even single cells) have been used in genetic analyses. However, the lower the number of cells, the higher the probability of false monoclonal patterns based on inadequate sampling. Although early XCI takes place at random and usually gives a chessboard pattern, small cell populations descended from a common stem cell may grow together like a clone (patch size concept or contiguous cellular regions of the same lineage). For this reason, monoclonal XCI patterns are reported in breast lobules when studied from single samples. Multiple samplings from different areas and sample sizes larger than 100 cells or 0.25 mm2 can avoid this problem. The sample size in tumor cell analysis is, therefore, an important parameter, particularly in light of tumor cell heterogeneity. Microdissection techniques allow us to pick up very small samples selectively, which can show false cellular homogeneity, based on LOH or allelic imbalance. If the tumor cell populations selected for molecular analysis are taken before they become a biologically prominent component (with proliferative or invasive advantages), the results obtained may be confusing and irrelevant clinically, and need to be evaluated in the proper biologic context. This would be the case with microheterogeneity in tumors that tend to give disparate results with meanings that remain essentially unknown. Except for intraepithelial proliferation, all cell samples with microdissection provide target cell-rich samples with a varying degree of host cell contamination (including stromal, inflammatory, and endothelial cells). Taking all these factors into consideration, multiple samples from the same case should always be studied, and assays should be performed in duplicate before accepting the results as relevant. Tissue Control Tissue control from the same patient is an absolute requirement to test patient heterozygosity for a particular TSG marker (as mentioned earlier; see Fig. 5 and Fig. 6). Ideally, embryologically related tissues are the best to show a reliable X-linked clonality pattern. Oncogene genetic changes such as RAS point mutations that are not found in the germline are excluded from this approach and do not require heterozygosity control. Restriction Enzyme Digestion and Abnormal Methylation Every single step for all molecular tests must be controlled for completion to avoid false results. Appropriate Diagn Mol Pathol, Vol. 10, No. 1, 2001
FIG. 6. Methylation level and allelic patterns of androgen receptor (AR). (A) Monoclonal tissues would only change the clonality pattern if the amplified AR locus was hypermethylated. A pseudopolyclonal pattern would be revealed on gel electrophoresis (right). (B) Polyclonal tissues would only change the clonality pattern if the amplified AR locus was hypomethylated. A pseudomonoclonal pattern would be revealed on gel electrophoresis (B). PCR, polymerase chain reaction; U, HhaI-undigested sample; D, HhaI-digested sample; HMW, high molecular weight; LMW, low molecular weight.
controls must be run, especially for restriction enzyme digestions. Because XCI analysis is based on differential DNA methylation of one allele from X-chromosome genes (e.g., human androgen receptor gene) and relies on endonuclease digestion by methylation-sensitive restriction enzymes, suboptimal enzymatic digestion provides a changed clonality pattern in the case of monoclonal tissues. Likewise, abnormal methylation provides potentially the same false result in the case of hypermethylation, whereas hypomethylation could affect the clonality pattern in polyclonal tissues giving a pseudomonoclonal one (see Fig. 6). Additionally, methylation abnormalities occur during the course of malignant transformation (37). Hypomethylation has been described in relation to increased proliferation during early stages of neoplasms, whereas hypermethylation has been linked to
PCR-BASED TECHNIQUES FOR CLONALITY ANALYSIS OF NEOPLASTIC PROGRESSION late stages associated with a higher mutation rate and tumor progression (42). Artifactual Allelic Dropout PCR bias against one allele (especially the larger one) can result in preferential amplification of the other allele (usually the smaller) (24,49). An appropriate extraction method providing DNA of enough quality (3,19), and PCR designs including both long denaturation and extension during the first three cycles, and 7-deaza-deoxyguanidine triphosphate (dGTP) in the amplification mixture to improve the amplification of CG-rich DNA regions reasonably avoids that bias (18,20,49). METHODOLOGIC ASPECTS Formalin-fixed, paraffin-embedded tissues are analyzed more easily at the DNA level, resulting in part from the better preservation of this nucleic acid. Therefore, any PCR-based technique applied to this material should consider DNA extraction, DNA modification (such as restriction enzyme digestion), target amplification, and adequate gel resolution of the products. DNA Extraction Process Several chemical modifications are induced in tissues by fixation and processing, including cross-linking between basic amino acids of proteins and the amino groups on DNA bases. Nonspecific amplifications are caused mainly by primer-independent, but DNA polymerase- and cycling-dependent, incorporation of nucleotides into DNA, possibly related to DNA repair and/or internal priming (40). This is the reason for complete and intense protein digestion before DNA purification (19). Denaturing reagents can break the cross-linked strands but in turn provide short-length DNA strands, precluding their use in protocols that require DNA of 250 to 500 bp in length. The general DNA quality of the extracted DNA should be tested by gel electrophoresis of the protein-digested sample, universal DNA amplification using degenerated oligonucleotide primer–PCR, or amplifying -globin gene with primer sets at least 100 bp lengthier than the final DNA target. The easiest protocol giving the highest DNA quality is 55 to 60°C prolonged proteinase K digestion (5–7 days, with every-day enzyme replacement) (19). The standard phenol–chloroform purification protocol results in the best contaminant-free DNA for any PCR application. Negative amplification resulting from sample contamination (specific amplification lacking with no primer dimers) can be avoided by diluting the sample. DNA Modifications Certain applications need original DNA strands, such as those based on the genomic imprinting of XCI. The
31
presence of methylated cytosine can be tested by sample digestion by methylation-sensitive restriction endonucleases. In any case, appropriate internal control should be included to prove complete digestion. The samples already show smear patterns, and even they may be undetectable using gel electrophoresis (especially for microdissected samples). A logical way to accomplish this issue is to include DNA mimickers in every sample undergoing restriction enzyme digestion. These mimickers are normally viral DNA (such as phages) and should fulfill some requirements. They must be linear and double stranded (like human genomic DNA), and they must contain base sequences recognized by the tested enzyme with reliable pre- and postdigestion patterns. In addition, no sequence similarity able to give nonspecific amplification in further PCR should be present. Xho-Ilinearized X174RII phage represents an ideal mimic for HhaI digestion used for XCI analysis. XCI analysis tests the differential methylation level in a CpG island approximately 100 bp upstream of the CAG repeat (56). Different methylation-sensitive restriction enzymes have been used, especially HhaI and HpaII. The first provides more reliable results because of its activity with single-strand DNA (that activity has not been demonstrated for HpaII). We must keep in mind that the embedding process partly denatures DNA and, therefore, single-strand DNA is a normal component in archival material. Target Amplification by PCR and Gel Resolution All PCR methods should consider the appropriate conditions regarding Mg2+ and primer concentrations, nucleotide concentration, number of cycles in case of PCR-based quantitative analyses, PCR product labeling, and detection methods. The standards for all PCR technique need specific optimization for each set of primer according to Mg2+ (normally 1.5 mM) and nucleotide concentration (in the 50-M range for microsatellite analyses). PCR cycling conditions should always consider the number of cycles to avoid product saturation unacceptable for any quantitative PCR design; in general, between 25 and 30 cycles give adequate amplification in accordance with the initial DNA concentration. We optimized experimentally the conditions for PCR as follows: the reactions were run with 1.5 mM MgCl2, using 0.3 M each primer, 200 M each dNTP (including 7-deaza-dGTP instead of dGTP) and 1 L template. A long denaturation (4 minutes) was used in the first three cycles, the annealing temperature was 55°C, and the number of cycles was optimized experimentally to 28. A “hot start” (addition of primers to mixtures kept at 85°C) should also be included to facilitate the complete denaturation of DNA strands with high CG content in the initial amplifications (18, 20, 43). Diagn Mol Pathol, Vol. 10, No. 1, 2001
32
S. J. DIAN–CANO ET AL.
DNA samples from microdissected tissues are not ideal for reliable quantification and are generally run with unknown target DNA concentration. So, relative quantification of both allelic bands must be taken into consideration to determine whether LOH (or allelic imbalance) is present. This issue brings us to consider the labeling and detection method. 32P- and 33P-based radiolabeling represent the standard protocols, including both external (one primer is 5⬘ labeled) and internal (labeled nucleotide in the PCR mixture) methods. Although the latter usually gives more background, it permits the highest sensitivity for microdissected paraffin-embedded samples. Allelic separation can be achieved by running the samples far enough into high-resolution denaturing polyacrylamide gels (variable concentrations of formamide and urea). Some other detection methods have been used, including fluorescent labeling (6,7) and silver staining of PCR products (38). The highest sensitivity is achieved by radioisotopic methods, which remains the standard for molecular detection of genetic alterations, especially in formalin-fixed, paraffin-embedded material. Additionally, the ratio between signal and initial DNA amount is highly variable for silver-stained gels, making the applications of this technique less reliable for quantification. Different technical approaches have been used to detect interstitial DNA deletion and single base changes (mutations/polymorphisms), including singlestrand conformational polymorphism, denaturant gradient gel electrophoresis, mutant allele-specific amplification, ribonuclease (RNase) protection, etc. (27,50). Although the final proof for any mutation must be direct sequencing, one of the most sensitive methods for detecting single base changes is PCR/denaturant gradient gel electrophoresis, which is able to distinguish DNA strands differing in only one base (3,18). Lastly, the linear ratio between radioactive emission and signal deposition can be maintained by film preflashing to get a 0.1 to 0.2-OD unit absorbance increase at 540 nm in the preflashed film. In addition, signal stabilization during autoradiogram development requires −70°C storage. The allelic ratio has to be quantitated in normalized samples to exclude any potential contamination with normal tissue (43). At that level, different computer soft䊐 ware is available to aid in analysis. Acknowledgment: Presented in part at the Xth International Congress of Histochemistry and Cytochemistry, Kyoto, Japan, August 18–23, 1996; and at the XXIst International Congress of the International Academy of Pathology, Budapest, Hungary, October 20–25, 1996.
REFERENCES 1. Alman BA, Pajerski ME, Diaz–Cano S, Corboy K, Wolfe HJ. Aggressive fibromatosis (desmoid tumor) is a monoclonal disorder. Diagn Mol Pathol 1997;6:98–101.
Diagn Mol Pathol, Vol. 10, No. 1, 2001
2. Boland CR. Setting microsatellites free. Nat Med 1996;2:972–4. 3. Brady SP, Magro CM, Diaz–Cano SJ, Wolfe HJ. Analysis of clonality of atypical cutaneous lymphoid infiltrates associated with drug therapy by PCR/DGGE. Hum Pathol 1999;30:130–6. 4. Brentnall TA. Microsatellite instability. Shifting concepts in tumorigenesis. Am J Pathol 1995;147:561–3. 5. Califano J, van der Riet P, Westra W, et al. Genetic progression model for head and neck cancer: implications for field cancerization. Cancer Res 1996;56:2488–92. 6. Cawkwell L, Bell SM, Lewis FA, Dixon MF, Taylor GR, Quirke P. Rapid detection of allele loss in colorectal tumours using microsatellites and fluorescent DNA technology. Br J Cancer 1993; 67:1262–7. 7. Cawkwell L, Li D, Lewis FA, Martin I, Dixon MF, Quirke P. Microsatellite instability in colorectal cancer: improved assessment using fluorescent polymerase chain reaction. Gastroenterology 1995;109:465–71. 8. Chen LC, Kurisu W, Ljung BM, Goldman ES, Moore DI, Smith HS. Heterogeneity for allelic loss in human breast cancer. J Natl Cancer Inst 1992;84:506–10. 9. Cordon–Cardo C. Mutations of cell cycle regulators. Biological and clinical implications for human neoplasia. Am J Pathol 1995; 147:545–60. 10. Cossman J, Zehnbauer B, Garrett CT, et al. Gene rearrangements in the diagnosis of lymphoma/leukemia. Guidelines for use based on a multiinstitutional study. Am J Clin Pathol 1991;95:347–54. 11. Cuatrecasas M, Matias–Guiu X, Prat J. Synchronous mucinous tumors of the appendix and the ovary associated with pseudomyxoma peritonei. A clinicopathologic study of six cases with comparative analysis of c-Ki-ras mutations. Am J Surg Pathol 1996;20:739–46. 12. de Alava E, Lozano MD, Patino A, Sierrasesumaga L, Pardo–Mindan FJ. Ewing family tumors: potential prognostic value of reverse–transcriptase polymerase chain reaction detection of minimal residual disease in peripheral blood samples. Diagn Mol Pathol 1998;7:152–7. 13. Deng G, Lu Y, Zlotnikov G, Thor AD, Smith HS. Loss of heterozygosity in normal tissue adjacent to breast carcinomas. Science 1996;274:2057–9. 14. Diaz–Cano SJ. Designing a molecular analysis of clonality in tumours. J Pathol 2000;191:343–4. 15. Diaz–Cano SJ. Clonality studies in the analysis of adrenal medullary proliferations: application principles and limitations. Endocr Pathol 1998;9:301–16. 16. Diaz–Cano S. PCR-based alternative for diagnosis of immunoglobulin heavy chain gene rearrangement: principles, practice, and polemics. Diagn Mol Pathol 1996;5:3–9. 17. Diaz–Cano SJ, Blanes A. Influence of intratumor heterogeneity in the interpretation of marker results in pheochromocytomas. J Pathol 1999;189:627–8. 18. Diaz–Cano SJ, Blanes A, Rubio J, Matilla A, Wolfe HJ. Molecular evolution and intratumor heterogeneity by topographic compartments in muscle-invasive transitional cell carcinoma of the urinary bladder. Lab Invest 2000;80:279–89. 19. Diaz–Cano SJ, Brady SP. DNA extraction from formalin-fixed, paraffin-embedded tissues: protein digestion as a limiting step for retrieval of high-quality DNA. Diagn Mol Pathol 1997;6:342–6. 20. Diaz–Cano SJ, de Miguel M, Blanes A, Tashjian R, Galera H, Wolfe HJ. Clonality as expression of distinctive cell kinetics patterns in nodular hyperplasias and adenomas of the adrenal cortex. Am J Pathol 2000;156:311–9. 20a. Diaz-Cano SJ, de Miguel M, Blanes A, Tashjian R, Galera H, Wolfe HJ. Clonal patterns in phaechromocytomas and MEN-2A adrenal medullary hyperplasias: histologic and kinetic correlates. J Pathol 2000;192:221–8. 21. Diaz–Cano SJ, Wolfe HJ. Clonality in Kaposi’s sarcoma. N Engl J Med 1997;337:571–2. 22. Fialkow PJ. Clonal origin of human tumors. Biochim Biophys Acta 1976;458:283–321. 23. Fialkow PJ. Primordial cell pool size and lineage relationships of five human cell types. Ann Hum Genet 1973;37:39–48. 24. Findlay I, Matthews P, Quirke P. Multiple genetic diagnoses from
PCR-BASED TECHNIQUES FOR CLONALITY ANALYSIS OF NEOPLASTIC PROGRESSION
25. 26. 27. 28. 29.
30. 31. 32. 33. 34. 35. 36. 37. 38.
39. 40.
41. 42.
43.
single cells using multiplex PCR: reliability and allele dropout. Prenat Diagn 1998;18:1413–21. Gaffey MJ, Iezzoni JC, Weiss LM. Clonal analysis of focal nodular hyperplasia of the liver. Am J Pathol 1996;148:1089–96. Gilliland DG, Blanchard KL, Levy J, Perrin S, Bunn HF. Clonality in myeloproliferative disorders: analysis by means of the polymerase chain reaction. Proc Natl Acad Sci U S A 1991;88:6848–52. Housman DE. DNA on trial—the molecular basis of DNA fingerprinting. N Engl J Med 1995;332:534–5. Hugel A, Wernert N. Loss of heterozygosity (LOH), malignancy grade and clonality in microdissected prostate cancer. Br J Cancer 1999;79:551–7. Jenkins RB, Qian J, Lieber MM, Bostwick DG. Detection of c-myc oncogene amplification and chromosomal anomalies in metastatic prostatic carcinoma by fluorescence in situ hybridization. Cancer Res 1997;57:524–31. Jones PA, Droller MJ. Pathways of development and progression in bladder cancer: new correlations between clinical observations and molecular mechanisms. Semin Urol 1993;11:177–92. Kappler JW. The 5-methylcytosine content of DNA: tissue specificity. J Cell Physiol 1971;78:33–6. Knudson AG. Antioncogenes and human cancer. Proc Natl Acad Sci U S A 1993;90:10914–21. Knudsen AG Jr. Mutation and cancer: statistical study of retinoblastoma. Proc Natl Acad Sci U S A 1971;68:820–3. Knudsen AG Jr, Hethcote HW, Brown BW. Mutation and childhood cancer: a probabilistic model for the incidence of retinoblastoma. Proc Natl Acad Sci U S A 1975;72:5116–20. Koch WM, Brennan JA, Zahurak M, et al. p53 Mutation and locoregional treatment failure in head and neck squamous cell carcinoma. J Natl Cancer Inst 1996;88:1580–6. Koreth J, O’Leary JJ, McGee JOD. Microsatellites and PCR genomic analysis. J Pathol 1996;178:239–48. Laird PW, Jaenisch R. DNA methylation and cancer. Hum Mol Genet 1994;3:1487–95. Lau DH, Yang B, Hu R, Benfield JR. Clonal origin of multiple lung cancers: K-ras and p53 mutations determined by nonradioisotopic single-strand conformation polymorphism analysis. Diagn Mol Pathol 1997;6:179–84. Lewis SM, Wu GE. The origin of V(D)J recombination. Cell 1997; 88:159–62. Long AA, Komminoth P, Lee E, Wolfe HJ. Comparison of indirect and direct in-situ polymerase chain reaction in cell preparations and tissue sections. Detection of viral DNA, gene rearrangements and chromosomal translocations. Histochemistry 1993;99:151–62. Lyon MF. Some milestones in the history of X-chromosome inactivation. Annu Rev Genet 1992;26:16–28. Magewu AN, Jones PA. Ubiquitous and tenacious methylation of the CpG site in codon 248 of the p53 gene may explain its frequent appearance as a mutational hot spot in human cancer. Mol Cell Biol 1994;14:4225–32. Mutter GL, Boynton KA. X chromosome inactivation in the nor-
44. 45. 46.
47. 48.
49.
50. 51. 52.
53.
54.
55.
56.
57.
58. 59. 60.
33
mal female genital tract: implications for identification of neoplasia. Cancer Res 1995;55:5080–4. Nowell PC. The clonal evolution of tumor cell populations. Science 1976;194:23–8. Perren A, Roth J, Muletta–Feurer S, et al. Clonal analysis of sporadic pancreatic endocrine tumours. J Pathol 1998;186:363–71. Quade BJ, McLachlin CM, Soto–Wright V, Zuckerman J, Mutter GL, Morton CC. Disseminated peritoneal leiomyomatosis. Clonality analysis by X chromosome inactivation and cytogenetics of a clinically benign smooth muscle proliferation. Am J Pathol 1997; 150:2153–66. Rabkin CS, Janz S, Lash A, et al. Monoclonal origin of multicentric Kaposi’s sarcoma lesions. N Engl J Med 1997;336:988–93. Randerson J, Cawkwell L, Jack A, et al. Fluorescent polymerase chain reaction of a panel of CA repeats on chromosome 6 in the indolent phase of follicular centre cell lymphoma. Br J Cancer 1996;74:942–6. Ray PF, Handyside AH. Increasing the denaturation temperature during the first cycles of amplification reduces allele dropout from single cells for preimplantation genetic diagnosis. Mol Hum Reprod 1996;2:213–18. Rosenthal N. Molecular medicine. Recognizing DNA. N Engl J Med 1995;333:925–7. Sager R. Tumor suppressor genes: the puzzle and the promise. Science 1989;246:1406–12. Shibata D, Schaeffer J, Li ZH, Capella G, Perucho M. Genetic heterogeneity of the c-K-ras locus in colorectal adenomas but not in adenocarcinomas. J Natl Cancer Inst 1993;85:1058–63. Sidransky D, Frost P, Von Eschenbach A, Oyasu R, Preisinger AC, Vogelstein B. Clonal origin bladder cancer. N Engl J Med 1992; 326:737–40. Sinnock KL, Perez–Atayde AR, Boynton KA, Mutter GL. Clonal analysis of sacrococcygeal “teratomas.” Pediatr Pathol Lab Med 1996;16:865–75. Sleddens HF, Oostra BA, Brinkmann AO, Trapman J. Trinucleotide (GGN) repeat polymorphism in the human androgen receptor (AR) gene. Hum Mol Genet 1993;2:493. Sleddens HF, Oostra BA, Brinkmann AO, Trapman J. Trinucleotide repeat polymorphism in the androgen receptor gene (AR). Nucl Acid Res 1992;20:1427. Vogelstein B, Fearon ER, Hamilton SR, et al. Genetic alterations during colorectal-tumor development. N Engl J Med 1988;319: 525–32. Vogelstein B, Fearon ER, Kern SE, et al. Allelotype of colorectal carcinomas. Science 1989;244:207–11. Wolman SR, Heppner GH. Genetic heterogeneity in breast cancer. J Natl Cancer Inst 1992;84:469–70. Zhuang Z, Lininger RA, Man YG, Albuquerque A, Merino MJ, Tavassoli FA. Identical clonality of both components of mammary carcinosarcoma with differential loss of heterozygosity. Mod Pathol 1997;10:354–62.
Diagn Mol Pathol, Vol. 10, No. 1, 2001
American Journal of Pathology, Vol. 162, No. 1, January 2003 Copyright © American Society for Investigative Pathology
Correspondence Clonal Origin and Expansions in Neoplasms: Biologic and Technical Aspects Must Be Considered Together
To the Editor-in-Chief: Microsatellite-based clonality assays include the analysis of X-chromosome inactivation (XCI) and loss of heterozygosity (LOH) of tumor suppressor genes, and have been rarely applied to differentiate clonal origin from clonal expansion in neoplasms. The key elements for that distinction are: tumor natural history with particular attention to the relative timing between test conversion and clonal expansion, the lesion cell kinetic, and sample conditions. Studies based on allele ratio of genes involved in the transformation pathway must validate technique conditions to obtain reliable quantification methods able to detect clonal growths. These aspects are relevant and, probably due to space restrictions, have not been considered in detail in a recent paper on the clonality of in-transit melanoma metastasis.1 Although clonality is considered the hallmark of neoplasms, the distinction between clonal origin and clonal expansion in tumors remains controversial. A priori, a monoclonal proliferation is assumed to be neoplastic, whereas a polyclonal lesion is thought to be reactive. However, there are many exceptions to this rule. Additionally, there is no consensus on the application of clonality markers. Clonality analysis has been used to test malignant transformation and tumor progression,2,3 but the results must always be interpreted in view of the natural history of the neoplasm. The relationship between the molecular marker and the pathway of neoplastic transformation is essential, in particular, the relative timing between the positive conversion of the marker and the clonal expansion. Clonality results will support a clonal origin only if the clonal expansion occurs after the positive conversion (Figure 1). Positive conversions taking place after the clonal expansion will result in heterogeneous marker patterns, which do not support clonal origin.4 This is a key element for studies based on the analysis of tumor suppressor genes, especially if reduced number of cells (microdissected samples) are used. Transformed cells result in neoplasms if genetically damaged cells are able to expand clonally. In contrast, extensive genetic damage triggering cell apoptosis will not result in neoplasms. Therefore, it is artificial to separate the analysis of tumor clonality and cell kinetic (proliferation/apoptosis), as demonstrated by the close relationship between them in benign adrenal cortical proliferative lesions.5 Expanding clones would also sug-
gest that somatic genetic alterations contribute to the kinetic advantage of those cells, which eventually outnumber other cells and result in monoclonal patterns. In that sense, clonality would be the by-product of tumor cell selection, especially for advanced neoplasms, and one of the first alterations in early neoplasms as well (Figure 1). These situations are highlighted by LOH analysis of tumor suppressor genes (advanced neoplasms) and XCI assays (early neoplasms). This combined analysis of clonality and cell kinetics better defines the evolution and progression of neoplasms.2,3,5– 8 LOH analysis of tumor suppressor genes in a given tumor will inform on clonal origin only if concordant patterns with several genetic markers are demonstrated.4,8,9 The interpretation must consider that true monoclonal lesions retain the constitutional heterozygosity before the conversion point and that tumor heterogeneity and progressive cell selection can result in discordant microsatellite patterns in samples from different areas within a single tumor (intratumoral heterogeneity).6,10,11 If the genetic abnormalities determine a kinetic advantage, tumor cells revealing LOH will overgrow and become the predominant genotype (clonal expansion, Figure 1). Among sample conditions, the size is the most important limiting factor leading to misinterpretations due to tumor heterogeneity.3,7 Microdissection techniques allow very selective and homogeneous cell samples, but the sampling might not be representative of the tumor. Firstly, small cell groups descended from a common progenitor may grow together like a clone (patch size concept), which can explain monoclonal patterns in small-sized samples. Secondly, sample cells must be representative of tumor features (eg, kinetic and invasive capacities). If clonality is not evaluated in the proper biological context, the results might be confusing or have unknown clinical meaning. A typical example of this situation is microheterogeneity in tumors that tend to give disparate results whose meaning remains unknown. Only multiple samplings of enough size (⬃100 cells) from different tumor areas and running tests in duplicate can avoid this problem; this protocol should be systematically done before accepting the results as relevant. The intratumoral heterogeneity and the heterogeneous cell composition of solid tumors make the quantitative determination of the allele ratio (proportion of each allele in samples normalized by the corresponding control tissue) an absolute requirement to prove any clonal origin or expansion. Allele ratios greater than 3:1 or 4:1 in normalized samples are considered evidence of monoclonal proliferation.3– 8,12 This thresh-
353
354 Correspondence AJP January 2003, Vol. 162, No. 1
Salvador J. Diaz-Cano Barts and the London School of Medicine and Dentistry London, United Kingdom
References
Figure 1. Cell kinetics and genetic changes during the clonal evolution of neoplasms. The first genetic abnormality during the neoplastic transformation is assumed to induce a clonal proliferation, the hallmark of neoplasms (bottom, left-hand bar). However, any other genetic changes will detect the lesion after the marker conversion only (eg, microsatellite instability or LOH, X2 in the diagram). Tumor tissue heterogeneity complicates the detection because results supportive of monoclonal proliferation (right cell field) will be obtained only if the abnormal cells (dark nuclei) are prevalent in the sample (gray cytoplasm). The expansion of genetically damaged cells (clone selection) is always due to disbalanced kinetic (1 proliferation and/or 2 apoptosis).
old means concordant allele patterns for a given marker in 75% to 80% of the sample cells. However, reliable results require keeping linearity of the allele ratio between the amplified product and the target DNA of the sample. For that purpose, technical aspects of the PCR amplification are essential. The reaction should be maintained in the exponential phase avoiding the plateau (product saturation) and the amount of tissue in control and test samples should be similar, thus correcting biased patterns due to artifacts induced by small target concentrations in tumor samples only.3 In addition, microdissected samples normally show a high incidence of PCR artifacts due to the small concentration of target DNA, fixation-induced changes of DNA, and conditions in the amplification of repetitive sequence (especially for those CG-rich sequences) favoring misannealing and hairpin formation.13 Appropriate modifications must be established to avoid these problems, thus improving the reproducibility of LOH and MSI test in microdissected samples. In conclusion, a proper interpretation of clonality tests requires a combined knowledge of the tumor natural history and technical aspects. Using the spectrum of clonality tests available, a reliable distinction of clonal origin/expansion can be made considering the relative timing between test conversion and clonal expansion, the lesion cell kinetic, sample conditions, and the conditions for the allele ratio determination.
Lucia Pozo-Garcia Homerton University Hospital London, United Kingdom
1. Nakayama T, Taback B, Turner R, Morton DL, Hoon DS: Molecular clonality of in-transit melanoma metastasis. Am J Pathol 2001, 158: 1371–1378 2. Diaz-Cano SJ: Clonality studies in the analysis of adrenal medullary proliferations: application principles and limitations. Endocr Pathol 1998, 9:301–316 3. Diaz-Cano SJ, Blanes A, Wolfe HJ: PCR techniques for clonality assays. Diagn Mol Pathol 2001, 10:24 –33 4. Diaz-Cano SJ, de Miguel M, Blanes A, Tashjian R, Wolfe HJ: Germline RET 634 mutation positive Men 2A-related C-cell hyperplasias have genetic features consistent with intraepithelial neoplasia. J Clin Endocrinol Metab 2001, 86:3948 –3957 5. Diaz-Cano SJ, de Miguel M, Blanes A, Tashjian R, Galera H, Wolfe HJ: Clonality as expression of distinct cell kinetics patterns in nodular hyperplasias and adenomas of the adrenal cortex. Am J Pathol 2000, 156:311–319 6. Diaz-Cano SJ, Blanes A, Rubio J, Matilla A, Wolfe HJ: Molecular evolution and intratumor heterogeneity by topographic compartments in muscle-invasive transitional cell carcinoma of the urinary bladder. Lab Invest 2000, 80:279 –289 7. Diaz-Cano SJ: Designing a molecular analysis of clonality in tumors. J Pathol 2000, 191:343–344 8. Diaz-Cano SJ, de Miguel M, Blanes A, Tashjian R, Galera H, Wolfe HJ: Clonal patterns in phaechromocytomas and MEN-2A adrenal medullary hyperplasias: histologic and kinetic correlates. J Pathol 2000, 192:221–228 9. Zhuang Z, Lininger RA, Man YG, Albuquerque A, Merino MJ, Tavassoli FA: Identical clonality of both components of mammary carcinosarcoma with differential loss of heterozygosity. Mod Pathol 1997, 10:354 –362 10. Diaz-Cano SJ, Blanes A: Influence of intratumor heterogeneity in the interpretation of marker results in pheochromocytomas. J Pathol 1999, 189:627– 628 11. Blanes A, Rubio J, Martinez A, Wolfe HJ, Diaz-Cano SJ: Kinetic profiles by topographic compartments in muscle-invasive transitional cell carcinomas of the bladder: role of TP53 and NF1 genes. Am J Clin Pathol 2002, 118:93–100 12. Mutter GL, Boynton KA: X chromosome inactivation in the normal female genital tract: implications for identification of neoplasia. Cancer Res 1995, 55:5080 –5084 13. Diaz-Cano SJ: Are PCR artifacts in microdissected samples preventable? Hum Pathol 2001, 32:1415
Authors’ Reply: We appreciate the comments from the authors’ letter and would like to respond by stating that the general purpose of this manuscript was to evaluate the genetic heterogeneity among in-transit melanoma metastasis assessing microsatellites with loss of heterozygosity (LOH), an established methodology.1 In-transit melanoma is a rare phenomenon often occurring after removal of a primary tumor cutaneous melanoma tumor. This disease manifestation is clinically evident from where the site of origin existed as opposed to head and neck cancers where the primary may be unknown or Barrett’s esophagus where LOH has been used for clonal origin and delimiting field cancerization with clonal expansion.2– 4 Thus, our intent was to assess those LOH events associated with intransit metastasis with further interest to determine
Correspondence 355 AJP January 2003, Vol. 162, No. 1
whether a pattern of heterogeneity existed for the panel of markers assessed. Furthermore, intratumoral heterogeneity and congruity with the primary tumor was evaluated for concordance. Multiple polymorphic microsatellite markers were chosen for their informativity and frequency in melanoma tumors. In addition, many tumors were assessed to allow for sufficient number of LOH events to occur to avoid a conclusion of homogeneity based on retention alone or heterogeneity due to nonlinear random occurrences.5 To further determine whether results were consistent, intratumor heterogeneity was assessed. However, to avoid false monoclonality interpretation due to inadequate sampling from “patch size” clones, three separate regions were chosen which were widely spaced and randomly selected.6 Additionally, a large enough sample was microdissected from each specimen to ensure a sufficient number of cells and DNA quantitated for conformity. Finally, primary tumor blocks were assessed in a similar fashion to confirm the findings with concordant patterns of the genetic markers assessed. The fact that consistency was demonstrated through all three aspects of the investigation confirms the reliability of the methodology in this study and leaves little doubt that these results occurred randomly for this specific disease entity. We agree that good laboratory practice under rigorous standard operating procedures must be strictly adhered to for any laboratory that is assessing LOH. Optimal sample conditions and repetitive assessments should be routine for accurately assessing allelic imbalances (AI). As the biology and relevance of these AI is still developing, optimal standardization has not been consistent in the literature. Assessment for clonality in tumor specimens using assays previously reported as the authors suggest does have limitations in interpretation. With regard to assessing molecular markers in relation to a tumor’s natural history, all of the lesions were of the in-transit type, which is a unique model for this field of investigation. However, an inherent problem with any study evaluating patients’ tumors is the inability to collect all specimens at identical time points in the disease progression spectrum. The accumulation of genetic alterations is a continuum for each individual tumor cell and thus one can never obtain sufficient number of specimens all at the same time point during neoplastic transformation and progression to make an absolute conclusion with certainty. We recognize the authors’ concern regarding timing between test conversion and clonal expansion as well as lesion cell kinetics but this method provides the most clinically relevant approach for evaluating the unique pathology and biology of in-transit melanoma disease. In-transit recurrence is consistent with dormant tumor cell clones from the primary tumor trapped in intervening lymphatics and our findings provide a genetic association for this clinical experience. Bret Taback Dave S.B. Hoon John Wayne Cancer Institute Santa Monica, California
References 1. Califano J, Leong PL, Koch WM, Eisenberger CF, Sidransky D, Westra WH: Second esophageal tumors in patients with head and neck squamous cell carcinoma: an assessment of clonal relationships. Clin Cancer Res 1999, 5:1862–1867 2. Galipeau PC, Prevo LJ, Sanchez CA, Longton GM, Reid BJ: Clonal expansion and loss of heterozygosity at chromosomes 9p and 17p in premalignant esophageal (Barrett’s) tissue. J Natl Cancer Inst 1999, 91:2087–2095 3. Wong DJ, Paulson TG, Prevo LJ, Galipeau PC, Longton G, Blount PL, Reid BJ: p16(INK4a) lesions are common, early abnormalities that undergo clonal expansion in Barrett’s metaplastic epithelium. Cancer Res 2001, 61:8284 – 8289 4. Califano J, Westra WH, Koch W, Meininger G, Reed A, Yip L, Boyle JO, Lonardo F, Sidransky D: Unknown primary head and neck squamous cell carcinoma: molecular identification of the site of origin. J Natl Cancer Inst 1999, 91:599 – 604 5. Barrett MT, Sanchez CA, Prevo LJ, Wong DJ, Galipeau PC, Paulson TG, Rabinovitch PS, Reid BJ: Evolution of neoplastic cell lineages in Barrett esophagus. Nat Genet 1999, 22:106 –109 6. Diaz-Cano SJ, Blanes A, Wolfe HJ: PCR techniques for clonality assays. Diagn Mol Pathol 2001, 10:24 –33
Interleukin-3 Receptors in Hodgkin’s Disease
To the Editor-in-Chief: Growing evidence suggests that deregulated apoptosis is a frequent occurrence in a variety of human malignancies.1 The tumor cells in classical Hodgkin’s disease (HD), historically named Hodgkin and Reed-Sternberg (HRS) cells, derive from germinal center B cells and often contain “crippling” somatic mutations within rearranged immunoglobulin (Ig) heavy chain genes.2 Because such “crippling” mutations trigger apoptosis in germinal center B cells, their detection in HRS tumor cells indicate the presence of survival factors other than surface Ig. In the February 2002 issue of The American Journal of Pathology, Aldinucci et al3 reported on the expression of interleukin-3 receptors (IL-3R) in HRS cells. As the authors pointed out correctly, it is quite surprising that IL-3R expression has not yet been investigated in the context of HD because of the ligand for this receptor, IL-3, also called multicolony-stimulating factor, is probably one of the least restricted growth factors, exerting its effects on hemopoietic stem cells and progenitors of numerous lineages,4 including the lymphoid lineage, as shown by in vitro differentiation of IL-3-dependent B-cell precursors into mature B cells.5 In addition to describing IL-3R expression in HRS cells, Aldinucci et al3 examined a number of HD-derived cell lines to address the functionality of these receptors. Among the HD cell lines tested, IL-3R expression levels showed a remarkable variability. However, the increased growth rates of cultured HD cells on stimulation with IL-3 did not strictly reflect the differences in IL-3R expression. The fact that L1236 cells, which express low levels of IL-3R, had a stronger response than any other HD cell line to exogenous IL-3, should remind us to interpret data obtained from cultured HD cells with great caution. The relatively minor growth response of the
CORRESPONDENCE
CORRESPONDENCE Are PCR Artifacts in Microdissected Samples Preventable? To the Editor:—In many instances, molecular results are determined by technical conditions and need validation. Loss of heterozygosity (LOH) and microsatellite instability (MSI) analyses share these limitations too, but only a few articles directly study the technical aspects of molecular tests. Sieben et al address technical issues of LOH and MSI analysis using small amounts of DNA (microdissected tumor samples).1 The study design is appropriate for the objectives, but the technique implications are quite extensive and a broader discussion on biological and technical aspects would help both interpreting and applying those analyses. The authors clearly show the inverse relationship between the concentration of the target DNA and the presence of test artifacts, but can those artifacts be explained by the DNA concentration only? If that is the case, are the molecular results based on single-cell analysis believable? Some thoughts trying to answer these questions are provided. The identification of extrabands in the amplification product from a polymorphic DNA region will be considered evidence of MSI if they are not present in the corresponding control.2-5 To avoid misinterpretations, the amount of tissue in control and test samples should be similar, thus correcting biased patterns caused by artifacts induced by small target concentrations in tumor samples only.5 Those additional bands must be carefully distinguished from polymerase chain reaction (PCR) artifacts and different options must be investigated and systematically excluded: 1. Target DNA modifications induced by fixation and processing in paraffin-embedded tissues. The fixation process involves multiple cross-links between amino-groups of nucleic acid bases and polypeptide aminoacids to preserve tissue morphology.6 A side effect of the tissue processing is a variable nucleic acid fragmentation and denaturation that result in the typical smear pattern of DNA extracted from paraffin-embedded tissues. The covalent links between different DNA fragments will determine the presence of single-stranded sequences with 3⬘-OH free that can act as primers during the polymerization step of PCR, the so-called primer-independent DNA amplification.6 A prolonged protein digestion in the appropriate conditions during the DNA extraction significantly reduces the number of crosslinks, thus resulting in better definition of the amplification product. 2. The repetitive sequence would result in a higher incidence of primer misannealing and hairpin formation. These possibilities can be avoided setting a long denaturation in the first few cycles when the template DNA is mainly genomic and including 7-deaza-2⬘-dGTP in the reaction mixture if the target is a CG-rich sequence. This nucleotide substitution during amplification reduces stability of intramolecular and intermolecular GC base pairing and avoids biased target amplification.7 These 2 technical modifications favor proper annealing and amplification of the specific target.7-9 3. The amplification conditions can also determine the
specificity of the reaction. Both nucleotide concentration and the labeling methods have been reported limiting factors.2,5 The probability of getting additional bands decreases when nucleotide concentration is reduced and an external labeling method (only one primer labeled) is used. The presence of minute DNA amount in the reaction mixture results in more frequent PCR artifacts, especially if the target DNA is fragmented. In microsatellite analysis, Sieben et al report a significant increase of these PCR artifacts when the amount of target DNA is lower than 5 ng (DNA isolated from frozen tissues) or 10 ng (DNA isolated from formalin-fixed, paraffin-embedded tissues).1 Considering the DNA amount per cell (⬃7 pg), the limiting DNA amount would represent between ⬃700 cell equivalents (frozen tissues) and ⬃1,400 cell equivalents (formalin-fixed, paraffinembedded tissues). This issue is extremely important for microdissected samples because they normally contain less DNA. However, the relative incidence of these artifacts can be controlled by applying the previously described principles, which bypass the most frequent causes of these artifacts. This also emphasizes the importance of careful method design to obtain reliable results in molecular analyses. The high incidence of PCR artifacts using microdissected samples is related to the small concentration of target DNA, fixation-induced changes of DNA, and conditions in the amplification of repetitive sequence (especially for those CG-rich sequences) favoring misannealing and hairpin formation. Appropriate modifications to avoid the previously mentioned conditions will significantly improve the reproducibility of LOH and MSI test in microdissected samples.
SALVADOR J. DIAZ-CANO, MD, PHD Department of Histopathology Bart’s and The London Queen Mary’s School of Medicine and Dentistry University of London London, England 1. Sieben NL, ter Haar NT, Cornelisse CJ, et al: PCR artifacts in LOH and MSI analysis of microdissected tumor cells. HUM PATHOL 31:1414-1419, 2000 2. Koreth J, O’Leary JJ, McGee JOD: Microsatellites and PCR genomic analysis. J Pathol 178:239-248, 1996 3. Diaz-Cano SJ, Blanes A, Rubio J, et al: Molecular evolution and intratumor heterogeneity by topographic compartments in muscle-invasive transitional cell carcinoma of the urinary bladder. Lab Invest 80:279-289, 2000 4. Diaz-Cano SJ: Designing a molecular analysis of clonality in tumours. J Pathol 191:343-344, 2000 5. Diaz-Cano SJ, Blanes A, Wolfe HJ: PCR techniques for clonality assays. Diagn Mol Pathol 10:24-33, 2001 6. Diaz-Cano SJ, Brady SP: DNA extraction from formalin-fixed, paraffinembedded tissues: Protein digestion as a limiting step for retrieval of highquality DNA. Diagn Mol Pathol 6:342-346, 1997 7. Mutter GL, Boynton KA: PCR bias in amplification of androgen receptor alleles, a trinucleotide repeat marker used in clonality studies. Nucleic Acids Res 23:1411-1418, 1995 8. Diaz-Cano SJ, de Miguel M, Blanes A, et al: Clonality as expression of distinctive cell kinetics patterns in nodular hyperplasias and adenomas of the adrenal cortex. Am J Pathol 156:311-319, 2000 9. Diaz-Cano SJ, de Miguel M, Blanes A, et al: Clonal patterns in phaechromocytomas and MEN-2A adrenal medullary hyperplasias: Histologic and kinetic correlates. J Pathol 192:221-228, 2000
1415
doi:10.1053/hupa.2001.29632
HUMAN PATHOLOGY
Volume 32, No. 12 (December 2001)
Reply To the Editor:—We would like to thank Dr Diaz-Cano for his comments on our recent article describing polymerase chain reaction (PCR) artifacts in loss of heterozygosity (LOH) and microsatellite instability (MSI) analysis of microdissected tumor cells. It is becoming increasingly apparent that significant problems may be encountered during attempts to unambiguously reproduce LOH and MSI data based on DNA obtained from microdissected tumor tissue. Although more than one factor may play a role, the concentrations of template DNA used are seldom accurately quantitated and may vary greatly between the individual tumor samples and corresponding normal tissue. To identify the necessary parameters for facilitating reliable PCR-based analyses, we performed PCR with increasing dilutions of template DNA in nearly 1,000 PCR reactions. By doing so, we showed a significant association between the concentration input DNA used and the percentage of artifactual LOH or MSI observed. Based on this study, a minimum of 5.0 ng for fresh frozen tissue and 10.0 ng for formalin-fixed, paraffin-embedded tissue is set for reliable PCR analysis under our experimental conditions. We agree with Dr Diaz-Cano that other factors such as tissue-fixation method and processing influences DNA quality and thus optimal PCR amplification. For example, tissue fixation in ethanol is less deleterious for DNA than formalin and less input DNA is necessary to obtain reproducible results. We can fully subscribe the importance of optimal test conditions in microsatellite analysis, one of which should be DNA quantification and input standardization, and we do not seem to deviate from Dr Diaz-Cano’s conclusions.
NATHALIE L. SIEBEN, MD ANNE-MARIE CLETON-JANSEN, PHD Department of Pathology Leiden University Medical Center Leiden, The Netherlands
There is nothing in the article by Matias-Guiu, nor in the editorial, that would support any theories other than that genetic mutations occur and occur sequentially with time. The functional change brought about by any given alteration in DNA is speculative at best, when considering invasion and metastasis. That such genetic events lead to a change in the cell’s ability to divide or not to divide seems to be an acceptable conclusion from what is known of cell division mechanisms. However, to conclude that genetic events are responsible for invasion and metastasis is premature.3 Elsewhere,3 I have reintroduced an old concept that will account for invasion and distant transport of tumors invoking only the normal physiologic and mechanical processes of traumatic separation of tumor cells from anchoring neighbors, traumatic disruption of basement membrane material, lymphatic flow dynamics, and the anatomic introduction of lymph-containing tumor cells and debris into the venous system to widely disseminate tumor cells throughout the body. The mechanism of establishing a stable and/or growing metastasis may as likely reside in the host defenses as in the tumor cell’s DNA. Increasing numbers of genetic alterations may be important to increasing cell division and decreasing cell destruction (apoptosis), but there is no inherent biologic necessity to invoke genetic events into the invasion and metastasis process.
ROBERT J. ROSSER, MD Pathology Department Desert Regional Medical Center Palm Springs, CA 1. Matias-Guiu X, Catasus L, Bussaglia E, et al: Molecular pathology of endometrial hyperplasia and carcinoma. HUM PATHOL 32:569-577, 2001 2. Foster CS, Gorstein F: Molecular basis of disease processes. HUM PATHOL 32:567-568, 2001 (editorial) 3. Rosser RJ: A point of view: Trauma is the cause of occult micrometastatic breast cancer in sentinel axillary lymph nodes. The Breast Journal 6:209212, 2000
doi:10.1053/hupa.2001.29633 doi:10.1053/hupa.2001.29636
Tumor Invasion and Metastasis—Nature or Nurture? 1
Reply
To the Editor:—In the article by Matias-Guiu, it is stated that “Once the tumor has developed, several additional molecular abnormalities occur in different neoplastic subclones; these new alterations are responsible for tumor heterogeneity, tumor invasion, and metastasis.” In the accompanying editorial,2 it is stated that “Tumorigenesis is conceived as involving a stepwise accumulation of genetic damage within a cell that ultimately undergoes malignant transformation and, in time, the proliferation of clones having such phenotypic properties as drug- or hormone-resistance, invasion, or metastasis.” Also in the editorial it is stated that “Additional molecular changes occurring in different neoplastic subclones are responsible for the clinically apparent phenotypes of tumor invasion and metastasis.” Strongly implied but without proof is that some genetic alteration(s) transforms a dividing cell into a cell that can detach itself from its neighboring tumor cells, travel from one location to another, and enter into veins and/or lymphatics (invasion). Further, the genetic alteration(s) of the dividing cell transforms the cell into one that can now find nourishment, continue to divide, and avoid being destroyed by the body’s immune defenses (metastasis) at some distant location.
To the Editor:—We would like to express our appreciation to Dr Robert J Rosser for his interest in our review article, “Molecular Pathology of Endometrial Hyperplasia and Carcinoma.” There is a large body of evidence in the medical literature suggesting that some genetic alterations are associated with the development and progression of human carcinomas. Our article summarizes the results obtained by several authors, including ourselves, in understanding the role of certain genetic abnormalities in the appropriate morphologic context. Likewise, it is understood that the process of tumor progression includes many other aspects such as host response and functional disruption of the relation between epithelial cells and their environment.
1416
XAVIER MATIAS-GUIU, MD JAIME PRAT, MD, FRCPATH Department of Pathology Hospital de la Santa Creu i Sant Pau Barcelona, Spain
doi:10.1053/hupa.2001.29637
CORRESPONDENCE
Editors’ Reply The editorial that accompanied the article by MatiusGuiu et al1 in the June issue of HUMAN PATHOLOGY was written to challenge several currently held concepts and to highlight a series of issues presently being raised by a wide range of different molecular biological studies. Intentionally, the editorial was not restricted to a consideration of only those concepts that were raised in the article concerning the molecular pathology of endometrial hyperplasia and carcinoma. It is both unfortunate and unintentional if there was any apparent ambiguity in the content of the editorial such that it seemed to imply that specific genetic alterations are required to transform a cell into one that can become metastatic, as indicated in the accompanying letter by Dr Rosser. If there has been such an implication or interpretation, then we apologize that the sense of the editorial was not conveyed with greater clarity. Rather than being at variance, we agree with Dr Rosser that there is no evidence for the existence of specific metastasis genes or for specific genetic alterations that might be construed as metastasis genes. Although current evidence points to the initiation of neoplasia involving specific genetic events, the same is not true of the metastatic process. One difficulty now facing cancer researchers is the separation of those molecular and cellular events that are causal to the metastatic process from the myriad of epiphenomena that occur during the evolution and progression of each malignancy. Thus, we concur with Dr Rosser that neither the article by Matius-Guiu et al nor our editorial supports any theories other than the temporal occurrence of genetic mutations with tumor advancement. In his letter, Dr Rosser raises an important problem with respect to the biology of the metastatic process that may be addressed, in part, by consideration of events that occur in nonmalignant tissues. During embryogenesis and tissue morphogenesis, the phenotypic properties of cellular diversion, migration, and invasion are both common and are characteristic attributes of benign cells. Even during postembryonic maturation, some cell types (eg, interdigitating dendritic cells within the skin2 and normal B-lymphocyte subsets within the ileum and salivary glands3) undergo migration, differentiation, homing, and tissue invasion. These observations related to mesenchymal cells within the reticuloendothelial system might be considered to be intrinsically migratory. However, recent independent observations have shown that cells of adult hemopoietic origin can invade the human liver with the result that they repopulate the epithelial compartment, initially as hepatocytes.4 Further, migration and differentiation of these cells also result in the generation of cholangiocytes.5 With respect to epithelial malignancy, additional evidence is accumulating that several proteins essential to the metastatic
process are the normal products of nonmutated genes— but aberrently expressed or regulated by the metastatic cells. Amongst others that are now being described, these include the Ca⫹⫹-binding protein p9Ka,6 voltage-gated Na⫹ channels,7 C-FABP,8 and fascin,9 a molecule essential to the migration and differentiation of interdigitating dendritic cells within the skin. In contrast to oncogenic genes that are mutated and encode abnormal products, evidence currently accumulating suggests that metastasis-promoting genes are nonmutated and yield normal proteins. Furthermore, there is no evidence to indicate that activity of metastasis-promoting proteins are obligated to any of the mutational events that are characteristic of or accompany tumor progression. Elucidation of this relationship is likely to provide key information concerning the biological nature of the metastatic process.
CHRISTOPHER S. FOSTER, MD, PHD, FRCPATH Editor, European Editorial Office University of Liverpool Liverpool, England FRED GORSTEIN, MD Editor Thomas Jefferson University Philadelphia, PA 1. Matias-Guiu X, Catasus L, Bussaglia E, et al: Molecular pathology of endometrial hyperplasia and carcinoma. HUM PATHOL 32:569-577, 2001 2. Caux C, Ait-Yahia S, Chemin K, et al: Dendritic cell biology and regulation of dendritic cell trafficking by chemokines. Springer Semin Immunopathol 22:345-369, 2000 3. Woodruff JJ, Katz M, Lucas LE, et al: An in vitro model of lymphocyte homing II. Membrane and cytoplasmic events involved in lymphocyte adherence to specialized high-endothelial venules of lymph nodes. J Immunol 119: 1603-1610, 1977 4. Alison MR, Poulsom R, Jeffery R, et al: Hepatocytes from non-hepatic adult stem cells. Nature 406:257, 2000 5. Theise ND, Nimmakayalu M, Gardner R, et al: Liver from bone marrow in humans. Hepatology 32:11-16, 2000 6. Ke Y, Jing C, Barraclough R, et al: Elevated expression of calciumbinding protein p9Ka is associated with increasing malignant characteristics of rat prostate carcinoma cells. Int J Cancer 71:832-837, 1997 7. Smith P, Rhodes NP, Shortland AP, et al: Sodium channel protein expression enhabces the invasiveness of rat and human prostate cancer cells. FEBS Letters 423:19-24, 1998 8. Jing C, Beesley C, Foster CS, et al: Human cutaneous fatty acid-binding protein induces metastasis by up-regulating expression of vascular endothelial growth factor gene in rat RAMA 37 model cells. Cancer Res 61:4357-4364, 2001 9. Yamashiro S, Yamakita Y, Ono S, et al: Fascin, an actin-bundling protein, induces membrane protrusions and increases cell motility of epithelial cells. Mol Cell Biol 9:993-1006, 1998
1417
doi:10.1053/hupa.2001.29638
J. Pathol. 189: 627–629 (1999)
LETTERS TO THE EDITOR INFLUENCE OF INTRATUMOUR HETEROGENEITY IN THE INTERPRETATION OF MARKER RESULTS IN PHAEOCHROMOCYTOMAS In a recently published paper, Krijger et al.1 try to predict the clinical behaviour of a phaeochromocytomas (PCCs) on the basis of the immunoreactivity of three markers (p53, bcl-2, and c-erbB-2). They conclude that the co-expression of p53 and bcl-2 proteins may assist that prediction. Our own preliminary results2,3 mainly agree with theirs and point towards two interrelated biological issues: firstly, the clonal evolution of neoplasms and intratumour heterogeneity of markers; and secondly, the importance of apoptosis in tumour initiation and progression. The results of Krijger et al. and other previous findings indicate that several genes must be involved in PCC pathogenesis, regardless of the genetic background (sporadic or familial).4,5 Although the authors do not mention variability of the immunostaining, this must be assumed, because most PCCs are scored 1+ (10–50 per cent positive cells). These relatively low values must be associated with heterogeneous expression of the protein. Our preliminary results with p53 and pRB (both immuno-expression and the genetic evaluation of polymorphic DNA regions) support this point. Tumour cell selection will determine progression, cellular heterogeneity, and clonal expansion.6 Loss of heterozygosity (LOH) analyses have showed random and non-tumour-related DNA deletions in 4–20 per cent of normal tissues,7,8 confirming cellular heterogenity, which should be considered a limiting threshold in the interpretation of any tumour marker. Intratumour heterogeneity for a given marker can represent either the expression of selective tumour evolution, or a simple passive by-product of other mechanisms, such as genetic instability. In any case, the association of multiple genetic alterations would become statistically less probable as the number of molecular markers increased9 and would explain why the combination of p53 and bcl-2 was strongly correlated with malignant PCC.1 The mechanism of selection of cell clones would allow us to use genetic markers to define tumour progression,6 but these genetic changes are unpredictable and their heterogeneity precludes their extensive clinical use for diagnostic and prognostic purposes. This heterogeneity also calls for caution in evaluating markers of malignancy; they must be extensively screened and validated in order to avoid misinterpretations leading to false-positive and false-negative cases. The results of Krijger et al. also stress the importance of p53 in the pathogenesis of a subgroup of PCCs.1 Our own experimental results (manuscript in preparation) CCC 0022–3417/99/130627–03$17.50 Copyright 1999 John Wiley & Sons, Ltd.
support this point of view, based on the analysis of five polymorphic DNA regions (microsatellites) located on introns of four tumour suppressor genes (p53, RB1, WT1, and NF1). The comparative study of peripheral and internal tumour areas confirmed that there was an increased accumulation of genetic deletions in the peripheral tumour compartment, probably reflecting both tumour progression and multistep tumourigenesis (dtwo loci showed LOH). In addition, tumour cell selection is the expression of cellular kinetics. Any genetic alteration leading to cellular ageing, differentiation, or activation of the apoptotic pathway will be non-tumour productive.6 The presence of a given marker points to an extensive kinetic advantage provided by the marker itself, or linked to it; it also represents the basic mechanism of cell selection and tumour progression.10,11 In this framework, Krijger et al.1 report the expression of bcl-2 in malignant PCC. bcl-2-expressing cells would be protected from apoptosis, thus contributing to clonal expansion, and the absence of normal p53 would protect genetically damaged cells from apoptosis.12 The associated expression of abnormal p53 in malignant PCC would also maintain the proliferation of transformed cells.1 Krijger et al. clearly indicate the importance of p53 and bcl-2 in the pathogenesis of a subgroup of PCCs. However, the variability of marker expression and the potential relationship with kinetic features are also helpful in understanding the pathogenesis of PCC. S J. Dí-C1 A B2 Department of Histopathology and Morbid Anatomy, St Bartholomew’s and the Royal London School of Medicine and Dentistry, Whitechapel, London E1 1BB, U.K. 2 Department of Pathology, University Hospital, Campus Universitario Teatinos, s/n, 29071-Malaga, Spain 1
REFERENCES 1. Krijger RR, van der Harst E, van der Ham F, et al. Prognostic value of p53, bcl-2, and c-erbB-2 protein expression in phaeochromocytomas. J Pathol 1999; 188: 51–55. 2. Dı´az-Cano SJ, de Miguel M, Galera-Davidson H, Wolfe HJ. Are locally invasive pheochromocytomas biologically distinct from benign chromaffin neoplasms? Pathol Int 1996; 46 (Suppl 1): 223. 3. Dı´az-Cano SJ, Tashjian R, de Miguel M, et al. Distinctive clonal and histological patterns in locally invasive pheochromocytomas. Lab Invest 1997; 76: 153A. 4. Khosla S, Patel VM, Hay ID, et al. Loss of heterozygosity suggests multiple genetic alterations in pheochromocytomas and medullary thyroid carcinomas. J Clin Invest 1991; 87: 1691–1699. 5. Shin E, Fujita S, Takami K, et al. Deletion mapping of chromosome 1p and 22q in pheochromocytoma. Jpn J Cancer Res 1993; 84: 402–408.
628
LETTERS TO THE EDITOR
6. Dı´az-Cano SJ. Clonality studies in the analysis of the adrenal medullary proliferations: application principles and limitations. Endocr Pathol 1998; 9: 301–316. 7. Deng G, Lu Y, Zlotnikov G, Thor AD, Smith HS. Loss of heterozygosity in normal tissue adjacent to breast carcinomas. Science 1996; 274: 2057–2059. 8. Wolman SR, Heppner GH. Genetic heterogeneity in breast cancer. J Natl Cancer Inst 1992; 84: 469–470.
9. Smith HS. Stochastic model for interpreting the data on loss of heterozygosity in breast cancer. J Natl Cancer Inst 1990; 82: 793–794. 10. Nowell PC. The clonal evaluation of tumor cell populations. Science 1976; 194: 23–28. 11. Hellman S. Darwin’s clinical relevance. Cancer 1997; 79: 2275–2281. 12. Cordon-Cardo C. Mutations of cell cycle regulators. Biological and clinical implications for human neoplasia. Am J Pathol 1995; 147: 545–560.
AUTHORS’ REPLY We would like to thank Dr Dı´az-Cano and Dr Blanes for their comments on our paper,1 which they seem to use as an alibi for extensive reflections on tumour heterogeneity. Human tumours are frequently genetically heterogenous, as has recently been discussed in an excellent review article.2 The differential acquisition of genetic abnormalities will lead to the formation of tumour cell clones with selective growth advantage, which will determine tumour behaviour and thus patient prognosis. Research into the pathogenesis of several major cancer types has benefitted from the comparative analysis of lesions in various stages of development, which has led to the discovery of genetic abnormalities that are essential and/or specific for the development of particular tumours. As regards PCCs, however, precursor lesions have not (yet) been defined. Potentially, adrenal medullary hyperplasia may serve as some kind of precursor lesion, although the difference with PCC is only quantitative, not qualitative. As is the case in other human cancers, PCCs have (considerable) genetic heterogeneity. In previous work, we have shown that 4/27 (15 per cent) benign and 1/29 (3 per cent) malignant sporadic PCCs have somatic RET missense mutations, thus implying that there are other genes involved in the pathogenesis of PCCs.3 At present, we are addressing VHL somatic mutations in benign and malignant PCCs. In our paper, we reported on p53 and bcl-2 immunoreactivity. As Dı´az-Cano and Blanes noticed, the number of p53- and bcl-2-immunoreactive cells varied from one tumour to another, amounting to between 10
and 50 per cent of the tumour cells. The immunoreactive cells had a somewhat patchy distribution in several cases, which might be taken to reflect the presence of distinct cell clones. However, without microdissection and clonal anlaysis, this is entirely speculative. Dı´azCano and Blanes point out that potential markers for adverse tumour behaviour must be extensively evaluated and validated. Our agreement with this comment is manifest in the discussion, where we have explicitly stated the practical implications of our analysis. R R. K1, E H2, F H1, T S3, W N. M. D1, J-W K4, H A. B2, S W. J. L4 F T. B1 1 Department of Pathology, Erasmus University and University Hospital, Rotterdam, The Netherlands 2 Department of Surgery, Erasmus University and University Hospital, Rotterdam, The Netherlands 3 Department of Biostatistics, Erasmus University and University Hospital, Rotterdam, The Netherlands 4 Department of Internal Medicine, Erasmus University and University Hospital, Rotterdam, The Netherlands
REFERENCES 1. Krijger RR de, Harst E van der, et al. Prognostic value of p53 bcl-2, and c-erbB-2 protein expression in phaeochromocytomas. J Pathol 1999; 188: 51–55. 2. Lenguaer C, Kinzler KW, Vogelstein B. Genetic instabilities in human cancers. Nature 1998; 396: 643–649. 3. Harst E van der, Krijger RR de, Bruining HA, et al. Prognostic value of RET proto-onocogene point mutations in malignant and benign, sporadic pheochromocytomas. Int J Cancer 1998; 79: 537–540.
RE. SV40-LIKE DNA SEQUENCES IN PLEURAL MESOTHELIOMA, BRONCHOPULMONARY CARCINOMA AND NON-MALIGNANT PULMONARY DISEASE We read with interest the paper of Galateau-Salle et al. describing the presence of SV40 or SV40-like viral DNA in neoplastic, non-neoplastic mesothelium, and bronchial carcinoma.1 It is indeed a recognized phenomenon that some SV40 primer sets result in a higher percentage of positive PCR than others.2 Preliminary data suggest that PCR primers considered specific for SV40 would, under certain conditions, amplify what appeared to be host DNA sequences, Copyright 1999 John Wiley & Sons, Ltd.
indicating that PCR-based assays must be interpreted with caution and correlated with viral antigen expression.3 The authors used one monoclonal antibody, Pab 419 (Ab-1 Oncogene Science), to investigate the presence of viral SV40 antigens, as confirmation for their PCRbased assay. This antibody detects an epitope common for both the p94 large T- and the p21 small t-antigen. Its main applications have been described for immunoJ. Pathol. 189: 627–629 (1999)
NEJM -- Clonality in Kaposi's Sarcoma
HOME
|
04/14/2006 02:32 PM
SEARCH
|
CURRENT ISSUE
|
PAST ISSUES
|
COLLECTIONS
|
HELP
You are signed in as sjdiazcano at Subscriber level | Sign Out | Edit Your Information | CiteTrack Personal Alerts | Personal Archive
Previous
Volume 337:570-572
August 21, 1997
Number 8
Next
Clonality in Kaposi's Sarcoma To the Editor: Rabkin et al. (April 3 issue)1 studied multiple biopsy specimens from eight patients with Kaposi's sarcoma and claim that Kaposi's sarcoma begins as a clonal disease at some specific site, circulates in the blood, and implants itself at multiple sites in the skin to produce multicentric disease. The unbalanced methylation pattern at the androgen-receptor locus in Kaposi's sarcoma lesions provides the evidence for their view.
Return to Search Result
Add to Personal Archive Add to Citation Manager Notify a Friend E-mail When Cited
We are concerned about some of the authors' technical Related Article procedures. They do not provide results of amplification by the by Rabkin, C. S. polymerase chain reaction with androgen-receptor primers and Find Similar Articles PubMed Citation undigested DNA, to ensure that the observed pattern is truly due to allelic methylation. Moreover, the HpaII restriction digestion was performed with heat-denatured samples, in which incorrect re-annealing can lose the original HpaII site or generate additional sites. The use of proteinase inhibitors, such as phenyl methyl sulfonyl fluoride, after digestion with proteinase K can circumvent this problem. The authors do not give the age of the lesions before biopsy. Assuming that Kaposi's sarcoma begins as polyclonal disease that then evolves to a clonal disease, lesions that have been present for many months are more likely to have clonal patterns. We have studied tumor tissue from 11 women with Kaposi's sarcoma, all of whom were polymorphic for CAG repeats in exon 1 of the androgen receptor (Table 1). Tumor regions were microdissected and analyzed by a method similar to that of Rabkin et al. 1 In some cases more than one discrete tumor region from the biopsy specimen was assayed. Tumor-biopsy specimens from five of the women had evidence of clonality. Two women, http://content.nejm.org/cgi/content/full/337/8/570?andorexacttitle‌96&fmonth=Apr&sendit=GO&searchid=1&FIRSTINDEX=0&resourcetype=HWCIT
Page 1 of 6
NEJM -- Clonality in Kaposi's Sarcoma
04/14/2006 02:32 PM
from whom one and nine specimens were obtained, had evidence of more than one clone (Table 2). In two of the five women with clonal disease, there were areas of the tumor that were not clonal. We think that Kaposi's sarcoma is clonal in some cases but that independent clones may develop, either spontaneously or after undergoing a premalignant hyperplastic stage. To investigate these possibilities, a large study is needed in which the age of cutaneous lesions is carefully recorded and specimens obtained from visceral tumors are included. View this table: Table 1. Methylation Patterns of the Tumor-Biopsy Specimens [in this window] Studied. [in a new window]
View this table: Table 2. Two Patients with Discordance of the Methylated Allele, [in this window] Indicating the Presence of at Least Two Clones. [in a new window]
Parkash Gill, M.D. Yvonne Tsai, Ph.D. Adupa P. Rao, M.D. Peter Jones, Ph.D. University of Southern California School of Medicine Los Angeles, CA 90033
References 1 . Rabkin CS, Janz S, Lash A, et al. Monoclonal origin of multicentric Kaposi's sarcoma lesions. N Engl J Med 1997;336:988-993.[Abstract/Full Text]
To the Editor: Rabkin et al. readdress the topic of the clonal origin of neoplasms that frequently present as multiple lesions, such as Kaposi's sarcoma in patients with human immunodeficiency virus infection.1,2 This issue has been raised before with regard to other synchronic tumors, such as transitional-cell neoplasms 3 and head and neck cancers.4 Most of the information has been obtained by techniques that involve the random inactivation of one X chromosome in female subjects, as exemplified in the article by Rabkin et al. 1 This issue cannot be resolved in a straightforward fashion, especially by a technique in which each cell has only two possibilities for X-chromosome inactivation: inactivation of the X chromosome inherited from the father or of that http://content.nejm.org/cgi/content/full/337/8/570?andorexacttitle‌96&fmonth=Apr&sendit=GO&searchid=1&FIRSTINDEX=0&resourcetype=HWCIT
Page 2 of 6
NEJM -- Clonality in Kaposi's Sarcoma
04/14/2006 02:32 PM
inherited from the mother. The authors used a statistical analysis that showed the low likelihood that their findings would occur by chance. Their assumption of concordant patterns of allele methylation is correct with respect to cell窶田ell comparisons, but their findings are based on DNA extracted from many cells after the microdissection of tumor nodules. Under these circumstances, each tissue sample from a female subject with informative alleles can be polyclonal, monoclonal with preferential methylation of the larger allele, or monoclonal with the smaller allele predominating. Assuming that there is an equal probability of each of these three patterns, the likelihood of a concordant pattern would be 2/3n (where 2 is the number of alleles and n the number of tumors being compared); that is, 2/32 (or approximately 22 percent) for two tumors, 2/33 (approximately 7.4 percent) for three tumors, 2/34 (approximately 2.5 percent) for four tumors, and 2/35 (approximately 0.8 percent) for five tumors. Under these circumstances, the probability that different tumors from the same patient have a monoclonal origin is greater than the authors calculate. We suggest caution in the interpretation of these calculations because of the skewing of X-chromosome methylation in different tissues. Synchronic or metachronic tumors can be shown to be truly monoclonal (derived from the same clone) only if several molecular markers are concordant. An analysis of X-chromosome inactivation cannot distinguish metastatic tumors (arising from a single clone) from synchronic tumors arising from different clones but expressing the same inactivated X chromosome. The results obtained by analyzing a single molecular marker prove clonal expansion of a subgroup of tumor cells with proliferative advantages, but they do not prove actual clonality, especially when the assay is based on patterns of methylation that may be influenced by the functional status of the cell, tumor progression, or both.5 Salvador J. Diaz-Cano, M.D., Ph.D. Hubert J. Wolfe, M.D. New England Medical Center Hospitals Boston, MA 02111
References 1 . Rabkin CS, Janz S, Lash A, et al. Monoclonal origin of multicentric Kaposi's sarcoma lesions. N Engl J Med 1997;336:988-993.[Abstract/Full Text] 2 . Rabkin CS, Bedi G, Musaba E, et al. AIDS-related Kaposi's sarcoma is a monoclonal neoplasm. Clin Cancer Res 1995;1:257-260.[Abstract] 3 . Jones PA, Droller MJ. Pathways of development and progression in bladder cancer: new correlations between clinical observations and molecular mechanisms. Semin Urol 1993;11:177-192.[Medline] http://content.nejm.org/cgi/content/full/337/8/570?andorexacttitle窶ヲ96&fmonth=Apr&sendit=GO&searchid=1&FIRSTINDEX=0&resourcetype=HWCIT
Page 3 of 6
NEJM -- Clonality in Kaposi's Sarcoma
04/14/2006 02:32 PM
4 . Califano J, van der Riet P, Westra W, et al. Genetic progression model for head and neck cancer: implications for field cancerization. Cancer Res 1996;56:24882492.[Abstract] 5 . Laird PW, Jaenisch R. DNA methylation and cancer. Hum Mol Genet 1994;3:14871495.[Abstract]
The authors reply: To the Editor: Gill et al. report balanced methylation patterns in 26 of 40 microdissected specimens of Kaposi's sarcoma (65 percent). They correctly note that balanced methylation could reflect mixed clonality of tumor or stromal cells. However, only 4 of the 32 Kaposi's sarcoma tumors we studied (12 percent) had balanced methylation. Although the difference could be due to variation in the frequency of polyclonal disease, it could also be explained by varying degrees of success in obtaining sufficiently pure preparations of tumor cells. The two patients described by Gill et al. who had discordant methylated alleles could represent cases in which there are multiple primary lesions, but we found no discordance in a larger number of clonal samples. The technical issues they raise do not explain the discrepancy. We observed balanced HUMARA amplification with undigested tumor DNA and balanced HpaII restriction after inactivation of normal-skin DNA by heat. If multicentric Kaposi's sarcoma lesions evolve independently, we should also have seen cases in which there was discordance of the methylated allele. Our model of a circulating neoplastic progenitor is suggested by the statistical improbability that our results occurred by chance alone. Drs. Diaz-Cano and Wolfe correctly note that Kaposi's sarcoma tissue from a female subject with informative alleles can reveal either a polyclonal or a monoclonal pattern of HUMARA allele methylation. However, we had no basis for assigning relative probabilities to these alternatives in our statistical analysis. Instead, we calculated the conditional probability of concordant allelic methylation given a monoclonal pattern. We disagree with the writers' interpretation that polyclonal and monoclonal patterns in different tumors indicate that the tumors have different clonal origins, since an admixture of stromal and tumor DNA may appear to be polyclonal. Nevertheless, our Patients 1, 4, and 5 each had monoclonal patterns in all the tumors that could be evaluated. Under the assumptions proposed by Drs. Diaz-Cano and Wolfe, the combined probability that this result would occur by chance is less than 0.00001 (2/35 x 2/35 x 2/33 ). Thus, even their assumptions lead to a conclusion of monoclonality, at least in some patients. We appreciate the potential problem of skewed methylation of normal tissue precursors.1 http://content.nejm.org/cgi/content/full/337/8/570?andorexacttitle‌96&fmonth=Apr&sendit=GO&searchid=1&FIRSTINDEX=0&resourcetype=HWCIT
Page 4 of 6
NEJM -- Clonality in Kaposi's Sarcoma
04/14/2006 02:32 PM
Normal skin from six of the eight patients we studied had balanced methylation patterns, but it is uncertain what is the most appropriate normal control for Kaposi's sarcoma. However, changes in DNA methylation that occur during tumorigenesis 2 cannot explain skewing of X-chromosome methylation in the absence of either clonal expansion or Xlinked differences in the cellular propensity to Kaposi's sarcoma (for which there is no other evidence). We agree that detecting additional genetic changes would support the evidence of clonality provided by the HUMARA assay, which has contributed to the current understanding of histiocytosis X, 3 desmoid fibromatosis,4 and Rosai–Dorfman disease.5 Charles S. Rabkin, M.D. Siegfried Janz, M.D. Zhengping Zhuang, M.D., Ph.D. National Cancer Institute Rockville, MD 20892
References 1 . Gale RE, Wheadon H, Boulos P, Linch DC. Tissue specificity of X-chromosome inactivation patterns. Blood 1994;83:2899-2905.[Abstract/Full Text] 2 . Laird PW, Jaenisch R. DNA methylation and cancer. Hum Mol Genet 1994;3:14871495.[Abstract] 3 . Willman CL, Busque L, Griffith BB, et al. Langerhans'-cell histiocytosis (histiocytosis X) -- a clonal proliferative disease. N Engl J Med 1994;331:154160.[Abstract/Full Text] 4 . Li M, Cordon-Cardo C, Gerald WL, Rosai J. Desmoid fibromatosis is a clonal process. Hum Pathol 1996;27:939-943.[Medline] 5 . Paulli M, Bergamaschi G, Tonon L, et al. Evidence for a polyclonal nature of the cell infiltrate in sinus histiocytosis with massive lymphadenopathy (Rosai-Dorfman disease). Br J Haematol 1995;91:415-418.[Medline]
This article has been cited by other articles: Malatos, S., Neubert, H., Kicman, A. T., Iles, R. K. (2005). Identification of Placental Transforming Growth Factor{beta} and Bikunin Metabolites as Contaminants of Pharmaceutical Human Chorionic Gonadotrophin Preparations by Proteomic Techniques. Mol Cell Proteomics
Return to Search Result
Add to Personal Archive Add to Citation Manager Notify a Friend E-mail When Cited
http://content.nejm.org/cgi/content/full/337/8/570?andorexacttitle‌96&fmonth=Apr&sendit=GO&searchid=1&FIRSTINDEX=0&resourcetype=HWCIT
Page 5 of 6
NEJM -- Clonality in Kaposi's Sarcoma
04/14/2006 02:32 PM
4: 984-992 [Abstract] [Full Text] Related Article Butler, S. A., Iles, R. K. (2003). Ectopic Human Chorionic by Rabkin, C. S. Find Similar Articles Gonadotropin {beta} Secretion by Epithelial Tumors and PubMed Citation Human Chorionic Gonadotropin {beta}-Induced Apoptosis in Kaposi's Sarcoma: Is There a Connection?. Clin Cancer Res 9: 4666-4673 [Abstract] [Full Text] Barillari, G., Ensoli, B. (2002). Angiogenic Effects of Extracellular Human Immunodeficiency Virus Type 1 Tat Protein and Its Role in the Pathogenesis of AIDSAssociated Kaposi's Sarcoma. Clin. Microbiol. Rev. 15: 310-326 [Abstract] [Full Text] Judde, J.-G., Lacoste, V., Brière, J., Kassa-Kelembho, E., Clyti, E., Couppié, P., Buchrieser, C., Tulliez, M., Morvan, J., Gessain, A. (2000). Monoclonality or Oligoclonality of Human Herpesvirus 8 Terminal Repeat Sequences in Kaposi's Sarcoma and Other Diseases. J Natl Cancer Inst 92: 729-736 [Abstract] [Full Text] Moore, P. S., Chang, Y. (1998). Kaposi's Sarcoma-Associated Herpesvirus-Encoded Oncogenes and Oncogenesis. J Natl Cancer I Monographs 1998: 65-71 [Abstract] [Full Text]
HOME
|
SEARCH
|
CURRENT ISSUE
|
PAST ISSUES
|
COLLECTIONS
|
HELP
Comments and questions? Please contact us. The New England Journal of Medicine is owned, published, and copyrighted © 2006 Massachusetts Medical Society. All rights reserved.
http://content.nejm.org/cgi/content/full/337/8/570?andorexacttitle…96&fmonth=Apr&sendit=GO&searchid=1&FIRSTINDEX=0&resourcetype=HWCIT
Page 6 of 6
Analysis of Clonality of Atypical Cutaneous Lymphoid Infiltrates Associated With Drug Therapy By PCR/DGGE STEPHEN P. BRADY, MD, CYNTHIA M. MAGRO, MD, SALVADOR J. DIAZ-CANO, MD, PHD, AND HUBERT J. WOLFE, MD Atypical lymphocytic infiltrates that mimic cutaneous lymphoma (ie, pseudolymphoma) are often observed in skin biopsy specimens from patients with altered immune function. The latter may reflect systemic immune dysregulatory states such as collagen vascular disease or human immunodeflciency virus infection. Among the iatrogenic causes are drug therapy with agents that abrogate lymphocyte function. These drugs encompass the anticonvulsants, antidepressants, phenothiazines, calcium channel blockers, and angiotensinconverting enzyme inhibitors. The appellation of lymphomatoid hypersensitivity reaction has been applied to cases of drug-associated pseudolymphoma. Pathologically and clinically, the distinction of such cases from cutaneous lymphoma is difficult. We employed the polymerase chain reaction (PCR) on archival material of proven drug-associated lymphomatoid hypersensitivity reactions both to explore its utility as an adjunct in diagnosis and to investigate the genotypic aberrations induced by drug therapy. Formalin-fixed, paraffin-embedded biopsy specimens from seven cutaneous T-cell lymphomas (CTCL), one nodal T-cell lymphoma, two cutaneous B-cell lymphomas, three typical hypersensitivity reactions, one tonsil, and 14 lymphomatoid hypersensitivity reactions were studied. Control cases for which DNA derived from fresh tissue was used include the Jurkat T-cell tumor line, placenta, one nodal B-cell lymphoma, and one case of reactive lymph node hyperplasia. DNA was obtained and purified by standard methods, then amplified with oligonucieotide primers specific for the T-cell receptor gamma locus and the immunoglobulin
heavy chain genes. T-cell ampllcons were analyzed by denaturing gradient gel electrophoresis (DGGE) and B-cell amplicons by either nondenaturing polyacrylamide or agarose gel electrophoresis. The nodal andJurkat T-cell lymphomas, six of seven CTCL, one cutaneous B-cell lymphoma, and 2 of 14 lymphomatoid hypersensitivity reactions showed dominant ("monoclonal") T-cell gene rearrangement patterns, and the remainder of cases were polyclonal. A causal relationship between drug therapy and skin eruption was ascertained in the two patients showing T-cell rearrangements, and both experienced complete and sustained lesional resolution on discontinuation of the implicated drug. The only immunoglobulin heavy chain gene rearrangements detected by PCR were in two of the three B-cell lymphomas. We conclude that PCR/DGGE is a powerful method for assaying T-cell clonality in archival tissue and can aid in the discrimination of reactive from malignant cutaneous infiltrates with appropriate clinicopathologic correlation. Recognition that a monoclonal TCR~/ rearrangement can be observed in cases of drug-associated lymphomatoid hypersensitivity may help in avoiding a misdiagnosis of malignant lymphoma. HUM PATnOL 30:130-136. Copyright Š 1999 by W.B. Saunders Company Key words: Clonality, T-cell receptor, PCR/DGGE, cutaneous pseudolymphoma, immunodysregulation. Abbreviations: DGGE, denaturing gradient gel electrophoresis; IgH, Immunoglobulin heavy chain; PCR, polymerase chain reaction; TCR, T cell receptor.
Atypical cutaneous lymphoid infiltrates that clinically and light microscopically resemble lymphoma are problematic for the clinician and pathologist. Such cases fall under the broad designation of pseudolymphoma. It appears that the predisposed populace are those with underlying perturbations in immune function. 1,2 Systemic causes include autoimmune disease, atopy, and hematologic malignancy, while therapy with drugs known to alter lymphocyte function is a common iatrogenic cause. Several commonly prescribed agents, including angiotensin-converting enzyme inhibitors, calcium channel blockers, histamine antagonists, antidepressants, lipid-lowering agents, anticonvulsants, benzodiazepines, and phenothiazines, 1-scan exert such effects. Among their effects are depression of T suppresser function or promotion of lymphocyte mitogenesis. It has been hypothesized that the aberrant immune re-
sponse in such cases either may be directed against the immune-dysregulating drug itself or may be triggered by an unrelated antigen. 1-3 In either scenario, the immune response triggered by the antigenic stimulus is abnormal. On histomorphologic grounds alone, the differentiation of these atypical lesions from cutaneous lymphoma often poses difficulty. We explored the utility of gene rearrangement studies as an aid in diagnosis. Such information also may facilitate our comprehension at a molecular level of lesions of lymphomatoid hypersensitivity. The T-cell receptor gamma (TCR~/) locus was chosen for analysis because of both its relatively simple organization (Fig 1) and the fact that gamma rearrangements occur early in T lymphocyte ontogeny and persist after rearrangements of other TCR loci. 4,5 Rearrangements involving the immunoglobulin heavy chain genes were studied to assess B-cell clonality.
From the Department of Pathology, Tufts University School of Medicine, Boston, MA; Ameripath CPI Laboratories, Beachwood, OH; and the Department of Dermatology, University Hospitals, Case Western Reserve University, Cleveland, OH. Accepted for publication
MATERIALS AND METHODS
Selection of Cases/Criteria Used for Diagnosis of Lymphomatoid Hypersensitivity
July 14, 1998.
Address correspondence and reprint requests to Stephen P. Brady, MD, Dermatopathology Department, Massachusetts General Hospital, Warren 526, 55 Fruit St, Boston, MA 02114. Copyright Š 1999 by W.B. Saunders Company 0046-8177/99/30024)004510.00/0
T h e cases were provided by o n e o f the authors (C.M.M.) and i n c l u d e d three cases (cases 1, 4, 14) previously r e p o r t e d by Magro and Crowson. 1 In all of the cases, a diagnosis of drug-associated lymphomatoid hypersensitivity was m a d e based
130
CLONALITY OF ATYPICAL CUTANEOUS LYMPHOID INFILTRATES(Brady et al)
Vy1-8
V?9 VT10 VyI|
Primer Binding Sites
Jl
C1
~
J2
C2
~--:
o
V N 3
C
I ~ : . . ~ ~
o.'""'"'" Rearrat~ged DNA
FIGURE 1. The relative simplicity of the TCRy locus and its high frequency of conserved sequences permit the design of just a few
primer pairs capable of detecting most T-cell gene rearrangements. N depicts the variable number of nucleotides randomly inserted or deleted during V and J joining. Arrows indicate primer binding sites for both V-y1-8 (nested PCR) and V@ (seminested PCR) genes. on ingestion of drugs with potential immune dysregulating properties before the onset of the eruption, characteristic light microscopic findings alluded to below, lesional resolution in those cases in which there was cessation of one or more of the implicated drugs or response to other treatment modalities, and isolation of a definite antigenic trigger in the biopsy specimen (ie, an infective agent). By light microscopy, lymphomatoid hypersensitivity can be categorized as (1 and 2) interface dermatitis with variable epitheliotropism versus a psoriasiform and eczematous dermatitis with lymphoid atypia, hence recapitulating the morphology of p a t c h / p l a q u e stage mycosis fungoides, (3) nodular lymphoid hyperplasia producing a morphology resembling B-cell lymphoma, (4) angiocentric atypical lymphocytic infiltrates (described as lymphomatoid vascular reactions) resembling angiocentric T-cell lymphoma, and (5) l y m p h o m a t o i d follicular mucinosis whereby the outer root sheath of the follicular epithelium is permeated by atypical lymphocytes and there is attendant mucinosis. Such cases raise diagnostic consideration to folliculocentric mycosis fungoides. Positive controls included one nodal T-cell lymphoma, seven cutaneous T-cell lymphomas inclusive of mycosis fungoides, and the Jurkat T-cell tumor line. Negative controls consisted of three typical cutaneous hypersensitivity reactions, one tonsil, one reactive lymph node, and placenta. Light microscopic features of typical cutaneous responses include vacuolar interface dermatitis, perivascular lymphocytic infiltrates with tissue eosinophilia, and eczematous dermatitis. Three B-cell lymphomas (two cutaneous) also were examined. All cases in the series were formalin fixed and paraffin e m b e d d e d except for the Jurkat clone, nodal B-cell lymphoma, lymph node hyperplasia, and placenta, for which DNA derived from fresh-frozen tissue was available. Figure 2 illustrates the histopathology of representative cases.
Analysis o f T- a n d B-Cell C l o n a l i t y
DNA Extraction Five 20-pm unbaked unstained sections were prepared from each block and the epidermis microdissected using a fine needle to enrich for lymphocyte-derived DNA. These thick sections were preceded and followed by standard 5-1am hematoxylin and eosin sections to ensure lesional persistence through the leveling process. The tissue sections were deparaf-
131
finized in xylene, washed with ethanol, and subjected to prolonged proteinase K digestion (5 to 6 days), and the subsequently released DNA was purified by phenol-chloroform extraction as recently described 6 (Fig 3). Finally, the DNA was ethanol precipitated and resuspended in 40 taL Tris-ethylenediaminetetra-acetic acid buffer before use in the polymerase chain reaction (PCR).
TCR~,Ampflficafion and Criteria for DGGE Interpretation Previously published nested consensus primers recognizing Vyl-8 genes and semi-nested consensus primers recognizing the Vy9 gene were employed to detect T-cell gene rearrangements. ~ A two-round amplification strategy was employed, with a "nested" approach used for Vyl-8 targets and a "semi-nested" for Vy9 (Fig 1). Reaction and thermocycling conditions as described by Wood et al 7 were followed, with the exception that 30 first-round cycles succeeded by 20 cycles in the second round was found to be optimal for DNA extracted from paraffin-embedded tissues. PCR amplification was performed using a Perkin-Elmer 9600 thermocycler (Norwalk, CT), and all runs included a previously established positive control and tubes to which no DNA was added. One-half microgram DNA isolated from fresh or frozen tissues was used as template in the first reaction round, and DNA derived from archival tissues was not quantitated (5 IlL of each Trisethylenediaminetetra-acetic acid resuspended sample was used). The presence of amplification product in the expected size range was verified by agarose gel electrophoresis (Fig 4), and then the amplicons were separated by denaturing gradient gel electrophoresis as previously described. 7,8 All cases were amplified in duplicate using both nondiluted and 1/20 diluted first-round DNA as template in the second round. Gels were stained 15 minutes with ethidium bromide and photographed under ultraviolet illumination. Denaturing gradient gel electrophoresis (DGGE) patterns were interpreted as polyclonal if electrophoresis resuited in either a diffuse smear or in multiple weak bands, and as clonally rearranged if a dominant banding pattern was achieved. Bands were classified as dominant if they were discrete, sharp, and persisted or intensified after dilution of the first-round product. Up to four such bands were permitted because of the possibilities of bi-allelic rearrangements and
HUMAN PATHOLOGY
Volume 30, No. 2 (February 1999)
widely variable size, such that clones generate unique banding patterns detectable by nondenaturing electrophoresis. RESULTS C l i n i c a l Features
The clinical information is summarized in Table 1. Histology
C a s e 1 (MF-like) T h e biopsy specimen was remarkable for a superficial infiltrate, which focally assumed a band-like pattern of infiltration within the epidermis. T h e r e was striking epitheliotropism with localization to the rete and acrosyringium. The infiltrate had a polymorphous composition comprising small, intermediate, and transformed hyperchromatic and irregularly c o n t o u r e d lymphocytes.
Case 2 (MF-like) The biopsy specimen displayed a superficial bandlike lymphocytic infiltrate. The epidermis showed variable hyperplasia. The lymphocytes were in the 7- to 9-gin range. A few scattered cells with a Sezary morphology were identified.
Case 3 (MF-like)
FIGURE2. (A) Plaque-stage mycosis fungoides with hyperkeratosis, extensive epidermal colonization by atypical lymphocytes, and dermal fibrosis. (H&E, original magnification ×125 [same case as illustrated in Fig 5B, lanes 13-14].) (B) Case of lymphomatoid lichenoid hypersensitivity with striking similarity to the lymphoma depicted in A (patient no. 4). (H&E, original magnification ×125.) Note the hyperkeratosis and papillary dermal fibrosis, as well as focal epidermal permeation by small atypical lymphocytes. Thissingle-plaque lesion was associated with a histamine antagonist and showed monoclonal TCR~ rearrangement by PCR/DGGE (Fig 5C, lane 17), Complete resolution occurred within several weeks of discontinuing the medication, and the patient remains free of disease 2 years later.
heteroduplex formation, but usually only one to two bands were present. Weakly staining bands were not infrequently noted, especially after amplification with the V~9 primers, and tended to disappear or lose intensity after template dilution-such bands could not be considered representative of a clonal expansion.
T h e biopsy specimen showed a ban&like lymphocytic infiltrate with obscuration o f the d e r m o e p i d e r m a l junction. T h e r e was p r o m i n e n t infiltration of the epidermis by atypical lymphocytes with foci of frank architectural ablation of the epidermis. The cells within the dermis were d o m i n a t e d by small mature lymphocytes with minimal atypia, whereas those cells within the epidermis were significantly atypical and included cells with a Sezary morphology.
Case 4 (MF-like) A band-like lymphocytic infiltrate in close apposition to the epidermis was present, with colonization of the basal and parabasilar epidermis by small lymphocytes showing significant nuclear c o n t o u r irregularity (Fig 2B). A coarse sclerosing dermal response within the papillary and superficial reticular dermis was additionally noted.
Case 5 (B-Cell Lymphoma Cutis-like Pattern)
Immunoglobulin Heavy Chain Amplification Primers recognizing consensus immunoglobulin H ([gH) variable region framework (FR) I-IV and III-IV sequences and a consensus IgH joining region primer were used to study B-cell gene rearrangements as described by Segal et al. 9,1°The B-cell amplicons were separated by either 3% agarose (FR I-IV) or 12% nondenaturing polyacrylamide (FR III-IV) gel electrophoresis. The gels were stained and photographed in the same manner as for the T-cell studies. In contrast to TCR% rearrangements involving the IgH locus result in products of 132
T h e biopsy specimen was remarkable for a pandermal dense nodular nonepitheliotropic lymphocytic infiltrate. Centrally the d o m i n a n t composition of the infiltrate was one of transformed lymphocytes, and the periphery showed small mature lymphocytes with admixed eosinophils.
Case 6 (Lymphomatoid Vascular Reaction) The biopsy specimen was remarkable for dense superficial and deep angiocentric lymphocytic infil-
CLONALITY OF ATYPICAL CUTANEOUS LYMPHOID INFILTRATES(Brady et al)
Epidermal Microdissection T-cell Gene Rearrangement
1
Proteinase K Digestion
Phenol Chloroform
E ~ p~&GE ~ ! {i~
Extraction
B-Cell Gene Rearrangement
FIGURE 3. Schematic illustration of DNA extraction process from archival tissue with subsequent amplification and product analysis.
trates predominated by immunoblasts with an admixture of other inflammatory cell elements, including small mature lymphocytes, plasma cells, and eosinophils. Scabetic mites were identified within the stratum corneum.
diffuse interstitial granulomatous component also was present.
Case 7 (Lymphomatoid Vascular Reaction)
A dense lymphohistiocytic infiltrate involving the mid and deep dermis with extension into the subcutaneous fat was present, as well as marked infiltration of sampled hair follicles by this infiltrate. One of the inflamed follicles showed extensive permeation by fungal forms consistent with an endothrix infection.
Case 8 (Folliculotropic MF-Iike and Lymphoma Cuffs-like)
The biopsy specimen showed a striking vascular reaction involving the entire sampled cutaneous vasculature. The infiltrates comprised a monomorphic populace of small and intermediate-sized lymphocytes with significant nuclear contour irregularity. A concomitant 12,216
Case 9 (Folliculotropic MF-like)
SM
A striking reaction involving sampled hair follicles characterized by dense perifollicular and intrafollicular lymphohistiocytic infiltrates with attendant follicular mucinosis was present, as were nodular mononuclear cell infiltrates surrounding and permeating perifollicular vessels.
1018 517 134
Case 10 (Lymphomatoid Vascular Reaction) The biopsy specimen was remarkable for nodular angiocentric mononuclear cell infiltrates involving the superficial and mid-dermal vasculature, with attendant luminal and mural fibrin deposition and red cell extravasation. The cytomorphology of the mononuclear cells encompassed intermediate and transformed lymphocytes with mild nuclear contour irregularity.
Case 11 (Folliculotropic MF-Iike and Lymphoma Cuffs-like)
FIGURE 4. Agarose gel with typical second-round PCR products. Each sample was amplified in duplicate with both Vyl-8 and V~,9 primers, accounting for the four lanes/sample (representative samples indicated by white numbers within gel), The staggered appearance results from the larger product obtained after Vyl-8 amplification (-420 bp) versus V@ (-380 bp).
The biopsy specimen was remarkable for a dense nodular lymphohistiocytic infiltrate, which had as its epicenter sampled follicles. Concomitant cytopathic alterations of the follicles were noted consistent with molluscum contagiosum infection. 133
HUMAN PATHOLOGY
TABLE 1.
Volume 30, No. 2 (February 1999)
Summary of Clinical Data and DGGE Results
Patient No.
Age (yr)/Sex
Clinical Presentation
Nature of Immunodysregulation
Therapy and Current Status
DGGE Pattern
1 2 3 4 5 6
44F 63F 66M 48F 59F 86F
Chest papule Plaque on left leg Plaque on palm Plaque on thigh Nodule on tip of nose Nodules on back and left arm (scabetic)
H2A CCB, SS H2A H1A SS ACE, HIA × 2; 2 others
P P M M P P
7
70M
Maculopapular rash on extremities
Prilosec
8
52F
CCB, Anticonv X2
9 10 11 12 13 14
48M 39F 18F 54F 43F 65M
Papules and plaques on face associated with Endothrix Papules on leg and torso Multiple papules on distal extremities Papule on cheek Plaques on face, neck, and forearm Generalized papules Patches & plaques on trunk & extremities
Lesion Excised/NED CCB discontinued/NED H2A discontinued/NED H1A discontinued/NED Treated with x-ray therapy/NED Continued drug therapy, lesions resolved with treatment of scabetic infestation/NED Lesions resolved with steroid therapy/NED Lesions resolved with anti-fungal therapy/NED AD discontinued/NED ACE discontinued/NED Excision of lesion/NED CCB discontinued/NED H1A discontinued/NED Drugs discontinued/NED
AD, Anticonv ACE, AD × 2 SS; Atopic diathesis CCB H1A; 1 other BB, ACE
P P P P P P P P
Abbreviations: NED, no evidence or recurrence of disease after discontinuation of implicated drug or other therapy; AD, antidepressants (ie, Amitriptyline [case no. 9], Prozac [case no. 10], Klonopin [case no. 10]); Li, Lithium; ACE, angiotensin-converting enzyme inhibitor; CCB, calcium channel blocker; Bzp, benzodiazepine; LiLA, lipid-lowering agent; H2A, histamine 2A-receptor antagonist; H1A, histamine 1A receptor antagonist; SS, sex steroids (ie, estrogen and progesterone); anficonv, anticonvulsants (ie, carbamazepine, dilantin, phenobarbital); BB, beta-blocker; other, Nitroprusside, Dyazide, Flexeril, Relafan; ×, number of drugs of that class that the patient was receiving; P, polyclonal; M, monoclonal.
Case 12 (MF-like) The biopsy specimen showed a vacuolar and lichenoid interface dermatitis with epitheliotropism.
Case 13 (MF-like) Two biopsy specimens were available and appeared morphologically similar. In each a superficial interstitial and perivascular lymphocytic infiltrate was observed. There was haphazard infiltration of the epidermis by lymphocytes with lymphoid forms extending into the upper layers of the epidermis. The cytomorphology comprised small and intermediate-sized lymphocytes with nuclear contour irregularity.
(Fig 6). The latter also showed an apparent TCR~ rearrangement. Although rearrangements discordant with immunophenotype have been described, 11 it is more likely in this particular case that amplification of DNA from relatively rare infiltrating T lymphocytes resulted in a pseudoclonal pattern. When the DGGE results were compared with tissue reaction pattern, a correlation between detectable clonal 2
4
6
8
10
12
14
16
18
Case 14 (MF-like) The biopsy specimen was remarkable for a superficial perivascular and interstitial mononuclear cell infiltrate. There was slight exocytosis of lymphocytes. The vessels amidst the infiltrate showed injurious alterations as indicated by mural and luminal fibrin deposition. The infiltrate was dominated by intermediate and transformed atypical lymphocytes inclusive of cells with a Sezary morphology. FIGURE 5. DGGE Results. (A) Lymph node hyperplasia shows a diffuse smear indicative of its polyclonal nature (lanes 1-2), whereas the Jurkat T-cell tumor line shows a V71-8 rearrangement (lanes 5-6; results of Jurkat amplification with V79 primers are seen in lanes 3-4). (B) Nodal T-cell lymphoma with monoclonal pattern (lanes 7-8), two cases of polyclonal LyHR(lanes 9-10 [patient no. 2] and 11-12 [patient no. 10]), MF showing a dominant banding pattern diagnostic of rearrangement (lanes 13-14, same case as in Fig 2A), and polyclonal case of typical hypersensitivity (lanes 15-16); (C) Monoclonal LyHR (lane 17, patient no. 4), monoclonal MF (lane 18), and polyclonal tonsil (lane 19).
Molecular Studies The nodal and Jurkat T-cell lymphomas, six of seven cutaneous T-cell lymphomas (86%), and 2 of 14 of the study cases (14%) displayed dominant TCR~ gene rearrangement patterns, whereas the remainder of cases were polyclonal (Fig 5). The only immunoglobnlin heavy chain gene rearrangements detected by PCR were in two of the three B-cell lymphomas, including the nodal and one of the two cutaneous lymphomas 134
CLONALITY OF ATYPICAL CUTANEOUS LYMPHOID INFILTRATES(Brady et at) SM
SM
2
2
4
4
6
6
8
8
10
10
12
12 14
14
16
16
18
FIGURE6. (A) FR I-IV,Multiplex PCR: 3% agarose gel shows IgH chain gene rearrangement in case of paraffin-embedded cutaneous B-cell lymphoma (arrow, lane 2) and fresh-frozen nodal B-cell lymphoma (arrow, lane 11). (B) FR Ill-IV, seminested PCR: 12% nondenaturing polyacrylamide gel with firstand second-round PCR products. Arrows point to clona[ gene rearrangement detected after first (lane 6) and second (lane 4) amplification rounds, Same case as depicted in lane 2 of (A).
expansion and a dense band-like (ie, lichenoid) morphology was apparent.Only 4 of 14 casesdisplayedthis pattern (patients 1 through 4), yet they included both monoclonal cases.The nonlichenoid patterns encompassed (1) a lower-densityepitheliotropic, eczematous, and psoriasiformmorphology, (2) lymphomatoidvasculitis, (3) follicular mucinosis, and (4) lymphocytoma cutis, none of which manifestedany T-cell clonal rearrangement. DISCUSSION
We have investigated T-cell clonality of drugassociatedlymphomatoid hypersensitivityreactions by 135
PCR/DGGE using formalin-fixed, paraffin-embedded tissues.Although many investigatorsemploying similar techniquesto study malignantand reactivelymphocytic infiltrates of skin have relied on fresh or frozen material, 12-14there are increasing reports in the literature regarding the use of such archival tissue for TCR~ analysis.15-1sOur 86% detection of TCR~/ rearrangemerits in our cutaneousT-cell lymphomacontrols (89% detectionof positivesif the nodal lymphomaandJurkat samples are included) is in close agreementwith that published by others.7,1~,16It also reaffirms PCR as a powerful m e t h o d for assayingT-cell clonality, a characteristic hallmark ofmalignantT-cell lymphoma.Regarding B-cell clonality, none of our study casesshowedIgH chain rearrangement.This contrastswith the findings of Ritter et al,19who not uncommonly identified such rearrangementsin mixed B and T as well as predominantly T-cell cutaneouslymphoid infiltrates.19 The current seriesrepresentsa collection of atypical reactivelymphocyticinfiltrates that raisedcutaneous lymphomaas a diagnosticpossibility. The appellationof lymphomatoid hypersensitivity reaction has been applied to such cases.I When the antigenic trigger is isolated,the terminologyis modified accordingly.Hence, in the setting of an abnormal immune responseto a contact,the term lymphomatoid contact dermatitis is used.2째 Although previous studies of reactive cutaneousinfiltrates have shown clonal rearrangementsranging from 0% 12"14,17,18to 6%,7 detectable rearrangementswere presentin 2 of 14 of our lymphomatoidhypersensitivity cases(14%). This finding is similar to that of Staib and Sterry16 who also found dominant rearrangementsin 14% o f " pseudolymphoma."The associationof atypical lymphoid hyperplasia with a variety of therapeutic agents has previously been reported by Magro and Crowson, lswho postulatedthat blocking or stimulation of receptor-mediatedlymphocytefunction may result in aberrant immune responsesto a variety of antigenic triggers. A similar theory of systemic or iatrogenic immune dysregulation leading to atypical lymphoid hyperplasiahas been postulatedby other authors.21,~2In one of the reports, they isolatedherpesas the antigenic trigger; the underlying immune dysregulatorystatewas malignant lymphoma.21 The role of an infective antigenic trigger in the propagation ofthe infiltrate was similarly documentedin three of our cases.It is possible that emergence of a dominant clone or clones is facilitated by dysregulatedT-cell function or by direct mitogenic effectsof pharmacologicalagentson lymphocytes,and that this accountsfor our increasedfinding of monoclonality. When the implicated drugs were discontinuedin the two patients showing clonal rearrangement,both experiencedcomplete resolution of their lesions and remain free of diseaseup to 2 yearslater (patients3 and 4). Although both drug-associatedpseudolymphoma progressing to lymphoma23 and drug-associatedlymphoma are described,24 a diagnosis of malignant lymphoma is unwarrantedin our two casesin light of the spontaneousand sustainedresolution of lesions after drug withdrawal. It is increasingly recognized that
Histopathology 2008, 53, 1–19. DOI: 10.1111/j.1365-2559.2007.02937.x
REVIEW
General morphological and biological features of neoplasms: integration of molecular findings S J Diaz-Cano Department of Histopathology, King’s College Hospital and King’s College London School of Medicine, London, UK
Diaz-Cano S J (2008) Histopathology 53, 1–19
General morphological and biological features of neoplasms: integration of molecular findings This review highlights the importance of morphology– molecular correlations for a proper implementation of new markers. It covers both general aspects of tumorigenesis (which are normally omitted in papers analysing molecular pathways) and the general mechanisms for the acquired capabilities of neoplasms. The mechanisms are also supported by appropriate diagrams for each acquired capability that include overlooked features such as mobilization of cellular resources and changes in chromatin, transcription and epigenetics; fully accepted oncogenes and tumour suppressor genes are highlighted, while the pathways are also presented as activating or inactivating with appropriate colour coding. Finally, the concepts and mechanisms presented enable us to understand the basic requirements for the appropriate implementation of molecular tests in clinical practice. In summary, the basic findings are presented to serve as a bridge to clinical applications. The current definition of neoplasm is descriptive and difficult to apply routinely. Biologically, neoplasms develop through acquisition of capabilities that involve tumour cell aspects and modified microenvironment interactions, resulting in unrestricted growth due to a stepwise accumulation of cooperative genetic alterations that affect key mole-
cular pathways. The correlation of these molecular aspects with morphological changes is essential for better understanding of essential concepts as early neoplasms ⁄ precancerous lesions, progression ⁄ dedifferentiation, and intratumour heterogeneity. The acquired capabilities include self-maintained replication (cell cycle dysregulation), extended cell survival (cell cycle arrest, apoptosis dysregulation, and replicative lifespan), genetic instability (chromosomal and microsatellite), changes of chromatin, transcription and epigenetics, mobilization of cellular resources, and modified microenvironment interactions (tumour cells, stromal cells, extracellular, endothelium). The acquired capabilities defining neoplasms are the hallmarks of cancer, but they also comprise useful tools to improve diagnosis and prognosis, as well as potential therapeutic targets. The application of these concepts in oncological pathology leads to consideration of the molecular test requirements (Molecular Test Score System) for reliable implementation; these requirements should cover biological effects, molecular pathway, biological validation, and technical validation. Sensible application of molecular markers in tumour pathology always needs solid morphological support.
Keywords: cell kinetics, differentiation, genetic instability, molecular pathology, neoplasia, pathogenesis, progression, tumour heterogeneity, tumour microenvironment Abbreviations: AIF, apoptosis-inducing factor; ALT, alternative lengthening of telomeres; APE, apurinic ⁄ apyrimidinic endonuclease; BRCA, Breast cancer; CAD, caspase-activated DNase; CDK, cyclin-dependent kinase; DFF, DNA fragmentation factor; EndoG, endonuclease G; HDAC, histone deacetylase; HIF, hypoxia inducible factor;
Address for correspondence: S J Diaz-Cano, MD, PhD, FRC Path, Department of Histopathology, King’s College Hospital, Denmark Hill, London SE5 9RS, UK. e-mail: salvador.diaz-cano@kcl.ac.uk The protocol used in the study was approved by the Hospital Research Board and Ethical Committees and complied with their requirements. 2008 The Author. Journal compilation 2008 Blackwell Publishing Limited.
2
S J Diaz-Cano
LOH, loss of heterozygosity; MAP, mitogen-activated protein; MBD, methyl CpG-binding domain; Mcm, minichromosome maintenance complex; MMP, matrix metalloproteinase; MSI, microsatellite instability; MTA, metastasis-associated protein; mTOR, mammalian target of rapamycin, NAD, nicotinamide adenine dinucleotide; NF, nuclear factor; ORC, origin recognition complex; PARP, polyADP-ribose polymerase; PAX, paired box; PDK1, 3-phosphoinositide-dependent protein kinase-1; PIP3, phosphatidylinositol 3,4,5-triphosphate; PPAR, peroxisome proliferator-activated receptor; PTC, patched; PTEN, phosphatase and tensin homologue; RAS, rat sarcoma; Rb, retinoblastoma; RET, rearranged during transfection; ROS, reactive oxygen species; TGF, transforming growth factor; TMM, telomere maintenance mechanism; TNF, tumour necrosis factor; VEGF, vascular endothelial growth factor
Introduction Histopathology remains the gold standard of tumour diagnosis, but it needs strong links to all new developments such as molecular markers. Proper morphological evaluation has been demonstrated to be invaluable for both establishing concepts and helping with technical issues, especially in dealing with the heterogeneous components in neoplasms; the application of these principles would allow more reliable comparison of results and implementation of meaningful concepts. Any sustained progress in this area should refer to the morphological changes for verification and validation. Hanahan and Weinberg’s article on tumorigenesis is one with the greatest degree of impact,1 but does not pay much attention to molecular–morphological correlation in neoplasms. Nevertheless, key oncological features need careful morphological correlation when new markers are introduced in the diagnosis and management of patients. In tumour pathology new markers have been incorporated at the tissue level to help defining subtypes, but there is an increased demand for molecular tests on tissue sections (in situ techniques) and on solid support (techniques after extraction). Proper application of these techniques requires sensible selection of markers that should be based on concepts of tumour biology (both general and tissue specific).
General aspects of tumorigenesis A general definition of neoplasm, such as ‘cellular disease characterized by abnormal growth regulatory mechanisms’, is descriptive and difficult to apply routinely, working definitions being required. The introduction of new markers has improved diagnostic precision, but can potentially result in big changes in prevalence and uncertainties for particular lesions. The current World Health Organization classifications of tumours incorporate new developments based on pathology and genetics, the leading criteria still being
morphological; in this context, molecular findings complement the histological evaluation without replacing it. Additionally, any new definition should be validated against the accepted standard (specificity ⁄ sensitivity), should improve patient management, and should provide a biological meaning for its application. The first requirement is normally met on the initial design, and the second would be expected in any successful implementation. The third criterion is more difficult to apply, but any new definition should be biologically meaningful and would incorporate core elements in tumour biology (in particular, genetic and kinetic correlates).2–6 These elements need to be included in a score system. Examples include the paired box (PAX) 8 ⁄ peroxisome proliferator-activated receptor (PPAR) c fusion gene described in follicular thyroid carcinomas and adenomas, and rearranged during transfection (RET) ⁄ patched (PTC) fusion genes reported in papillary thyroid carcinomas and Hashimoto’s thyroiditis. Biologically, neoplasms develop through acquisition of capabilities that involve tumour cell aspects and microenvironment interactions, as explained in more detail below (General molecular mechanisms).1 The unrestricted growth observed in neoplasms is generally due to a stepwise accumulation of cooperative genetic alterations in oncogenes and tumour-suppressor genes, the number being more important than the order of changes;7 the evidence available suggest that five to seven genetic alterations are required for clinically detectable tumours, correlating with morphological progression in some locations. These capabilities are not equally relevant at different stages during tumorigenesis, as highlighted by careful morphological evaluations. The markers should be selected considering the capability to test and the marker role during tumour initiation and promotion. Tumour promotion markers would be more relevantly assessed during progression, which needs to be defined on clear clinical and morphological grounds. These aspects are relevant for three essential concepts: early neoplasms ⁄ precancerous lesions, progression ⁄ dedifferentiation, and
2008 The Author. Journal compilation 2008 Blackwell Publishing Ltd, Histopathology, 53, 1–19.
Molecular bases of tumorigenesis
intratumour heterogeneity (considering tumour cell segregation and heterotypic biology ⁄ landscaper effect). e a rl y n e op l a s m s a n d pr e c a n c e r o u s l e s i on s These two concepts are closely related to tumour initiation, have been developed for epithelial neoplasms and corroborate the concept of multistep tumorigenesis and accumulation of cooperative genetic abnormalities (‘gatekeeper’ and ‘caretaker’ pathways).7 The paradigm is the concept of intraepithelial neoplasm ⁄ malignancy, it being more difficult to extrapolate the concept to non-epithelial lesions. These lesions would be meaningful when they are present in structures with anatomical boundaries and the cells do not recirculate ⁄ migrate in physiological conditions, regardless of lesion size. Regarding anatomical considerations, the limiting structure is the basement membrane, not the tumour capsule. Although some genetic alterations are described as neoplasm-specific, the presence of a single genetic alteration cannot be considered diagnostic of malignancy, even for early stages. These problems preclude establishing reliable diagnoses of follicular carcinomas in situ for encapsulated neoplasms carrying PAX8 ⁄ PPARc fusion genes, even for lesions that initially carry molecular changes reported in malignancy. The opposite situation is equally important: histologically confirmed intraepithelial lesions are considered precursors, but they can accumulate genetic alterations and show kinetic features of malignancies, as reported for C-cell hyperplasias in multiple endocrine neoplasia 2A.8,9 Non-random genetic alterations can also be used to test clonal expansions and the clonal evolution of neoplasms, especially analysing hypervariable DNA regions from patients heterozygous for a given marker. These tests rely basically on the demonstration of loss of heterozygosity (LOH) resulting from either hemizygosity (non-random interstitial DNA deletions) or homozygosity of mutant alleles observed in neoplasms. LOH analyses identify clonal expansions of a tumour cell population and point to monoclonal proliferation when multiple and consistent LOH is demonstrated (high fractional allelic loss).4 Applied appropriately, these tools can establish the clonal evolution of tumour cell populations (tumour heterogeneity) and differentiate field transformation from metastatic tumour growths in synchronic and histologically identical neoplasms. n e op l a s t i c p r og r e s s i on an d d e d i f f e re n t i a t i o n Neoplastic transformation evolves over a period of time and involves the phenotypic progression of
3
tumour cells along with the interaction of the initiated cell with its microenvironment. The elucidation of the steps of cancer progression (Figure 1) relates to the acquisition of invasive capability in intraepithelial lesions and metastatic potential in invasive malignancies and is of utmost importance in the differential diagnosis of neoplasms and in the establishment of more efficient therapeutic regimens. This functional characterization of the particular stage of tumour will certainly allow for better diagnosis, staging, prognostication and treatment of cancers. Tumour cell metabolic activation also determines the degree of differentiation and needs to be carefully coupled with kinetic features; any imbalance in the ribosomal activation ⁄ kinetics will result in apoptosis activation (see General molecular mechanisms). Changes in gene expression are common findings in neoplasms, due to general and capabilityspecific factors. On one hand, general mobilization of resources will result in activation of the cellular machinery needed for transcription (with corresponding chromatin changes) and translation, which is regulated by mammalian target of rapamycin) and eIF4E pathways, as well as for ribosomal activation. On the other hand, capability-specific markers activate transcription factors that modified the gene expression. These two collaborative aspects explain gene expression modifications that can be powerful markers of neoplastic transformation and have been proposed as diagnostic criteria for a molecular classification of neoplasms.10–15 Histopathological examination of solid tumours frequently reveals pronounced tumour cell heterogeneity, often demonstrating substantial diversity within a given tumour. The molecular mechanisms underlying the phenotypic heterogeneity are very complex, with genetic, epigenetic and environmental components, such as shortage of oxygen. Hypoxia greatly influences cellular phenotypes by altering the expression of specific genes, makes the tumours more aggressive, and is an important contributor to intraand intertumour cell diversity, as revealed by the pronounced but non-uniform expression of hypoxiadriven genes in solid tumours.16 Hypoxic tumour cells lose their differentiated gene expression patterns and develop stem cell-like, immature or dedifferentiated phenotypes.17 Not only will hypoxia-induced dedifferentiation contribute to tumour heterogeneity, but it could also be one mechanism behind increased aggressiveness of hypoxic tumours. Intratumoral hypoxia is an independent indicator of poor patient outcome, and increasing evidence supports a role for hypoxia in the development of metastatic disease.16
2008 The Author. Journal compilation 2008 Blackwell Publishing Ltd, Histopathology, 53, 1–19.
4
S J Diaz-Cano
Figure 1. Molecular pathways involved in tumour cell progression.
Studies suggest that the acquisition of the metastatic phenotype is not simply the result of dysregulated signal transduction pathways, but instead is achieved through a stepwise selection process driven by hypoxia.18,19 Hypoxia facilitates disruption of tissue integrity through repression of E-cadherin expression, with concomitant gain of N-cadherin expression, which allows cells to escape anoikis. Through upregulation of urokinase-type plasminogen activator receptor expression, hypoxia enhances proteolytic activity at the invasive front and alters the interactions between integrins and components of the extracellular matrix, thereby enabling cellular invasion through the basement membrane and the underlying stroma. Cell motility is increased through hypoxia-induced hepatocyte growth factor–MET receptor signalling, resulting in cell migration towards the blood or lymphatic microcirculation. Hypoxia-induced vascular endothelial growth factor (VEGF) activity also plays a critical role in the dynamic tumour–stromal
interactions required for the subsequent stages of metastasis. Metastasis, the final step in malignancy, is the result of selected aspects of the complex tumourprogression process. Tumour cell dissemination is the prerequisite of metastasis and is correlated with loss of epithelial differentiation and the acquisition of a migratory phenotype, a hallmark of malignant tumour progression.17,20,21 A stepwise, irreversible accumulation of genetic alterations is considered to be the responsible driving force, but, strikingly, metastases of most carcinomas recapitulate the organization of their primary tumours. The loss of epithelial characteristics (i.e. lack of intercellular adhesion molecules) results in breakdown of epithelial-cell homeostasis, correlates with the acquisition of a migratory phenotype and leads to progression.22 This epithelial to mesenchymal transition is considered to be a crucial event in malignancy.21 The important steps that enable metastasis are reversible,
2008 The Author. Journal compilation 2008 Blackwell Publishing Ltd, Histopathology, 53, 1–19.
Molecular bases of tumorigenesis
5
Figure 2. Molecular pathways involved in microenvironment interactions (intercellular, and stromal, neoangiogenesis, and invasion).
and therefore cannot be explained solely by irreversible genetic alterations, indicating the existence of a dynamic component to human tumour progression, in particular a regulatory role for the tumour microenvironment (Figure 2).23 Tumours are morphological and functionally heterogeneous and segregate into tumour cells with different capabilities: individual tumours show distinct sub-areas of proliferation and cell-cycle arrest, differentiation, cell adhesion and dissemination, some of them determined by topography (see below). VEGF promotes angiogenesis and lymphangiogenesis in the primary tumour, providing the necessary routes for dissemination. VEGF-induced changes in vascular integrity and permeability promote both intravasation and extravasation, whereas VEGF-induced angiogenesis in the secondary tissue is essential for cell proliferation and establishment of metastatic lesions. Through regulation of these critical molecular targets, hypoxia promotes each step of the metastatic cascade and selects tumour cell populations
that are able to escape the unfavourable microenvironment of the primary tumour. i n t r a t u mo u r h e t e r o g e n e i t y an d t um o u r c e l l s e g r e g a t i on Intratumour heterogeneity comprises both tumour cells and heterotypic components (immune ⁄ inflammatory cells, myofibroblasts, endothelial cells and extracellular matrix). Intratumour heterogeneity is assumed to occur randomly, but some factors such as topography control the segregation of tumour cells within neoplasms.24–29 The topographic intratumour heterogeneity suggests differential selection of tumour cells, but can also be expression of either selective clonal evolution or a simple passive by-product of genetic instability. The differential kinetic profile by topographic compartments has been related to lower cell turnover and apoptosis down-regulation in deep ⁄ peripheral compartments, resulting in accumulation
2008 The Author. Journal compilation 2008 Blackwell Publishing Ltd, Histopathology, 53, 1–19.
6
S J Diaz-Cano
of genetic alterations and segregation of tumour cells with differential genetic backgrounds as demonstrated in adrenal gland, colon and bladder. This process has been linked with mismatch repair protein downregulation and it is unlikely to be related with hypoxia, which is more pronounced in central compartments. However, the coexistence of genetic alterations supports a key role in tumorigenesis, the topographic heterogeneity resulting from the accumulation of genetic damage. This concept is central and supports multiple sampling to assess reliably the genetic abnormalities of neoplasms. The heterotypic biology of neoplasms is an essential element in understanding tumour growth. The underlying defect (clonal genetic alteration) may reside in stromal and not tumour cells, as reported in juvenile polyposis syndrome and ulcerative colitis hamartomatous polyps.30 This finding suggests that, at least initially, the stromal cells are the neoplastic cells, whereas secreting factors drive the epithelial proliferation, and might thus eventually also be responsible for the induction of epithelial malignancy. This bystander role, mutations inducing stromal abnormalities that in turn induce epithelial neoplasia, has been called a landscaper effect: the microenvironment surrounding epithelial cells as a major determinant of the disturbed epithelial architecture, differentiation and proliferation (Figures 1 and 2).
General molecular mechanisms in tumorigenesis The main tumorigenesis molecular pathways must be evaluated according to the acquired capabilities: self-maintained replication (cell-cycle dysregulation), extended cell survival (cell-cycle arrest, apoptosis dysregulation, and replicative lifespan), genetic instability (chromosomal and microsatellite), changes of chromatin, transcription and epigenetics, mobilization of cellular resources, and modified microenvironment interactions (tumour cells, stromal cells, extracellular, endothelium). All these aspects must finally be integrated in the mechanisms of tumour initiation (including clonality) and progression (see above). Knowledge of these pathways in each acquired capability is also essential to plan any sensible molecular evaluation of neoplasms: it will allow marker selection based on biological features and it will allow precise selection of surrogate ⁄ secondary markers to validate the results. In addition, some pathways are mutually exclusive [i.e. rat sarcoma (RAS) and B-RAF mutations or epidermal growth factor receptor (EGFR) and
RAS analyses] and have to be evaluated simultaneously. s e l f - m a i n t a i n e d pr o l i f e r a t i o n ( f i g u r e 3 ) The cell-cycle transition from G1 to S phase is a key regulatory point in the cell cycle. The G1 ⁄ S cell cycle checkpoint controls the passage of eukaryotic cells from the first ‘gap’ phase (G1) into the DNA synthesis phase (S). Two main cyclin-dependent kinases (CDK) complexes, CDK4 ⁄ 6–cyclin D and CDK2–cyclin E, and the transcription complex that includes retinoblastoma (Rb) and E2F are pivotal in controlling this checkpoint.31–33 During G1 phase, the Rb–HDAC repressor complex binds to the E2F-DP1 transcription factors, inhibiting downstream transcription.34 Phosphorylation of Rb by CDK4 ⁄ 6 and CDK2 dissociates the Rb– repressor complex, permitting transcription of S-phase genes encoding for proteins that amplify the G1 to S phase switch and that are required for DNA replication. Many different stimuli exert checkpoint control, including transforming growth factor (TGF)-b, DNA damage, contact inhibition, replicative senescence, and growth factor withdrawal. The first four act by inducing members of the INK4 or Kip ⁄ Cip families of cell cycle kinase inhibitors.31,32 TGFb additionally inhibits the transcription of Cdc25A, a phosphatase that activates CDKs.35,36 Growth factor withdrawal activates GSK3b, which phosphorylates cyclin D, leading to its rapid ubiquitylation and proteosomal degradation. Ubiquitylation, nuclear export and degradation are mechanisms commonly used to rapidly reduce the concentration of cell-cycle control proteins. Other pathways acting through Ras, Rac and Rho also regulate the G1 to S transition.37,38 Ras regulates cyclin D1 expression to affect the G1 to S transition. Transforming forms of Ras or Raf induce cyclin D1 expression and cause early entry into S phase. Signalling from Ras to Raf to MEK to ERKs induces cyclin D1 expression, allowing cyclin D1 to complex with Cdk4 and Cdk6 and phosphorylate Rb. Rac-1 and PAK appear to induce cyclin D1 expression and induce G1 to S transition primarily through activation of nuclear factor (NF)-jB to activate the cyclin D1 promoter. Rho activates cdk2 and also inhibits p21 and p27 to induce cyclin D1 and stimulate G1 to S transition. Rho represses p21 expression to block p21 induction by Ras and to allow Rasinduced progression from G1 to S. Cells that lack p21 do not require Rho for Ras to induce cell cycle progression from G1 to S phase. The cooperative action of Ras, Rac and Rho to induce cyclin D1 expression is a key component of oncogenic transformation.
2008 The Author. Journal compilation 2008 Blackwell Publishing Ltd, Histopathology, 53, 1–19.
Molecular bases of tumorigenesis
7
Figure 3. Molecular pathways involved in the tumour cell acquired capability of self-maintained proliferation.
TP53 is a transcription factor whose activity is regulated by phosphorylation.39–41 The function of p53 is to keep the cell from progressing through the cell cycle if there is damage to DNA present. It may do this in multiple ways, from holding the cell at a checkpoint until repairs can be made to causing the cell to enter apoptosis if the damage cannot be repaired. The critical role of p53 is evidenced by the fact that it is mutated in a very large fraction of tumours from nearly all sources. Phosphatase and tensin homologue (PTEN) is a tumour suppressor gene capable of dephosphorylating phosphatidylinositol 3,4,5-triphosphate (PIP3), the product of phosphatidylinositol 3-kinase. Many of the cancer-related mutations have been mapped to the phosphatase catalytic domain, and it has been suggested that the phosphatase activity of PTEN is required for its tumour suppressor function.42–44 The activation of PKB ⁄ AKT is regulated in a complex manner via phosphorylation of AKT by 3-phosphoinositide-dependent protein kinase-1 (PDK1) and integrin-linked
kinase (ILK), respectively.45 Inactivation of PTEN will constitutively activate the PKB ⁄ AKT pathway. In addition to its role in regulating the PI3–K ⁄ AKT cell survival pathway, PTEN also inhibits growth factorinduced Shc phosphorylation and suppresses the mitogen-activated protein (MAP) kinase signalling pathway. e xt en de d c el l s u rv i v a l ( f i g ur e 4 ) This capability is due to cell-cycle arrest (which is opposed to the capability above), apoptosis dysregulation, and replicative lifespan. Apoptosis dysregulation Apoptosis can be triggered by many different stimuli that result in activation of caspase signalling pathways from extracellular [i.e. tumour necrosis factor (TNF) or FAS pathway] and intracellular (mitochondria) signals. There are also signal pathways (i.e. AKT pathway) regulating these mechanisms.45
2008 The Author. Journal compilation 2008 Blackwell Publishing Ltd, Histopathology, 53, 1–19.
8
S J Diaz-Cano
Figure 4. Molecular pathways involved in the tumour cell acquired capability of extended cell survival.
TNFR1 is the receptor for TNF-a and will also bind TNF-b.46,47 Upon binding TNF-a, a TNFR1+ cell is triggered to undergo apoptosis by activating the proteolytic caspase cascade that results in the degradation of many critical cellular proteins, and by activating Bid, a Bcl-2 family member, which activates mitochondria-mediated apoptosis.48 Mitochondria participate in apoptotic signalling pathways through the release of mitochondrial proteins [cytochrome c, Apaf-1, Smac ⁄ DIABLO, or apoptosis-inducing factor (AIF)] into the cytoplasm.49–51 Cytochrome c activates the protease Apaf-1, which then activates caspase-9 and the rest of its pathway. Smac ⁄ DIABLO inhibits IAP proteins that normally interact with caspase-9 to inhibit apoptosis. AIF released into the cytoplasm induces a non-caspase-dependent apoptosis. Apoptosis regulation by Bcl-2 family proteins occurs as family member complexes enter the mitochondrial membrane, regulating the release of cytochrome c and other proteins. Activated Bax, a Bcl-2 family member, localizes to the mitochondrial membrane and increase
its permeability, whereas Bcl-2 and Bcl-xL prevent pore formation, blocking apoptosis. PIP3 conveys signals to the cytoplasm that activate the kinase PDK1, which in turn activates the kinase AKT, also known as protein kinase B.45 Proteins phosphorylated by activated AKT promote cell survival: phosphorylation of Ij-B kinase leads to activation of the transcription factor NF-jB to oppose apoptosis; phosphorylation of Bad blocks anti-apoptotic activity to promote cell survival; phosphorylation of caspase 9 or forkhead transcription factors block their apoptosis induction. AKT promotes cell survival and opposes apoptosis by a variety of routes.52 The characteristic cellular response of apoptosis is the internucleosomal fragmentation of the nuclear genome to create a DNA ladder pattern, due to activation of multiple nucleases.53 One nuclease involved in apoptosis is DNA fragmentation factor (DFF), a caspase-activated DNase (CAD).54–56 DFF ⁄ CAD is activated through cleavage of its associated inhibitor ICAD by caspase proteases during apoptosis.
2008 The Author. Journal compilation 2008 Blackwell Publishing Ltd, Histopathology, 53, 1–19.
Molecular bases of tumorigenesis
DFF ⁄ CAD interacts with chromatin components such as topo II and histone H1 to condense chromatin structure and perhaps recruit CAD to chromatin. Another apoptosis-activated protease is endonuclease G (EndoG). EndoG is encoded in the nuclear genome, but is localized to mitochondria in normal cells.57,58 EndoG may play a role in the replication of the mitochondrial genome, as well as in apoptosis. Apoptotic signalling causes the release of EndoG from mitochondria. Mitochondria are involved in apoptotic signalling in other ways as well, through the release of cytochrome c induced by Bid to activate the caspase protease cascade. These pathways are independent, since the EndoG pathway still occurs in cells lacking DFF. Replicative lifespan Telomeres, which define the ends of chromosomes, consist of short, tandemly repeated DNA sequences loosely conserved in eukaryotes. Human telomeres consist of many kilobases of (TTAGGG)n together with various associated proteins. Small amounts of these terminal sequences are lost from the chromosome tips during each S phase because of incomplete DNA replication, but de novo addition of TTAGGG repeats by the enzyme telomerase compensates for this loss. Many human cells progressively lose terminal bases with each cell division, a loss that correlates with the apparent absence of telomerase in these cells. There has been considerable interest in the possible relationship between human telomeres and cellular senescence, immortalization, and cancer.59–61 The activation of a telomere maintenance mechanism (TMM) is indispensable for cellular immortalization, a hallmark of human cancer. Telomerase is a ribonucleoprotein complex, which in vitro recognizes a single-stranded G-rich telomere primer and adds multiple telomeric repeats to its 3-prime end by using an RNA template. Telomerase may also have a role in de novo formation of telomeres. Telomerase has been identified in actively dividing cell types. The active reverse transcriptase component has been identified in the TERT protein. The presence of this factor determines the availability of the telomerase function.62 The TERT protein has a high turnover rate and its expression is regulated by factors that promote growth (c-MYC, v-k-ras, Bcl-2 and E6) and inhibiting factors (RB and p53) that promote cell death or that block cell division. It appears that the regulation of active telomerase has many levels and can be inhibited by TEP1 not releasing TERT or by TRF1 which binds the end repeats and prevents access to the chromosome ends.63 Additional modulation is due to
9
phosphorylation by PKC and AKT or dephosphorylation by PP2A. Some human cancers with complex karyotypes, such as specific subtypes of soft tissue sarcomas, astrocytic brain tumours and osteosarcomas, use an alternative lengthening of telomeres (ALT) mechanism as their TMM.64 Some ALT cells have atypical features, suggesting the possibility that there is more than one ALT mechanism. ALT cells are characterized by specific minisatellite instability with stable microsatellites and by high rates of telomeric recombinational exchange. In ALT cells, asymmetrical chromosome segregation and unequal telomeric exchange contribute to telomere length maintenance. In at least some ALT cells, TMM requires the integrity of the MRN (MRE11-RAD50NBS1) recombination complex and is efficiently repressed by its sequestration. Microsatellite instability (MSI) often results in disruption of MRN, so ALT may usually be incompatible with MSI. We suggest that ALT in human tumours is a dysregulated version of an aspect of normal mammalian telomere homeostasis, which may be a vestige of the TMM used by ancient eukaryotes. gen et ic i nsta bility – d na da ma ge an d r e pair (FIGURE 5) The accumulation of genetic alterations is the result of the balance between DNA damage and repair. The main damaging signals are dysfunctional telomeres, replication stress, and the reactive oxygen species (ROS, in particular H2O2), which finally target proteasomes, kinases, phosphatases, cytoskeleton, histones, transcription factors, telomerase and DNA. The DNA damage is variable and ranges from base ⁄ nucleotide abnormalities, mismatch, single- and double-strand breaks. These changes will be detected by sensor mechanisms that through kinases and adaptors activate the effector mechanisms, which restore genomic integrity.65,66 The cellular response to the genetic damage will be apoptosis (when the damage cannot be repaired), cell-cycle arrest (to provide time for repair) and changes in gene expression. One of the most important consequences of this damage ⁄ repair disbalance is tumour genomic instability,40 which has been normally classified in chromosomal and microsatellite instability.67 As regards the signalling pathway, one of the most important systems is the G2 ⁄ M DNA damage checkpoint that prevents the cell from entering mitosis (M phase) if the genome is damaged. The Cdc2-cyclin B kinase is pivotal in regulating this transition. During G2 phase, Cdc2 is maintained in an inactive state by
2008 The Author. Journal compilation 2008 Blackwell Publishing Ltd, Histopathology, 53, 1–19.
10
S J Diaz-Cano
Figure 5. Molecular pathways involved in the tumour cell acquired capability of genetic instability – DNA damage and repair.
the kinases Wee1 and Mt1. As cells approach M phase, the phosphatase Cdc25 is activated, perhaps by the polo-kinase Pik1. Cdc25 then activates Cdc2, establishing a feedback amplification loop that efficiently drives the cell into mitosis. DNA damage activates the DNA-PK ⁄ ATM ⁄ ATR kinases, initiating two parallel cascades that inactivate Cdc2-cyclin B.68,69 The first cascade rapidly inhibits progression into mitosis: the CHK kinases phosphorylate and inactivate Cdc25, which can no longer activate Cdc2. The second cascade is slower. Phosphorylation of p53 dissociates it from MDM2, activating its DNA binding activity. Acetylation by p300 ⁄ PCAF further activates its transcriptional activity. The genes that are turned on by p53 constitute effectors of this second cascade. They include 14-3-3s, which binds to the phosphorylated Cdc2-cyclin B kinase and exports it from the nucleus; GADD45, which apparently binds to and dissociates the Cdc2-cyclin B kinase; and p21Cip1, an inhibitor of a subset of the cyclindependent kinases including Cdc2 (CDK1).
Breast cancer (BRCA) 1 and BRCA2 are involved in the cellular response to DNA damage, including blocking cell cycle progression and inducing DNA repair to preserve the integrity of the genome during cell division.70 BRCA1 and BRCA2 induce doublestranded repair of breaks using homologous recombination, in part through activation of RAD51. BRCA1 acts as a ubiquitin ligase targeting the protein FancD2 that activates checkpoint control, integrating the ATM response to ionizing radiation and the Fanconi anaemia (FA) response to cross-linking agents such as mitomycin C. One member of the FA complex has recently been identified as BRCA2. Another related factor involved in the response of cells to DNA damage is the kinase ATM. Like ATM, ATR serves as a checkpoint kinase that halts cell-cycle progression and induces DNA repair when DNA is damaged. Loss of ATR results in a loss of checkpoint control in response to DNA damage, leading to cell death, and deletion of the ATR gene in mice is embryonic lethal. ATRIP is a protein that interacts with ATR and is a substrate for its kinase activity. ATRIP is
2008 The Author. Journal compilation 2008 Blackwell Publishing Ltd, Histopathology, 53, 1–19.
Molecular bases of tumorigenesis
required for ATR function, and removal of ATRIP also leads to loss of checkpoint control of the cell cycle. ATR and ATM kinase targets include repair enzymes such as Rad51, and the checkpoint kinases Chk1 and Chk2, as well as BRCA1 and BRCA2. m o d i f i c a t i o n s i n ch r o m a t i n , tr a n s c r i p t i o n and epigenetic changes ( figure 6 ) Histone and non-histone proteins package the eukaryotic genome to form chromatin, which is compacted in nucleosomal arrays. Their assembly into higher-order chromatin structures creates a highly restrictive environment for nuclear processes that require access to DNA, resulting in the repression of transcription, replication and repair.41 As counterbalance, a variety of ATP-dependent chromatin remodelling factors facilitate the interaction of proteins such as replication and transcription factors with nucleosomal DNA. ATPdependent chromatin remodelling complexes are char-
11
acterized by the presence of an ATPase subunit from SNF2-like family of the DEAD ⁄ H (SF2) DNA-stimulated ATPases. The highly conservative hSWI ⁄ SNF multisubunit complexes contain hBRM or BRG1 ATPases, which alter the histone–DNA contacts, enabling access of general transcription factors to promoter regions.71 Remodelling complexes are targeted to promoters via interactions with sequence-specific transcription factors. The chromatin packaging of the genome is dynamic, changing with transcriptional regulation and with the cell cycle, whereas the nuclear matrix network provides structure and regulates chromatin condensation. Chromatin is condensed for chromosome segregation during mitosis, whereas chromatin is more open for transcription. Regulated interactions of matrix proteins, DNA and other factors in different cell-cycle phases alter the structure and function of chromatin. Transcription factors that can interact with the repressive chromatin structure and remodel the
Figure 6. Molecular pathways involved in the tumour cell acquired capability of modifications of chromatin, transcription and epigenetic changes. 2008 The Author. Journal compilation 2008 Blackwell Publishing Ltd, Histopathology, 53, 1–19.
12
S J Diaz-Cano
chromatin to allow other transcription factors to bind. In addition to nuclear receptors, transcription activators as c-Myc, HSF1, or EBNA2 have been found to recruit SWI ⁄ SNF to specific promoters. Nuclear receptors recruit an ATP-dependent remodelling hSWI ⁄ SNF complex (BRG1–BAF) to remodel the chromatin.71 The remodelling process converts the closed conformation of the promoter to an open one without altering the nucleosomal positioning. The remodelling of the promoter permits NF1 binding and the assembly of a transcription initiation complex. Initiation of DNA replication in eukaryotes is a highly conserved, multi-step process (replication licensing) designed to restrict initiation events to once per replication origin per S phase. Its control has been uncovered by the discovery of CDKs as master regulators of the cell cycle and the initiator proteins of DNA replication, such as the origin recognition complex (ORC), Cdc6 ⁄ 18, Cdt1 and the mini-chromosome maintenance complex (Mcm). The proteins and the sequence of events involved in this process are conserved throughout the eukaryotic kingdom. First, the ORC comprising six proteins binds to replication origins in the chromosomal DNA. At the end of mitosis, ORC, Cdc6 ⁄ 18 and Cdt1 assist the binding of Mcm proteins 2–7 to chromatin, and chromatin becomes licensed for replication. The activated Mcm complex functions as a replicating helicase and moves along with the replication fork to bring the origins to the unlicensed state. The cycling of CDK activity in the cell cycle regulates the two states of replication origins, the licensed state in G1 phase and the unlicensed state for the rest of the cell cycle. The restriction on licensing is relieved when CDK falls off at the completion of mitosis to allow a new round of replication. Nuclear matrix associated proteins such as AKAP95 bind to PKA (cAMP-dependent protein kinase) through a PKA RII regulatory subunit, an interaction that requires PKA phosphorylation by Cdk1. PKA activity and cAMP are reduced during entry into mitosis, but recruited PKA to condensed chromosomes is essential to maintain the condensed state.72 Other proteins recruited during mitotic chromatin condensation such as Eg7 form part of a multiprotein condensin complex, recruiting another key component of mitotic chromatin condensation.73 Modification of the core histones through phosphorylation regulates chromatin condensation. Histone H3 interacts with the condensin complex and is phosphorylated during mitosis. Histone H3 phosphorylation by Aurora-2 induces chromatin condensation, and dephosphorylation by PP1 promotes chromatin decondensation for re-entry into interphase. Nuclear matrix-associated proteins may
play a role during the regulation of chromatin structure for transcription during interphase also. The interaction with the p68 RNA helicase recruits this enzyme to the nuclear matrix during interphase.74 Other nuclear RNA helicases interact with transcription factors and cofactors, suggesting that the p68 RNA helicase also may regulate interactions of transcription complexes. e pi g en et ic s Tumorigenesis is known to be a multistep process that accumulates defects in various cancer genes. Epigenetic modifications, most importantly DNA methylation events, are frequently involved in transcriptional changes in both tumour suppressor genes and oncogenes.75 DNA methylation of gene promoter regions (generally at CpG dinucleotides) is generally correlated with gene silencing due to two underlying mechanisms.41 First, binding of transcription factors or enhancer blocking elements, such as CTCF, may be inhibited by DNA methylation. The second and more general mechanism involves proteins that detect methylated DNA through methyl CpG-binding domains (MBDs). These proteins mediate recruitment of repressor complexes that include histone deacetylases (HDACs). HDACs remove acetyl groups from lysine residues of histones H3 and H4, which results in condensation of chromatin and thus limits access of transcription factors to promoter regions of genes localized nearby. Co-repressor complexes specifically bind methylated DNA, and copurify with the Sin3A/ HDAC corepressor complex. The two main protein complexes share four polypeptides (HDAC1, HDAC2, RbAp46 and RbAp48) and contain unique polypeptides (Sin3A, SAP30 and SAP18 in the Sin3 complex, and Mi2, metastasis-associated protein (MTA) 1, MTA2 and MBD3 in the NuRD complex). The NuRD complex possesses nucleosome-remodelling activity because of the presence of Mi2, a member of the SWI2 ⁄ SNF2 helicase ⁄ ATPase family.76 This complex preferentially binds, remodels and deacetylates methylated nucleosomes. MTA1 or MTA2 expression levels are elevated in metastatic cancer cells; MTA2 modulates the enzymatic activity of the histone deacetylase core complex.77,78 Transcription repression is also related to nuclear receptors (such as RXR and RAR). Once retinoic acid binds the receptors, a receptor conformational change causes the dissociation of the corepressors and the binding of coactivators with histone acetylase activity. Following ligand binding by the heterodimer, the receptors and proteins in the basal transcription
2008 The Author. Journal compilation 2008 Blackwell Publishing Ltd, Histopathology, 53, 1–19.
Molecular bases of tumorigenesis
machinery (such as TBP and TAF135) are degraded by the proteasome. mo b i l i z a t i o n o f c e l l u l a r r e s o u r c e s ( f i gu r e s 7 and 8 ) Neoplastic transformation requires adequate machinery for protein synthesis and the provision of energy for the active process of signalling and control of the acquired cell capabilities. In this sense, protein synthesis–ribosomes (Figure 7) and mitochondria (Figure 8) are going to play a central role in neoplastic transformation. Protein synthesis–ribosomes mTOR and MAP kinase signalling pathways modulate the phosphorylation of translation factors, and the association of RNA-binding proteins with specific mRNAs.79,80 These effects contribute both to overall control of protein synthesis and to modulation of the translation or stability of specific mRNAs. eIF4E plays
13
an important role in human cancers, being expressed at high levels in many cancers, which correlate positively with tumour aggressiveness. eIF4E represses apoptosis and promotes the translation of the mRNAs for proteins with roles in cell-cycle progression (e.g. cyclin D1), cell transformation (e.g. ornithine decarboxylase), tumour vascularization (e.g. VEGF) or metastasis [e.g. matrix metalloproteinase (MMP)-9]. eIF4E increases the cytoplasmic levels of the cyclin D1mRNA, apparently involving a feature in the 3¢-UTR of the cyclin D1 mRNA, rather than the cap-binding function of eIF4E, which is thought to allow eIF4E to promote transport of the cyclin D1 mRNA from the nucleus to the cytoplasm. Such a function would require eIF4E to spend some time in the nucleus, and indeed a proportion of the total cellular eIF4E is found in the nuclear fraction. The existence of the S6K-based negative-feedback loop means that mTOR blocking will probably lead to enhanced PI(3)K–AKT activation in some tumours. Depending on other mutations found in the tumour,
Figure 7. Molecular pathways involved in the tumour cell acquired capability of mobilization of cellular resources – ribosomes (protein synthesis). 2008 The Author. Journal compilation 2008 Blackwell Publishing Ltd, Histopathology, 53, 1–19.
14
S J Diaz-Cano
Figure 8. Molecular pathways involved in the tumour cell acquired capability of mobilization of cellular resources – mitochondria (ATP synthesis, apoptosis, reactive oxygen species and damage).
this hyperactivation of PI(3)K–AKT signalling could make the tumour more aggressive. The critical function of the mTORC1 complex required for cell growth is activation of eIF4E. Because eIF4E transcription is controlled by multiple signalling inputs, resistance to rapamycin might develop by a variety of paths that will depend on the genetic background of the tumour. A critical target for tumour cell growth and survival is the activation of eIF4E and hypoxia inducible factor (HIF). Tumours with initiating mutations in RTKs, Ras or Raf have multiple routes to signal to eIF4E and HIF. In contrast, tumours with initiating lesions in PI(3)K or more direct regulators of mTOR (such as LKB1 and TSC) do not have alternative routes to activate eIF4E and HIF. Hence, these tumours show greater response to rapamycin. Similarly, the expression and use of specific adaptor proteins that enhance certain arms of pathway signalling will dictate the therapeutic response. More broadly, identifying the primary mechanisms by which the PI(3)K pathway is activated in a given
tumour should facilitate the choice of potential interventions. For tumours bearing Ras mutations, defining the critical downstream effector in each given tissue context is essential. In some settings where Raf has been assumed to be critical, its effectors must be evaluated: Raf mutations are common and mutually exclusive with N-ras mutations or loss of PTEN. So in these tissues testing these critical effectors may be critical in tumorigenesis. Conversely, there is also clear evidence for both synergy and redundancy between Raf and PI(3)K-mediated signalling on specific biochemical effectors. Activation of mTORC1 activity can be mediated by distinct phosphorylation events on tuberin by ERK and RSK, as well as by AKT. The cell-death effector BAD is also inhibited by both of these pathways. In addition, given the close similarity of the RSK and AKT kinase domains, it is possible that both can phosphorylate the same sites on some target proteins, such as GSK-3 or even tuberin. The availability of eIF4E controlled by signalling through mTOR provides one probable
2008 The Author. Journal compilation 2008 Blackwell Publishing Ltd, Histopathology, 53, 1–19.
Molecular bases of tumorigenesis
link between mTOR signalling and tumorigenesis ⁄ cell proliferation.81,82 ATP synthesis–mitochondria Mutations in nuclear DNA or mtDNA OXPHOS genes that impede electron flow increase mitochondrial ROS production.83–87 The resulting H2O2, which is relatively stable, diffuses out of the mitochondrion, through the cytosol and into the nucleus, activating normally inactive genes and inducing nuclear DNA mutations. The resulting nuclear DNA damage activates the nuclear DNA repair systems, including the polyADPribose polymerase (PARP). The activated PARP degrades the nuclear nicotinamide adenine dinucleotide (NAD)+ in the process of adding poly ADP-ribose chains to histones and other nuclear proteins. The degradation of the nuclear NAD+, together with the high NADH ⁄ NAD+ ratio, inactivates histone deacetylase, and nuclear transcription is repressed by the deacetylation of histones and activated by histone acetylation. Therefore, histone acetylation turns on the transcription of normally inactive genes. In postmitotic tissues, histone acetylation permits the activation of the genes that regulate cell replication and differentiation, the proto-oncogenes. Nuclear H2O2 can mutate proto-oncogenes, converting them into functional oncogenes. Moreover, increased cytosolic and nuclear H2O2 activates a variety of cellular signal transduction factors, including NF-jB, apurinic ⁄ apyrimidinic endonuclease (APE)-1, Fos, Jun and tyrosine kinases. This drives the cell into replication. Consequently, mutations in mitochondrial genes that inhibit electron flow result in chronically increased mitochondrial ROS production, which can act as both a tumour initiator (mutation of proto-oncogenes) and tumour promoter (activation of transcription and replication).85,88,89 Gene defects in certain nuclear DNA-encoded mitochondrial genes have been directly linked to some hereditary cancers.83–87 Mutations in mitochondrial fumarate hydratase have been associated with uterine leiomyomas and renal cell carcinomas, and mutations in three of the four nuclear DNA-encoded subunits of complex II have been linked to paragangliomas: SDHD, SDHC and SDHB subunit. In addition, mutations in the SDHB subunit are also associated with pheochromocytoma and early-onset renal cell carcinoma. The striking difference in clinical effects of SDHA subunit mutations versus SDHB, C and D mutations strongly implicates mitochondrial ROS production in the aetiology of cancer. Transformation of certain tumours with the MnSOD cDNA can reverse the malignant phenotype, and a cluster of three mutations in the MnSOD
15
gene promoter region that alter AP-2 binding and promoter efficiency is found in a number of tumours. Moreover, ROS production in association with the inactivation of p16ink4a has been hypothesized to be one of the two main mechanisms for tumorigenesis; the other is p53 deficiency. Mitochondrial DNA mutations that inhibit OXPHOS and impede electron flow should increase ROS production and contribute to cancer.83–87 Mitochondrial ROS could contribute to neoplastic transformation, both as a tumour initiator by causing nuclear DNA mutations in proto-oncogenes and tumour-suppressor genes, and as a tumour promoter through driving cellular proliferation. At low levels, ROS has been found to be an active mitogen, thought to act though interaction with various kinases (Src kinase, protein kinase C, MAPK, and receptor tyrosine kinases), as well as with different transcription factors (Fos, Jun, NF-jB). Furthermore, the dual-function APE-1 functions not only in the DNA base excision pathway but also in the redox regulation of the transcription factors Fos, Jun, NF-jB, PAX, HIF-1a and p53. Moreover, the role of mitochondrial defects in the pathophysiology of cancer would appear to be the generation of increased ROS, which acts as both a nuclear DNA mutagen and cellular mitogen. Since mitochondrial mutations that increase ROS would result in the accumulation within the cell of unoxidized NADH and pyruvate, the excess NADH and pyruvate would then be converted to lactate by lactate dehydrogenase, also described as aerobic-glycolysis. Mitochondrial damage is the result of nuclear or mitochondrial DNA damage that affects the electron transport chain and ATP production, which express morphologically as mitochondrial hyperplasia (oncocytic changes ⁄ metaplasia).90–92 In tumour pathology, the timing between the neoplastic-inducing damage and the mitochondrial damage is important. Mitochondrial damage preceding neoplastic-inducing damage will result in oncocytic neoplasms, whereas the opposite scenario gives neoplasms with oncocytic differentiation (normally focal). m od i f i e d m i c r o e n v ironme nt interactions – i n v a s i o n a n d a n g i og e n e s i s ( F I G U R E S 1 A N D 2 ) Cellular transformation is accompanied by many cellular changes, including loss of the differentiated cell morphology and invasion of the extracellular matrix. These processes are dependent on cellular and stromal interactions and on extracellular matrix degradation.20 Cellular interactions responsible for cell–cell adhesion also can communicate signals, often involving interactions with cytoskeletal elements, to produce
2008 The Author. Journal compilation 2008 Blackwell Publishing Ltd, Histopathology, 53, 1–19.
16
S J Diaz-Cano
changes in cell motility, migration, proliferation and shape.21,93,94 The cadherins are cell-surface adhesion molecules that help form tight junctions between cells, such as formation of epithelial cell layers. In addition to mediating adhesion with other cells, cadherins transduce signals into cells through interactions with the catenins.23 Catenins probably affect actin cytoskeletal function through interactions with proteins such as actinin and vinculin. Catenins also probably trigger changes in cell shape and motility with signals through the Rho small GTPases. Paxillin acts as an adaptor protein between proteins involved in adhesion signalling such as FAK and src and cytoskeletal elements. In addition to signals created by adhesion molecules to alter cellular responses, other signalling pathways can alter adhesion through components of the focal adhesion complex. Extracellular matrix interactions depend on integrins, cell-surface receptors that mediate intracellular signals to control cellular shape, motility and progression through the cell cycle.95,96 Integrins do not themselves possess a kinase domain or enzymatic activity, but rely on association with other signalling molecules to transmit signals. Interactions between the extracellular matrix and the actin cytoskeleton commonly take place at focal adhesions on the cell surface that contain localized concentrations of integrins, signalling molecules and cytoskeletal elements. Talin forms a direct interaction with the integrin cytoplasmic domain, and interacts with cytoskeletal elements (actin) and signalling factors. Paxillin and Crk-associated substrate (CAS) also localize in focal adhesions and may serve as a scaffold for other integrin signalling components such as FAK and src. Interaction of FAK, CAS and src may be required for integrin regulation of cell-cycle progression. The CrkL adaptor protein may regulate downstream integrin signalling. Growth factor signalling pathways and the caveolin receptor exhibit important crosstalk with integrin receptors in cellular responses such as activation of map kinase, proliferation and motility. PTEN also interact with FAK, a key molecule implicated in integrin signalling pathways, and it directly dephosphorylates tyrosine-phosphorylated FAK. PTEN down-regulation of p130CAS through FAK results in inhibition of cell migration and spreading. Extracellular matrix degradation is a key component of tumour cell invasion into surrounding tissues. MMPs are a class of proteases secreted by tumour cells, degrading extracellular matrix proteins and allowing metastasis.97,98 RECK is a membrane-anchored inhibitor of MMPs, inhibiting MMP-2, MMP-9 and MT1MMP.99 The processing of MMPs to their active form occurs at the plasma membrane, making the localiza-
tion of RECK at the membrane a key to its potent activity as an inhibitor of MMP activity.100 Soluble secreted MMP inhibitors have also been identified, TIMPs, which appear to be less active at inhibiting MMPs and even perhaps to be essential for MMP maturation. The inhibition of MMPs inhibits tissue invasion, metastasis and tumour angiogenesis, and is essential for angiogenesis, inflammation and normal development. RECK expression is inhibited by ras, suggesting one component by which ras induces transformation. High levels of RECK expression in tumours is correlated with cancer patient survival, and overexpression of RECK may offer a therapeutic strategy for the control of cancer.
Conclusions The application of these concepts in oncological pathology leads to consideration of the molecular test requirements (Molecular Test Score System) for a reliable implementation, which covers biological effects (1–3), molecular pathway (4, 5), biological validation (6–8) and technical validation (9, 10). 1 As tumours are the result of multiple and cooperative genetic abnormalities, tests should be assessing more than one acquired capability. 2 Genetic targets are more likely to be useful if they are involved in more than one acquired capability. 3 Selected targets must be testing both initiation (including tests for clonality and fractional allelic loss) and promotion ⁄ progression of tumours in a given location. 4 Molecular pathways are redundant and overlap in several markers that will potentially be the most informative. 5 Molecular markers can be pleiotropic and their effects will be observed in different pathways (biological consequences). 6 The effects of each marker ⁄ target must be evaluated in view of the pathway (both upstream and downstream markers), including the appropriate surrogate markers to validate the expected results. 7 Markers from mutually exclusive pathways must be tested simultaneously for consistency of results. 8 Molecular tumour assessment must be based on the selection of sensible markers, single tests being generally insufficient. 9 Tumours must be tested using samples from at least two areas that should be covering any topographic heterogeneity demonstrated in neoplasms. 10 Samples should be run in duplicate to check consistency of results and must include positive, negative and sensitivity controls.
2008 The Author. Journal compilation 2008 Blackwell Publishing Ltd, Histopathology, 53, 1–19.
Molecular bases of tumorigenesis
Competing interests None to declare.
References 1. Hanahan D, Weinberg RA. The hallmarks of cancer. Cell 2000; 100; 57–70. 2. Blanes A, Diaz-Cano SJ. DNA and kinetic heterogeneity during the clonal evolution of adrenocortical proliferative lesions. Hum. Pathol. 2006; 37; 1295–1303. 3. Blanes A, Rubio J, Martinez A, Wolfe HJ, Diaz-Cano SJ. Kinetic profiles by topographic compartments in muscle-invasive transitional cell carcinomas of the bladder: role of TP53 and NF1 genes. Am. J. Clin. Pathol. 2002; 118; 93–100. 4. Diaz-Cano SJ, Blanes A, Wolfe HJ. PCR techniques for clonality assays. Diagn. Mol. Pathol. 2001; 10; 24–33. 5. Diaz-Cano SJ, de Miguel M, Blanes A, Tashjian R, Galera H, Wolfe HJ. Clonality as expression of distinctive cell kinetics patterns in nodular hyperplasias and adenomas of the adrenal cortex. Am. J. Pathol. 2000; 156; 311–319. 6. Pozo-Garcia L, Diaz-Cano SJ. Clonal origin and expansions in neoplasms: biologic and technical aspects must be considered together. Am. J. Pathol. 2003; 162; 353–354; author reply 354–355. 7. Kinzler KW, Vogelstein B. Lessons from hereditary colorectal cancer. Cell 1996; 87; 159–170. 8. Diaz-Cano SJ, de Miguel M, Blanes A, Tashjian R, Wolfe HJ. Germline RET 634 mutation positive MEN 2A-related C-cell hyperplasias have genetic features consistent with intraepithelial neoplasia. J. Clin. Endocrinol. Metab. 2001; 86; 3948–3957. 9. Mears L, Diaz-Cano SJ. Difference between familial and sporadic medullary thyroid carcinomas. Am. J. Surg. Pathol. 2003; 27; 266–267. 10. Alizadeh AA, Eisen MB, Davis RE et al. Distinct types of diffuse large B-cell lymphoma identified by gene expression profiling. Nature 2000; 403; 503–511. 11. Bittner M, Meltzer P, Chen Y et al. Molecular classification of cutaneous malignant melanoma by gene expression profiling. Nature 2000; 406; 536–540. 12. Dhanasekaran SM, Barrette TR, Ghosh D et al. Delineation of prognostic biomarkers in prostate cancer. Nature 2001; 412; 822–826. 13. Ahr A, Holtrich U, Solbach C et al. Molecular classification of breast cancer patients by gene expression profiling. J. Pathol. 2001; 195; 312–320. 14. Alizadeh AA, Ross DT, Perou CM, van de Rijn M. Towards a novel classification of human malignancies based on gene expression patterns. J. Pathol. 2001; 195; 41–52. 15. Carvajal-Carmona LG, Howarth KM, Lockett M et al. Molecular classification and genetic pathways in hyperplastic polyposis syndrome. J. Pathol. 2007; 212; 378–385. 16. Harris AL. Hypoxia – a key regulatory factor in tumour growth. Nat. Rev. Cancer 2002; 2; 38–47. 17. Li F, Tiede B, Massague J, Kang Y. Beyond tumorigenesis: cancer stem cells in metastasis. Cell Res. 2007; 17; 3–14. 18. Keith B, Simon MC. Hypoxia-inducible factors, stem cells, and cancer. Cell 2007; 129; 465–472. 19. Semenza GL. HIF-1, O(2), and the 3 PHDs: how animal cells signal hypoxia to the nucleus. Cell 2001; 107; 1–3. 20. Gupta GP, Massague J. Cancer metastasis: building a framework. Cell 2006; 127; 679–695.
17
21. Kang Y, Massague J. Epithelial–mesenchymal transitions: twist in development and metastasis. Cell 2004; 118; 277–279. 22. Brabletz T, Jung A, Spaderna S, Hlubek F, Kirchner T. Opinion: migrating cancer stem cells – an integrated concept of malignant tumour progression. Nat. Rev. Cancer 2005; 5; 744–749. 23. Nguyen DX, Massague J. Genetic determinants of cancer metastasis. Nat. Rev. Genet. 2007; 8; 341–352. 24. Diaz-Cano SJ, Blanes A, Rubio J, Matilla A, Wolfe HJ. Molecular evolution and intratumor heterogeneity by topographic compartments in muscle-invasive transitional cell carcinoma of the urinary bladder. Lab. Invest. 2000; 80; 279–289. 25. Blanes A, Sanchez-Carrillo JJ, Diaz-Cano SJ. Topographic molecular profile of pheochromocytomas: role of somatic down-regulation of mismatch repair. J. Clin. Endocrinol. Metab. 2006; 91; 1150–1158. 26. Arif S, Patel J, Blanes A, Diaz-Cano SJ. Cytoarchitectural and kinetic features in the histological evaluation of follicular thyroid neoplasms. Histopathology 2007; 50; 750–763. 27. Diaz-Cano SJ. Kinetic topographical heterogeneity in follicular thyroid neoplasms and growth patterns. Histopathology 2007; 51; 416–418. 28. Pozo L, Sanchez-Carrillo J, Martinez A, Blanes A, Diaz-Cano S. Differential kinetic features by tumour topography in cutaneous small-cell neuroendocrine (Merkel cell) carcinomas. J. Eur. Acad. Dermatol. Venereol. 2007; 21; 1220–1228. 29. Rubio J, Blanes A, Sanchez-Carrillo JJ, Diaz-Cano SJ. Microsatellite abnormalities and somatic down-regulation of mismatch repair characterize nodular-trabecular muscle-invasive urothelial carcinoma of the bladder. Histopathology 2007; 51; 458– 467. 30. Kinzler KW, Vogelstein B. Landscaping the cancer terrain. Science 1998; 280; 1036–1037. 31. Kaldis P. Another piece of the p27Kip1 puzzle. Cell 2007; 128; 241–244. 32. Kim WY, Sharpless NE. The regulation of INK4 ⁄ ARF in cancer and aging. Cell 2006; 127; 265–275. 33. Campisi J. Senescent cells, tumor suppression, and organismal aging: good citizens, bad neighbors. Cell 2005; 120; 513–522. 34. Sherr CJ. Cancer cell cycles. Science 1996; 274; 1672–1677. 35. Derynck R, Zhang Y, Feng XH. Smads: transcriptional activators of TGF-beta responses. Cell 1998; 95; 737–740. 36. Shi Y, Massague J. Mechanisms of TGF-beta signaling from cell membrane to the nucleus. Cell 2003; 113; 685–700. 37. Bar-Sagi D, Hall A. Ras and Rho GTPases: a family reunion. Cell 2000; 103; 227–238. 38. Yaswen P, Campisi J. Oncogene-induced senescence pathways weave an intricate tapestry. Cell 2007; 128; 233–234. 39. Levine AJ. p53, the cellular gatekeeper for growth and division. Cell 1997; 88; 323–331. 40. Lombard DB, Chua KF, Mostoslavsky R, Franco S, Gostissa M, Alt FW. DNA repair, genome stability, and aging. Cell 2005; 120; 497–512. 41. Sherr CJ. Principles of tumor suppression. Cell 2004; 116; 235–246. 42. Baker SJ. PTEN enters the nuclear age. Cell 2007; 128; 25–28. 43. Di Cristofano A, Pandolfi PP. The multiple roles of PTEN in tumor suppression. Cell 2000; 100; 387–390. 44. Rossi DJ, Weissman IL. Pten, tumorigenesis, and stem cell selfrenewal. Cell 2006; 125; 229–231. 45. Manning BD, Cantley LC. AKT ⁄ PKB signaling: navigating downstream. Cell 2007; 129; 1261–1274.
2008 The Author. Journal compilation 2008 Blackwell Publishing Ltd, Histopathology, 53, 1–19.
18
S J Diaz-Cano
46. Locksley RM, Killeen N, Lenardo MJ. The TNF and TNF receptor superfamilies: integrating mammalian biology. Cell 2001; 104; 487–501. 47. Varfolomeev EE, Ashkenazi A. Tumor necrosis factor: an apoptosis JuNKie? Cell 2004; 116; 491–497. 48. Harris MH, Thompson CB. The role of the Bcl-2 family in the regulation of outer mitochondrial membrane permeability. Cell Death Differ. 2000; 7; 1182–1191. 49. Joza N, Susin SA, Daugas E et al. Essential role of the mitochondrial apoptosis-inducing factor in programmed cell death. Nature 2001; 410; 549–554. 50. Shi Y. A structural view of mitochondria-mediated apoptosis. Nat. Struct. Biol. 2001; 8; 394–401. 51. Srinivasula SM, Hegde R, Saleh A et al. A conserved XIAPinteraction motif in caspase-9 and Smac ⁄ DIABLO regulates caspase activity and apoptosis. Nature 2001; 410; 112–116. 52. Brazil DP, Park J, Hemmings BA. PKB binding proteins. Getting in on the Akt. Cell 2002; 111; 293–303. 53. Zhang J, Xu M. Apoptotic DNA fragmentation and tissue homeostasis. Trends Cell Biol. 2002; 12; 84–89. 54. Enari M, Sakahira H, Yokoyama H, Okawa K, Iwamatsu A, Nagata S. A caspase-activated DNase that degrades DNA during apoptosis, and its inhibitor ICAD. Nature 1998; 391; 43–50. 55. Sakahira H, Enari M, Nagata S. Cleavage of CAD inhibitor in CAD activation and DNA degradation during apoptosis. Nature 1998; 391; 96–99. 56. Durrieu F, Samejima K, Fortune JM, Kandels-Lewis S, Osheroff N, Earnshaw WC. DNA topoisomerase IIalpha interacts with CAD nuclease and is involved in chromatin condensation during apoptotic execution. Curr. Biol. 2000; 10; 923–926. 57. Li LY, Luo X, Wang X. Endonuclease G is an apoptotic DNase when released from mitochondria. Nature 2001; 412; 95–99. 58. Parrish J, Li L, Klotz K, Ledwich D, Wang X, Xue D. Mitochondrial endonuclease G is important for apoptosis in C. elegans. Nature 2001; 412; 90–94. 59. Chang S, DePinho RA. Telomerase extracurricular activities. Proc. Natl Acad Sci USA 2002; 99; 12520–12522. 60. Shay JW, Zou Y, Hiyama E, Wright WE. Telomerase and cancer. Hum. Mol. Genet. 2001; 10; 677–685. 61. Wang J, Hannon GJ, Beach DH. Risky immortalization by telomerase. Nature 2000; 405; 755–756. 62. Stewart SA, Hahn WC, O’Connor BF et al. Telomerase contributes to tumorigenesis by a telomere length-independent mechanism. Proc. Natl Acad Sci USA 2002; 99; 12606–12611. 63. Okabe J, Eguchi A, Masago A, Hayakawa T, Nakanishi M. TRF1 is a critical trans-acting factor required for de novo telomere formation in human cells. Hum. Mol. Genet. 2000; 9; 2639–2650. 64. Muntoni A, Reddel RR. The first molecular details of ALT in human tumor cells. Hum. Mol. Genet. 2005; 2; R191–R196. 65. Rouse J, Jackson SP. Interfaces between the detection, signaling, and repair of DNA damage. Science 2002; 297; 547–551. 66. Zhou BB, Elledge SJ. The DNA damage response: putting checkpoints in perspective. Nature 2000; 408; 433–439. 67. Blanes A, Diaz-Cano SJ. Complementary analysis of microsatellite tumor profile and mismatch repair defects in colorectal carcinomas. World J. Gastroenterol. 2006; 12; 5932–5940. 68. Cortez D, Guntuku S, Qin J, Elledge SJ. ATR and ATRIP: partners in checkpoint signaling. Science 2001; 294; 1713–1716. 69. Taniguchi T, Garcia-Higuera I, Xu B et al. Convergence of the fanconi anemia and ataxia telangiectasia signaling pathways. Cell 2002; 109; 459–472. 70. Venkitaraman AR. Cancer susceptibility and the functions of BRCA1 and BRCA2. Cell 2002; 108; 171–182.
71. Gibbons RJ. Histone modifying and chromatin remodelling enzymes in cancer and dysplastic syndromes. Hum. Mol. Genet. 2005; 14 Spec No 1; R85–R92. 72. Murnion ME, Adams RR, Callister DM, Allis CD, Earnshaw WC, Swedlow JR. Chromatin-associated protein phosphatase 1 regulates aurora-B and histone H3 phosphorylation. J. Biol. Chem. 2001; 276; 26656–26665. 73. Ball AR Jr, Schmiesing JA, Zhou C et al. Identification of a chromosome-targeting domain in the human condensin subunit CNAP1 ⁄ hCAP-D2 ⁄ Eg7. Mol. Cell. Biol. 2002; 22; 5769–5781. 74. Akileswaran L, Taraska JW, Sayer JA, Gettemy JM, Coghlan VM. A-kinase-anchoring protein AKAP95 is targeted to the nuclear matrix and associates with p68 RNA helicase. J. Biol. Chem. 2001; 276; 17448–17454. 75. Plass C. Cancer epigenomics. Hum. Mol. Genet. 2002; 11; 2479–2488. 76. Dilworth FJ, Chambon P. Nuclear receptors coordinate the activities of chromatin remodeling complexes and coactivators to facilitate initiation of transcription. Oncogene 2001; 20; 3047–3054. 77. Feng Q, Zhang Y. The MeCP1 complex represses transcription through preferential binding, remodeling, and deacetylating methylated nucleosomes. Genes Dev. 2001; 15; 827–832. 78. Nan X, Ng HH, Johnson CA et al. Transcriptional repression by the methyl-CpG-binding protein MeCP2 involves a histone deacetylase complex. Nature 1998; 393; 386–389. 79. Schmelzle T, Hall MN. TOR, a central controller of cell growth. Cell 2000; 103; 253–262. 80. Proud CG. Signalling to translation: how signal transduction pathways control the protein synthetic machinery. Biochem. J. 2007; 403; 217–234. 81. Shaw RJ, Cantley LC. Ras, PI(3)K and mTOR signalling controls tumour cell growth. Nature 2006; 441; 424–430. 82. West MJ, Stoneley M, Willis AE. Translational induction of the c-myc oncogene via activation of the FRAP ⁄ TOR signalling pathway. Oncogene 1998; 17; 769–780. 83. Broker LE, Kruyt FA, Giaccone G. Cell death independent of caspases: a review. Clin. Cancer Res. 2005; 11; 3155–3162. 84. Henry-Mowatt J, Dive C, Martinou JC, James D. Role of mitochondrial membrane permeabilization in apoptosis and cancer. Oncogene 2004; 23; 2850–2860. 85. Modica-Napolitano JS, Kulawiec M, Singh KK. Mitochondria and human cancer. Curr. Mol. Med. 2007; 7; 121–131. 86. Singh KK. Mitochondrial dysfunction is a common phenotype in aging and cancer. Ann. NY Acad. Sci. 2004; 1019; 260–264. 87. Wallace DC. A mitochondrial paradigm of metabolic and degenerative diseases, aging, and cancer: a dawn for evolutionary medicine. Annu. Rev. Genet. 2005; 39; 359–407. 88. Irminger-Finger I. Science of cancer and aging. J. Clin. Oncol. 2007; 25; 1844–1851. 89. Neuzil J, Stantic M, Zobalova R et al. Tumour-initiating cells vs. cancer ‘stem’ cells and CD133: What’s in the name? Biochem. Biophys. Res. Commun. 2007; 355; 855–859. 90. Maximo V, Botelho T, Capela J et al. Somatic and germline mutation in GRIM-19, a dual function gene involved in mitochondrial metabolism and cell death, is linked to mitochondrion-rich (Hurthle cell) tumours of the thyroid. Br. J. Cancer 2005; 92; 1892–1898. 91. Maximo V, Soares P, Lima J, Cameselle-Teijeiro J, SobrinhoSimoes M. Mitochondrial DNA somatic mutations (point mutations and large deletions) and mitochondrial DNA variants in human thyroid pathology: a study with emphasis on Hurthle cell tumors. Am. J. Pathol. 2002; 160; 1857–1865.
2008 The Author. Journal compilation 2008 Blackwell Publishing Ltd, Histopathology, 53, 1–19.
Molecular bases of tumorigenesis
92. Sobrinho-Simoes M, Maximo V, Castro IV et al. Hurthle (oncocytic) cell tumors of thyroid: etiopathogenesis, diagnosis and clinical significance. Int. J. Surg. Pathol. 2005; 13; 29–35. 93. Arias AM. Epithelial mesenchymal interactions in cancer and development. Cell 2001; 105; 425–431. 94. Gumbiner BM. Cell adhesion: the molecular basis of tissue architecture and morphogenesis. Cell 1996; 84; 345–357. 95. Muthuswamy SK. ErbB2 makes beta 4 integrin an accomplice in tumorigenesis. Cell 2006; 126; 443–445. 96. Burridge K, Wennerberg K. Rho and Rac take center stage. Cell 2004; 116; 167–179.
19
97. Blobel CP. Metalloprotease-disintegrins: links to cell adhesion and cleavage of TNF alpha and Notch. Cell 1997; 90; 589–592. 98. Montell DJ. Anchors away! Fos fosters anchor-cell invasion. Cell 2005; 121; 816–817. 99. Oh J, Takahashi R, Kondo S et al. The membrane-anchored MMP inhibitor RECK is a key regulator of extracellular matrix integrity and angiogenesis. Cell 2001; 107; 789–800. 100. Takahashi C, Sheng Z, Horan TP et al. Regulation of matrix metalloproteinase-9 and inhibition of tumor invasion by the membrane-anchored glycoprotein RECK. Proc. Natl Acad Sci USA 1998; 95; 13221–13226.
2008 The Author. Journal compilation 2008 Blackwell Publishing Ltd, Histopathology, 53, 1–19.