Next Move Strategy Consulting · Investor Edition · 2026
HVAC Systems Market Global Strategic Outlook · 2025–2034
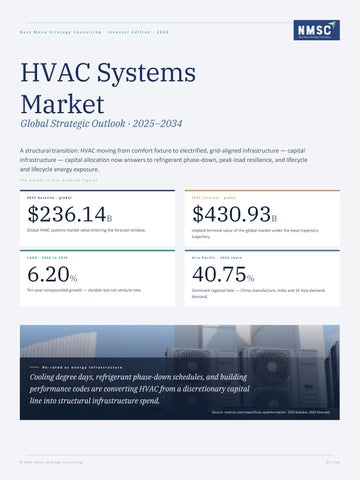
A structural transition: HVAC moving from comfort fixture to electrified, grid-aligned infrastructure — capital infrastructure — capital allocation now answers to refrigerant phase-down, peak-load resilience, and lifecycle and lifecycle energy exposure. The market in four headline figures
2025 baseline · global
2035 forecast · global
$236.14B
$430.93B
Global HVAC systems market value entering the forecast window.
Implied terminal value of the global market under the base trajectory. trajectory.
CAGR · 2026 to 2035
Asia-Pacific · 2025 share
6.20%
40.75%
Ten-year compounded growth — durable but not venture-rate.
Dominant regional bloc — China manufacture, India and SE Asia demand. demand.
Re-rated as energy infrastructure
Cooling degree days, refrigerant phase-down schedules, and building performance codes are converting HVAC from a discretionary capital line into structural infrastructure spend.
© Next Move Strategy Consulting
01 / 06
02 · Market Landscape & Segmentation
A $250B market reshaping itself three ways at once. Decentralised residential units still anchor the volume base, but the value is migrating toward inverter-driven, high-efficiency, and connected systems — and toward Asia-Pacific manufacturing depth. How the 2025 market is composed
Equipment · leading
System architecture · leading
Technology · leading share
Split air-conditioners — residential penetration and and modular deployment.
Decentralised systems dominate — phased capital, capital, modular scale.
Inverter-driven — now embedded as procurement default, not premium.
31.42%
52.85%
End user · residential
48.78%
45.74% End user · commercial
Largest share in unit volume; cooling penetration penetration rising across APAC.
Faster value growth Healthcare, hospitality, data centres — performance guarantees anchor higher ACVs and and recurring service revenue.
Regional split — 2025 share & forecast CAGR
Region
Asia-Pacific China · India · Japan · SE Asia
North America US · Canada
Europe UK · Germany · France · Italy · Spain · Nordics
Middle East & Africa GCC district cooling, African electrification
Latin America Brazil · Mexico · Argentina · Chile
2025 share of revenue
Forecast CAGR
Lead
40.75%
6.8%
Largest
24.53%
5.8%
Mature
22.15%
Steady
6.29%
6.85%
Fastest
~6%
6.10%
Emerging
Policy-led
Reading the splits together
APAC carries the volume, North America the replacement value, Europe the regulatory cadence, MEA the highest velocity — segment growth stories are not interchangeable across regions.
© Next Move Strategy Consulting
02 / 06
03 · Growth Drivers & Opportunities
Four durable forces, each lifting the CAGR one notch at a time. Demand is no longer discretionary. Cooling degree days, refrigerant phase-down, electrification mandates, and connected platforms are converting HVAC into compliance-led, infrastructure-grade spend. Quantified drivers · CAGR delta in pts
+1.4 pts
Short to medium term
+1.2 pts
Medium term
Rising cooling demand
Electrification of heating
Urbanisation and climbing cooling degree days across APAC, MEA and the southern US push southern US push cooling infrastructure into baseline — not premium — design design specification.
Heat-pump and air-to-water adoption reposition heating as compliance-aligned aligned decarbonisation infrastructure rather than mechanical replacement. Europe + NA core · rising in China & Japan
APAC dominant · MEA high intensity · Southern US
+0.9 pts
Medium term
+0.8 pts
Medium term
Efficiency & refrigerant phase-down
Smart HVAC, IoT & predictive service
Stricter SEER / MEPS standards and low-GWP transition (Kigali, F-gas, AIM Act) compress compress replacement cycles and reset shortlisting criteria toward measurable efficiency. efficiency.
Cloud monitoring, AI-enabled diagnostics, and BMS integration shift HVAC economics from economics from equipment sale toward lifecycle performance contracts and recurring recurring service revenue.
Europe strongest · NA & Japan aligned
NA · Europe · South Korea · Singapore
High-conviction regional opportunities
Asia-Pacific
Volume + manufacturing depth China anchors production and consumption. India — Tier I and Tier I and II city heatwave cycles — drives residential penetration. SE Asia adds commercial cooling demand. demand.
North America
Middle East & Africa
Replacement + data centres
Fastest CAGR globally
Mature stock, federal heat-pump incentives, AIM Act timing, timing, data centre expansion — replacement-led, serviceservice-attach-led.
GCC district cooling scale, African residential electrification, electrification, premium centralised plant for hospitals and and hospitality clusters.
24.53% / 5.8%
6.85%
2025 share · forecast CAGR
Forecast CAGR — fastest of 5 regions
40.75% / 6.8% 2025 share · forecast CAGR
Where incremental dollars are concentrating
Fastest-growing sub-segments inside the forecast window Heat pumps
Smart / IoT HVAC
5-Star systems
Chillers & ducted >5T
Decarbonisation-aligned, sub-segment growing low-double-digit.
Connected platform layer fastest-growing tech category.
Highest efficiency tier — fastest CAGR among ratings.
Data-centre cooling and large commercial — commercial — capacity-led.
© Next Move Strategy Consulting
03 / 06
04 · Competitive Scenario
Eight brands, three regional blocs, and one converging rule of the game. Market leadership is consolidating along three axes — efficiency portfolios, smart-control platforms, and gridaligned service economics. The next decade rewards players who connect all three.
Profiled players · eight flagship competitors
Daikin HQ · Osaka, Japan
Trane Technologies
Carrier Global HQ · Palm Beach Gardens, US
Johnson Controls HQ · Cork, Ireland
Global #1 by revenue; ~15% global share; share; $36B+ annualised scale; refrigerantrefrigerant-ready portfolio.
HQ · Dublin, Ireland
LG Electronics
Mitsubishi Electric
Bosch
Midea
HQ · Seoul, South Korea
HQ · Tokyo, Japan
HQ · Gerlingen, Germany
HQ · Foshan, China
VRF + residential inverter push; R-32 lowlow-GWP transition; cloud monitoring partnerships.
VRF + precision cooling; reliability-led positioning; lossnay energy-recovery ventilation line.
Specification-driven European play; low-GWP low-GWP portfolio; commercial + residential residential heat pumps; light-commercial. commercial.
Volume + cost-leadership across residential; rising rising global share via efficiency brands and overseas M&A.
NA leader (~24% regional share); commercial commercial + light-commercial core; serviceservice-led recurring revenue.
~17% NA share; broad residential + commercial portfolio; AI-enabled controls controls and connected ecosystems.
BMS-anchored commercial + industrial; deep deep service contracts; OpenBlue smart-building building platform.
What they are competing on
Theme 01
Theme 02
High-efficiency & low-GWP portfolios
Smart controls & AI diagnostics
Kigali, F-gas, AIM Act compress cycles and reset shortlisting; in-house refrigerant chemistry is now chemistry is now a moat.
Cloud platforms, predictive maintenance and BMS integration convert equipment sales into sales into lifecycle service revenue.
Theme 03
Theme 04
Geographic expansion & M&A
Service-led & performance contracts
Cross-region acquisitions and capacity additions target APAC volume, European policy demand, policy demand, and MEA premium projects.
Outcome-based maintenance, lifecycle guarantees, and demand-response participation are participation are reshaping revenue mix.
Market leadership is no longer a single-vendor trophy — premium, mid-tier and APAC volume leaders are all competing for the same electrification + refrigerant + service-stack prize.
© Next Move Strategy Consulting
04 / 06
05 · Strategic Outlook & Investment Considerations
Where the investment thesis lands, and where it can break. The HVAC thesis is durable but not uniform. Geography, equipment category, and policy window determine where alpha lives — and where execution risk accumulates. Investment thesis · where alpha is concentrated
01
Replacement cycles in NA + EU buy you the base.
Risks & headwinds
AIM Act, F-gas and tightening MEPS lock in 2–5 year replacement cadence. Service-led recurring revenue is the durable is the durable fragment.
What can break the thesis
02
APAC delivers volume + manufacturing alpha. China + India + SE Asia compound at 6.8% with the deepest local supply chains. Cost discipline is a defensible moat here. defensible moat here.
Refrigerant redesign costs Transition drag compresses margins during portfolio retool, especially for late adopters of low-GWP chemistry.
Skilled-labour shortage
03
Heat pumps + smart HVAC carry the velocity. Smart / IoT HVAC and heat pumps expand above the headline CAGR. Connected platforms convert transactions into transactions into tenure.
Installer scarcity in NA + EU extends commissioning timelines; retrofit retrofit programs can stall against capacity ceilings.
Raw-material & supply exposure Copper, aluminium and compressor components expose cost-of-goods to global cycles and tariff regimes.
04
“
Data-centre cooling is a separate, faster stack. AI training capacity expansion is a chillers + ducted +gt;5T story with its own sales cycle — treat it as adjacent, not adjacent, not substitutable.
Energy-price & capital sensitivity Operating-cost volatility and high upfront system prices slow decisions decisions in cost-sensitive emerging markets.
HVAC is no longer a single thesis. The alpha lives at the intersection of refrigerant chemistry, connected-service economics, regional policy cadence, and grid-aligned operation. Takeaway — for investors, strategists, and B2B
[Source: nextmsc.com/report/hvac-systems-market · cross-validated against GVR, MarketsandMarkets, IEA, AHRI.]
© Next Move Strategy Consulting
05 / 06
Investor Edition · Closing & Connect
Thank you. For in-depth briefings, custom cuts, and deeper data, let’s continue the conversation.
Direct channels
Phone
Web
+1 857-758-5017
info@nextmsc.com
www.nextmsc.com
Mon–Fri · 9:00–18:00 US Eastern Time
Briefing requests · data escrow · licensing
Full research library · sample reports
Read the full HVAC Systems Market report
Segmentation, region-by-region analysis, competitor profiles, and strategic outlook — assembled for B2B investors.
Full report
here →
www.nextmsc.com/report/hvac-systems-market Follow NMSC
YouTube
X · Twitter
Five regions, four durable drivers, eight flagships, one converging rule: HVAC is grid-aligned infrastructure. Reach out for the regional cut, the equipment line, or the custom model.
© Next Move Strategy Consulting
06 / 06