3 minute read
How does the Fibonacci sequence relate to the stock market?

N I Y A M S H A H
Amongst technical traders around the world, the use of Fibonacci retracements has become very popular. These key numbers were discovered by a mathematician of the name Leonardo Pisano, now known as Fibonacci. Alone, these numbers in the Fibonacci sequence aren’t of much use; however, the mathematical relationship between these numbers, expressed as ratios, are more important and can lead to more technical analysis of many random things found in nature, including stocks.
Advertisement
The Fibonacci Sequence of numbers is as follows: 0,1,1,2,3,5,8,13,21,34,55,89,144… Each term in the sequence is the sum of the two previous terms and the sequence continues infinitely. One of the main characteristics of this sequence is that each term is approximately 1.618 times bigger than the previous term.
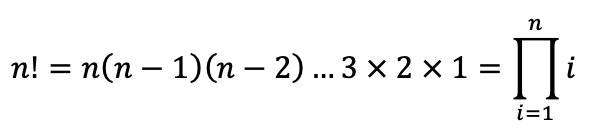
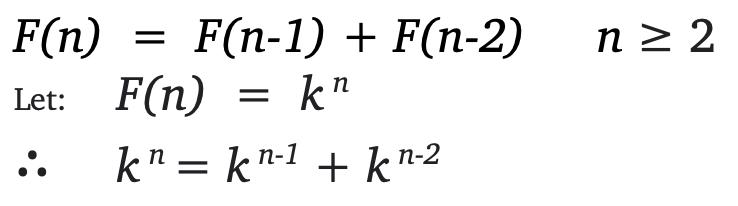
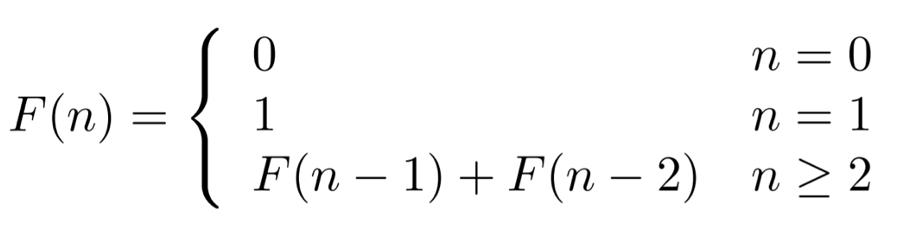
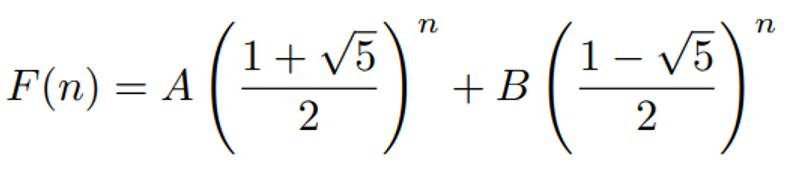
So, how is the nth term of the Fibonacci Sequence derived? The most simple formula for the nth term can be seen below however there is quite a large limitation of using this:
The limitation of using this formula is in order to work out the 8th term for example, you would need to know the 7th and 6th terms and these terms require the 5th and 4th terms and so on. Therefore, a mathematician of the name Binet set out to come up with a formula for which you could plug n in and find the nth term without knowing the previous terms (n – 1).
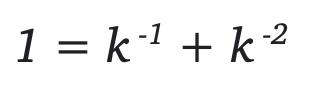
From the more simple formula, we can see that:
Divide through by k^n:
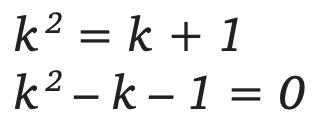
Multiply everything by k^2:
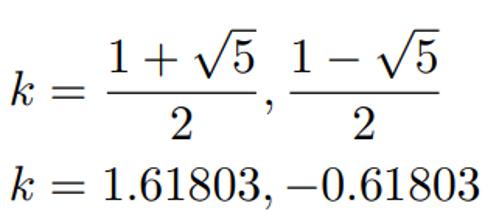
Now we have a quadratic equation, we can solve for k:
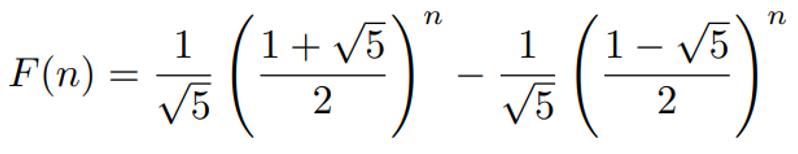
We can then substitute our values for k into our original formula:
Now, if we plug in two different values of n = 0 and n = 1, we can solve for A and B to derive our nth term:
As stated before, the numbers in the Fibonacci sequence alone aren’t of much use. However, using the numbers in the sequence to calculate the Fibonacci ratios is more important and more useful.
There are 5 Fibonacci ratios which are 23.6%, 38.2%, 50%, 61.8% and 100%.
For example, 8 divided by 34.
For example, 55 dived by 144.
The ratio 61.8% is found by dividing any number in the series by the number that follows it in the series.
For example, 21 divided by 34.
The ratio 100% is found by dividing any number in the series by itself. These ratios are known as the golden ratio.
For unknown reasons, the Fibonacci ratios play a significant role in the stock market. These ratios can be used by traders to determine critical points where an assets price momentum is likely to reverse. Technical traders use the Fibonacci retracements to predict stock prices and maximise their profits. They can be used on stock charts to draw support lines, identify resistance levels, place stop-loss orders, and set target prices.
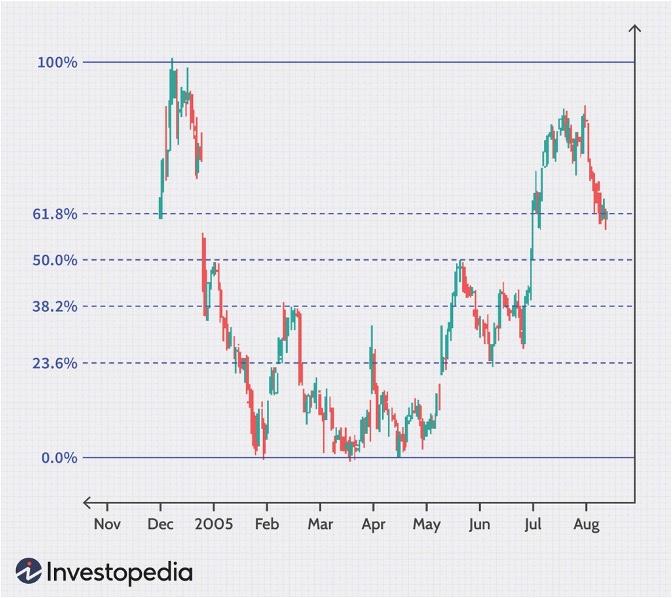
The support lines can be seen on the chart and it’s clear that the stock’s price momentum changes direction at most of these retracement levels.
To conclude, the principle of any Fibonacci tool is a numerical anomaly that isn’t grounded by any logical proof. The ratios and formulas derived from the sequence are only the product of a mathematical process. Despite there not being any logical proof behind it, it doesn’t make Fibonacci trading unreliable, however it can be uncomfortable for traders who want to understand the rationale behind the strategy.