
6 minute read
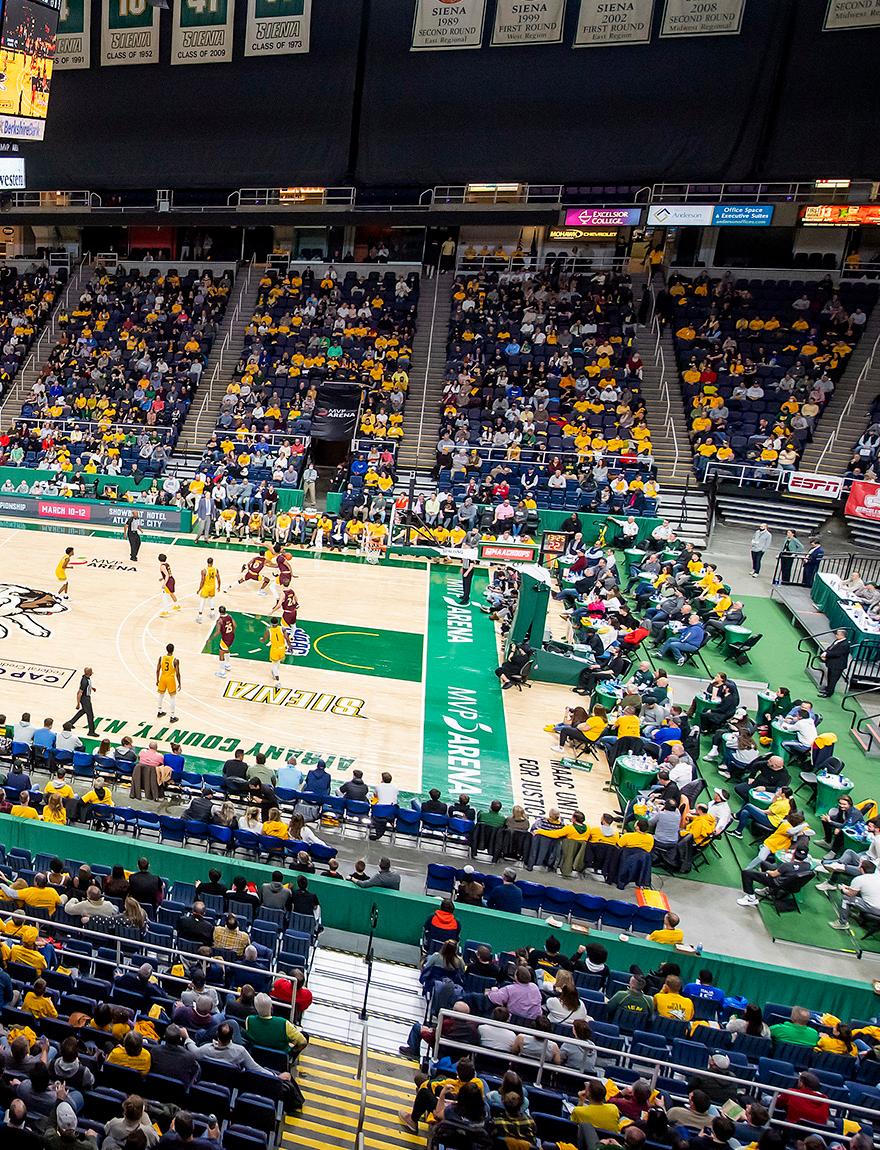
MVP Arena


Officially renamed on Jan . 1, 2022, MVP Arena in downtown Albany has served as the exclusive home court for Siena Men’s Basketball since 1997 . Over that time, Siena’s attendance has soared to new heights, bringing national acclaim to the mid-major program that competes in a major basketball setting . The Saints have ranked in the top-100 nationally in average home attendance for 24 consecutive seasons, and boasted the nation’s top average attendance amongst all 56 Northeast mid-major programs twice in a row .
MVP Arena has helped Siena Basketball grow into the premier sports entity in New York’s Capital Region . With more than one million people to draw from, the Albany area has developed a national reputation as a booming college basketball town, and Siena has led the way .
Advertisement
The Metro Atlantic Athletic Conference Men’s and Women’s Basketball Championships have been contested in Albany 20 times since Siena joined the conference 32 years ago, and have enjoyed record attendances . The MAAC Tournament returned to MVP Arena most recently for a five-year stint from 2015-19, with Siena again serving as the host school .
MVP Arena has also served as the venue to both past and upcoming NCAA Men’s and Women’s Basketball Tournaments, with Siena and the MAAC serving as co-hosts each year . The 1995 Men’s First and Second Rounds, 2003 Men’s East Regionals, 2015 Women’s Regionals, 2018 Women’s Regionals, and 2019 Women’s Regionals were all contested at the facility, with the Syracuse men (2003) and UConn women (2015) going on to win the National Championship .
Siena has hosted nine Postseason NIT games at MVP Arena, and four of those have drawn more than 10,000 fans . The Saints’ 10-point win over Tulane in the 1994 NIT was witnessed by a record 15,727 fans .
It is the consistent support the Siena program has received from its roughly 1,000 season ticket holders that makes these national events a reality .
The Saints have drawn more than 2 .6 million fans spanning 407 games played in their downtown home, marking an average of 6,452 spectators .
In 2009-10, the Saints welcomed a program-record 133,505 spectators through the MVP Arena doors, an average of 7,853 fans per game .
The Saints won three straight MAAC Championships and 38 straight games at MVP Arena from 2008-10 . The 2010 MAAC Championships drew a record 53,569 fans, highlighted by a crowd of 10,679 for Siena’s overtime victory over Fairfield in the title game .
In November of 2004, a sold-out crowd of 14,743 turned out for Siena’s home game against defending National Champion Syracuse at MVP Arena, the largest crowd ever to witness a regular-season Siena home game .
In 2002-03, Siena boasted the largest attendance figure in the nation per enrollment, and placed 66th among all Division I schools and fourth nationally for mid-major programs .
Siena’s clash with crosstown foe UAlbany on December 1, 2012 marked the 30th 10,000-fan game the Saints have hosted .
Siena tallied its 2-millionth fan on December 23, 2014 against Cornell University .
The Saints are an impressive 255-115 ( .689)* at MVP Arena since making the full-time move to the facility in 1997-98 . Siena returned to MVP Arena in 2021-22 following a one-year hiatus due to the COVID-19 pandemic, and after playing all of its home games during the 2020-21 season on campus at the UHY Center without spectators .

*A total of 24 home wins which occurred between Jan. 21, 2016 through the conclusion of the 2017-18 season were later vacated by the NCAA Committee on Infractions
2 MILLION FANS . . .AND COUNTING
All-Time Record at MVP Arena Season Wins Losses Pct . 1990-91 3 3 .500 1991-92 1 2 .333 1992-93 1 2 .333 1993-94 4 2 .667 1994-95 2 3 .400 1995-96 1 6 .143 1996-97 3 4 .429 1997-98 12 4 .750 1998-99 12 1 .923 1999-00 16 2 .889 2000-01 11 2 .846 2001-02 12 5 .706 2002-03 11 6 .647 2003-04 9 7 .563 2004-05 3 10 .231 2005-06 10 4 .714 2006-07 10 4 .714 2007-08 13 4 .765 2008-09 17 0 1.000 2009-10 17 0 1.000 2010-11 8 7 .533 2011-12 10 4 .714 2012-13 4 10 .286 2013-14 13 4 .765 2014-15 6 10 .375 2015-16 13* 4 .765 2016-17 11* 5 .688 2017-18 7* 9 .438 2018-19 8 8 .500 2019-20 14 0 1.000 2020-21* N/A N/A N/A 2021-22 8 5 .615 Totals 270* 137 .663

*All 18 home wins during the 2016-17 and 2017-18 seasons, as well as the final six home victories to conclude the 2015-16 season, were later vacated by the NCAA Committee on Infractions
Siena’s Crowds of 10,000 or More at MVP Arena
15,727 vs . Tulane* 3/22/94 W, 89-79 14,743 vs . Syracuse 11/27/04 L, 78-56 14,084 vs . UMass* 3/21/91 L, 82-80 (OT) 13,262 vs . UAlbany 12/1/07 W, 75-71 13,251 vs . UAlbany 12/6/08 W, 71-64 12,960 vs . UAlbany 12/5/09 W, 83-54 12,808 vs . Georgia Tech* 3/16/94 W, 76-68 12,231 vs . Canisius % 3/3/90 W, 71-53 12,117 vs . Pittsburgh 11/28/90 L, 82-80 11,844 vs . Iona % 3/6/00 L, 84-80 11,797 vs . UAlbany 11/21/03 W, 71-50 11,691 vs . LaSalle % 3/4/90 L, 106-90 11,672 vs . UAlbany 11/22/02 W, 79-75 11,488 vs . Manhattan 1/28/94 L, 98-73 11,477 vs . South Carolina* 3/19/91 W, 63-58 11,374 vs . Marist 1/30/99 W, 84-78 11,311 vs . UAlbany 11/8/13 L, 74-62 11,271 vs . UAlbany 12/2/06 W, 76-75 (OT) 11,065 vs . Canisius % 3/2/91 W, 76-62 10,808 vs . Iona % 3/3/91 L, 95-90 (OT) 10,790 vs . UAlbany 12/12/15 W, 78-70 10,753 vs . UAlbany 12/4/10 L, 88-82 (OT) 10,679 vs . Fairfield % 3/8/10 W, 72-65 (OT) 10,677 vs . Manhattan % 3/6/94 L, 65-58 10,671 vs . Xavier 12/23/02 L, 96-88 10,667 vs . Iona % 3/2/98 L, 90-75 10,285 vs . UAlbany 11/27/01 W, 60-48 10,284 vs . Niagara 2/24/01 L, 69-65 10,278 vs . UAlbany 12/13/14 L,77-68 10,229 vs . UAlbany 12/1/12 L, 69-56 10,223 vs . Niagara % 3/7/92 W, 83-57 10,166 vs . Fairfield % 3/5/94 W, 84-73 10,043 vs . Canisius % 2/28/98 W, 87-83
*National Invitation Tournament % MAAC Tournament
Year-By-Year Siena Basketball MVP Arena Attendance Season Games Attendance Average
1990-91 6$& 64,177 10,699 1991-92 3& 22,185 7,395 1992-93 3& 21,480 7,160 1993-94 6#& 56,596 9,433 1994-95 5% 24,159 4,831 1995-96 7% 23,955 3,422 1996-97 7 25,645 3,663 1997-98 16+ 90,126 5,632 1998-99 13 82,320 6,332 1999-00 18#+ 125,255 6,959 2000-01 13 83,213 6,401 2001-02 17* 112,359 6,609 2002-03 17$ 125,156 7,362 2003-04 16+ 104,444 6,528 2004-05 13 83,723 6,440 2005-06 14% 78,378 5,598 2006-07 14 81,670 5,834 2007-08 17+ 110,012 6,471 2008-09 17+ 127,453 7,497 2009-10 17+ 133,505 7,853 2010-11 15 114,383 7,626 2011-12 14 91,128 6,509 2012-13 14 89,053 6,361 2013-14 17! 102,459 6,027 2014-15 16& 99,872 6,242 2015-16 17&@ 106,580 6,269 2016-17 16+ 97,238 6,077 2017-18 16% 95,490 5,968 2018-19 16& 92,276 5,767 2019-20 14 87,188 6,228 2020-21¢ N/A N/A N/A 2021-22 13 71,741 5,519
Totals 407 2,626,318 6,452
^ Includes one NIT game # Includes two NIT games $ Includes three NIT games % Includes one MAAC Tournament game & Includes two MAAC Tournament games + Includes three MAAC Tournament games * Includes four MAAC Tournament games ! Includes three College Basketball Invitational games @ Includes one College Basketball Invitational game ¢Siena played all of its home games during the 2020-21 season on campus at the UHY Center without spectators due to the COVID-19 pandemic


