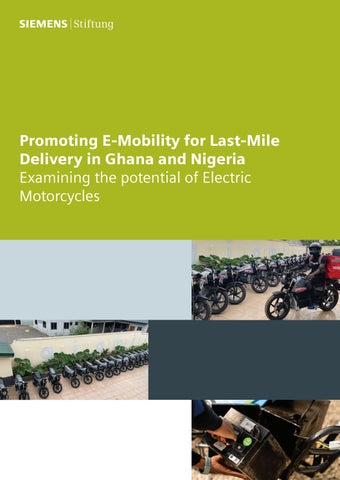
Promoting E-Mobility for Last-Mile Delivery in Ghana and Nigeria Examining the potential of Electric Motorcycles
Imprint Published by Siemens Stiftung Kaiserstraße 16 80801 München Tel.: +49 (0) 89 / 54 04 87-0 info@siemens-stiftung.org www.siemens-stiftung.org Responsible for Content Dr. Nina Smidt and Robert Balthasar Editorial team Gigmile: Kayode Adeyinka, Sam Esiri Siemens Stiftung: Sebastian Gruss, Konstantin Pfoser Layout Niko Creative 90 JGO James Gichuru Road, Nairobi, Kenya www.nikocreative.co.ke Photo Credits ©Gigmile ©Siemens Stiftung
About Us
The non-profit, internationally operative Siemens Stiftung is committed to sustainable social development. Together with individuals and communities, it creates opportunities to actively shape social and ecological transformation. It focuses on three key areas of action: Essential Services, Digitality, and Climate. By collectively addressing challenges in these fields, the foundation harnesses them as opportunities for innovation and positive change. Through projects in Education, Social Entrepreneurship, and Culture, it facilitates access and participation, strengthens future-oriented competencies, and enables interdisciplinary and collaborative learning. Siemens Stiftung connects local actions with global perspectives to support resilience, social cohesion, and regenerative practices. www.siemens-stiftung.org
Gigmile is a technology-driven mobility and financial inclusion company focused on equipping gig workers across Africa through access to productive assets, sustainable transportation solutions, and economic opportunities. Through innovative lease-to-own financing models, Gigmile enables riders and delivery professionals to access motorcycles and other mobility assets that improve their earning potential and create pathways to ownership. As a leader in the transition to sustainable mobility, Gigmile is at the forefront of deploying electric motorcycles for last-mile logistics, helping riders reduce operating costs while contributing to cleaner and more resilient urban transportation systems. It combines asset financing, technology, operational support, and datadriven insights to improve rider productivity, financial wellbeing, and business performance. Working closely with logistics platforms, development partners, financiers, and technology providers, Gigmile is building an ecosystem that promotes financial inclusion, economic empowerment, and sustainable mobility solutions for the future of work in Africa.
Table of Contents Executive Summary 1. Introduction 2. Methodology 3. Findings and Implications 3.1 Total Cost of Ownership 3.2 Operational Efficiency and Productivity 3.3 Income and Financial Viability 3.4 Charging Infrastructure Performance 3.5 Environmental Impact 3.6 Platform and Market Dynamics 3.7 Business Model & Scalability 4. Conclusion
Executive Summary
This report evaluates the commercial, operational, and environmental viability of electric motorcycles (EVs) in last-mile delivery across Nigeria and Ghana. The analysis is based on a pilot deployment of 40 electric motorcycles operated across six logistics platforms in Lagos and Accra, covering nearly 400,000 kilometres of real-world usage.
consistently high, with no defaults recorded. This indicates that the lease-to-own structure is viable under current operating conditions, even in scenarios where short-term income is compressed.
The findings demonstrate that EV adoption delivers a clear structural advantage in operating costs compared to their internal combustion engine (ICE) counterparts, primarily driven by lower energy expenditure per kilometre. In Nigeria, this cost advantage translates directly into higher rider net income, with EV riders earning approximately 12% more than ICE riders. In Ghana, however, the economic benefit is not immediate. While operating costs are marginally lower, higher upfront vehicle costs of approx. 40% and associated financing obligations result in lower short-term net income compared to ICE riders.
Overall, the results confirm that EV deployment in last-mile logistics is viable, but not universally profitable in the short term. Economic outcomes depend on market-specific factors, particularly energy cost differentials, financing structures, and infrastructure availability. Scaling EV adoption will require coordinated development across these dimensions.
Operational performance across both markets is strong. EVs achieved uptime levels of 98–100%, with minimal mechanical issues and no material impact on rider productivity. Charging models proved effective in both contexts: home-based overnight charging dominates in Nigeria, while battery swapping is essential in Ghana due to grid reliability constraints. The financial model underpinning the deployment is robust. Despite varying income effects across markets, repayment performance remained
6
The environmental impact is material. The pilot resulted in significant fuel displacement and carbon emission reductions, confirming that EV adoption delivers immediate environmental benefits even when powered by grid electricity.
Key programme metrics
40 EVs Deployed
20 Nigeria + 20 Ghana
390,285 km Total distance Ridden in the programme period
21.0 tonnes CO2 saved
vs ICE equivalent
11,708 litres Fuel displaced
Executive Summary
1 Introduction
Last-mile delivery in West Africa is predominantly powered by ICE motorcycles, which form the backbone of urban logistics systems in markets such as Nigeria and Ghana. While these vehicles enable flexible and scalable delivery operations, they produce not only environmental harm but also impose significant economic constraints on riders. Fuel costs, maintenance expenses, and asset rental fees consume a substantial portion of gross earnings, limiting net income and restricting pathways to asset ownership. Recent increases in fuel prices have further intensified this pressure. In Nigeria, petrol prices exceeding EUR 0.761 (₦1,200) per litre have significantly increased operating costs for riders2. In Ghana, similar cost pressures arise from rising fuel prices combined with ongoing servicing Source: 1. Exchange rate June 2026: 1,000 ₦ = 0.64 EUR
1. Introduction
expenses. These dynamics create a structurally constrained income model for gig-economy riders. Electric motorcycles present a potential alternative. Their value proposition is based on two core assumptions: lower energy costs per kilometre, and reduced maintenance requirements due to simpler mechanical systems. However, the extent to which these theoretical advantages translate into real-world benefits remains dependent on local market conditions. This report assesses whether EV adoption improves economic and operational outcomes for riders within existing delivery ecosystems. The analysis focuses on total cost of ownership, rider income, operational performance, infrastructure effectiveness, and overall market readiness. It also examines how EVs integrate into platform-based logistics systems and whether they can be scaled sustainably within these environments.
2. https://www.cnbcafrica. com/2026/nigeria-fuel-demand-rises-as-dangote-drives-near-full-refining-capacity
7
2 Methodology The analysis is based on a mixed-methods approach combining quantitative operational data with qualitative insights from riders and platform operators. Data sources include telematics systems installed on all deployed vehicles, financial records capturing earnings and costs, repayment data from lease-to-own agreements, structured rider surveys, and interviews with logistics platform operators. The dataset covers eleven months of operational data in Nigeria and seven months in Ghana. In total, 40 electric motorcycles were deployed, with 20 units in Lagos from manufacturer Spiro and 20 units in Accra from manufacturer Kofa. To establish a comparative baseline, data from 20 ICE motorcycle riders operating on similar platforms was included. In Nigeria, this baseline combines observed operational data with standardised fuel cost assumptions, while in Ghana it is based on direct observation of comparable riders. The analytical framework focuses on five core dimensions. First, total cost of ownership is assessed for a three-year period, incorporating acquisition costs,
8
financing, energy, and maintenance. Second, operational efficiency is evaluated using metrics such as trips per month, distance travelled, uptime, and fleet utilisation. Third, income effects are analysed by comparing gross and net earnings between EV and ICE riders. Fourth, system-level performance is examined, including charging infrastructure effectiveness, platform integration, and financial sustainability. Fifth, environmental benefits compared to ICE vehicle usage are assessed. The methodology has several limitations. The observation period is shorter than the full lifecycle of the vehicles, which constrains long-term cost analysis. The ICE baseline in Nigeria includes estimated components, introducing some degree of approximation. Additionally, the sample size is limited, which may affect the generalisability of findings. These constraints are considered in the interpretation of results.
2. Methodology
3 Findings and Implications 3.1 Total Cost of Ownership
Electric motorcycles exhibit a fundamentally different cost structure compared to ICE vehicles. While EVs have higher upfront acquisition costs, they benefit from significantly lower energy and maintenance expenses over time. The extent to which this translates into a total cost advantage varies by market. In Nigeria, EVs are more cost-efficient over a three-year period. The lower energy cost per kilometre creates substantial annual savings, which outweigh the higher purchase price and financing costs. As a result, EVs achieve a 12.6% lower cumulative cost of ownership compared to ICE motorcycles within the lease period. In Ghana, the cost dynamics differ. Although EVs still offer lower energy and maintenance costs, the gap relative to ICE vehicles is much smaller. Reasons for this are a smaller price difference between electricity and gasoline in this market as well as a different charging process (battery swapping) that is more cost intense than home charging. At the same time, higher acquisition costs lead to significantly higher financing obligations. This results in a 26.3% higher total cost of ownership for EVs compared to ICE vehicles over the same period. These findings indicate that the economic viability of EVs is primarily driven by the magnitude of the energy cost differential and the structure of financing. Where fuel costs are significantly higher than electricity costs, EVs can recover their initial cost premium within the financing period. Where this differential is smaller, financing costs dominate, delaying or reversing the economic advantage.
3.2 Operational Efficiency and Productivity
Operational data shows that electric motorcycles perform reliably in real-world delivery conditions. Across both markets, vehicles achieved uptime levels between 98% and 100%, indicating minimal operational disruption. Maintenance requirements were limited to routine servicing, with no significant mechanical failures recorded in Nigeria and only isolated incidents in Ghana. Productivity metrics reveal differences between markets that are not attributable to vehicle type. Riders in Nigeria completed a higher number of trips per month, reflecting the high-frequency nature of delivery platforms in Lagos. In contrast, riders in Ghana covered greater distances per trip, driven by platform characteristics that involve longer delivery routes.
3. Findings and Implications
9
Metric
Nigeria (EV)
Ghana (EV)
Avg Trips / Month Energy Cost per km Vehicle Uptime Fleet Utilisation
202 EUR 0.0146/km (₦ 23/km) 98 – 100% 80 – 85%
167 EUR 0.0301/km (GHS 0.41/km) 98 – 100% 79 – 83%
These patterns suggest that productivity is primarily determined by platform demand and route structure rather than by the vehicle itself. The absence of operational constraints related to EV performance indicates that electric motorcycles are fully compatible with the demands of last-mile delivery. However, supply chain limitations emerged as a constraint in Ghana, where delays in sourcing spare parts led to temporary downtime. This highlights that the surrounding ecosystem, particularly after-sales support, remains a critical factor for scaling EV operations. 3.3 Income and Financial Viability
The impact of EV adoption on rider income differs significantly between Nigeria and Ghana, reflecting underlying differences in cost structures while operating under a similar lease-to-own financing model. In Nigeria, EV riders achieve higher net income than their ICE counterparts. This outcome is driven by substantial energy cost savings, which more than offset the additional financial burden associated with lease repayments. As a result, riders retain a 12% larger share of their gross earnings compared to ICE drivers, improving overall financial outcomes. In Ghana, the situation is reversed in the short term. Although EV riders benefit from slightly lower operating costs, these savings are insufficient to offset the higher financing obligations associated with the vehicle. Consequently, net income is 39% lower compared to ICE riders during the repayment period. This outcome is primarily driven by financing costs during the repayment period rather than operational inefficiencies of the vehicles themselves. The divergence highlights the central role of financing in determining income outcomes. The operational cost advantage of EVs is consistent across markets, but its impact on net income depends on whether it exceeds the cost of financing. In Ghana, EV adoption represents a transition phase in which riders accept lower short-term income in exchange for eventual asset ownership and lower long-term operating costs. In addition to financial advantages, riders noted a meaningful qualityof-life benefit thanks to smoother, quieter EV rides. The technology reduced fatigue over long working shifts and increased their physical wellbeing.
10
3. Findings and Implications
3.4 Charging Infrastructure Performance
Charging infrastructure plays a critical role in determining both the cost and practicality of EV operations. The pilot tested two distinct models: a hybrid system combining home charging and battery swapping in Nigeria, and a fully swap-based system in Ghana. In Nigeria, home-based overnight charging emerged as the dominant model. Riders benefit from relatively stable electricity access during off-peak hours, allowing them to charge vehicles at lower cost without affecting working hours. Battery swapping serves as a supplementary option, providing flexibility but at a higher cost. In Ghana, battery swapping is the key model adopted due to nonprovision of home chargers by the vehicle manufacturer. The battery swap network is, however, effective and provides rapid turnaround times and ensures operational continuity. Rider feedback indicates high satisfaction with this model, particularly as the network expanded and reduced range anxiety. In both markets, the impact of charging on productivity is minimal. Charging does not significantly reduce working hours, and energy costs remain within manageable bounds. These findings indicate that infrastructure is not a constraint when appropriately adapted to local conditions. However, its configuration is critical: the most efficient model depends on grid reliability and urban infrastructure.
3.5 Environmental Impact
The transition from ICE motorcycles to electric vehicles results in measurable environmental benefits. Across the pilot period, EV deployment led to significant reductions in fuel consumption and carbon emissions. The magnitude of operational emissions reduction varies between markets due to differences in electricity generation. Nigeria's grid relies on thermal gas for over 80% of electricity production (0.45 kg CO₂/ kWh). Ghana's grid draws approximately 35–40% of capacity from hydroelectric power resulting in a significantly lower emission
Environmental Metric
Nigeria
Ghana
Total Fleet km (data period) ICE Equivalent CO2
224,781 km 15,598 kg
165,504 km 11,444 kg
EV CO2 (grid)
4,046 kg
1,986 kg
CO2 saved3
11,531 kg
9,483 kg
Petrol displaced CO2 saved per rider / month
6,743 litres 52.4 kg
4,965 litres 67.7 kg
Projected at 1,000 riders (annual)
629 tonnes CO2
811 tonnes CO2
3. Assumptions: Petrol Emission Factor: 2.31 kg CO2/ litre; EV Energy Consumption: 40 Wh/km
3. Findings and Implications
11
intensity (0.30 kg CO₂/kWh). As a result, an EV rider in Ghana emits approximately 33% less carbon per kilometre than an equivalent rider in Nigeria. The findings confirm that EV adoption reduces emissions even when powered by grid electricity. The environmental benefit scales directly with usage, suggesting that large-scale deployment would result in proportionally higher reductions in carbon emissions. 3.6 Platform and Market Dynamics
The performance of EVs is closely linked to the characteristics of the platforms on which they operate. Platform demand density is a primary determinant of rider income, with higher trip volumes leading to better financial outcomes regardless of vehicle type. During the pilot phase, six platforms across both markets were evaluated. Automated remittance platforms consistently delivered stronger repayment compliance and lower income volatility. One manual remittance model was the only exception across the platform mix and showed higher variance in monthly rider earnings. Market readiness for EV adoption is high from a behavioural perspective. Rider willingness to adopt EVs increased significantly by 12-14% following direct exposure to the technology. However, adoption is constrained by structural factors, particularly high upfront costs in Nigeria and limited charging infrastructure outside central urban areas in Ghana. Additionally, national policy frameworks play an important role in determining the financial viability of EV adoption. Unlike Nigeria, where electric motorcycles benefit from VAT exemptions, Ghana does not currently provide the same tax treatment. This contributes to the higher upfront cost of EV motorcycles and weakens the short-term economic case for riders. These findings suggest that scaling EV adoption requires targeted interventions to address economic and infrastructural constraints, rather than demand generation.
3.7 Business Model & Scalability
The pilot indicates that the EV business model is viable when three economic conditions are met: riders generate sufficient platform revenue, energy costs remain materially below fuel costs, and financing obligations are sized to the rider’s daily cash flow. The evidence from Nigeria and Ghana shows that the model is not uniformly scalable under all conditions, but can scale where vehicle economics, charging infrastructure, and platform integration are aligned. In Nigeria, the business model is already close to scale-readiness. EV riders generated average monthly net earnings which are higher compared to ICE riders. Over three years, the Nigerian EV model produces a cumulative total cost of ownership advantage versus ICE
12
3. Findings and Implications
motorcycles. In Ghana, the model is operationally viable but not yet financially optimized for immediate scale, due to higher energy costs for EVs. The scalability of the model therefore depends heavily on platform economics. The report indicates that high-volume platforms are the most suitable deployment channels, with 15 or more trips per day identified as an important threshold for rider income sustainability. Charging infrastructure is the second scalability condition. In Nigeria, the preferred model is home-based overnight charging, supported by swap access where needed. This model keeps charging costs low and avoids productivity losses because charging takes place outside working hours. In Ghana, the model depends entirely on battery swapping. The Accra network provided 12 swap stations, and riders reported high satisfaction, but infrastructure coverage outside central Accra remains a constraint. This means Ghanaian scale-up should follow infrastructure expansion rather than precede it. Financial discipline and repayment performance provide a positive signal for scalability. Nigeria achieved 90.7% repayment compliance, while Ghana achieved 94.2%. This suggests that riders can meet lease-to-own obligations when deployed on suitable platforms and supported by structured payment systems. However, strong repayment performance should not be confused with full rider income optimization. Ghana’s data shows that riders can repay while still experiencing lower net income than ICE peers, which means scale-up should improve affordability before expanding aggressively. At fleet scale, the capital requirement is substantial. Scaling to 100 EVs would require approximately EUR 110,000 (₦175 million) in Nigeria and EUR 180,000 (GHS 2.41 million) in Ghana. These figures imply that scale-up will depend on access to patient capital, asset financing, or blended finance structures that can absorb the higher upfront cost of EVs while allowing riders to benefit from operating savings over time. The recommended scaling approach is therefore differentiated by market. In Nigeria, expansion can proceed more directly, prioritising high-volume platforms, home-charging-enabled riders, and automated remittance structures. In Ghana, expansion should be more selective. Scale should focus first on riders attached to high-volume platforms, areas with dense swap-station coverage, and financing structures that reduce the monthly repayment burden. Without these adjustments, Ghana can scale operationally but may not yet deliver attractive riderlevel economics during the repayment period.
3. Findings and Implications
13
4 Conclusion
The pilot demonstrates that electric motorcycles are a viable alternative to ICE vehicles in last-mile delivery across West Africa. They deliver strong operational performance, reduce environmental impact, and offer a structurally lower cost base. However, the economic benefits of EV adoption are not uniform. In Nigeria, the combination of high fuel costs and lower electricity costs creates immediate financial advantages for riders. In Ghana, the economic case is longerterm, with benefits realised after the completion of financing obligations. The results highlight that EV viability is determined by system-level factors rather than technology alone. Energy cost differentials, financing structures, and infrastructure availability collectively shape outcomes. Where these elements are aligned, EV adoption is both financially and operationally sustainable.
14
Scaling EV deployment will require coordinated development across these dimensions. High-volume platform integration is necessary to ensure sufficient rider income. Charging infrastructure must be expanded in line with deployment, particularly in markets reliant on battery swapping. Financing models must be adapted to local income levels to avoid short-term income compression. The pathway to scale is therefore clear but conditional. Nigeria presents a near-term opportunity for expansion, while Ghana requires further ecosystem development to unlock the full economic potential of EV adoption.
4. Conclusion
4. Conclusion
15
Siemens Stiftung Kaiserstraße 16 80801 Munich Germany siemens-stiftung.org