
9 minute read
Rolling your own… In part four of his occasional series, Mike Roberts takes a look at airfoil selection and performance estimates…


While the very early airfoils were terribly inefficient, the development through WWI in aerodynamics was considerable. The German aircraft researchers excelled at it, to the point that the airfoils seen on the later German wartime aircraft would make perfectly acceptable airfoils today on slow flying aircraft. On such a simple design as we are considering in this series of articles, we only need to review the three key parameters, these being:
Lift Coefficient (CL) – A unitless parameter that gives an indication as to the airfoil’s ability to generate lift at different Angles of Attack. As the Angle of Attack (AoA) increases, so too does the CL, the slope between AoA and CL is generally roughly linear until it nears the stall, where it flattens off and then drops dramatically, this is the AoA at which the stall occurs. The highest value of CL is just before the stall and is often referred to as CL MAX.
Most airfoils will generally have a maximum lift coefficient somewhere between 0.8-1.6, though this assumes an infinitely long wing, i.e., that it discounts any losses from wing tip vortices. High lift devices are generally put in place to increase this value of CL MAX. Some, such as the more complex fowler and Zap flap also increase the wing area. Note that a conventional cambered airfoil produces some lift even at zero angle of attack, you have to tip it to a slightly negative angle of attack to get zero lift.
The more cambered (curved) the airfoil, the more lift it generates even at zero angle of attack.
Drag Coefficient(CD) – Similar to lift coefficient, this dimensionless parameter tells us how draggy an airfoil is. Generally, the thicker the airfoil, the higher its drag coefficient, for fairly obvious reasons. As the angle of attack is increased and the CL goes up, the Cd will also increase. This is partly the reason for needing more power during a high angle of bank turn.
More lift = more drag.
Pitching Moment Coefficient (CM) – This dimensionless parameter is a measure of how much the airfoil wants to twist nose-down in flight, and is a function of the shape of the airfoil’s camber – the flatter the airfoil, the less the pitching moment. When the pitching moment of an airfoil is measured about the airfoil’s aerodynamic centre, which is normally the quarter-chord point, unlike the lift and drag, the pitching moment depends only on the aircraft’s speed; it doesn’t vary with angle of attack. The pitching moment coefficient has a lot to do with an aircraft’s stability, especially so on flying wings, which have no conventional tail to balance it out. The pitching moment coefficient is also important in determining the torsional load imparted on our wing when making the structural calculations.
We generally begin airfoil selection by deciding what sort of stall speed we are after – as low as possible surely? Well, not always… As the aircraft I am designing will have only a 250kg max gross weight, if it were to have a stall speed below 35kt then it would become an SSDR. I really like SSDRs, but I want my design to be an SEP, LAA machine, mainly because I like the requirement that LAA will check my design submission and an LAA Inspector will have a good nosey round the aeroplane – both significant safety contributions. Also I want to be able to use it to build my PPL flying hours. So, I want it to stall above 35kt but not much more. For simplicity of design, this aircraft won’t have flaps and to be honest, a simple plain flap won’t reduce our stall speed all that much anyway and would likely serve better as a glide path device more than a high lift one.
So what sort of CL would we need? Well, if we rearrange the formula for stall speed and plug in our numbers from the detailed specification, including the wing area, we can work out the required CLmax value. Alternatively, we could choose a CLmax from airfoil data and then figure out the minimum wing area we need to get the stall speed we want. It just depends how the designer approaches the task.
Stall speed =
· Where V is the stall speed (metre/sec)
· L is the lift force (Newtons)
· Cl is the coefficient of lift (unitless)
· p is the air density (Kg/cubic metre)
· S is the wing area (sq metres)
Aeronautical design textbooks typically provide tables of CL, CD and CM for a range of different airfoil shapes – you can also find these online. There are several things to consider when selecting an airfoil, performance is a given, we need our wing to work efficiently for us. An important measure of the performance of an airfoil is its Lift/Drag ratio, the higher, the better.
The Lift/drag ratio is obtained by dividing the airfoil’s CL value at a given angle of attack by its CD value at the same angle of attack. Having said that, an airfoil with a high L/D but a very high pitching moment coefficient may not work out as well as one with a lower L/D and a more modest pitching moment. This is because with an aircraft of conventional layout, the pitching moment generally needs to be counteracted by a downforce on the tailplane, which in effect not only cancels out a proportion of the wing lift but also in doing so, creates more drag.
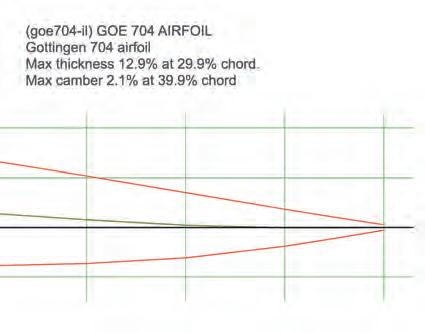
Below The GOE 704 airfoil was selected as it has a touch of reflex which will serve to help reduce induced drag.
This is partly the reason why gliders have long fuselages and small tailplanes… a shorter fuselage would need a larger tailplane, causing more trim drag and more cancelled-out lift.
Then again, there’s no point choosing an airfoil with a high L/D at a high angle of attack if your aeroplane is designed to cruise at a low angle of attack because it only has a very light wing loading. You need an airfoil with a high L/D at the projected cruise lift coefficient, and also, particularly if it’s marginally powered, at the climb lift coefficient. It’s all a balance and you don’t get anything for free.
Generally, the thicker the airfoil, the higher the CD, but counter-intuitively, a thick wing can generally be built a lot lighter than a thin one. As the spar caps in a thick wing are further apart than in a thin wing, less spar cap material is needed to achieve a given strength and stiffness – I will calculate an example in a later article to show how this works.
Other important factors to consider are the suddenness of the airfoil’s stall, and its sensitivity to surface imperfections – there’s no point choosing a supercritical laminar flow airfoil for a wing that’s to be fabric covered, for example, because the fabric surface between the ribs doesn’t follow the rib profiles accurately and the section is only very approximately reproduced. For a fabric covered wing, one of the long-established NACA 4 or 5 digit sections such as the 23012, 4412 or 4415 are often the airfoils of choice.
When the wing is tapered in planform rather than parallel chord, the choice of potentially different airfoil sections at the root and tip, in combination possibly with the use of washout, makes the whole business much more complicated. The challenge here being to create an aerodynamic configuration that will achieve as close as possible to an elliptical spanwise lift distribution for minimum induced drag, while also one which will stall first at the root rather than the tip.
For those who are interested, the airfoil selected for this design with its parallel chord wing is a Gottingen 704 airfoil.

Performance estimates
Determining the performance of an aircraft is a key stage in a design’s development. The level of analysis can get overwhelming if high performance is key to the success of the design, such as a high-performance sailplane. In our case, we are going to use some pretty standard calculations as our aim is for the aircraft to be low cost and a ‘decent’ performer rather than anything special in that department. That said, while the calculations are quite simple and only require us to plug in numbers into a formula from our detailed specification, the results can be quite accurate so long as you aren’t over-optimistic in assigning your drag coefficients.
Once again, we will employ the use of spreadsheets to aid this process. The LAA has a published Aircraft Performance Estimate Calculator. I find this area of a design the most intriguing and the spreadsheet is very design a delta wing, canard, tandem wing or whatever you come up with, the reliability of this information would become more questionable.
Optimising performance
As mentioned, this design is aimed at being inexpensive to produce with performance being a secondary consideration. That said, we’ll try and avoid adding draggy features. So, to give it the best chance, there are a couple things I looked at that will have undoubtedly reduced the parasitic drag and at no cost to the complexity or price of the build.
useful for having a play around with, altering things like aspect ratio and MTOW and seeing how the estimated performance goes up (or down!).
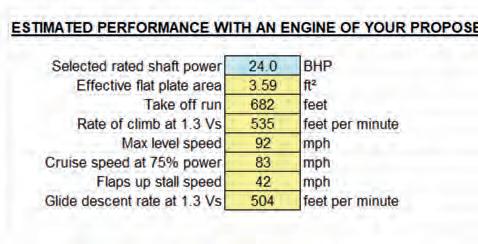
Having plugged in the various parameters of this preliminary design into the performance estimate calculator, we attain some pretty promising figures. The spreadsheet contains a great deal more information such as the variation of L/D with airspeed, performance estimates, minimum power requirements etc. Have a look on the LAA website. Do note though that this assumes a conventional configuration… should you
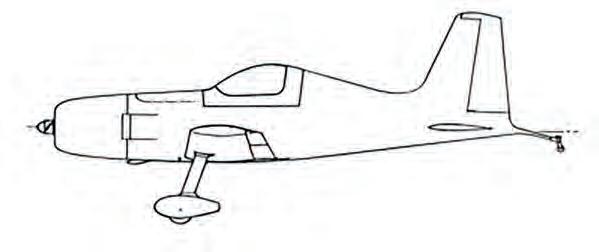
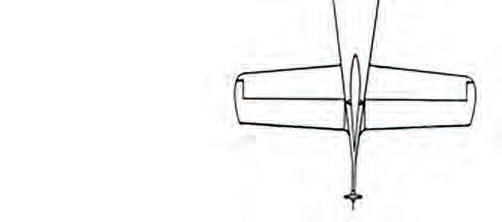
Below Avoiding tapering the fuselage in planform in the area where a dihedralled wing attaches cuts down on interference drag at the intersection.
Reducing double curvatures – Many aircraft have a lovely compound curve fairing at the root where the wing and fuselage meet. While looking very pretty, they also fill a void that would otherwise be filled with very turbulent (draggy) air. As a particle of air flows over the top surface of the wing, accelerating as it goes, it is trying desperately to cling to the surface of the wing but at the same time, it is trying to cling to the fuselage side (think of a divergent nozzle). If the wing-to-fuselage junction is not designed well, the air will separate and cause unnecessary drag, hence why this area is often being filled with a fairing. So, to not ask too much from said air particle, I have kept my fuselage sides parallel from the leading to trailing edge of the wing. This certainly wouldn’t create more drag and actually makes the fuselage simpler to build as the centre section is completely flat! I adopted this having seen a video on the internet of the late Mike Arnold discussing how he achieved a very low drag coefficient on his AR-5 (A design that achieved 213.18 mph on a stock Rotax 582).
Undercarriage – Aiming to adopt a Sonerai type cantilever aluminium gear, the design of which is quite draggy, adding a little nose piece and a trailing edge piece should reduce the CD somewhat.
Little touch-ups in the design here and there can go a long way in reducing the drag on an aircraft. For a demonstration, using the formula for drag, let’s compare the drag on a tubular undercarriage leg and a streamlined one. Both will share the same frontal area, the only difference being the drag coefficient will change.
The formula for approximate drag is: Drag = Where; ρ = Air Density
V= Fluid velocity
S = Frontal area
= Drag Coefficient
Every pilot / aviation fanatic knows that if you double the speed of an aircraft the drag (and potentially, the lift) goes up by a factor of 4, that’s the part coming into play…
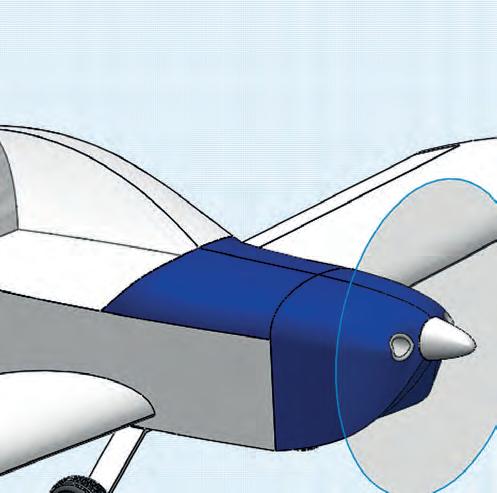
So, let’s determine the drag difference between an undercarriage leg consisting of just a round tube or rod, compared with the same leg with a streamlined section. As we won’t be changing the dimensions, the frontal area is the same. Solidworks tells me that the frontal area highlighted in blue (undercarriage profile, opposite page) is equal to 0.042. For our airspeed, we are going to

Above assume we will be cruising at 75mph. As I work in metric units, and the rest of the formula will be working so, this 75mph will need to be converted to m/s. All that remains, is finding the Drag Coefficients for our chosen cross sections, the internet is your friend as are aerodynamic books.
A search online has told me that:
‘The drag coefficient for cross section A is 0.47
And ‘The drag coefficient for cross section B is 0.045
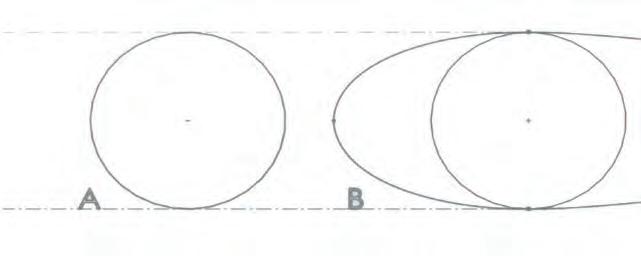
Remember that coefficients are unitless.
Now if we plug our values into the formula, we can determine our drag.
Drag for A, Drag = = 13.6 Newtons or about 1.39 Kgf of drag (3 lbs)


Drag for B, Drag = = 1.36 Newtons or about 0.138 kgf of drag ( 0.3 Lbs)
Not surprising then that the streamlined section provides a greatly reduced amount of drag, a pretty much x10 fold reduction in drag for that matter!. Do note that this formula does not consider surface finish. If we had two versions of the B section, one with a highly polished surface finish and the other with a 320 grit finish, we know which would be better. This can be taken into account quite easily and maybe something I’ll explain later on, should people be interested. From here, you could investigate different foils, different speeds etc. Remember this is at 75mph, a Van’s RV or a Long EZ that is not far off twice this speed would really suffer with a tubular cross section gear, which is likely the reason why they don’t! The best part of aircraft aesthetics is that most of it is for a good reason. ■


