®
VOLUME 4 // ISSUE 3
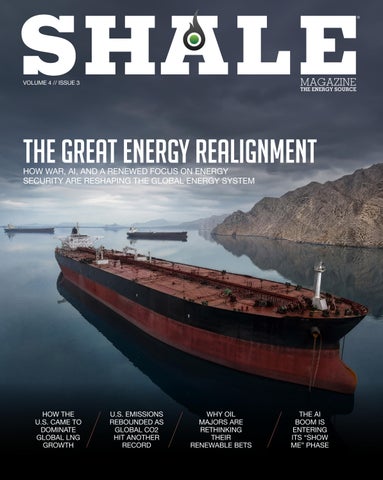
THE GREAT ENERGY REALIGNMENT HOW WAR, AI, AND A RENEWED FOCUS ON ENERGY SECURITY ARE RESHAPING THE GLOBAL ENERGY SYSTEM
HOW THE U.S. CAME TO DOMINATE GLOBAL LNG GROWTH
U.S. EMISSIONS REBOUNDED AS GLOBAL CO2 HIT ANOTHER RECORD
WHY OIL MAJORS ARE RETHINKING THEIR RENEWABLE BETS
THE AI BOOM IS ENTERING ITS “SHOW ME” PHASE
O I L & G A S P L AY E R S
|
BUSINESS
We have moved to a new bigger station in San Antonio!
|
TECHNOLOGY
|
POLICY
Nationally Syndicated
Sundays 2pm-3pm 930AM San Antonio
THE ONLY OIL AND GAS SYNDICATED NATIONAL RADIO SHOW
MOST
listened to show on Sunday nights! Thank you
HOUSTON!
Saturdays 7am KEYS 1440AM / 98.7FM Corpus Christi
Sundays 8pm-9pm KFXR 1190AM / simulcast on the iHeartRadio app Dallas / Fort Worth Worldwide
Saturdays 1pm-2pm KWEL 1070AM / 107.1FM
Midland Odessa Permian Basin
Sundays 2pm-3pm The Answer 930AM
San Antonio / New Braunfels / San Marcos / Austin
Sundays 8pm-9pm KTRH 740AM / Simulcast on the iHeartRadio app Houston / Worldwide
Saturdays 6am-7am, 11am-12 noon Sundays 6am-7am, 5pm-6pm AM 1440
To listen to the show: Visit shalemag.com or download iHeart mobile app to listen live!
2
HOUSTON | MIDLAND | ODESSA | AUSTIN | DALLAS | SAN ANTONIO CORPUS CHRISTI | HOBBS, NM | LOUISIANA | MEXICO VOLUME 4 // ISSUE 3
2
VOLUME 4 // ISSUE 3
SHALEMAG.COM
3
YOUR PIPELINE TO PREMIUM DISCOUNTS AND INDUSTRY EXPERTISE
WORKERS’ COMP FOR OIL AND GAS DONE RIGHT
Oil and gas expertise. It’s just one of the many advantages of membership in our Texas Oil & Gas Association Safety Group. As a member, you’ll have access to information and resources specific to the oil and gas industry, save about 12% on your workers’ comp premium and you can even earn double dividends. To see if your company qualifies, ask your agent or contact Group Administrator Neal Carlton at ncarlton@txogainsurance.com. TEXASMUTUAL.COM/TXOGA
Dividends are based on performance and are not guaranteed.
9%
50% LOWER FAILURE RATE
21%
HIGHER GROWTH RATE
24-33%
SAVINGS ON
HR ADMINISTRATION
LOWER TURNOVER RATE
2X
MORE PARTICIPATION IN RETIREMENT PLANS
Source: NAPEO publications: Professional Employer Organizations: Fueling Small Business Growth, September 2013, and Professional Employer Organizations: Keeping Turnover Low and Survival High, September 2014, by Laurie Bassi and Dan McMurrer
The numbers don’t lie. Tapping into Insperity’s depth, breadth and level of care can help your company run better, grow faster and make more money. Now, how can we help you improve your bottom line? insperity.com/PEO-inc | 800-465-3800 michaels.murphy@insperity.com
HR and Business Performance Solutions from Insperity: Workforce Optimization Human Capital Management | Payroll Services | Time and Attendance | Performance Management Organizational Planning | Recruiting Services | Employment Screening | Financial Services Expense Management | Retirement Services | Insurance Services 82-1180 | SAL-P0415-629
6
VOLUME 4 // ISSUE 3
FACILITATING TRADE ACROSS THE GLOBAL MARKETPLACE The Port of Corpus Christi’s Foreign Trade Zone 122 program helps increase global competitiveness of U.S.-based companies. Foreign Trade Zone 122 can defer or reduce duty payments, streamline supply chain costs and help companies thrive in competitive domestic and foreign markets. LEARN MORE
SHALEMAG.COM
7
17-0663 SHALE ad-3Q_FINAL.pdf
1
6/13/17
1:29 PM
VOLUME 4 // ISSUE 3
KYM BOLADO/CEO EDITOR-IN-CHIEF Robert Rapier
Providing energy for the world while staying committed to our values. Finding and producing the oil and natural gas the world needs is what we do. And our commitment to our SPIRIT Values—Safety, People, Integrity, Responsibility, Innovation and Teamwork— is how we do it. That includes caring about the environment and the communities where we live and work – now and into the future. © ConocoPhillips Company. 2017. All rights reserved.
www.conocophillips.com
CHIEF FINANCIAL OFFICER Suzel Diego CHIEF REVENUE & DIGITAL STRATEGY OFFICER Fernando Guerra VICE PRESIDENT OF OPERATIONS Amanda Jenkins PUBLICATION EDITOR Tyler Reed ASSOCIATE EDITOR David Porter VIDEO CONTENT EDITOR Barry Basse STAFF WRITERS Felicity Bradstock, Tyler Reed DESIGN DIRECTOR Elisa Giordano SALES & MARKETING Gargi Bhowal / gargi@shalemag.com ACCOUNT EXECUTIVES John Collins, Ashley Grimes, Doug Humphreys, Matt Reed
TOP FIRM 2018-2022
WE SELL, LEASE & MANAGE COMMERCIAL REAL ESTATE
CONTRIBUTING WRITERS Felicity Bradstock, Robert Rapier STAFF PHOTOGRAPHER Malcolm Perez EDITORIAL INTERN LeAnna Castro
www.shalemag.com For advertising information, please call 210.240.7188 or email james@shalemag.com. For editorial comments and suggestions, please email editor@shalemag.com.
YOUR SOUTH TEXAS COMMERCIAL REAL ESTATE CONNECTION SINCE 1975
(361)289-5168 | CraveyRealEstate.com 8
VOLUME 4 // ISSUE 3
SHALE MAGAZINE OFFICES: 9787 Katy Freeway, Houston, Texas 77024 5150 Broadway St., Suite 493, San Antonio, Texas 78209 For general inquiries, call 210.240.7188. Copyright © 2026 Shale Magazine. All rights reserved. Reproduction without the expressed written permission of the publisher is prohibited.
table of contents VOL UME 43 // ISSUE 31
14 cover story
THE GREAT ENERGY REALIGNMENT HOW WAR, AI, AND A RENEWED FOCUS ON ENERGY SECURITY ARE RESHAPING THE GLOBAL ENERGY SYSTEM
industry
22 Potential for Advanced Recycling 24 Marine Energy Potential 26 How the U.S. Came to Dominate Global LNG Growth
28 Will U.S. Wind Make a Comeback?
policy
32 Trump’s Policies Have Driven Up Consumer Energy Bills, Report Finds
34 Accelerating United States’
finance
Mean the Fuel Shock Is Over
Means for Investors
42 Why Falling Oil Prices Don’t 44 Data Centers Set
Nuclear Power Rollout
to Significantly Drive Up Global Emissions
Global CO2 Hit Another Record
Reyhinking Their Renewable Bets
36 U.S. Emissions Rebounded As 38 Will Hawaii be Forced to
Extend Reliance on Fossil Fuels?
MAGNIFIC
business
52 What $100 Oil 54 The AI Boom Is Entering Its “Show Me” Phase
46 Why Oil Majors are
48 Google Doubles Down on Nuclear Power Commitments
SHALEMAG.COM
9
LETTER FROM THE EDITOR-IN-CHIEF
Energy markets have always forced us to think on more than one time horizon at once. A conflict can reroute cargoes and move oil prices overnight. At the same time, pipelines, LNG terminals, power plants, transmission lines, and data centers are investments measured in years or decades. This issue of Shale Magazine sits squarely at the intersection of those two realities. Our cover story, “The Great Energy Realignment,” examines how geopolitics, technology, trade, and rising electricity demand are reshaping a global energy system that had already been undergoing profound change. War, AI, oil, and power may seem like separate subjects, but increasingly they are interconnected parts of the same story. Nowhere is that more apparent than in the Middle East. As I write this, the conflict involving Iran remains unresolved, and uncertainty surrounding the Strait of Hormuz continues to affect global energy markets and shipping. The events of 2026 have provided a powerful reminder that energy security is not simply about having adequate resources in the ground. It is also about whether those resources can be produced, transported, financed, and delivered when and where they are needed. That same question of resilience runs through many of the stories in this issue. We look at how the United States came to dominate global LNG growth, a development that has given American natural gas an increasingly important role in international energy markets. We also examine why major oil companies are reconsidering some of their renewable investments. That shift does not mean renewable energy is disappearing from the global energy mix. Rather, it reflects the continuing challenge of balancing returns, capital discipline, energy demand, and long-term strategic goals.
Technology is exerting its own pressure on the system. Artificial intelligence and the rapid expansion of data centers are driving expectations for electricity demand higher and forcing utilities, technology companies, and policymakers to confront questions that seemed far less urgent only a few years ago. Where will the power come from? How quickly can new generating capacity and transmission be built? What combination of natural gas, nuclear power, renewables, and storage can reliably serve that growth? Several stories in this issue approach those questions from different directions, including the prospects for a U.S. wind resurgence, renewed nuclear development, and the emissions consequences of growing data-center demand. But energy developments do not stop at the lease, pipeline, refinery, or power plant. They move through markets and eventually reach investors. In this issue, we look at what $100 oil means beyond the energy sector and why the artificial intelligence investment boom is entering a more demanding phase, in which investors increasingly want evidence that massive capital commitments will produce adequate returns. If there is a common thread through all of this, it is that the energy world is not moving neatly from one system to another. It is becoming more interconnected, more capital-intensive, and in many ways more strategically important. The challenge will be building an energy system capable not only of meeting tomorrow’s demand, but of withstanding the disruptions we know will come. Thank you for reading Shale Magazine.
ROBERT RAPIER Editor-in-Chief SHALE Magazine
10
VOLUME 4 // ISSUE 3
cover story
HOW WAR, AI, AND A RENEWED FOCUS ON ENERGY SECURITY ARE RESHAPING THE GLOBAL ENERGY SYSTEM
12
VOLUME 4 // ISSUE 3
AUDRIUSVENCLOVA/DEPOSIT PHOTOS
THE GREAT
ENERGY REALIGNMENT By: Robert Rapier
SHALEMAG.COM
13
14
VOLUME 4 // ISSUE 3
MAGNIFIC, SHUTTERSTOCK
F
or most of my career, the closure of the Strait of Hormuz was one of those scenarios that people in the energy business discussed but nobody had ever experienced. I have sometimes called it Iran's “nuclear option,” not because nuclear weapons were involved, but because closing the Strait represented such a consequential escalation and global disruption that Iran would risk triggering a much larger war. Analysts modeled a closure. Governments planned for it. Energy companies incorporated it into risk assessments. Iran periodically threatened it, and oil prices sometimes reacted. But through decades of conflict and tension in the region, commercial traffic continued to move through the Strait. That changed this year. After the United States and Israel launched strikes against Iran on February 28, tanker traffic through Hormuz collapsed. The result was what the International Energy Agency has called the largest supply disruption in the history of the global oil market. In 2025, nearly 20 million barrels per day of crude oil and petroleum products had moved through the Strait, including almost 15 million barrels per day of crude oil. That represented about a quarter of global seaborne oil trade and roughly a third of seaborne crude trade. The disruption was so severe that the International Energy Agency coordinated a 400-million-barrel emergency stock release, the largest in its history. Nearly six months later, one aspect of this crisis has surprised me. I would have expected a disruption of this magnitude and duration to leave benchmark oil prices much closer to $150 a barrel. Some physical crude grades did briefly approach that level in April as refiners scrambled for replacement barrels, but those prices didn't persist. As I write this on August 14, Brent remains below $90 even as tanker traffic remains severely restricted and negotiations between Washington and Tehran are again stalled. That doesn't mean the disruption has been less serious than expected. It means the global energy system has adjusted better than I would have anticipated. IEA countries released emergency stocks. Saudi Arabia and the United Arab Emirates pushed more oil through alternate routes. Producers in the Americas increased their contribution. Refiners changed crude slates and reduced runs when they couldn't get feedstock. High prices also suppressed demand.
and reported continued draws in July. There is a reasonable argument that China's response has done as much as that of any major importing country to keep benchmark oil prices from remaining near $150. But there is an important caveat. Drawing inventories doesn't create new oil. It uses a buffer accumulated earlier. The same is true of the emergency stocks released by the United States, Europe, and other IEA members. The system has managed the crisis remarkably well, but part of the way it has managed is by consuming its insurance policy. That observation gets to what I think is the larger story. The conflict in the Persian Gulf isn't an isolated energy event, any more than Russia's invasion of Ukraine was. The redirection of Russian oil toward Asia, Europe's rapid shift toward LNG, China's effort to build energy options, India's growing importance in world oil markets, the shaledriven change in America's energy position, and the huge new electricity requirements associated with artificial intelligence all point in the same general direction. This is not an energy transition in the conventional sense of one fuel replacing another. It is a realignment in how countries think about energy. Cost and efficiency remain key factors, but resilience, security, infrastructure, and the ability to maintain supply when normal conditions disappear have moved much higher on the list of priorities.
Inventories absorbed a substantial part of the shock. The IEA now estimates that observed global oil inventories have fallen by 410 million barrels since the war began. China has been especially important. It entered the crisis after building substantial inventories during 2025, when oil was cheaper. In the second quarter of this year, Chinese crude imports fell to 8.1 million barrels per day, down 32% from the first quarter. EIA specifically noted that the reduction in Chinese imports softened the upward price pressure caused by the loss of Gulf supply. China's refineries reduced throughput by less than imports declined, which indicates that inventories were being drawn to make up part of the difference. The IEA estimated that Chinese crude stocks fell by 41 million barrels in June
GEOGRAPHY STILL MATTERS One of the clearest lessons from Hormuz is an old one. Technology has not repealed geography. Oil still has to move through pipelines and on tankers. Natural gas has to travel through pipelines or be liquefied, shipped, and regasified. Electricity has to move across transmission systems. We may live in an age of satellites and artificial intelligence, but the global economy continues to depend on physical infrastructure that can be disrupted by geography, politics, weather, and war. The Strait of Hormuz illustrates the problem. Commercial traffic is funneled into shipping lanes only two miles wide in each direction, separated by a two-mile buffer. Saudi Arabia and the UAE have pipelines that can bypass the Strait, but the IEA estimates
that only about 3.5 million to 5.5 million barrels per day of alternative pipeline capacity is available. Against normal Hormuz flows of nearly 20 million barrels per day, that is nowhere close to a complete substitute. Oil is only part of the exposure. More than 110 billion cubic meters of LNG passed through Hormuz in 2025, representing almost one-fifth of global LNG trade. About 93% of Qatar's and 96% of the UAE's LNG exports moved through the Strait, and unlike crude oil, there are no alternative pipeline routes to bring those volumes to market. Nearly 90% of the LNG shipped through Hormuz was destined for Asia, where it accounted for more than a quarter of the region's LNG imports. The chokepoint also reaches beyond energy. More than 30% of global urea trade, about 20% of ammonia and phosphate trade, and roughly half of global seaborne sulfur trade move through Hormuz. Those materials feed fertilizer production, agriculture, chemicals, refining, and metal processing, which is why a prolonged disruption can propagate into food and industrial markets far from the Persian Gulf. The direct U.S. exposure is much smaller than it once would have been. Only 8% of U.S. crude imports came from Middle East Gulf countries in 2025. But California is a notable exception and appears to be the U.S. state with the greatest direct exposure to a Hormuz disruption. California refineries obtained 61% of their crude from foreign sources last year. Iraq supplied 17.5% of California's foreign crude, Saudi Arabia another 7.9%, and the UAE 3.4%. Federal data show that the West Coast accounted for 47% of all U.S. crude imports from the Middle East Gulf, with almost all that volume coming from those same three countries. That geographic exposure also illustrates why redundancy can look wasteful right up until it becomes valuable. Spare pipeline capacity costs money. Maintaining inventories costs money. A second supplier may cost more than the cheapest supplier. Excess generating capacity can depress returns during normal conditions. Yet all those things become valuable when the cheapest route, supplier, or piece of infrastructure suddenly isn't available. I spent a significant part of my career doing risk assessments, and this tradeoff is familiar. The most efficient system under normal conditions isn't necessarily the most resilient system under abnormal ones. Optimizing entirely for the first can leave you dangerously exposed to the second. Europe learned that lesson after Russia invaded Ukraine.
SHALEMAG.COM
15
RUSSIA REWIRED EUROPE’S GAS MARKET AND ASIA’S OIL TRADE Since 2022, Russia’s energy flows have shifted decisively away from Europe and toward Asia, reshaping global trade and energy security.
EUROPE SHARE OF RUSSIAN CRUDE EXPORTS:
51% (2020)
REDUCED FLOW TO EUROPE
INDIA 1.7 million b/d in 2024 LNG SUPPORT U.S. LNG flows help meet Europe’s energy needs.
81% (2024)
RUSSIA
EUROPE
CHINA 2.2 million b/d in 2024
INDIA
India was
~50,000 b/d in 2020 Source concept: EIA analysis based on Global Trade Tracker, Argus, and Vortexa
U.S GULF COAST
RUSSIA REWIRED EUROPE'S GAS MARKET AND ASIA'S OIL TRADE Before February 2022, Russia and Europe had spent decades building one of the largest energy relationships in the world. Europe received enormous quantities of relatively inexpensive Russian natural gas through pipelines, while Russia gained a large, reliable market close to home. The invasion of Ukraine upended that arrangement. Russia supplied about 45% of EU gas imports in 2021. By 2025, that share had fallen to around 12%, and the European Union has now adopted a timetable intended to phase out the remaining Russian gas imports by the end of 2027. American LNG was central to making that possible, and I think that point is sometimes understated. Europe also reduced gas consumption, expanded renewable generation, increased pipeline imports from Norway and other suppliers, filled storage aggressively, and constructed new LNG import capacity. There was no single replacement for Russian gas. But U.S. LNG became one of the pillars of the new European supply system. In 2025, Europe imported a record 10.3 billion cubic feet per day of U.S. LNG, up from 6.3 Bcf/d the previous year. Europe took
16
41% (2020)
CHINA
U.S. U.S
ASIA & OCEANIA SHARE OF RUSSIAN CRUDE EXPORTS:
12% (2024)
VOLUME 4 // ISSUE 3
IN 2025, EUROPE IMPORTED A RECORD 10.3 BILLION CUBIC FEET PER DAY OF U.S. LNG, UP FROM 6.3 BCF/D THE PREVIOUS YEAR. EUROPE TOOK 68% OF ALL U.S. LNG EXPORTS.
68% of all U.S. LNG exports. By the first quarter of 2026, the United States supplied 57.4% of the European Union's LNG imports, up from just 24% at the beginning of 2021. That is a remarkable shift in only five years, and one that would have been impossible without the enormous buildout of U.S. shale gas production and LNG export capacity. Russian oil followed a different path. Sanctions and European restrictions changed where the barrels went, but they did not remove most of those barrels from the global market. China remained a major Russian customer, while India went from importing about 50,000 barrels per day of Russian crude and condensate in 2020 to roughly 1.7 million barrels per day in 2024. That is an important distinction when thinking about sanctions and energy security. Sanctions can change prices, buyers, shipping routes, financing, insurance, and the profitability of production. They can impose significant costs. But when the world still needs more than 100 million barrels of oil every day, large volumes tend to find another route to market if one exists. Europe's gas system and Russia's oil trade therefore tell different versions of the same story. Political decisions can radically reshape energy flows, but physical supply and demand continue to exert enormous pressure on where those flows ultimately go.
provide another layer of protection. China spent much of 2025 adding to those crude inventories while prices were relatively low. EIA estimated that Chinese crude stocks increased by about 900,000 barrels per day during the first eight months of 2025, and the IEA later estimated that China added 111 million barrels over the full year. When Hormuz became severely constrained, China had a substantial buffer to draw upon. India faces a different set of circumstances. It imports close to 90% of the crude oil it consumes, so it cannot reproduce China's domestic energy base. Instead, it has diversified suppliers and built one of the world's largest refining industries. Indian refiners buy crude from Russia, the Middle East, the United States, and numerous other producers, then export substantial quantities of refined products. I view that as deliberate strategic diversification. A country whose energy demand is likely to grow enormously over the coming decades has a powerful incentive not to become dependent on a single supplier or political bloc. India has increasingly used its size as a buyer and refiner to give itself more choices. That concept of choice, or optionality, is becoming one of the defining characteristics of energy security.
CHINA AND INDIA ARE BUILDING OPTIONS
AMERICA'S ENERGY POSITION HAS CHANGED
China is another country whose energy strategy can look contradictory if viewed through the usual political categories. It is the world's largest importer of crude oil and the largest consumer of coal. At the same time, no country builds more solar or wind power. China is expanding nuclear power rapidly, has invested heavily in batteries and electric vehicles, and imports natural gas through both pipelines and LNG terminals. That combination makes more sense if you view it through the lens of energy security rather than asking whether China is choosing fossil fuels or clean energy. China is trying to reduce its exposure to any single fuel, supplier, or transportation route. Domestic coal offers a large supply that can't be cut off by a foreign navy. Solar, wind, and nuclear power reduce the amount of imported fuel needed to generate electricity. Pipelines from Russia and Central Asia provide alternatives to maritime gas imports. Electrification of transportation can reduce future oil-import requirements. Strategic petroleum inventories
The United States is in a dramatically different position than it was the last time the world experienced this kind of prolonged Middle East energy shock. The 1973 Arab oil embargo arrived when domestic oil production was declining and imports were rising. The consequences included gasoline lines, price controls, rationing schemes, and a national fixation on “energy independence” that lasted for decades. By 2005, U.S. net petroleum imports were equal to about 60% of domestic liquid-fuel consumption. Then the shale revolution changed the balance. U.S. crude oil production reached a record 13.6 million barrels per day in 2025, and the EIA currently forecasts another record of 13.8 million barrels per day this year. Natural gas production also reached a record last year, and the United States is now the world's largest LNG exporter. U.S. LNG exports averaged 15.1 Bcf/d in 2025 and are forecast to reach 17.4 Bcf/d this year. I have often been cautious about the
phrase “energy independence,” because it is frequently used to imply something that isn't true: that the United States no longer depends on international energy trade or global energy markets. We absolutely do. We remain a net importer of crude oil, and a disruption in the Persian Gulf can still raise gasoline and diesel prices in Phoenix, Houston, or New York because oil prices are set in a global market. But there is another definition of energy independence under which the United States now clearly qualifies. In 2025, the country produced about 107 quadrillion Btu of energy and consumed about 96 quadrillion Btu. U.S. energy production has exceeded consumption since 2019. In aggregate energy terms, we now produce more than enough energy to cover what we consume. That change from net energy importer to net energy exporter was largely driven by the growing volume of oil and gas produced by the shale boom that began about 20 years ago. That doesn't mean we could sever international energy trade tomorrow without significant disruption or cost. Different forms of energy are not easily interchangeable, and neither are different grades of crude oil. Much of U.S. shale production is relatively light and sweet, while many American refineries were designed to process heavier, more sour crude. It can therefore make economic sense to export light U.S. crude while importing heavier barrels from Canada, Mexico, Venezuela, and the Middle East. EIA notes that light sweet grades dominate domestic production while the United States continues to rely on imports for heavier and more sour grades. The sharp return of Venezuelan crude to U.S. refineries this year reinforces that point. Venezuelan shipments to the United States reached roughly 786,000 barrels per day in July, the highest level since early 2019. That isn't evidence that America suddenly lacks oil. It reflects the fact that Venezuelan heavy crude is well suited to a portion of the U.S. refining system. So, I would describe the United States today as energy independent in an aggregate production-versus-consumption sense, but certainly not isolated from global energy trade. In fact, trade is one of our strengths. We can export crude oil, LNG, refined products, and other forms of energy while importing the specific grades and products that make the most economic sense for our infrastructure. The difference from the 1970s is profound. A Middle East supply shock still hurts American consumers, but the United States now responds from the position of the world's largest oil and
SHALEMAG.COM
17
natural gas producer and largest LNG exporter rather than as an increasingly import-dependent producer in decline.
AI IS MAKING ELECTRICITY STRATEGIC
nearly half of the growth in electricity demand through the end of the decade. This is bringing the technology and energy industries together in ways we haven't seen before. Technology companies are signing long-term power contracts, supporting nuclear restarts and new reactor projects, contracting for renewable electricity and storage, and exploring dedicated natural gas generation because electricity availability increasingly determines where and how quickly they can expand. That doesn't point toward a single winning fuel. The IEA expects renewables to supply nearly half of the additional electricity MAGNIFIC
While geopolitics is reminding the world of the importance of oil and natural gas, artificial intelligence is creating a very different energy challenge. U.S. electricity demand barely grew for
many years. Improvements in efficiency offset much of the growth in population and economic activity, and an entire generation of utility planning evolved around relatively modest load growth. That period is ending. U.S. electricity generation set another record in 2025, rising 2.8% from the previous year, and data centers are becoming an increasingly important source of new demand. The International Energy Agency estimates that global data-center electricity consumption will rise from about 485 terawatt-hours in 2025 to roughly 950 TWh in 2030. In the United States, data centers are expected to account for
18
VOLUME 4 // ISSUE 3
needed for data centers over the next several years, with natural gas and coal also contributing and nuclear becoming more important later in the decade. That mix makes sense when you consider what a large data center actually needs. Solar can be added relatively quickly and at large scale, but its output varies by time of day and weather. Natural gas can provide flexible, dependable generation, but turbines and pipeline capacity have become constraints. Nuclear can provide large quantities of reliable, carbon-free power but takes much longer to license and build. Batteries can shift electricity and help
balance variable sources, but they must first be charged by some other source. The challenge isn't choosing one of these technologies. It is putting enough of them together, along with the transmission, transformers, substations, pipelines, and other infrastructure required to deliver reliable power. We are already seeing regulatory and political pushback when the pace of data-center development runs ahead of the infrastructure needed to support it. On August 3, Texas paused new datacenter development while the state gathers more information on projects already under review. EIA responded by reducing its forecast for Texas electricityload growth in 2027 from 14% to 6%. That doesn't mean the underlying AI demand has disappeared. It means projected electricity demand and demand that can actually be connected to the grid on schedule are two different things.
WHAT AMERICAN ENERGY TAUGHT ME ABOUT THE PRESENT This historical context is particularly relevant to me because this year my son Luke and I published American Energy: A History of Power, Progress, and Change. I had wanted for years to write a book tracing the
development of energy in America, from wood and water power through coal, oil, natural gas, nuclear energy, and today's renewable technologies. I approached the subject through engineering, markets, resources, and infrastructure; Luke, who studied history and international studies, brought a historian's focus on timing, institutions, politics, communities, and national power. Looking across more than two centuries of American energy history through both lenses reinforced something I have believed for a long time: energy transitions appear much cleaner when viewed backward than they do while you are living through them. The shorthand version of history makes it sound as though wood gave way to coal, coal to oil, and then new technologies successively displaced what came before. The actual history is much messier. New energy sources usually grew alongside existing ones for long periods. Coal did not disappear when oil became dominant in transportation. Oil did not disappear when natural gas expanded. Nuclear power did not eliminate coal or natural gas, and the explosive growth of wind and solar has not caused global fossilfuel consumption to collapse. Total energy demand often grew fast enough for old and new sources to expand simultaneously. We are seeing that pattern again. Solar and wind continue to expand, nuclear energy is receiving renewed investment, natural gas demand is benefiting from LNG growth and rising electricity needs, and global oil consumption remains enormous.
SHALEMAG.COM
19
THE CONSTRAINT IS INCREASINGLY OUR ABILITY TO BUILD The United States enters this period with considerable advantages. We have enormous oil and natural gas resources, some of the world's best renewableenergy resources, an existing nuclear fleet, extensive energy infrastructure, deep capital
markets, strong technology companies, and a large base of technical expertise. Increasingly, however, the question isn't whether the underlying energy resource exists. It is whether we can turn that resource into useful energy and deliver it where it is needed quickly enough. A natural gas field doesn't power a data center without pipelines, turbines, transmission lines, substations, and an interconnection. A solar project that spends years in an interconnection queue cannot meet a customer's near-term electricity needs. A promising new nuclear design contributes nothing until it is licensed, MAGNIFIC
AI is now layering another electricityintensive industry on top of all of them. From that historical perspective, the present looks less contradictory. Energy systems tend to accumulate new sources long before older ones disappear. That lesson from American Energy shapes how I view the current realignment. I don't expect the next phase of the global energy system to be defined by a single dominant new resource. I expect successful countries to combine multiple resources, technologies, suppliers, and delivery systems while reducing their exposure to any one point of failure.
20
VOLUME 4 // ISSUE 3
financed, manufactured, and constructed. Oil reserves in Venezuela don't help a refinery if production equipment, pipelines, ports, skilled workers, and a stable investment framework aren't in place. The same principle applies internationally. The Persian Gulf has not run out of oil. The problem is getting that oil through a contested shipping route. Russia has not run out of petroleum. The challenge is moving it through a trading system constrained by sanctions, financing, insurance, and changing political relationships. Europe did not replace Russian gas by discovering a giant new gas field under Germany. It built LNG import capacity, attracted cargoes from the United States and elsewhere, expanded alternative supplies, reduced demand, and paid for a more diverse system. The Iran crisis has also demonstrated that resilience works, but not without cost. The global oil market entered the war with unusually large inventories and significant excess supply. Since then, hundreds of millions of barrels have been drawn from storage, emergency reserves have been tapped, shipping patterns have been rearranged, refiners have cut output, and consumers have responded to higher prices. That flexibility is a major reason benchmark crude is still below $100. But inventories aren't infinite, and infrastructure can't always be improvised during a crisis. For the United States, I think the defining energy question of the next decade may be less about what resources we possess than how quickly we can build. The shale revolution demonstrated what American technology and capital could accomplish when they were applied to an enormous resource base. The next challenge involves power plants, pipelines, transmission, transformers, LNG facilities, nuclear projects, storage, manufacturing capacity, and the skilled workforce needed to construct and operate all of it. That shift changes where strategic value sits. When resources are available but deliverability is scarce, existing transmission corridors, firm pipeline capacity, grid interconnections, transformers, turbines, operating nuclear assets, storage, and other infrastructure become more valuable. So do the less visible capabilities such as permitting, engineering, construction, manufacturing,
and skilled labor that determine whether a project can move from announcement to operation. This is not an argument for one winning fuel. It is an argument for the infrastructure that can turn a diverse resource base into dependable supply. The risk shifts with it. If utilities and developers build for projected AI loads that arrive late or never materialize, someone can be left paying for underused infrastructure. That is why large customers are increasingly being asked to make longterm commitments, post collateral, accept minimum-demand provisions, or contribute directly to infrastructure costs. The next phase of the buildout will be shaped not only by how much electricity data centers say they want, but by how much of that demand is firm enough to finance.
WHAT THE REALIGNMENT MEANS When I connect these developments, I don't see a world in which oil is about to disappear or one in which fossil fuels are destined to crowd out every alternative. Neither interpretation fits what is happening. Russia's invasion of Ukraine changed the direction of major oil and gas flows. Europe traded heavy dependence on Russian pipelines for a more diversified and more expensive supply system in which American LNG is central. China has built across nearly every major energy source while accumulating inventories and alternative supply routes. India has diversified suppliers and used its refining scale to expand its choices. The United States now produces more total energy than it consumes while remaining deeply integrated into world energy trade. Hormuz has reminded everyone that geography can still disrupt all of it. At the same time, AI is turning electricity supply into a constraint on technological growth. Utilities, regulators, technology companies, and governments now must think about electricity not simply as a mature utility service, but as infrastructure supporting national competitiveness. Those developments share a common
theme. Energy security increasingly depends on having options: multiple sources, multiple suppliers, multiple transportation routes, sufficient inventories, adequate infrastructure, and enough flexibility to continue functioning when one part of the system fails. None of that makes efficiency irrelevant. Redundancy is expensive, and somebody ultimately has to pay for it. Depending on the project, that may be consumers, taxpayers, investors, or the large customer driving the need. Building too much infrastructure can be just as costly as building too little. The challenge is determining how much resilience is worth paying for before the next disruption occurs. The past six months have made me more optimistic about the resilience of the global energy system than I was when this crisis began. If someone had told me in February that flows through Hormuz would remain severely impaired into August, I would have expected sustained oil prices considerably higher than what we are seeing today. The market adapted through inventories, alternative routes, changing trade flows, increased supply from elsewhere, and lower demand. But the fact that the system has managed doesn't mean the underlying vulnerabilities have disappeared. Much of the cushion that allowed the world to absorb the shock is being depleted. The infrastructure bottlenecks exposed by AI are becoming more obvious. And the geopolitical relationships that once allowed energy to flow primarily according to economics are increasingly being shaped by national security. That is what I mean by the Great Energy Realignment. It isn't a prediction that one fuel or technology will dominate the next era. It is a shift toward a world in which resilience, optionality, infrastructure, and the ability to deliver energy under stress carry more strategic value than they did a decade ago. The United States is unusually well positioned for that world. Whether we capitalize on that position will depend not only on the resources beneath our feet, but on whether we can build the systems needed to put them, and all of our other energy options, to work.
About the author: Robert Rapier is a chemical engineer in the energy industry and Editor-in-Chief of Shale Magazine. Robert has over 30 years of international engineering experience in the chemicals, oil and gas, and renewable energy industries and holds several patents related to his work. He has worked in the areas of oil refining, oil production, synthetic fuels, biomass to energy, and alcohol production. He is author of multiple newsletters for Investing Daily and of the book Power Plays. Robert has appeared on 60 Minutes, The History Channel, CNBC, Business News Network, CBC, and PBS. His energy-themed articles have appeared in numerous media outlets, including the Wall Street Journal, Washington Post, Christian Science Monitor, and The Economist.
SHALEMAG.COM
21
INDUSTRY
Potential for Advanced Recycling By: Felicity Bradstock
MAGNIFIC
22
VOLUME 4 // ISSUE 3
A
s plastic production has increased over the last century, there is more talk about the need for advanced recycling. Some plastic products are already recycled mechanically. However, a major waste problem remains, as many products cannot be recycled and are, instead, sent to landfill. As more waste accumulates worldwide, washing up on beaches and destroying habitats, there is a growing need to reduce this waste. The Plastic Problem The plastic industry was established in the United States in the early 1900s with the creation of early plastic products, such as billiard balls, hair combs, and rotary telephones. Annual global plastic production has risen significantly over the last century, from around 1.5 million metric tons in 1950 to 376 million metric tons in 2019. The type of plastic being produced has also changed in line with technological innovations. In 2019, approximately 133 million metric tons of the plastics produced were single-use, predominantly used in packaging. Clothing has also become a major plastics market, due to the increased use of materials such as nylon and polyester. Other industries highly reliant on plastic include the construction, transportation, electricity production and transmission, agriculture, and medical sectors. By 2017, cumulative global plastic production exceeded eight billion metric tons. Less than 10% of global plastic waste has been recycled to date, mainly due to the lack of effective recycling methods for certain types of plastics. However, many governments are now exploring the potential of chemical recycling, also known as advanced recycling, to help them address the waste problem and become more sustainable. What is Advanced Recycling? Advanced recycling makes it possible to recycle a broader range of plastic products than mechanical recycling can. This includes hard-to-recycle plastics such as plastic bags, films and wrappers, as well as carpet, artificial turf, clothing, and other durable goods that would otherwise end up in landfill. The term advanced recycling covers various recycling methods that use different technologies to break down plastic to the molecular level, into liquid or gaseous raw materials, typically using heat and chemicals. This can allow for plastic
Environmentalists and scientists have warned that chemical recycling may release toxic chemicals into the atmosphere and have called for close surveillance of the industry. products to be produced, used, recycled, and reused, creating a circular economy.
with little consideration for its impact on the environment and human health.
The Rise and Fall of Advanced Recycling in the U.S. However, at present, there are only around eight operational chemical recycling facilities in the United States, down from 11 in 2023. Six of these are pyrolysis plants, which can transform plastic waste into oil to be used as industrial heating fuel, as a substitute for diesel, or as a raw material for producing new plastic products. So far this year, three companies have cancelled plans for chemical recycling plants. A $145 million Braven Environmental pyrolysis plant in Texarkana, Texas; a Green Mountain Energy LLC plastics-to-fuel plant in Kentucky; and a Freepoint Eco-Systems facility in Ohio will no longer be developed. The closure of the Freepoint and Braven plants was due to environmental violations cited by state regulators, which involved harmful air pollution and hazardous waste. The Freepoint facility was forced to stop operations due to violations for dozens of unreported equipment malfunctions and illegal emissions. In addition, Freepoint had failed to produce enough pyrolysis oil to meet Ohio’s definition of recycling, meaning that it faced reclassification as a waste incinerator. Critics of advanced recycling have long warned that it is not the solution for dealing with plastic waste and suggest that plastic production must, instead, be reduced to avoid creating this waste in the first place. Environmentalists and scientists have warned that chemical recycling may release toxic chemicals into the atmosphere and have called for close surveillance of the industry. Moreover, it is extremely difficult to economically scale up advanced recycling operations. Many have also blamed the plastics and chemicals industries for promoting the practice
Trump Administration Support Despite recent failures, the Trump administration has shown support for advanced recycling. In November 2025, the Environmental Protection Agency administrator, Lee Zeldin, toured the advanced recycling operations at ExxonMobil Baytown plant in Texas, later appearing on the firm’s promotional videos. Zeldin wrote an opinion piece about advanced recycling in which he stated, “If America does not invest in scaling this technology now, it stands to lose not just an environmental opportunity, but an enormous economic opportunity as well.” He suggested that over 90 new advanced recycling facilities were ready to be built across the country. It remains unclear whether we can create advanced recycling techniques that can be effectively scaled up to tackle the plastic waste problem and that are less harmful to the environment than existing methods. However, cutting production at the source would, of course, be a more effective way to reduce plastic waste. In addition, investing in research and development into alternative materials to plastic could help support these aims.
About the author: Felicity Bradstock is a freelance writer specializing in Energy and Industry. She has a Master’s in International Development from the University of Birmingham, UK, and is now based in Mexico City.
SHALEMAG.COM
23
INDUSTRY
Marine Energy Potential By: Felicity Bradstock
Marine energy, or tidal energy, is a little-known source that is growing steadily worldwide. Despite cutting funds for several renewable energy sectors, the United States Department of Energy (DoE) continues to back marine energy, with new funding programs announced this year. Marine Energy Overview Certain bodies of water can be used to produce electricity by using a wave energy converter to capture and convert wave energy. Some devices are positioned under the water’s surface; others are anchored to the ocean floor; while another technology pushes waves through a narrow channel to power a turbine. Waves have the highest energy density of a renewable energy source, meaning there is significant potential to harness their power to produce abundant, clean energy. Unlike less stable renewable energy sources, such as wind and solar power, tides are highly predictable, with a high and a low tide occurring twice every day. However, due to a lack of interest in marine energy, its development has fallen behind several other green energy sources, meaning that greater investment must be made in research and development to expand tidal energy capacity.
24
VOLUME 4 // ISSUE 3
Several countries, including Australia, China, Denmark, Italy, Korea, Portugal, Spain, the United Kingdom, and the United States, are currently developing their marine energy sectors. The U.S. Energy Information Administration (EIA) estimates that the waves around the United States coasts could be sufficient to provide 66% of the country’s electricity if exploited. Challenges for Harnessing Tidal Energy Several challenges to constructing marine energy projects have deterred companies and governments from pursuing the development of the clean energy source in the past. Developing and operating tidal energy facilities is typically quite expensive. There are also environmental concerns around the use of cables, turbines, and other infrastructure in bodies of water, which could harm marine life. Further, many coastal populations have opposed project development due to the common “not in my backyard” stance to unfamiliar energy projects. Significant investment is required to scale up tidal energy for commercial rollout. The International Energy Agency (IEA) suggests in its Ocean Power tracking report that using marine energy to help the world reach carbon neutrality by 2050 would require an average capacity growth of 33% a year between 2020 and 2030. “Marine technologies hold great potential, but additional policy support for energy research, development and demonstration is needed,” the IEA states. Nevertheless, greater investment in research and development could help
develop marine energy in the years to come and help to diversify the energy mix. Marine Energy Growing in the U.S. In May, the U.S. Testing Expertise and Access to Marine Energy Research (TEAMER) program approved a record 34 marine energy projects through its 17th Request for Technical Support, at a value of $4.8 million. TEAMER is backed by the DoE and managed by the Pacific Ocean Energy Trust. Its aim is to support marine energy development by enhancing access to national research infrastructure to tackle technical barriers and accelerate the deployment of the energy source. The technical support recipients will be given the tools to conduct research and development into tidal power at TEAMER facilities. The companies approved to develop projects include Equinox Ocean, Ocean Energy USA LLC, and Orbital Marine Power, among others. Small-Scale Projects Contribute to Research Several U.S. states are developing small-scale marine energy projects to explore the potential for new technologies in the sector. This is particularly being seen in rural areas without easy access to conventional energy sources. In Michigan, Beaver Island is situated at the northernmost end of Lake Michigan, around 70 miles from the maritime border with Canada. It has around 600 permanent residents and is popular in the summer among tourists. It is only accessible by boat or plane, and getting electricity to the island is no easy feat. Power is provided to Beaver Island via cables from mainland Michigan, crossing around 30 miles of lakebed. For this reason, power outages are a common occurrence during severe weather events or when wires break. A 2025 ice storm resulted in Beaver Island losing power for several weeks. This has led researchers to look for alternative energy sources to help prevent future outages. In June, researchers from the University of Michigan deployed two devices that were designed to convert the kinetic energy of waves into electricity. The prototypes look like small boats with a PVC frame and measure around two feet. During the demonstration, researchers successfully used the technology to power a lightbulb and charge a cell phone. The researchers have been working closely with the island’s community to understand their needs and the resources available. Lei Zuo, the lead researcher on the project, explained, “We need to work with the community together to identify the need and design together with them.” Beaver Island is just one example of a rural community that could use tidal power to provide a stable source of electricity where one is not currently available. Developing more projects like these could also enhance research and development in U.S. marine energy.
About the author: Felicity Bradstock is a freelance writer specializing in Energy and Industry. She has a Master’s in International Development from the University of Birmingham, UK, and is now based in Mexico City. ALEXMIT/DEPOSITPHOTOS
SHALEMAG.COM
25
INDUSTRY
How the U.S. Came to Dominate Global LNG Growth By: Robert Rapier
G
lobal liquefied natural gas exports grew by about 1.2 trillion cubic feet in 2025. The United States supplied approximately 1.10 trillion cubic feet of that increase. Put another way, roughly 93% of the world’s additional LNG came from the United States. The scale of that contribution is even more striking considering where the industry stood a decade ago. In 2015, the United States exported less than 0.03 trillion cubic feet of LNG. By 2025, exports had reached 5.2 trillion cubic feet, making the United States the world’s largest LNG exporter by a substantial margin. Data from the Energy Institute’s 2026 Statistical Review of World Energy show that U.S. LNG exports increased 27% last year, up from 4.1 trillion cubic feet in 2024. Total global exports increased from 19.3 trillion cubic feet to 20.4 trillion cubic feet. The U.S. share of the global LNG export market reached 25.4%. Qatar ranked second with exports of 3.9 trillion cubic feet, followed by Australia at 3.7 trillion cubic feet.
Those numbers represent more than a strong year for American exporters. They show how thoroughly the United States has changed the global natural gas market. A Decade Changed the Market In 2015, Qatar dominated LNG exports with 3.7 trillion cubic feet. Australia was still expanding rapidly and exported 1.4 trillion cubic feet. The United States was near zero.
26
VOLUME 4 // ISSUE 3
Ten years later, Qatar’s exports were only modestly higher. Australia had climbed into the top tier, but its growth had leveled off. U.S. exports, meanwhile, had risen more than two hundredfold. That expansion began with the shale revolution, which unlocked enormous volumes of relatively low-cost natural gas. It was reinforced by infrastructure that was already in place along the Gulf Coast, including pipelines, storage facilities, ports, petrochemical complexes, and an experienced energy workforce. Some of the first LNG export facilities were converted from terminals originally built to import gas. That reversal reflected how dramatically the shale boom had changed expectations. The United States went from preparing for greater dependence on imported gas to building an industry around exporting domestic production. Plaquemines LNG in Louisiana provided much of the new supply in 2025 as the facility ramped up. Corpus Christi Stage 3 also began adding supply. The International Energy Agency estimates that Plaquemines alone accounted for more than 60% of the increase in global LNG supply during the year. The structure of many U.S. LNG contracts has also contributed to their appeal. American contracts are often linked to domestic natural gas prices and allow buyers more freedom to redirect cargoes. That flexibility gives customers the option of sending LNG to Europe, Asia, or Latin America depending on prices and demand. Europe Took Most of the Additional Supply The Energy Information Administration reports that American LNG shipments to Europe averaged a record 10.3 billion cubic feet per day in 2025, up from 6.3 billion cubic feet per day in 2024. Europe received approximately 68% of total U.S. LNG exports. Europe still imported LNG from Russia, Qatar, Algeria, Nigeria, and several other producers. None came close to the volume supplied by the United States.
Europe has not ended its reliance on imported energy. What has changed is the way that gas reaches the continent and the number of suppliers competing to provide it. Pipeline gas connects a producer and customer through fixed infrastructure. An LNG cargo can be redirected while it is in transit. When European prices rise, cargoes that might otherwise have gone to Asia can move toward European terminals instead. That flexibility provides an important measure of energy security, but it comes with a price. Europe must compete with buyers elsewhere for available cargoes. During a cold winter or a major supply disruption, the competition can become intense. Market conditions favored Europe in 2025. Asian LNG demand softened, while U.S. shipments to China fell sharply amid trade tensions. More American cargoes were therefore available for European customers willing to pay for them. Record Production Made the Surge Possible U.S. natural gas production reached a record 103.9 billion cubic feet per day in 2025, up more than 4% from the previous year and accounting for more than 25% of global production. The U.S. remains by far the world’s largest natural gas producer. The Appalachia region remained the country’s largest source of natural gas. However, limited pipeline capacity continues to restrict how much additional production can move from the region to major consuming and export markets. The Permian Basin supplies large volumes of associated natural gas produced alongside crude oil. Because drilling decisions there are often driven by oil prices, Permian gas production can continue growing even when natural gas prices are relatively weak. The Haynesville region has a different advantage. Its location in eastern Texas and northern Louisiana places it close to several Gulf Coast LNG terminals. That reduces transportation distances and makes the region especially responsive to increasing export demand. Production growth has allowed the United States to increase LNG exports without abandoning its domestic market. U.S. natural gas consumption also reached a record 88.4 billion cubic feet per day in 2025. At the same time, pipeline exports to Mexico continued to provide another major outlet for American gas. This is an important distinction. The LNG boom has not been built by dividing a fixed supply among more customers. Producers
have added enough output to support rising domestic consumption, pipeline exports, and LNG exports simultaneously. Whether that balance can be maintained will become increasingly important. Export capacity is growing, electricity demand is rising, and new data centers and industrial facilities are adding load. If production and pipeline construction fail to keep pace, domestic prices will feel more of the pressure from overseas demand. LNG Is Rewriting Global Gas Trade The shift toward LNG extends beyond the rise of the United States. Interregional LNG trade increased by approximately 6.5% in 2025, while interregional pipeline trade declined by about 3.6%. LNG accounted for roughly 55% of interregional natural gas trade, compared with less than 40% a decade earlier. Natural gas was once primarily a regional commodity. Prices in North America, Europe, and Asia could move independently because limited infrastructure connected the markets. LNG has weakened those boundaries. A disruption in one region can now affect prices elsewhere by changing where cargoes are sent. The global gas market still is not as integrated as the oil market, but it is moving in that direction. Recent disruptions to LNG flows through the Strait of Hormuz have reinforced the strategic value of supply originating outside the Persian Gulf. The IEA estimates that LNG moving through the strait had represented almost 20% of global supply before the 2026 disruption. For American producers, that creates access to a much larger customer base. For domestic consumers, it means U.S. prices will become more sensitive to global supply, weather, and geopolitical events . More U.S. Capacity Is Coming The 2025 increase was not a one-time jump. Several U.S. terminals are still ramping up, while others are under construction. U.S. LNG exports are expected to average around 17 billion cubic feet per day in 2026 and rise again in 2027 as additional capacity enters service. Corpus Christi Stage 3 and Plaquemines will continue expanding, while Golden Pass, Port Arthur, and Rio Grande LNG represent the next wave of large projects. Projects totaling more than 2.8 trillion cubic feet of annual export capacity reached final investment decisions during 2025. The International Energy Agency expects the United States to supply roughly one-third of
the global LNG market by the end of the decade. There are constraints. LNG terminals require billions of dollars and years of construction. They also need pipelines capable of delivering enormous volumes of feed gas. Developers must be confident that overseas customers will honor long-term commitments and that global demand will remain strong. The effect on U.S. prices also deserves attention. LNG exports create a valuable market for producers, but every additional terminal adds another source of demand. Consumers have benefited from abundant low-cost natural gas for years. Continued production growth will be required to preserve that advantage. The Big Picture The United States did more than lead the world in natural gas production and LNG exports during 2025. It supplied nearly all of the market’s growth. That is the clearest measure of how important U.S. natural gas has become. Qatar and Australia remain major exporters, but neither is currently adding supply on the same scale. For the moment, the global LNG market is relying on the United States to meet most of its incremental demand. With more Gulf Coast capacity approaching completion, that role is likely to grow.
About the author: Robert Rapier is a chemical engineer in the energy industry and Editor-inChief of Shale Magazine. Robert has over 30 years of international engineering experience in the chemicals, oil and gas, and renewable energy industries and holds several patents related to his work. He has worked in the areas of oil refining, oil production, synthetic fuels, biomass to energy, and alcohol production. He is author of multiple newsletters for Investing Daily and of the book Power Plays. Robert has appeared on 60 Minutes, The History Channel, CNBC, Business News Network, CBC, and PBS. His energy-themed articles have appeared in numerous media outlets, including the Wall Street Journal, Washington Post, Christian Science Monitor, and The Economist.
SHALEMAG.COM
27
INDUSTRY
Will U.S. Wind Make a Comeback? By: Felicity Bradstock
A
fter over a year of legal battles to curb offshore wind development in the United States, the Trump administration has shown it is willing to pay to stop developers from progressing on offshore wind projects. Several of Trump’s executive orders aimed at stopping wind development have been overturned by judges who deemed them unlawful in recent months. This has led the Trump administration to pay energy companies millions of dollars to cancel in-development projects and to urge some companies to invest the money in fossil fuels instead. Legal Battles with Wind Developers In January 2025, Trump issued an executive order that paused approval for wind development. The Trump administration has since halted development on several offshore wind projects, causing significant delays for companies. In 2025, the Department of the Interior (DoI) issued halt-work orders at five wind farm projects that were already under construction off the U.S. East Coast. The Pentagon has also attempted to halt wind farm approvals on federal land. However, federal judges have since overturned all of these orders. In February, a federal judge threw out the Interior Department’s halt-work order on a multibillion-dollar wind farm off the coast of New York State. U.S. District Court for the District of Columbia Judge Royce Lamberth issued a preliminary injunction allowing the developer of Sunrise Wind to resume construction as the legal battle continued. $1 Billion to TotalEnergies In March, U.S. Interior Secretary Doug Burgum announced plans at the annual CERAWeek conference in Houston to pay French wind developer TotalEnergies almost $1 billion to scrap plans to develop wind farms off the U.S. East Coast. The agreement stated that TotalEnergies would have to give up two offshore leases it had purchased off New York and North
28
VOLUME 4 // ISSUE 3
Carolina, in exchange for a $928 million reimbursement from the Interior Department, which it had paid for the leases under Joe Biden. A statement from the DoI explained that the deal required the French firm to pledge not to develop any new U.S. offshore wind projects and, instead, to invest nearly $1 billion in the development of four trains at the Rio Grande LNG plant in Texas and develop upstream conventional oil. Burgum explained, “We’re partnering with TotalEnergies to unleash nearly $1 billion that was tied up in a lease deposit that was directed towards the prior administration’s subsidies that were pushing expensive weather-dependent offshore wind”. Seven Democratic-controlled states, including New York, have since sued the Trump administration over the DoI agreement with TotalEnergies. $765 Million to Cancel 4 More Wind Projects In June, the DoI announced that it planned to pay Invenergy $765 million to scrap plans to develop offshore wind farms in the Atlantic and Pacific oceans. The operator will be expected to surrender four leases in federal waters for offshore wind farms, planned for New York Bight, off the Central Coast of California, and in the Gulf of Maine, all of which were paused in early stages of development. Invenergy agreed, instead, to fund the construction of at least five new natural gas-fired power plants in the Midwest, as well as geothermal projects in the Western United States. Also in June, the Trump administration announced plans to pay Duke Energy $129 million to abandon its plans to develop an offshore wind farm off the coast of North Carolina, making it the fourth of this type of deal and echoing the agreement the Trump administration struck with TotalEnergies, as Trump aims to encourage a shift away from offshore wind to expand conventional fossil fuel projects. The string of agreements with wind
companies in recent months suggests that this may be the Trump administration’s new strategy to quash offshore wind development after seeing that a legal approach would not work. Support and Opposition President Trump stated at a January White House meeting, “My goal is to not let any windmill be built. They’re losers.” Meanwhile, Burgum cited concerns that offshore wind projects pose national security risks as the reason for the expensive agreements. However, the DoI has not publicly expanded on these concerns, and several federal judges have, so far, not been convinced by the Trump administration’s arguments. Meanwhile, proponents of offshore wind have widely criticized the payment agreements for the unconventional use of taxpayer money for alternative projects and for delaying the development of affordable, clean wind power. In addition, they point out that many Northeast regions were counting on wind farms to meet their rising electricity demand and could now face shortages. Having lost several legal battles to delay offshore wind development, the Trump administration has announced several payment agreements that require energy companies to refocus their efforts on fossil fuel projects rather than renewable energy. This has helped advance Trump’s energy agenda but could deter future investment in U.S. renewable energy due to market uncertainty among investors.
About the author: Felicity Bradstock is a freelance writer specializing in Energy and Industry. She has a Master’s in International Development from the University of Birmingham, UK, and is now based in Mexico City.
ROMASET/DEPOSIT PHOTOS
SHALEMAG.COM
29
30
VOLUME 4 // ISSUE 3
SHALEMAG.COM
31
POLICY
Trump’s Policies Have Driven Up Consumer Energy Bills, Report Finds
P
resident Trump has made big promises about the future of energy in the United States, but has so far been unable to deliver on lower energy bills. A recent report found that, rather than cutting costs, Trump’s energy policies have driven up consumer energy bills over the last year. Trump’s Big Energy Pledges Upon entering office in January 2025, President Trump declared an “energy emergency”, saying that the U.S. must move away from Biden’s policy of green transition – “the green new scam” – to return to one of fossil fuel expansion. Trump doubled down on this initiative over the following months by issuing a series of
32
VOLUME 4 // ISSUE 3
executive orders that limited the development of new renewable energy projects while encouraging the expansion of oil, gas, and coal operations, as well as nuclear power. The purpose of this policy push, Trump said, was to lower energy prices. The Trump administration made over one billion acres of federal land and water available for oil and gas drilling, revoked Environmental Protection Agency regulations that restricted fossil fuel development, and prolonged the life of ageing coal plants. Trump also called for Nuclear safety regulators to ease restrictions on new reactor approvals. Meanwhile, the federal government repealed subsidies for solar panels, wind turbines, and electric vehicles (EVs). Trump
has also personally attacked offshore wind, stating in January, “My goal is to not let any windmill be built. They’re losers,” as he attempted to quash development through (so far failed) legal processes. Prakash Sharma, the vice president for scenarios and technologies at Wood Mackenzie, explained, “The view was that with low-cost oil and gas available domestically, they would be able to increase supply and production quickly, and as a result, keep prices under check.” The rapid overhaul of U.S. energy policy has transformed the country’s energy sector to refocus on fossil fuels and nuclear power, while slowing renewable energy development and the rollout of EVs and cleantech. Liquefied natural gas (LNG) exports are
WHO IS DANNY/MAGNIFIC
By: Felicity Bradstock
Estimates suggest that home heating costs will rise by 9.2% this winter, at more than three times the rate of inflation, driven by higher electricity and natural gas prices and a colder-than-average winter.
also soaring to record levels. Meanwhile, domestic coal consumption, which had sharply declined in previous years, has experienced a modest rebound this year. Unfulfilled Promises The clean energy think tank Energy Innovation published a report in July suggesting that limiting energy development while demand continues to grow will likely drive up consumer energy bills for the next decade. Affordability has become a key issue among voters, particularly due to rising inflation and concerns over geopolitical tensions that are constraining energy supply chains and calling U.S. energy security into question.
During the presidential campaign, Trump vowed to halve consumer electricity bills in his first year in office. However, his energy policies are expected to increase U.S. household energy bills by over half a trillion dollars by 2040, the report found. On average, households will pay $460 more for energy by 2035 and up to $490 more by 2040, according to Energy Innovation. One interactive map shows just how Trump’s energy bills will affect each state. White House spokesperson Taylor Rogers responded to the report, saying that the Trump administration does not believe Energy Innovation’s report is fair and nonpartisan. “It’s no surprise that Energy Innovation — an organization that received over $20 million in direct funding from one of the largest progressive dark money groups — wrote a fraudulent analysis on President Trump’s One Big Beautiful Bill,” Rogers said in a statement. “The reality is the Working Families Tax Cuts ended Biden’s costly Green New Scam, rolled back burdensome regulations, and bolstered U.S. energy production to lower prices for American families.” However, it is not just Energy Innovation that has documented the rise in consumer energy bills in recent months, with electricity prices up by around 7.4% since last fall and some states reporting double-digit year-overyear increases. This has largely been driven by rising electricity demand from the rapid deployment of power-hungry data centres across the country. In addition to higher electricity bills, consumers have also seen their gas bills increase due to inflation. One Year After One Big Beautiful Bill The link between President Trump’s energy policies and rising consumer energy bills has been pointed out by various sources in recent months. While policy choices do not act in isolation to determine energy prices, they do shape market outcomes. Proponents of the Trump administration’s policies say they promote “energy independence”. However, they have also increased reliance on global fuel markets
while dismantling the lowest-cost sources of new domestic power. This has led to higher prices, greater volatility, and the protection of fossil fuel profits, with households ultimately left to foot the bill. Estimates suggest that home heating costs will rise by 9.2% this winter, at more than three times the rate of inflation, driven by higher electricity and natural gas prices and a colder-than-average winter. In July, the Sierra Club assessed the progress one year after Trump’s One Big Beautiful Bill became law. Sierra Club Legislative Director Melinda Pierce issued a statement saying, “One year after Donald Trump signed his signature legislative achievement… into law, what do Americans have to show for it? Jobs cut, higher electricity prices, and more pollution in our air and water. We are far worse off than before this reckless effort to gut renewable energy in favor of more expensive fossil fuels.” Most high-income countries now favor energy diversification, not only to support a green transition but to ensure the future of their energy security. Developing a diverse range of energy sources prevents overdependence on any single source and reduces reliance on energy imports, which typically helps lower consumer energy bills. However, President Trump has taken the opposite approach by focusing strictly on fossil fuels and slow-to-develop nuclear energy, which has pushed energy bills higher, a trend that is set to continue under the administration’s current energy policies.
About the author: Felicity Bradstock is a freelance writer specializing in Energy and Industry. She has a Master’s in International Development from the University of Birmingham, UK, and is now based in Mexico City.
SHALEMAG.COM
33
POLICY
Accelerating United States’ Nuclear Power Rollout
T
he Trump administration is strongly backing nuclear power, aiming to accelerate the deployment of new projects alongside fossil fuel expansion ambitions. President Trump has repeatedly stated his strong opposition to renewable energy and his support for oil, gas, and coal; however, Trump also has major ambitions for a U.S. nuclear renaissance. Trump Administration Nuclear Power Plans In May 2025, President Trump issued four executive orders aiming to revitalize the U.S. nuclear energy industry. Over the last year, the government has made strides in achieving its nuclear ambitions. In response to Trump’s executive order, Reforming Nuclear Reactor Testing at the Department of Energy, which focused on accelerating advanced reactor deployment, the U.S. Department of Energy (DoE) created the Reactor Pilot Program. The program established a new pathway for advanced reactor demonstration to fasttrack commercial licensing, encouraging private investment in the sector. It aimed to have
34
VOLUME 4 // ISSUE 3
at least three reactor designs reach criticality by July 4, 2026, having selected 11 projects to pilot their designs. President Trump announced the aim of expanding the United States’ nuclear power capacity from 100 GW in 2025 to 400 GW by 2050. To achieve this aim, developers would need to construct roughly a hundred times as much nuclear capacity in the next 25 years as they did in the past 25. To help achieve this target, the DoE selected the Tennessee Valley Authority and Holtec Government Services to support early deployments of advanced light-water small modular reactors (SMRs), providing them with a combined $800 million in federal cost-shared funding. The DoE is also providing a loan of up to $1.52 billion, through the Office of Energy Dominance Financing, to Holtec to help fund the restart of the Palisades Nuclear Plant in Michigan. Meanwhile, the Nuclear Regulatory Commission (NRC) approved the construction permit for TerraPower’s Natrium fast reactor project in Kemmerer, Wyoming in March 2026, making it the first ever issued by the NRC for a commercial nonlight-water power reactor.
To support the deployment of nuclear energy and reduce reliance on Russia, the DoE also created the Fuel Line Pilot Program in July 2025, aimed at supporting the production of the nuclear fuel needed for advanced reactors. What Does This Mean? The Trump administration has been very vocal about its nuclear power achievements over the last year, but many question what these announcements actually mean. While nuclear
power has broad bipartisan support in Congress, many have voiced concerns over the high costs and long timeframe associated with developing conventional nuclear reactors. The only two large U.S. reactors to be built recently took 15 years to complete and cost a combined $35 billion, double the initial estimates. The senior vice president for energy and climate at the research organization Third Way, Josh Freed, explained, “The challenge is that there’s a
TTSTUDIO/DEPOSIT PHOTOS
By: Felicity Bradstock
The complexities associated with developing conventional nuclear reactors have led many companies to pursue smaller-scale SMRs
big gap between these announcements and putting one foot in front of the other, taking steps to actually get new reactors built.” The complexities associated with developing conventional nuclear reactors have led many companies to pursue smallerscale SMRs. However, the only countries to achieve commercial SMR technology to date are Russia and China, according to the World Nuclear Association. While several companies are pursuing SMR development, several hurdles stand in the way of commercial rollout, not least the ongoing reliance on Russia for High-Assay Low-Enriched Uranium nuclear fuel. Although the U.S. government is focusing on increasing
domestic output, it could take several years to fulfil the required demand. No One’s Biting In October, the Trump administration announced it has signed a deal with the Canadian owners of Westinghouse Electric to develop a fleet of nuclear reactors with an investment of at least $80 billion. At the time, Trump said that Japan will provide up to $332 billion to support infrastructure in the U.S., including the building of Westinghouse AP1000 reactors and small modular reactors. The Japanese firms Mitsubishi
Heavy Industries, Toshiba, and IHI may be involved in the construction of up to $100 billion in Westinghouse reactors, according to a fact sheet issued by the two countries. U.S. taxpayers were told that the partnership would create a windfall for them, as the federal government would take an ownership stake in Westinghouse so that it could cash it in for billions if the company were eventually to go public. However, to date, Japan has not yet provided funds for a single reactor, and no utility is known to have ordered an AP1000. The Trump administration has not publicly identified any customers for the planned reactors. The lack of signed agreements has made those in the energy industry skeptical about whether Trump can achieve his ambitious nuclear power targets. The Trump administration recently published information on some of its major nuclear power achievements from the last year. While these help lay the foundations for a potential nuclear renaissance, Trump must seek higher levels of private investment in the sector, and fast, if he hopes to achieve his nuclear power goals.
About the author: Felicity Bradstock is a freelance writer specializing in Energy and Industry. She has a Master’s in International Development from the University of Birmingham, UK, and is now based in Mexico City.
SHALEMAG.COM
35
POLICY
U.S. Emissions Rebounded As Global CO2 Hit Another Record By: Robert Rapier
T
he Energy Institute has released the 2026 Statistical Review of World Energy, published in partnership with Ember and in collaboration with KPMG and Kearney. The Statistical Review, previously published for more than 70 years by BP, remains one of the most important annual references for global energy data. As I do each year, I dig into the report’s major categories, including oil, natural gas, coal, renewables, electricity, and carbon emissions. Today, I want to start with the emissions data, because it captures the central contradiction in the global energy system. Clean energy is growing rapidly. Solar and wind continue to scale. Electricity generation from renewables rose sharply in 2025. Yet global greenhouse gas emissions from energy, industrial processes, flaring, and methane associated with fossil fuel production and distribution still reached another all-time high. The headline is that emissions rose again, but there were some shifts in the trends from recent years. Another Record High Global carbon dioxide-equivalent emissions rose from 40.7 billion metric tons in 2024 to 41.0 billion metric tons in 2025. That was an increase of about 331 million metric tons. On the Statistical Review’s adjusted basis, global emissions rose 1.1% for the year, above the 10-year average of 0.9% growth per year. This was another step higher in a long climb. The world set emissions records in 2022, 2023, 2024, and now again in 2025.
The data in this section are broader than carbon dioxide from fuel combustion alone. The Statistical Review’s CO2-equivalent series includes energy-related emissions, industrial process emissions, flaring, and methane associated with fossil fuel production, transportation, and distribution. That distinction means the emissions trend cannot be explained only by looking at power plants and transportation. That becomes especially clear when comparing the emissions data with the electricity data. Global electricity generation rose strongly in 2025, increasing by about 855 terawatt-hours. But renewable generation rose by roughly 861 terawatt-hours. In other words, renewables grew by slightly more than the net increase in global electricity generation. At the same time, global coal-fired generation fell by about 59 terawatt-hours. Natural gas-fired generation rose only modestly, by about 22 terawatt-hours, while oil-fired generation declined. That means the global emissions increase was not simply a story of coal-fired electricity growth. At the global level, renewable power covered the entire net increase in electricity generation. Yet total emissions still rose. That points to a broader explanation: transportation fuels, industrial activity, fossil fuel production, methane, flaring, and regional shifts in the energy mix all played a role. The U.S. Rebound North America accounted for 47.1% of the increase in global emissions in 2025, even though it represented only 15.6% of total global emissions. The United States was the primary reason. U.S. emissions rose from 5.1 billion metric tons in 2024 to 5.3 billion metric tons in 2025, an increase of about 147 million metric tons. On the Statistical Review’s adjusted basis, U.S. emissions rose 3.2%. That is a sharp one-year rebound. It essentially reversed the declines of the previous two years.
36
VOLUME 4 // ISSUE 3
There is some context. U.S. emissions remain well below their 2007 peak, and they are slightly below 1990 levels in this data series. The long-term U.S. trend is not one of runaway emissions growth. But 2025 showed that emissions progress is not guaranteed. When energy demand rises and the power-sector mix shifts in the wrong direction, emissions can rebound quickly. The electricity data helps explain part of the U.S. story. U.S. electricity generation increased by about 133 terawatt-hours in 2025. Renewable generation rose by nearly 99 terawatt-hours, a strong increase. But coal-fired generation also jumped by about 91 terawatt-hours, or roughly 13%. Natural gas generation fell by about 67 terawatt-hours. That shift is important because coal is far more carbon-intensive than natural gas. A move from gas toward coal can raise emissions even when renewables are growing. So, the U.S. story is not that renewables failed to grow. They did grow. The problem was that rising demand, combined with a rebound in coal-fired generation, overwhelmed that progress. China Slowed Sharply China remains the world’s largest emitter by far. In 2025, China emitted 12.5 billion metric tons of CO2-equivalent emissions, equal to 30.5% of the global total. But China’s emissions growth nearly stalled in 2025. Emissions increased by only about 4 million metric tons, essentially flat in a system of this size. That was a sharp slowdown from recent years. This does not mean China is no longer central to the emissions story. Since 2000, global emissions have increased by about 14.4 billion metric tons. China’s emissions increased by roughly 8.8 billion metric tons over that period, accounting for about 61% of the global increase. So, two things are true at the same time. China remains the world’s largest current emitter and the dominant contributor to the rise in global emissions this century. But in 2025, China was not the main source of the global increase. The U.S. emissions rebound was far larger in absolute terms. China’s electricity data helps explain the slowdown. China’s electricity generation rose by about 488 terawatt-hours in 2025, far more than the U.S. increase. But renewable generation rose by about 478 terawatt-hours. Nuclear generation rose by about 34 terawatthours, hydro increased by about 28 terawatthours, and coal-fired generation fell by about 80 terawatt-hours.
That is a striking contrast with the U.S. In China, rapid power demand growth was largely matched by growth in non-fossil generation. In the U.S., renewable generation rose, but coal generation also surged. India And The Developing World India also showed a notable slowdown. India’s CO2-equivalent emissions rose from 3.26 billion metric tons in 2024 to 3.28 billion metric tons in 2025, an increase of about 21 million metric tons. That is much slower than the increases recorded in 2023 and 2024. India’s emissions are still growing over the longer term. Over the past decade, India’s emissions have risen at an annual rate of about 3.5%. But 2025 was a relatively modest year for growth. More broadly, non-OECD countries continue to dominate global emissions. In 2025, nonOECD countries accounted for 70.5% of global CO2-equivalent emissions, while OECD countries accounted for 29.5%. That is a major shift from 1990, when OECD countries accounted for more than half of global emissions. But again, the 2025 regional pattern was unusual. Asia Pacific produced 51.9% of global emissions but contributed only 16.7% of the increase. North America was the main surprise, while Africa also contributed a noticeable share of the increase from a much smaller base. Africa accounted for only 4.7% of total global emissions in 2025 but contributed 16.9% of the global increase. That reflects fast growth from a low base and is a reminder that future emissions growth will increasingly depend on how developing regions meet rising energy demand. Europe remained largely flat. Total European emissions rose only slightly, while European Union emissions declined again. The European Union’s emissions are now about one-third below their 1990 level in this CO2-equivalent series. The Big Picture The 2025 emissions data tell a more nuanced story than in recent years. It is inaccurate to say renewables are failing. Global renewable electricity generation rose enough to cover the entire net increase in global power generation. Solar and wind continue to scale rapidly. China’s emissions growth slowed sharply, in part because renewable generation surged. But it is also not accurate to say the energy transition is cutting global emissions. Total emissions reached a new record in 2025.
The world is still not reducing fossil fuel use, industrial emissions, methane, and flaring quickly enough to bend the global emissions curve downward. The U.S. rebound is one of the most important findings in this year’s data. After years of gradual progress, U.S. emissions rose sharply because energy demand increased and coal-fired generation rebounded. The explosion of data centers likely contributed to rising electricity demand, but they were not the only factor, and the emissions record cannot be pinned on one culprit. China’s slowdown is also important. For years, China has been the dominant driver of rising global emissions. In 2025, that changed. China remained the largest emitter, but its growth nearly stalled while U.S. emissions rebounded. That may or may not represent a lasting shift. One year does not make a trend. But it does show how quickly the emissions picture can change when regional power mixes and energy demand move in different directions. The bottom line is straightforward. The world added a great deal of clean electricity in 2025. But total CO2-equivalent emissions still hit another record. That is the challenge of the energy transition in one sentence: clean energy is growing rapidly, but the overall energy system is still not decarbonizing fast enough to keep global emissions from rising.
About the author: Robert Rapier is a chemical engineer in the energy industry and Editor-inChief of Shale Magazine. Robert has over 30 years of international engineering experience in the chemicals, oil and gas, and renewable energy industries and holds several patents related to his work. He has worked in the areas of oil refining, oil production, synthetic fuels, biomass to energy, and alcohol production. He is author of multiple newsletters for Investing Daily and of the book Power Plays. Robert has appeared on 60 Minutes, The History Channel, CNBC, Business News Network, CBC, and PBS. His energy-themed articles have appeared in numerous media outlets, including the Wall Street Journal, Washington Post, Christian Science Monitor, and The Economist.
SHALEMAG.COM
37
POLICY
Will Hawaii be Forced to Extend Reliance on Fossil Fuels? By: Felicity Bradstock
Hawaii Energy Overview Hawaii has the fourth-lowest total energy consumption of any U.S. state, yet it still used 16 times as much energy as it produced in 2023, according to the Energy Information
38
VOLUME 4 // ISSUE 3
Administration (EIA). The need to import energy means that Hawaii had the highest average electricity price of any state in 2025, at around triple the U.S. average. That same year, around 34% of Hawaii’s electricity production came from renewable energy. Roughly 25% of its electricity came from solar power, mainly from small-scale projects. Hawaii has the 13th-highest small-scale solar generation among the states, with roughly 50% of homes on Oʻahu, the state’s most densely populated island, having rooftop solar. The archipelago has big green energy
ambitions, with its three main islands of Kauai, Hawaii, and Maui aiming to obtain 100% of their electricity from renewable sources by 2035. Nevertheless, petroleum accounted for around 92% of the state’s total energy consumption in 2023, the highest share of any state, underscoring its heavy dependence on fossil fuels. Clean Energy Initiative The Hawaii Clean Energy Initiative (HCEI) is a framework of statutes and regulations supported by a diverse group of stakeholders committed to achieving a green transition.
ALN2311/MAGNIFIC
H
awaii has pursued a green transition policy in recent years, aiming to reduce its reliance on fossil fuels and improve self-sufficiency by developing renewable energy projects. The state, which is extremely vulnerable to climate change, sees this as key to ensuring its energy security.
its transmission infrastructure, accelerate the retirement of aging assets, and enhance system reliability and resilience.
The HCEI was launched in 2008 with support from the U.S. Department of Energy in a bid to reduce Hawaii’s dependence on fossil fuel imports. Assessments at the time suggested that between 60% and 70% of the state’s future energy needs could be met by developing its local renewable energy capacity, including solar, wind, bioenergy, hydroelectricity, and geothermal power. Since 2008, the state
government has pushed the green agenda through favorable new policies. In 2023, Governor Josh Green renewed Hawaii’s commitment to achieving the nation’s first-ever wholly renewable portfolio standard by 2045, issuing an Executive Order in January 2025 to accelerate the transition. Then, in October 2025, Hawaii signed a Strategic Partnering Agreement with Japan’s largest power producer, JERA, to upgrade
Challenges to a Green Transition Several challenges stand in the way of Hawaii’s green transition ambitions as it recovers from various natural disasters. In 2023, a hurricane took down power lines, sparking wildfires on Maui that resulted in 102 people losing their lives. This has incurred high costs for the state utility, Hawaiian Electric, which may now struggle to afford to invest in green transition aims. There have long been high hopes for Hawaii’s geothermal energy thanks to the region’s volcanic environment. In 2017, at its peak, geothermal energy production contributed 30% of the electricity on the Big Island. However, a volcanic eruption reduced Hawaii’s geothermal energy output. The government now plans to complete a 20% capacity expansion by late 2026. Another hurdle to reducing Hawaii’s fossil fuel dependence is the state’s heavy reliance on tourism for revenue. As decarbonizing shipping and air travel is extremely difficult and cannot be achieved through expanding renewable energy capacity, Hawaii must explore ways to mitigate tourism-related emissions. To this end, in 2022, Hawaii’s state legislature passed an act calling for the state energy office to analyze pathways to achieve the state’s economywide decarbonization goals. Turning to Natural Gas Hawaii’s previous administration was staunchly opposed to natural gas, believing that shifting reliance to another fossil fuel would impede its green energy goals. However, the new administration is more open to the “transition fuel”. The state government has signed a preliminary deal
with Japan’s JERA to supply liquefied natural gas (LNG) to lower electricity prices. Hawaii plans to develop its LNG import infrastructure to support this move, with JERA expected to pay $2 billion to construct a floating LNG import terminal called Longboard LNG. The plan is for tankers to dock every three to four weeks to unload LNG, which would be transported via a pipeline to shore and then to a new 500-megawatt power plant to serve Oʻahu. The proposed plant is expected to meet around 40% of the island’s highest recorded electricity demand, with commercial operations potentially commencing as soon as 2030. The move has irked environmentalists who are concerned that establishing a long-term LNG deal will delay progress towards achieving 100% low-carbon electricity generation. Chris Lee, a Democratic state senator, explained, “You can’t solve this problem of a reliance on imported oil by moving to another import that we don’t control.” Several setbacks, including the COVID-19 pandemic and various natural disasters, have already delayed progress, they argue, and importing LNG could further impede efforts to develop Hawaii’s renewable energy capacity.
About the author: Felicity Bradstock is a freelance writer specializing in Energy and Industry. She has a Master’s in International Development from the University of Birmingham, UK, and is now based in Mexico City.
SHALEMAG.COM
39
Own the Network. Broker the Deals.
BE YOUR OWN BOSS!
• Built for Networkers & Entrepreneurs • Leverage Your Network • Grow with a Proven System
Start Your Business Today SCAN HERE TO APPLY NOW
OR Call Barron Perales
(210) 281-1111 40
VOLUME 4 // ISSUE 3
SHALEMAG.COM
41
BUSINESS
Why Falling Oil Prices Don’t Mean the Fuel Shock Is Over By: Robert Rapier
G
asoline prices have started to fall, and that is welcome news for drivers. After months of pain at the pump following the war with Iran and the disruption of traffic through the Strait of Hormuz, even modest relief is noticeable. But falling from crisis levels is not the same thing as returning to normal. That distinction may define the next several months in the oil market. The developing U.S.-Iran agreement has given traders a reason to mark down crude prices. Markets are forward-looking, and they have quickly priced in a scenario in which the Strait of Hormuz reopens, Gulf exports resume, and the energy shock that pushed gasoline
42
prices sharply higher begins to fade. That may ultimately prove correct. But the physical oil market does not move as quickly as futures prices. Tanker routes, insurance markets, shipping backlogs, refinery crude slates, and depleted inventories all take time to normalize. Even if the diplomatic framework holds, the path back to pre-war gasoline prices is likely to be slower and more uneven than the recent drop in crude prices might suggest. Prices Are Falling, But From Very High Levels The national average gasoline price had climbed from under $3 a gallon before the conflict to more than $4
during the spring. Over the past few months, gasoline prices have been more than $1 a gallon above pre-war levels, with consumers facing the combined effect of higher crude oil prices, refinery disruptions, and seasonal fuel demand. That is why recent declines can be both real and incomplete. A drop from $4.50 to $4.05 is meaningful. It helps household budgets and eases some inflation pressure. But it still leaves gasoline far above where it was before the conflict began. This is where the public conversation can become misleading. If prices fall for several weeks, some will argue that the oil shock is over. But the relevant question is not whether gasoline prices can come
MAGNIFIC
VOLUME 4 // ISSUE 3
down from their highs. They already have. The better question is whether they can quickly return to pre-war levels. That is a very different question. Futures Markets Move Faster Than Tankers Oil prices react immediately to headlines. A reported ceasefire, a diplomatic framework, or a sign that the Strait of Hormuz may reopen can move crude futures within minutes. That is exactly what happened as traders began to discount a lower geopolitical risk premium. But moving physical barrels is different. The Strait of Hormuz is the most important energy chokepoint in the world, and months of disruption cannot be unwound with a press release. Ships that were delayed have to be scheduled. Insurers have to reassess war-risk premiums. Crews and cargo owners need confidence that passage is secure. Ports must deal with congestion. Refiners that changed crude sourcing patterns may not immediately switch back. That is all important because gasoline prices are tied not only to the price of crude oil, but to the availability of the right crude in the right place at the right time. If refiners are still competing for prompt cargoes, or if logistical constraints keep barrels from flowing smoothly, gasoline prices can remain elevated even as futures markets anticipate relief. Low Inventories Create A Bullish Backdrop The bigger issue is inventories. During a major supply disruption, the world does not simply consume less oil and wait patiently for the crisis to end. It draws down inventories. Commercial stocks fall. Strategic reserves may be tapped. Refiners and importers use whatever supply they can secure. For example, the U.S. Strategic Petroleum Reserve, which was already drawn down significantly in response to Russia’s invasion of Ukraine, has now been further drawn down to its lowest level since 1983. When the crisis eases, those barrels have to be replaced. That creates what could be called an inventory trap. Reopening Hormuz is bearish for oil prices because it allows more supply to move. But the need to refill depleted inventories is bullish because it creates additional demand for barrels just as the market is trying to normalize. In other words, the end of the disruption does not necessarily create an immediate glut. It may instead trigger a period of aggressive restocking. This is especially important for countries that rely heavily on imports from the Persian
Gulf. Many will want to rebuild strategic and commercial inventories before the next geopolitical flare-up. Companies may do the same. If buyers conclude that inventories are too low for comfort, they may bid for barrels even as traders are assuming the crisis premium should disappear. That restocking demand can put a floor under oil prices. Gasoline Does Not Track Crude One-For-One Another reason gasoline may not quickly return to pre-war levels is that crude oil is only one component of the pump price. It is the biggest component, but not the only one. Refining margins, distribution costs, taxes, seasonal fuel specifications, regional supply constraints, and local inventories are all factors. Gasoline prices often rise quickly when crude spikes, but the decline can be slower when crude falls, particularly when refiners are still dealing with tight supply or strong demand. This is also the time of year when gasoline demand tends to be seasonally strong. The summer driving season adds pressure just as the market is trying to recover from a major geopolitical disruption. Even if crude continues to ease, gasoline inventories and refinery utilization will help determine how much relief drivers actually see. That is why a lower Brent crude price does not automatically mean a quick return to $3 gasoline. The Market May Be Pricing In A Best-Case Scenario None of this means gasoline prices cannot keep falling. They can. If the Iran agreement holds, if Hormuz traffic normalizes faster than expected, if inventories rebuild smoothly, and if crude prices continue to decline, drivers should see further relief. But that is a favorable scenario with many moving parts. The risk is that markets have already priced in much of the good news. They are assuming that the diplomatic breakthrough translates quickly into normal shipping flows, lower crude prices, lower inflation pressure, and a calmer economic backdrop. That may be too much to assume before the details of the agreement are known and before tanker traffic has returned to normal levels. There are several ways this could disappoint. The agreement could be delayed. Implementation could be uneven. Shipping insurance could remain expensive. Regional security concerns could persist. Countries
could compete aggressively to refill depleted stocks. Any of those factors could slow the decline in oil and gasoline prices. That does not mean another price spike is inevitable. It simply means the market may have moved from fear to relief faster than the physical system can justify. The Big Picture The developing Iran agreement is good news if it reduces the risk of a wider war and allows the Strait of Hormuz to reopen. It should help bring oil prices down from the extreme levels reached during the conflict. Consumers should welcome that. But the oil market is not a light switch. Reopening a chokepoint does not instantly refill inventories. It does not immediately clear tanker backlogs. It does not erase insurance risk. It does not automatically bring gasoline prices back to where they were before the first missiles flew. The most likely outcome is not that gasoline prices stay at crisis levels forever. It is that the road back to pre-war prices is far slower than many consumers expect. Gas prices are falling. That part is real. But the bullish backdrop from low inventories, restocking demand, and lingering logistical risk has not disappeared. Until those issues are resolved, the market may struggle to deliver the kind of quick, complete relief that drivers are hoping for.
About the author: Robert Rapier is a chemical engineer in the energy industry and Editor-inChief of Shale Magazine. Robert has over 30 years of international engineering experience in the chemicals, oil and gas, and renewable energy industries and holds several patents related to his work. He has worked in the areas of oil refining, oil production, synthetic fuels, biomass to energy, and alcohol production. He is author of multiple newsletters for Investing Daily and of the book Power Plays. Robert has appeared on 60 Minutes, The History Channel, CNBC, Business News Network, CBC, and PBS. His energy-themed articles have appeared in numerous media outlets, including the Wall Street Journal, Washington Post, Christian Science Monitor, and The Economist.
SHALEMAG.COM
43
BUSINESS
Data Centers Set to Significantly Drive Up Global Emissions By: Felicity Bradstock
T
he accelerated rollout of data centers is increasing carbon emissions at a time when many of the world’s governments are striving to achieve a global green transition. Many countries around the world are investing in decarbonizing their economies and reducing reliance on fossil fuels by investing in renewable alternatives and cleantech. So, as the recent wave of data center development brings new carbon emissions challenges, how will the world respond? Global Data Center Development The global data center market is expected to reach a value of almost $700 billion by 2034, growing from nearly $270 billion in 2025 and an expected $300 billion in 2026, at a compound annual growth rate of about 11.1% during the forecast period, according to a Fortune Business Insights assessment. Tech companies are increasingly investing in data center development to support the deployment of advanced computing operations, such as artificial intelligence (AI), and data storage. These operations require far more computing power, which requires far more energy to run. While some companies are investing in renewable energy-powered data centers, most firms continue to rely heavily on natural gas to power operations. Data centers were not previously considered to have a major impact on the energy market. However, as tech companies accelerate the rollout of large-scale facilities, they are becoming a major strain on the grid. Energy consumption from data centers
44
VOLUME 4 // ISSUE 3
was estimated to contribute around 415 terawatt-hours (TWh), or about 1.5% of global electricity consumption in 2024, having grown at 12% over the previous five years, according to the International Energy Agency. Data Centers Drive Up Carbon Emissions The collective carbon emissions of three of the world’s biggest tech companies, Microsoft, Amazon, and Google, have increased by almost one-fifth over the last year, primarily due to data center construction. In the financial year ending March 2026, the three firms collectively emitted 119 million metric tons of carbon dioxide equivalent (mTCO₂e), which is similar to around a third of France’s carbon emissions, up from 101 million mTCO₂e in 2024-2025. One economics professor at University College London, Cecilia Rikap, stated, “Claims by Microsoft, Amazon and Google about their clouds being ecologically friendly and sustainable are a marketing strategy.” Rikap added, “Governments should remember these expanding carbon footprints when the very same companies offer addressing the ecological crisis with AI solutions.” Rikap also talked about how tech giants are making their carbon emissions appear less elevated than they actually are. “As migration to their clouds expands, and companies store data and train and use AI models and all sorts of digital technologies, these other companies are outsourcing their own digital/AI carbon footprint to cloud
giants. Basically, shifting to the cloud helps other corporations obscure their environmental footprint,” Rikap explained. In its July report, Microsoft disclosed that its carbon emissions had risen by 25% over the previous year, to 20 million mTCO₂e. The company said this increase was “driven primarily by the expansion of [its] data center infrastructure”. Meanwhile, Amazon said its emissions had increased by 16% overall, but that it was “making progress” towards achieving its pledge of net-zero emissions by 2040. Google reported that its emissions had increased 18% over the previous year, largely because of data center expansion. However, the firm also said that its AI systems had provided solutions that had already helped to drive down emissions elsewhere by 41 million mTCO₂e last year. By discussing the ways in which AI may be helping to reduce emissions in other areas, Google is massively overlooking the carbon emissions associated with data center development and operations, specifically in the energy required to run AI activities. Tech Investment and Carbon Offsetting The world’s biggest tech companies are expected to spend around $765 billion in 2026, predominantly on data center development. Based on the increase in carbon emissions associated with data center development, this investment plan appears to be at odds with the pledge by both Google and Microsoft to achieve net-zero carbon emissions by 2030. Many major tech companies have invested heavily in carbon offsetting programs in a bid to reduce the impact of new polluting operations. However, many offsetting schemes have been found to be largely ineffective. Carbon credit schemes allow users to offset emissions by funding projects aimed at reducing emissions, such as carbon capture and storage technologies and reforestation. Each carbon credit represents one metric ton of carbon dioxide reduced or removed from the atmosphere. However, many researchers are uncertain whether credit schemes can help companies offset emissions. A 2025 review paper, analyzing 25 years of evidence, demonstrated that the failure of carbon offsets to cut planet-heating pollution was “not due to a few bad apples” but rather because of deep-seated systemic problems that gradual change to the system will not fix. At the current rate of data center development, global carbon emissions could rise significantly in the coming decade, thereby undoing much of the progress made in governments’ green transition work worldwide. Meanwhile, carbon offsetting programs are likely doing little to mitigate the growth in emissions and support global decarbonization efforts.
About the author: Felicity Bradstock is a freelance writer specializing in Energy and Industry. She has a Master’s in International Development from the University of Birmingham, UK, and is now based in Mexico City. WAVEBREAKMEDIA/DEPOSITPHOTOS
SHALEMAG.COM
45
BUSINESS
Why Oil Majors are Rethinking Their Renewable Bets By: Robert Rapier
O
ver the past 20 years, the story seemed straightforward. Big Oil would gradually become Big Energy. Over time, oil majors would use their balance sheets, engineering expertise, and global project-management skills to build wind farms, solar projects, hydrogen hubs, carbon capture networks, and renewable power businesses. Big Oil did make major investments in renewables. And that transition is still happening in parts of the energy sector. But among the oil majors, the strategy has become far more selective. The latest example is Equinor. The Norwegian energy company recently dropped its target of having 10 to 12 gigawatts of installed renewable energy capacity by 2030. Instead, it is shifting toward a broader power strategy that includes renewables, gas-fired power, storage, and trading. Equinor is not saying renewables have no future. It is saying that a pure renewable-capacity target no longer fits the company’s view of profitable growth. That is the bigger story across the sector. Big Oil is not backing away from renewables because the energy transition has stopped. It is backing away because many renewable projects have not delivered the returns investors expect from oil majors. Equinor’s Shift Equinor’s decision is notable because the company had been one of the European majors most closely associated with offshore wind. It once talked about becoming an offshore wind major. Now it is reframing the business. The company still expects power production to rise sharply by 2030. But the metric has changed from renewable capacity to power generation, and the business now includes gas-fired generation, storage, and trading. Equinor also said only about 10% of capital expenditures will go toward its power business. The reason is not hard to understand. Offshore wind became more expensive. Interest rates rose, supply chains tightened, equipment costs increased, and project economics deteriorated. In that environment, a capacity target can become a liability, because it encourages companies to build megawatts even when the returns do not justify the capital. Equinor’s revised strategy is a reminder that oil companies are not utilities. They do not exist to build renewable capacity for its own sake. They exist to allocate capital where they believe they can earn attractive returns. BP’s Green Pivot Reverses BP provides the clearest example of the shift. It is also worth remembering that BP has gone down this road before. More than two decades ago, the company tried to recast itself around the slogan “Beyond Petroleum,” a branding effort meant to signal that BP saw its future as broader than oil and gas. That earlier effort never transformed the company. BP remained, first and
46
foremost, a major oil and gas producer. But the slogan captured a recurring tension inside the industry: how does a company built on hydrocarbons position itself for a future in which demand growth, policy pressure, and investor expectations are all changing? Under former CEO Bernard Looney, BP made one of the industry’s most ambitious attempts to answer that question. The company set out to reduce oil and gas production and rapidly expand low-carbon businesses. For a time, BP seemed to be trying to redefine itself faster than most of its peers. That strategy has now been substantially reversed. BP has increased planned annual oil and gas investment while cutting planned transition spending. The company has also moved away from earlier plans to shrink oil and gas production and has targeted higher output by 2030. BP also agreed to sell its U.S. onshore wind business, which included 10 operating wind assets. The message is clear. BP is trying to rebuild investor confidence by focusing on businesses where it believes it has stronger returns and a clearer competitive edge. This does not mean BP has abandoned low-carbon energy. But the company is no longer trying to convince investors that it should be valued like a fast-growing renewable developer. It is returning to the language of cash flow, returns, divestments, and disciplined capital allocation. Shell Gets More Selective Shell has followed a similar path, though its retreat has been more selective than dramatic. The company has cut jobs in low-carbon businesses, scaled back parts of its hydrogen effort, exited some offshore wind projects, and reviewed strategic options for renewable assets in India. At the same time, Shell has leaned harder into liquefied natural gas, upstream production, and trading. That fits Shell’s strengths. Shell is one of the world’s dominant LNG players. It has deep expertise in global energy trading. It understands large-scale oil and gas projects, shipping, storage, and commodity markets. By contrast, the renewable power business can look very different. Solar and wind projects often resemble infrastructure investments. They may offer stable cash flows, but returns can be compressed by competition, regulation, tax-credit structures, and rising financing costs. Those projects may be attractive to utilities, infrastructure funds, or pension-backed investors. But they may not always satisfy shareholders who buy oil majors for higher-return energy exposure. That is one reason the “Big Oil becomes Big Renewables” story was always too simple. The skill sets overlap in some areas, especially offshore engineering. But the economics are not the same. TotalEnergies Charts A Different Path TotalEnergies is the important counterexample. Unlike some peers, TotalEnergies has continued to build a large integrated power business. It has targeted 100 to 120
MAGNIFIC
VOLUME 4 // ISSUE 3
companies are not the only players with capital. Utilities, private equity firms, pension funds, infrastructure funds, and specialized renewable developers are all competing for projects. Finally, oil companies are judged by investors who often want cash returns, dividends, buybacks, and capital discipline. Those investors may not reward a company for building renewable capacity.
terawatt-hours of electricity generation by 2030, up from 41 terawatt-hours in 2024. It has also pursued renewable projects in markets where it has broader energy relationships, including oil and gas investments. TotalEnergies is not ignoring returns, but its model may be more disciplined precisely because it is not simply collecting renewable assets everywhere. The company has focused future renewable development on key markets and has shown a willingness to sell assets where holdings do not fit its strategy. That may be the model that works better for oil majors: not a wholesale conversion from oil to wind and solar, but an integrated energy strategy where power, gas, trading, and renewables support each other. In other words, the companies that succeed may not be the ones with the biggest renewable-capacity targets. They may be the ones that can connect generation, customers, storage, trading, and fuel supply into a profitable system. Renewables Are Not Dead It is important not to confuse Big Oil’s retreat with a collapse in renewable energy. Global clean-energy investment remains enormous. Solar, wind, batteries, grids, nuclear, efficiency, electrification, and lowemission fuels continue to attract far more capital than they did a decade ago. The International Energy Agency has estimated that low-emissions energy investment is
running at roughly twice the level of fossilfuel investment. So, the conclusion is not that the energy transition has failed. It is just proof that the transition is more complicated than many early forecasts suggested. Renewables are growing. But ownership, capital costs, subsidy structures, power prices, interconnection queues, and supply chains are all key considerations. And for publicly traded oil companies, shareholder expectations must be considered. A renewable project that makes sense for a regulated utility or infrastructure fund may not make sense for an oil major trying to compete for capital against deepwater oil, LNG, refining, chemicals, or share buybacks. Why Big Oil’s Green Pivot Stumbled The oil majors entered renewables with real advantages: large balance sheets, engineering talent, project-management experience, and political relationships. But they also faced real disadvantages. Renewables are often lower-margin businesses. A high-quality solar or wind project can be attractive, but it may not match the returns available from a successful oil and gas development. Renewable projects are also more sensitive to interest rates. When rates were near zero, long-duration infrastructure cash flows looked more attractive. When rates rose, the economics changed. Competition is also intense. Oil
The Big Picture Big Oil’s renewable retreat is not really a story about renewables failing. It is a story about capital discipline returning. The energy transition is still underway, but it will not be a straight-line replacement of oil companies by renewable divisions inside those same companies. Some oil majors will build meaningful power businesses. Some will focus on LNG, trading, carbon capture, hydrogen, or biofuels. Others will stay closer to their traditional strengths. That may disappoint those who expected oil companies to lead the transition. But it should not surprise anyone who follows capital allocation. Companies tend to move toward businesses where they have an advantage and can earn acceptable returns. For Big Oil, that still often means hydrocarbons, especially oil, gas, and LNG. In power, it may mean selective participation rather than an all-in bet on renewable capacity. That is the tension now shaping Big Oil’s strategy. The majors are not abandoning the future. They are becoming more selective about which parts of the future they want to own.
About the author: Robert Rapier is a chemical engineer in the energy industry and Editor-in-Chief of Shale Magazine. Robert has over 30 years of international engineering experience in the chemicals, oil and gas, and renewable energy industries and holds several patents related to his work. He has worked in the areas of oil refining, oil production, synthetic fuels, biomass to energy, and alcohol production. He is author of multiple newsletters for Investing Daily and of the book Power Plays. Robert has appeared on 60 Minutes, The History Channel, CNBC, Business News Network, CBC, and PBS. His energy-themed articles have appeared in numerous media outlets, including the Wall Street Journal, Washington Post, Christian Science Monitor, and The Economist.
SHALEMAG.COM
47
BUSINESS
Google Doubles Down on Nuclear Power Commitments By: Felicity Bradstock
G
oogle has big nuclear energy plans as part of its efforts to provide clean power for its ever-growing pipeline of data centers. The tech giant has long talked about funding both conventional nuclear fission operations and small modular reactor (SMR) development. However, its ambitions are now even bolder, as it has announced plans to invest in the future of nuclear fusion. Funding Conventional Nuclear Power In the spring of 2025, Google announced plans to invest in three conventional nuclear power developments with at least 650 megawatts (MW) of capacity each. The project was planned to be developed with Elementl Power, a nuclear company founded in 2022 that aims to deploy over 10 gigawatts (GW) of nuclear power in the U.S. by 2035. At the time, Elementl Power’s CEO Chris Colbert said, “Innovative partnerships like this are necessary to mobilize the capital required to build new nuclear projects, which are critical to deliver safe, affordable and clean baseload power and help companies advance their long-term net-zero goals. We look forward to working with Google to execute these projects and bring safe, carbon-free, baseload electricity to the grid.”
Fusion Ambitions In addition to more conventional nuclear operations, Google also has plans to invest in innovative fusion projects. In July, the tech giant announced it would be investing in Germany-based start-up Proxima Fusion as part of the firm’s $468 million funding round, which was led by XTX Ventures and
East X Ventures. German utility RWE, one of the largest electricity and gas suppliers in Europe, also invested in the funding round. Nuclear fusion is the process that powers the sun and stars. Fusion takes place when two atomic nuclei – typically composed of hydrogen – are combined to form a heavier nucleus, releasing a large amount of energy. The difficulty in achieving this process is that scientists must recreate extreme temperatures and pressures that cause fusion in stars on Earth. By contrast, nuclear fission – the method currently used to produce nuclear power – occurs when the central core of an atom, known as the nucleus, of uranium or plutonium, splits into two smaller nuclei. Splitting the core releases a large quantity of energy and creates additional neutrons, which can go on to split more atoms in a chain reaction, allowing nuclear reactors to produce a stable supply of energy. Google’s investment announcement demonstrates the firm’s dedication to innovative nuclear technologies. Nuclear fusion could provide abundant clean energy, but the technology has not yet been commercially deployed as several hurdles remain to be overcome. Google acknowledged the immense challenge of achieving the commercial deployment of fusion technology and noted that success is not guaranteed.
In the spring of 2025, Google announced plans to invest in three conventional nuclear power developments with at least 650 megawatts (MW) of capacity each. TIHANGE/MAGNIFIC
SMR Development Even earlier, in 2024, Google signed a power purchase agreement with the nuclear energy firm Kairos Power and the Tennessee Valley Authority. Google aims to purchase power generated by Kairos’s SMR starting in 2030. Small modular reactors (SMRs) are advanced nuclear reactors with a power capacity of up to 300 MW(e) per unit, equivalent to about one-third the generating capacity of a conventional nuclear reactor.
They are far smaller than traditional reactors and are modular, making it easier to assemble them in factories and transport them to the site. They are also cheaper and faster to build than conventional nuclear reactors and can be constructed incrementally to meet the growing energy demand of a site. Google and Kairos have not yet announced the size of the investment or the planned locations of the SMR development, although Google said it has agreed to buy a total of 500 MW of power from six to seven reactors. The senior director for energy and climate at Google, Michael Terrell, told reporters, “We feel like nuclear can play an important role in helping to meet our demand... cleanly in a way that’s more around the clock.” To develop its SMRs, Kairos will need to attain construction and design permits from the U.S. Nuclear Regulatory Commission (NRC) and permits from local agencies. The firm has already been granted a construction permit from the NRC to develop a demonstration reactor in Tennessee.
48
VOLUME 4 // ISSUE 3
Proxima Fusion’s CEO, Francesco Sciortino, stated, “Europe is racing with the United States and China to get to the first fusion power plant.” Sciortino added, “Investors recognise both the urgency and the opportunity of what we’re doing and are backing us to develop a generational energy technology company.” In addition to using conventional energies to power its data centers, such as gas and
renewable energy, Google has committed to a wide range of nuclear power projects to power its artificial intelligence and other advanced technologies. As several countries race to achieve nuclear fusion, private financing, such as Google’s investment in Proxima Fusion, could help accelerate the development of the technology to support commercial deployment.
About the author: Felicity Bradstock is a freelance writer specializing in Energy and Industry. She has a Master’s in International Development from the University of Birmingham, UK, and is now based in Mexico City.
SHALEMAG.COM
49
Vision for the Future CPS Energy is committed to a future of innovative power generation solutions, and we are focused on engaging in conversations with our customers and community partners. Listening to feedback from our diverse community ensures decisions are made with a clear understanding of our customers’ views on resiliency, climate, innovation, and equity.
CONNECTING • LISTENING • ENGAGING • SERVING
cpsenergy.com
CONNECT. SHARE IDEAS. DISCUSS. 50
VOLUME 4 // ISSUE 3
SHALEMAG.COM
51
FINANCE
What $100 Oil Means for Investors By: Robert Rapier
C
rude oil moved above $100 a barrel several times in 2026 as conflict in the Middle East disrupted supplies and threatened key shipping routes. Brent crude first crossed that threshold in March and later returned above $100 in July before retreating again. The swings illustrated both the sensitivity of oil prices to geopolitical developments and how quickly conditions can change. For investors, the important question is what a sustained period of elevated oil prices means for consumers, energy producers, inflation, interest rates, and corporate profits. For most people, the price of a barrel of crude oil is an abstraction because they do not buy oil by the barrel. But it does not remain abstract for long. The First Impact Appears at the Pump Crude oil is the largest component of the retail price of gasoline. Over the past decade, crude oil has accounted for slightly more than half of the retail price on average, although the percentage varies considerably with market conditions. The rest reflects refining, transportation, marketing, taxes, and retail margins. That means gasoline prices will not move in perfect lockstep with oil, but the connection is strong. The Energy Information Administration has offered a useful rule of thumb: A sustained $1-per-barrel change in crude oil prices can eventually translate into approximately 2.4 cents per gallon at the pump, all else being equal. Historically, about half of a crude oil price change has tended to reach consumers within two weeks and roughly 80% within four weeks. By that measure, a sustained increase from $80 to $100 a barrel could put roughly 48 cents per gallon of upward pressure on gasoline prices if the crudeprice increase is fully passed through.
52
VOLUME 4 // ISSUE 3
Consider a driver who travels 12,000 miles a year in a vehicle that averages 25 miles per gallon. That person consumes about 480 gallons annually. An additional 48 cents per gallon would raise the annual fuel bill by roughly $230. In a two-car household, the impact could easily be twice that amount. For many households, that increase is manageable. But it reduces the income available for other purchases, and the burden is not evenly distributed. People with long commutes, lower fuel economy, or limited transportation alternatives will feel it more than others. Diesel Spreads the Cost Through the Economy Gasoline prices are the most visible consequence of higher oil prices, but diesel can have the broader economic impact. Diesel powers much of the equipment that moves goods through the economy. Trucks carry food, consumer products, construction materials, and industrial supplies. Farmers use diesel in tractors and harvesting equipment. Railroads, ships,
mining operations, and heavy machinery also rely heavily on petroleum fuels. When diesel becomes more expensive, companies must either absorb the additional cost or pass it on to customers. In practice, they usually do some of both. Profit margins narrow in some industries, while prices rise elsewhere. This is one way an increase in oil prices can eventually appear in places that seem far removed from the oil market. Higher transportation and production costs can contribute to higher prices for groceries, airline tickets, building materials, deliveries, and manufactured goods. The effect is rarely immediate or uniform. A company with long-term transportation contracts may be temporarily insulated. Another may have enough pricing power to pass higher costs along. A business operating on thin margins may have much less flexibility. Higher Oil Prices Create Benefits, Too For an oil-producing region, however, focusing only on the consumer side of the equation misses an important part of the story. Higher crude prices can significantly improve the economics of oil production. For producers, the effect depends on production costs, hedging, transportation arrangements, royalties, and other factors, but higher realized prices generally translate into stronger cash flow when operating costs do not rise just as quickly. That additional cash can support debt reduction, dividends, share repurchases, drilling programs, and investment in new production. It can also flow through the broader energy economy to oilfield service companies, mineral and royalty owners, employees, and communities where oil and gas development is a major source of economic activity. State and local governments in
ALEXANDER85RU/MAGNIFIC
producing regions may benefit as well through severance taxes, royalties, property taxes, and other revenue tied directly or indirectly to energy activity. There are limits to the effect. A temporary price spike may do little to change longterm investment plans, particularly after years in which producers have become more disciplined about capital spending. Service costs can also rise during an industry upturn and consume part of the benefit from higher commodity prices. Still, $100 oil is not simply a higher-cost story. It shifts income across the economy. Consumers and fuel-intensive businesses generally pay more, while producers, royalty owners, some energy-sector employees, governments in producing regions, and energy investors may benefit. Oil Can Complicate the Interest-Rate Outlook Higher oil prices can also complicate the Federal Reserve’s job. An increase in oil prices raises headline inflation directly through gasoline and other petroleum products. If elevated prices persist, they can also increase the cost of producing and transporting other goods. That does not mean the Federal Reserve will react to every temporary oil-price spike. Monetary policymakers generally recognize that they cannot produce more crude oil or reopen a disrupted shipping lane by changing interest rates. But persistent energy inflation can make it more difficult for inflation to return to the Fed’s target, particularly if higher costs begin spreading throughout the economy. Financial markets respond to that possibility. If investors conclude that higher energy costs will keep inflation elevated, Treasury yields can rise as expectations for future interest-rate cuts are pushed back. Higher bond yields can pressure stock valuations, increase borrowing costs, and make capital investment more expensive. The companies most vulnerable to that combination are generally those already carrying substantial debt while operating on narrow margins. Higher financing costs combined with higher transportation, rawmaterial, or operating expenses can squeeze them from several directions at once. The Stock Market Does Not React Uniformly Higher oil prices are not automatically good or bad for the stock market. They create winners and losers. Exploration and production companies
generally benefit when the prices they receive rise faster than their costs. Integrated energy companies can benefit as well, although their results reflect several different businesses. Refining profits, for example, depend more heavily on the spread between crude-oil costs and refined-product prices than on the absolute price of crude. Midstream companies tend to have less direct commodity-price exposure because much of their revenue is based on volumes and fees. Nevertheless, a healthy production environment can support throughput, infrastructure demand, and long-term cash flow. Oilfield service companies can also benefit if producers respond to stronger economics by increasing drilling and completion activity, although the response often lags the initial move in crude prices. Elsewhere in the market, the impact can be very different. Airlines, trucking companies, delivery firms, some manufacturers, and other fuel-intensive businesses may face higher costs. Consumer-oriented companies can also feel the effects if households divert more of their income toward fuel and other necessities. But investors should resist simplistic rules. Not every energy stock rises when oil rises, and not every transportation company falls. Hedging programs, debt levels, contract structures, operating efficiency, geographic exposure, and pricing power all influence the outcome. The price of oil is only one variable. How Investors Should Respond A return to $100 oil is not, by itself, a reason to overhaul a well-constructed portfolio. Oil prices are volatile, and geopolitical risk premiums can disappear almost as quickly as they appear. Chasing energy stocks after a sharp rally can be just as hazardous
as ignoring the sector altogether. However, periods of elevated oil prices reinforce the value of diversification. Investors who own no energy exposure can find themselves affected twice when oil prices rise: Their household expenses increase while fuel-sensitive companies elsewhere in their portfolios come under pressure. A reasonable allocation to profitable, financially sound energy companies can provide at least a partial offset. The emphasis should remain on quality rather than simply buying the companies with the greatest exposure to the oil price. Producers with strong balance sheets, disciplined capital spending, sustainable shareholder-return policies, and competitive production costs are better positioned across an entire commodity cycle. Outside the energy sector, pricing power becomes especially important. Businesses that can pass along increases in fuel, freight, and raw-material costs without losing significant business are better equipped to navigate an inflationary environment. That broader perspective is also important when considering what $100 oil means for the economy. There is no single answer. A family filling two gasoline tanks sees the world differently from a mineral owner receiving a larger royalty check. An airline sees higher fuel costs, while an oil producer may see stronger margins and cash flow. A producing state may collect more revenue even as consumers spend more at the pump. Oil at $100 is therefore much more than an energy-market story. It can influence inflation, interest rates, corporate earnings, household spending, regional economies, and investment returns. For investors, understanding those connections is more useful than simply deciding whether $100 oil is “good” or “bad.” It is both, depending on where the costs and benefits fall.
About the author: Robert Rapier is a chemical engineer in the energy industry and Editor-in-Chief of Shale Magazine. Robert has over 30 years of international engineering experience in the chemicals, oil and gas, and renewable energy industries and holds several patents related to his work. He has worked in the areas of oil refining, oil production, synthetic fuels, biomass to energy, and alcohol production. He is author of multiple newsletters for Investing Daily and of the book Power Plays. Robert has appeared on 60 Minutes, The History Channel, CNBC, Business News Network, CBC, and PBS. His energy-themed articles have appeared in numerous media outlets, including the Wall Street Journal, Washington Post, Christian Science Monitor, and The Economist.
SHALEMAG.COM
53
FINANCE
The AI Boom Is Entering Its “Show Me” Phase By: Robert Rapier
F
or much of the past two years, investors were willing to give companies the benefit of the doubt on artificial intelligence. Announcing a new AI product, data center, partnership, or spending plan was often enough to generate enthusiasm. The assumption was that the profits would eventually follow. That period is ending. Investors are not turning against AI. If anything, recent results suggest that demand for cloud computing and AI services remains exceptionally strong. What is changing is the standard by which companies are being judged. Spending hundreds of billions of dollars on artificial intelligence is one thing. Generating an adequate return on that investment is another. The question is shifting from “How much are you investing in AI?” to “What are investors getting in return?” The Numbers Are Getting Enormous Second-quarter 2026 earnings provided a useful snapshot of where the AI boom stands. Microsoft (NSDQ: MSFT) reported quarterly revenue of $90 billion, while Azure and other cloud-services revenue grew 43%. Microsoft Cloud generated $59.3 billion during the quarter. For the full fiscal year, Azure revenue surpassed $100 billion for the first time, while Microsoft 365 Copilot exceeded 30 million paid seats. Those are tangible signs that customers are paying for the infrastructure Microsoft has been building. Amazon (NSDQ: AMZN) showed similar momentum. Amazon Web Services revenue increased 37% to $42.2 billion, its fastest growth in more than four years, while AWS operating income climbed to $16.6 billion. Amazon nevertheless raised its expected 2026 capital spending to about $220 billion as it attempts to keep up with demand. Then there is Alphabet (NSDQ: GOOGL),
54
VOLUME 4 // ISSUE 3
which demonstrates just how complicated the investment equation has become. Google Cloud revenue jumped 82% to $24.8 billion, while cloud operating income more than tripled to $8.8 billion. Those are exceptional growth numbers. But Alphabet also spent $44.9 billion on capital expenditures during the quarter, with most of that going toward AI-related technical infrastructure. The result was negative free cash flow of $5.9 billion for the quarter. Alphabet subsequently increased its projected 2026 capital expenditures to between $195 billion and $205 billion. Meta Platforms (NSDQ: META) offers another variation on the theme. Revenue increased 28% to $60.8 billion in the second quarter, but capital expenditures reached $31.1 billion. Free cash flow was just $784 million for the quarter, and Meta expects full-year capital spending of $130 billion to $145 billion. These companies are producing very different products and business models, so direct comparisons have limitations. But collectively they illustrate the scale of what is happening. AI demand is real, revenues are growing rapidly, and companies are simultaneously committing extraordinary amounts of capital to keep up. That raises the hurdle for investors. Test No. 1: Where Is the Revenue? The first test for any AI investment is straightforward: What product or service is generating revenue? That question is easier to answer for some companies than for others. Cloud providers can measure computing consumption. Software companies can disclose paid subscriptions or increases in revenue per customer. Advertising platforms can demonstrate whether AI tools are improving targeting, engagement, or conversion rates. Investors should be more cautious when a company talks extensively about AI but provides little information about
customers, pricing, adoption, or revenue. Management does not necessarily need to disclose a separate AI revenue line. Many AI features are being integrated into existing products. But investors should be able to identify some measurable economic benefit, whether it appears as faster cloud growth, rising subscription revenue, higher margins, improved customer retention, or greater productivity. Otherwise, “AI strategy” can become a label attached to ordinary technology spending. The distinction will become increasingly important as AI spreads beyond the handful of technology giants now dominating the investment cycle. Hundreds of companies will claim that artificial intelligence is improving their businesses. Far fewer will be able to show investors exactly where that improvement appears on the income statement. Test No. 2: Can the Company Afford the Buildout? The second test is financial capacity, and this is where the AI story increasingly becomes an energy story. AI infrastructure requires far more than advanced semiconductor chips. It requires servers, networking equipment, data centers, cooling systems, transmission infrastructure, and large quantities of reliable electricity. Once those assets are installed, the costs continue through depreciation, maintenance, staffing, and power consumption. The scale of the electricity requirement is becoming difficult to ignore. After more than a decade of relatively flat U.S. electricity consumption, demand has begun growing again, and the Energy Information Administration identifies data-center server demand as a major contributor. EIA projects electricity consumption to continue growing through 2050 across all of its major scenarios. For the oil and gas industry, the most direct connection is natural gas.
JIRSAK/DEPOSITPHOTOS
The International Energy Agency estimates that natural gas currently supplies more than 40% of the electricity used by U.S. data centers. It projects gas to remain the largest source of additional U.S. data-center power supply through 2030, adding more than 130 terawatt-hours of
annual generation. Renewables, nuclear power, and storage will also play important roles, and the eventual mix will vary considerably by region. But natural gas has several characteristics that make it particularly relevant to rapidly growing data-center loads, including dispatchability and an extensive
existing pipeline and generation network. That expands the AI investment universe well beyond semiconductor and software companies. Gas producers, pipeline operators, electric utilities, power generators, turbine manufacturers, electrical-equipment suppliers, and data-center developers can all participate in the physical infrastructure behind AI. It also creates potential bottlenecks. A company may have the money to build another data center and still struggle to
SHALEMAG.COM
55
obtain enough power, generation equipment, transmission capacity, or a timely grid connection. For investors, that means evaluating AI capital spending requires asking two related questions. Can the company finance what it wants to build, and can it actually obtain the physical infrastructure needed to operate it? Cash flow remains central to the first question. A company can report rapidly rising earnings while capital expenditures consume much of the cash generated by the business. That does not automatically make the investment unwise. Amazon spent heavily for years building a logistics network that ultimately became an enormous competitive advantage. But investors need to consider how long extraordinary spending will continue, how rapidly the assets may become obsolete, and whether they can eventually generate returns above the company’s cost of capital. The largest technology companies have an important advantage because their existing businesses generate tremendous amounts of cash. Smaller competitors may have to issue debt or stock, accept years of negative cash flow, or depend on outside financing to compete. That difference may become increasingly important if the AI investment cycle lasts as long as its biggest participants expect. Test No. 3: What Protects the Profit? The third test is competitive advantage. Demand for AI can grow rapidly without every participant earning attractive returns. History provides plenty of examples. The automobile transformed the economy, but most early automakers eventually disappeared or were absorbed by stronger competitors. The internet reshaped commerce and communication, but countless internet companies vanished along the way. The same principle will apply to artificial intelligence. A durable advantage could come from proprietary chips, scarce power access, strategically located data-center capacity,
valuable proprietary data, customer relationships, software distribution, or the ability to spread development costs across a massive installed base. Microsoft, Amazon, Alphabet, and Meta already have billions of users or deeply established enterprise relationships. That gives them distribution advantages that most startups do not possess. It does not guarantee that every dollar invested in AI will earn an attractive return, but it improves their ability to put new products in front of paying customers. Infrastructure providers offer another way to approach the opportunity. Semiconductor manufacturers, power generators, utilities, pipeline operators, data-center companies, and electrical-equipment suppliers may benefit from the buildout without having to predict which individual AI application ultimately dominates. There is an old investing analogy about selling picks and shovels during a gold rush. It has some merit here, but only up to a point. A company is not automatically a good investment because it supplies something a data center needs. Valuation still matters. So do margins, debt, customer concentration, contract terms, competition, and the danger of expanding capacity just as the investment cycle begins to slow. The infrastructure supporting a boom can eventually become overbuilt just as easily as the technology itself. An Opportunity for the Energy Sector For the energy industry, AI represents something unusual. For years, U.S. electricity demand barely grew. Utilities, power producers, and fuel suppliers operated in an environment in which efficiency gains often offset increases from population and economic growth. Data centers are helping to change that equation. The opportunity is potentially significant, particularly for natural gas, because the AI industry is placing a premium on reliable power that can be delivered quickly. But investors should avoid assuming that
every forecast for data-center demand will materialize exactly as projected. Efficiency improvements could reduce electricity requirements per unit of computing. Grid constraints could delay projects. New nuclear generation, renewables paired with storage, geothermal power, and other technologies may capture portions of the market. The locations of future data centers will also be influenced by power prices, transmission availability, water, taxes, fiber connections, and local permitting. Those uncertainties do not undermine the energy opportunity. They help define it. The likely winners will be companies that can provide needed energy and infrastructure at competitive prices while earning acceptable returns on the capital required to build it. The Big Picture The AI boom is not ending. It is maturing. The first stage rewarded bold promises and ambitious spending plans. The next stage will increasingly reward companies that can show a clear connection between investment, customer demand, revenue, cash flow, and ultimately return on capital. That is a healthy development. Transformative technologies produce both extraordinary winners and expensive disappointments. The market’s job is to separate the two. Investors evaluating an AI-related company should continue asking three questions: Where is the revenue? Can the company finance and execute the buildout? What protects the eventual profit? Those questions apply just as readily to the energy infrastructure supporting AI as they do to the technology companies developing it. The artificial-intelligence boom may have begun with software and semiconductors, but its next phase is increasingly being built out of steel, concrete, transmission lines, generating capacity, and natural gas. For investors, understanding who gets paid for that buildout may prove just as important as understanding the technology itself.
About the author: Robert Rapier is a chemical engineer in the energy industry and Editor-in-Chief of Shale Magazine. Robert has over 30 years of international engineering experience in the chemicals, oil and gas, and renewable energy industries and holds several patents related to his work. He has worked in the areas of oil refining, oil production, synthetic fuels, biomass to energy, and alcohol production. He is author of multiple newsletters for Investing Daily and of the book Power Plays. Robert has appeared on 60 Minutes, The History Channel, CNBC, Business News Network, CBC, and PBS. His energy-themed articles have appeared in numerous media outlets, including the Wall Street Journal, Washington Post, Christian Science Monitor, and The Economist.
Opening Doors in San Antonio Since 1974
ONLY TEXANS TEXANS
KNOW HOW TO FEED
Reaping the earth’s bounty is what we do best. That’s why you should plan your next offsite onsite by catering with Freebirds. From custom-rolled burritos to an entire burrito bar, your folks will attend this meeting and even look forward to the next. Place your order now.
KING REALTORS is dedicated to helping San Antonio and the oil industry with their real estate needs. If you are looking to buy or sell a property, call us and say you saw it in SHALE Magazine!
Freebirds World Burrito San Antonio & South Texas Catering Sales Manager Josie Nieves P: 210-560-5002 F: 866-421-0876 jnieves@freebirds.com
TABITHA KING 210.414.4255
5600 Broadway Avenue • San Antonio, TX 78209 KingRealtors.com tabitha@kingrealtors.com
Rise above the River Walk for elevated experiences in this cultural epicenter. Unmatched skyline vistas, magnetic gathering places, refined guest rooms, and celebrated cuisine await at Thompson San Antonio – Riverwalk.
SHALE CORPORATE RATE $179 BASED ON AVAILABILITY
For more information call or email, james@shalemag.com 210 240-7188
115 LEXINGTON AVE 210.942.6019
www.hyatt.com/hotel/thompson-hotels
58
VOLUME 4 // ISSUE 3
SHALEMAG.COM
59
60
VOLUME 4 // ISSUE 3
SHALEMAG.COM
61
62
VOLUME 4 // ISSUE 3
SHALEMAG.COM
63
A PRIVATE OASIS IN THE TEXAS HILL COUNTRY
Our expanded Ranch Club complex is the perfect paradise for rest, relaxing and recreation. Just steps from Clubhouse Village, it now offers many additional resort-style amenities including four separate swimming pools, Jacuzzi, Ranch Club Grill featuring a wood burning pizza oven, a luxurious open-air pavilion for lounging and seating for up to 300, lighted hard-surface tennis and sport courts, and much more.
To learn more please contact Sean Gioffre at 830-990-7693 / sgioffre@bootranch.com or Andrew Ball at 830-997-6200 / aball@bootranch.com. bootranch.com
VOLUME 4 // ISSUE 3
4
VOLUME 4 // ISSUE 3