Seesaw contracted with Instructure to examine the impact of its platform usage on student literacy outcomes. Instructure designed the study to satisfy Level III requirements (Promising Evidence) according to the Every Student Succeeds Act (ESSA, 2015).
Study Sample and Methodology
This study was conducted with data from the 2024–25 school year and included 590 students across one public school district in California. Researchers conducted analyses by grade band to allow for better interpretability of findings: Grades 1–2 (60%), and Grades 3–5 (40%).
The sample was racially and ethnically diverse, comprising students who identified as Hispanic (42%), White/Caucasian (37%), Multi-ethnic (9%), Black/African American (4%), Asian (3%), and Filipino (3%). In terms of socioeconomic status, 54% of students came from economically disadvantaged households. Slightly over half of the sample (52%) identified as female.
Researchers used multiple measures to examine Seesaw implementation and its potential impact on student literacy outcomes: Seesaw usage data and standardized reading assessment scale scores (i.e., Renaissance Star Reading). Regression analyses were conducted to explore the association between Seesaw use and student literacy outcomes, controlling for prior literacy achievement (fall baseline scores). The models included key student-level covariates grade, race/ethnicity, socioeconomic status (SES), and gender to account for potential selection bias.
Main Research Findings
Main Research Findings
Grades 1–2
No evidence that Seesaw usage was associated with EOY literacy scores.
Grades 3-5
Students who posted more frequently on Seesaw tended to have slightly higher with EOY literacy scores
No evidence that voice/video posts or family visits to student work were associated with EOY literacy scores
Note: All the above findings were statistically significant at p < .05
Conclusions
Given the positive findings, this study provides results to satisfy ESSA evidence requirements for Level III (Promising Evidence).
Introduction
Recent national assessments have revealed that student performance in literacy continues to be a significant concern in the United States. The 2024 administration of the National Assessment of Educational Progress (NAEP) showed that average reading scores for fourth-grade students were 5 points lower compared to 2019 (National Center for Education Statistics [NCES], 2024). Furthermore, the results indicated that only 31 percent of fourth-graders performed at or above the NAEP Proficient level, a decline of 4 percentage points from 2019. These ongoing challenges highlight the critical need for effective literacy instruction and engagement, particularly in the early grades.
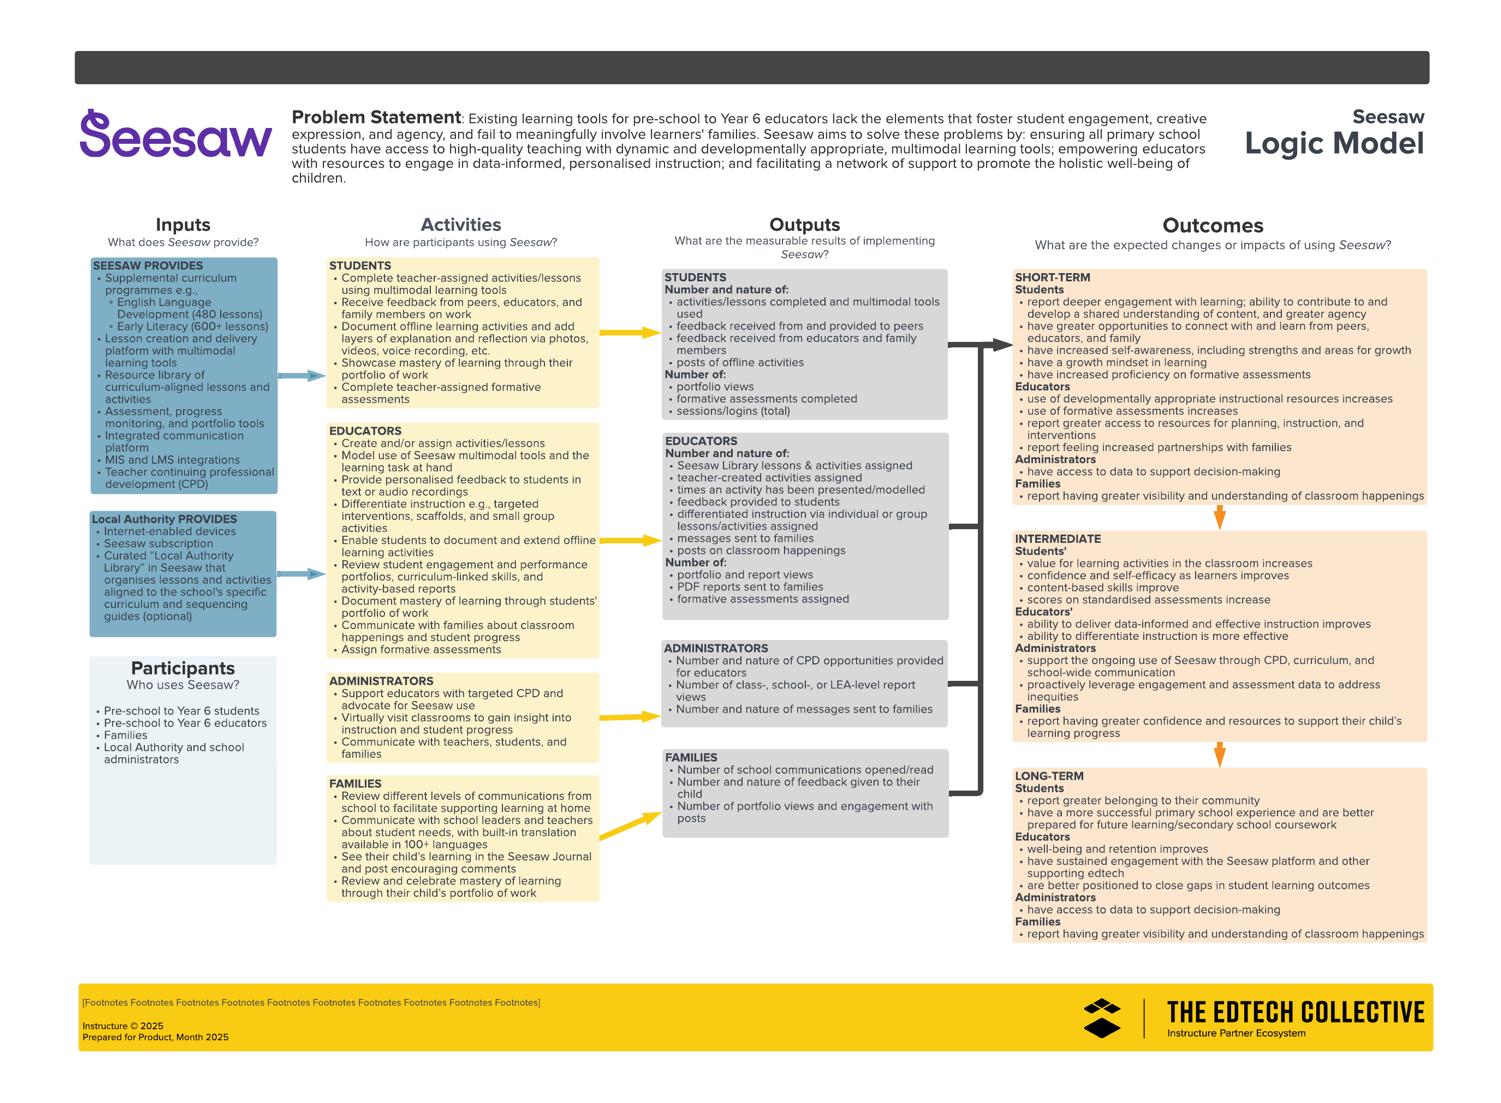
Seesaw recognizes that existing learning tools for prekindergarten to Grade 5 educators often lack the elements that foster student engagement, creative expression, and agency, and can fail to meaningfully involve learners’ families. Seesaw aims to solve these problems by ensuring all elementary students have access to high-quality instruction with dynamic and developmentally appropriate, multimodal learning tools; empowering educators with resources for data-driven, personalized instruction; and facilitating a network of support to promote the holistic well-being of children.
As part of their ongoing efforts to demonstrate the effectiveness of their solution, Seesaw contracted with Instructure to examine the association between usage of Seesaw and student literacy outcomes Using the Every Student Succeeds Act (ESSA) standards as guidance in developing a study design, findings in this report align with Level III requirements (Promising Evidence). The following research questions guided this study:
Implementation
1. To what extent did students engage with Seesaw during the school year? On average, how many
a. overall posts did students create in Seesaw?
b. times did families view their child's work on Seesaw?
c. posts did students create using voice or video recordings?
Student Outcomes
2. After controlling for prior achievement and other student demographic characteristics (e.g., grade, gender, race, and socioeconomic status), did students' performance on standardized literacy assessments vary based on their use of Seesaw during the school year?
This report details the study design and methods, implementation, findings, and conclusions.
Study design and methods
This section of the report briefly describes the study participants, measures, and analysis methods.
Study Design
This study used a correlative design to align with ESSA Level III evidence standards. It included all students in the district who used Seesaw during the 2024–25 school year
Setting and Participants
This study was conducted with data from the 2024–25 school year and included 590 students across one public school district in California. Researchers conducted analyses by grade band to allow for better interpretability of findings: Grades 1–2 (60%), and Grades 3–5 (40%).
The sample was racially and ethnically diverse, comprising students who identified as Hispanic (42%), White/Caucasian (37%), Multi-ethnic (9%), Black/African American (4%), Asian (3%), and Filipino (3%). In terms of socioeconomic status, 54% of students came from economically disadvantaged households. Slightly over half of the sample (52%) identified as female
Measures
This study included the following measures to provide insights into Seesaw implementation and evidence about the potential impacts of Seesaw on student literacy outcomes.
Seesaw Usage Metrics Researchers analyzed 2024–25 student-level Seesaw usage data, including the total number of student posts, the total number of voice or video posts, and the total number of family visits to student work. These data were used to gauge the extent of student engagement with Seesaw throughout the school year and to explore relationships between Seesaw use and student reading outcomes.
Standardized Student Assessments Student literacy outcomes were assessed using Renaissance Star Reading assessment scores. The beginning-of-year (BOY) score for each assessment was used as a pretest to control for students' prior achievement, while the end-ofyear (EOY) score served as the primary outcome measure. Star Reading scores range from 600 to 1,400, with higher scores indicating stronger literacy skills.
Data Analysis
Researchers used a variety of quantitative analytic approaches. First, researchers conducted descriptive statistics to examine participant characteristics and support implementation analyses.
To examine the association between Seesaw usage and student outcomes, researchers employed regression analysis. These models assessed the relationship between various usage metrics and end-of-year literacy scores. All models controlled for prior achievement, measured by BOY scores, and included key student-level covariates grade, race/ethnicity, socioeconomic status, and gender to account for potential selection bias.
Implementation
The analysis of program implementation drew on usage data from 590 active Seesaw users, as determined by available login records. Tables 1–3 present a detailed breakdown of how specific Seesaw tools were used.
Usage patterns showed that while engagement levels among Seesaw users were similar across grade bands, adoption rates varied considerably by grade. The majority of Seesaw users were concentrated in Grades 1–2 (60%), with notably lower adoption in Grades 3–5 (40%). Grade 2 had the highest number of users (47% of all Seesaw users), while Grades 4 and 5 each represented approximately 10% of users.
Table 2. Descriptive statistics for family visits to student work
Table 3. Descriptive statistics for the total number of students' video or voice posts
Table 1. Descriptive statistics for total number of student posts
Effectiveness Findings for 2024–25 School Year
Regression analyses were conducted to examine the relationship between student Seesaw usage and end-of-year literacy outcomes. All models controlled for prior achievement (BOY scores) and key student-level covariates grade, race/ethnicity, socioeconomic status, and gender to account for potential selection bias. This approach isolates the unique association between each engagement metric and student outcomes, providing a clearer picture of how specific usage patterns relate to literacy performance. Standardized effect sizes (omega-squared) were calculated to quantify the strength of these relationships.
Overall Association Between Seesaw Usage and Grades 1–2 End-of-Year Literacy Scores
For the overall Grades 1–2 sample, there was no evidence that student posts, family visits to student work, or voice or video posts were associated with end-of-year literacy scores. All engagement metrics showed non-significant relationships with spring reading outcomes, even after controlling for beginning-of-year scores and demographic characteristics.
Overall Association Between Seesaw Usage and Grades 3–5 End-of-Year Literacy Scores
Students who posted more frequently on Seesaw tended to perform slightly better by the end of the year. Each additional post was associated with approximately a 0.3-point gain in end-of-year literacy scores, meaning a student who made 10 more posts than another could expect roughly a 3-point higher end-of-year score (p = 0.047). However, the effect size was very small (ω2 = 0.01), indicating that student posts explained minimal variance in literacy outcomes beyond what was already predicted by fall baseline scores and demographic factors.
Among Grades 3–5 students, overall posting frequency showed a small association with literacy outcomes
1. Association between Seesaw engagement metrics and end-of-year literacy scores for Grades 3–5 students (n = 237)
There was no evidence that family visits to student work or voice or video posts were associated with end-of-year literacy scores in Grades 3–5. These engagement metrics showed nonsignificant relationships with spring reading outcomes across all analyses.
Figure
Conclusions and Recommendations
The findings support a modest association between Seesaw usage and improved literacy outcomes for Grades 3–5 students. For Grades 1–2 students, no engagement metrics, including student posts, family visits to student work, or voice/video posts were associated with end-ofyear literacy scores.
Among Grades 3–5 students, overall posting frequency showed a small but statistically significant positive association with end-of-year literacy scores, suggesting that students who posted more frequently on Seesaw scored slightly higher on STAR reading assessment compared to those who posted less frequently.
This study provides results to satisfy ESSA evidence requirements for Level III (Promising Evidence). Specifically, this study met the following criteria:
Correlative design
Proper design and implementation
Statistical controls through covariates
At least one statistically significant, positive finding
Researchers recommend the following next steps:
• Investigate grade-level differences in implementation
o Examine why posting frequency was associated with literacy outcomes in Grades 3–5 but not in Grades 1–2. Qualitative research could help identify whether developmental factors, instructional approaches, or assignment types explain these differential patterns.
• Expand professional learning around effective Seesaw use
o Provide targeted support for teachers (especially in Grades 1–2) to integrate Seesaw in ways that promote meaningful literacy development rather than task completion.
• Increase family engagement and overall usage
o Family visits to student work were minimal across all grades and showed no association with outcomes. Develop strategies to increase meaningful family interaction with student work in Seesaw.
• Monitor implementation consistency
o Continue collecting and analyzing usage data across schools and grades to identify where engagement practices are strongest and where additional support may be needed.
References
Every Student Succeeds Act, Pub. L. No. 114-95 (2015). URL
National Center for Education Statistics. (2024). NAEP report card: Reading Grade 4 national results. U.S. Department of Education, Institute of Education Sciences. URL
Appendix A. Seesaw Logic Model
Appendix B: Additional Information on Outcome Findings
Overall Association Between Seesaw Usage and Grades 1–2 End-of-Year Literacy Scores
Table B1. Overall Association Between Number of Student Posts and Grades 1–2 Students' Literacy Outcomes on STAR Reading (n = 353)
Table B2. Overall Association Between Number of Posts with Voice and Video and Grades 1–2 Students' Literacy Outcomes on STAR Reading (n = 353)
Table B3. Association Between Number of Family Visits to Student Work and Grades 1–2 Students' Literacy Outcomes on STAR Reading (n = 353)
Overall Association Between Seesaw Usage and Grades 3–5 End-of-Year Literacy Scores
Table B5. Overall Association Between Number of Student Posts and Grades 3–5 Students' Literacy Outcomes on STAR Reading (n = 237)
Table B6. Overall Association Between Number of Posts with Voice and Video and Grades 3–5 Students' Literacy Outcomes on STAR Reading (n = 237)
Table B7. Association Between Number of Family Visits to Student Work and Grades 3–5 Students' Literacy Outcomes on STAR Reading (n = 237)