Verifiably Independent
Securities Analytics Research
U.S. Securities Litigation Risk Trends – August 2026
September 17, 2026
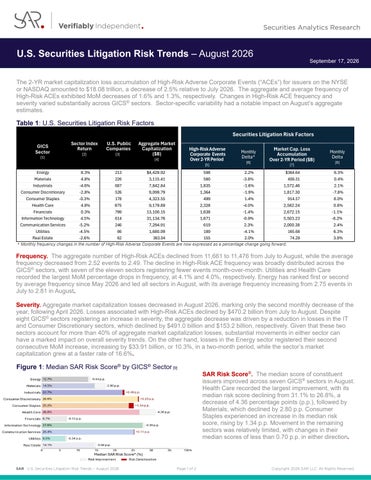
The 2-YR market capitalization loss accumulation of High-Risk Adverse Corporate Events (“ACEs”) for issuers on the NYSE or NASDAQ amounted to $18.08 trillion, a decrease of 2.5% relative to July 2026. The aggregate and average frequency of High-Risk ACEs exhibited MoM decreases of 1.6% and 1.3%, respectively. Changes in High-Risk ACE frequency and severity varied substantially across GICS® sectors. Sector-specific variability had a notable impact on August’s aggregate estimates.
Table 1: U.S. Securities Litigation Risk Factors Securities Litigation Risk Factors GICS Sector [1]
Sector Index Return [2]
U.S. Public Companies [3]
Aggregate Market Capitalization ($B) [4]
High-Risk Adverse Corporate Events Over 2-YR Period
Monthly Delta*
598 580 1,835 1,364 499 2,328 1,638 1,671 619 189 155
2.2% -3.8% -1.6% -1.9% 1.4% -4.0% -1.4% -0.9% 2.3% -4.1% 2.0%
[5]
Energy Materials Industrials Consumer Discretionary Consumer Staples Health Care Financials Information Technology Communication Services Utilities Real Estate
8.3% 4.8% -4.6% -2.8% -0.3% 4.8% 0.3% 4.5% -5.2% -4.5% -2.6%
213 226 687 526 178 975 799 614 246 86 62
$4,429.92 3,115.41 7,842.84 9,099.79 4,323.55 9,179.89 13,100.15 31,134.76 7,294.91 1,680.99 363.04
[6]
Market Cap. Loss Accumulation Over 2-YR Period ($B)
Monthly Delta
$364.64 409.31 1,572.46 1,817.30 914.57 2,582.24 2,672.15 5,503.23 2,000.38 165.68 74.29
6.3% 0.4% 2.1% -7.8% 8.0% 0.8% -1.1% -8.2% 2.4% 6.3% 3.9%
[7]
[8]
* Monthly frequency changes in the number of High-Risk Adverse Corporate Events are now expressed as a percentage change going forward.
Frequency. The aggregate number of High-Risk ACEs declined from 11,661 to 11,476 from July to August, while the average frequency decreased from 2.52 events to 2.49. The decline in High-Risk ACE frequency was broadly distributed across the GICS® sectors, with seven of the eleven sectors registering fewer events month-over-month. Utilities and Health Care recorded the largest MoM percentage drops in frequency, at 4.1% and 4.0%, respectively. Energy has ranked first or second by average frequency since May 2026 and led all sectors in August, with its average frequency increasing from 2.75 events in July to 2.81 in August. Severity. Aggregate market capitalization losses decreased in August 2026, marking only the second monthly decrease of the year, following April 2026. Losses associated with High-Risk ACEs declined by $470.2 billion from July to August. Despite eight GICS® sectors registering an increase in severity, the aggregate decrease was driven by a reduction in losses in the IT and Consumer Discretionary sectors, which declined by $491.0 billion and $153.2 billion, respectively. Given that these two sectors account for more than 40% of aggregate market capitalization losses, substantial movements in either sector can have a marked impact on overall severity trends. On the other hand, losses in the Energy sector registered their second consecutive MoM increase, increasing by $33.91 billion, or 10.3%, in a two-month period, while the sector’s market capitalization grew at a faster rate of 16.6%.
Figure 1: Median SAR Risk Score® by GICS® Sector [9]
SAR U.S. Securities Litigation Risk Trends – August 2026
Page 1 of 2
SAR Risk Score®. The median score of constituent issuers improved across seven GICS® sectors in August. Health Care recorded the largest improvement, with its median risk score declining from 31.1% to 26.8%, a decrease of 4.36 percentage points (p.p.), followed by Materials, which declined by 2.80 p.p. Consumer Staples experienced an increase in its median risk score, rising by 1.34 p.p. Movement in the remaining sectors was relatively limited, with changes in their median scores of less than 0.70 p.p. in either direction.
Copyright 2026 SAR LLC. All Rights Reserved.
Securities Litigation Risk Management Trends End Notes [1] Sectors are based on the company’s Global Industry Classification Standard (GICS®). [2] The returns of the respective GICS® sectors’ S&P Composite 1500 indices over the preceding month. The indices comprise firms of small, medium, and large market capitalization in the given GICS® sectors’ categories and for purposes of this risk management report, represent the corresponding sector’s performance in the U.S. equity markets. The firm specific event-study analyses for each issuer that supports this monthly aggregate analysis, apply a company-specific index that excludes the target company and is selected according to its industry categorization. The applied company-specific indices may or may not be the corresponding S&P Composite sector 1500 indices. [3] Number of companies analyzed by SAR in each sector as of August 31, 2026. This sample includes every issuer that traded as common stock or ADR on the NYSE or NASDAQ with sufficient trading data to meet SAR standards of quality control. [4] Aggregate market capitalization of all analyzed companies within the given GICS® sector as of August 31, 2026. [5] High-Risk Adverse Corporate Events (“ACEs”) of all analyzed issuers during the preceding two years. ACEs are identified by estimating statistically significant single-trading day negative stock price movements that coincide with company-specific disclosures. High-Risk ACEs correspond to both direct corporate communications and SEC filings. [6] The percentage change between [5] and the salient statistics relative to last month. [7] The cumulative quantum of market capitalization losses on identified High-Risk ACEs for issuers during the preceding two-year period. [8] The percentage change between [7] and the salient statistics relative to last month. [9] The SAR Risk Score® is a proprietary score assigned to every public company listed on the NYSE or NASDAQ according to the frequency and severity of ACEs during a two-year period from the designated evaluation date. The SAR Risk Score® is equal to the market capitalization losses observed on High-Risk ACEs divided by the issuer’s market capitalization as of the preceding trading day. Figure 1 displays the percentage point (p.p.) difference in the SAR Risk Score® of the median constituent company compared to last month. A +1.0 (deterioration) implies that a sector’s median SAR Risk Score® during the corresponding month increased by one percentage point relative to the preceding month. A -1.0 (improvement) implies a reduction.
U.S. Securities Litigation Risk Trends Report Disclaimer This securities litigation risk research report presents the monthly change in frequency of High-Risk ACEs and the impact on the accumulated twoyear market capitalization losses on the universe of issuers that trade on the NYSE and NASDAQ. SAR LLC (“SAR”) tracks and publishes 2-YR market capitalization loss accumulation linked to High-Risk ACEs for both U.S. and non-U.S. issuers to evaluate and report the monthly change in magnitude of embedded securities litigation risk on a sector-specific basis. SAR applies uniform, back-tested, regression-based event study analyses with courtapproved parameters for accurate and objective identification of Adverse Corporate Events that impact the securities litigation risk of issuers that trade in the NYSE and NASDAQ. All content published by SAR and presented in this monthly securities litigation risk research report is based on securities analytics research performed by professionals employed by SAR. SAR does not apply or rely on machine learning (ML) or artificial intelligence (AI) to compute the quantitative and statistical analyses presented herein. Securities litigation risks associated with observed Adverse Corporate Events independently identified by SAR may or may not materialize into securities claims filed by allegedly harmed shareholders. Such claims, if brought, may be directed against the corporate directors and officers of the defendant issuers, or against the underwriters of the related public securities offerings. Securities claims may include, but are not limited to, securities class actions whereby investor plaintiffs allege violations of the federal securities laws under Section 11, Section 12(a)(2), and Section 15 of the Securities Act of 1933 (“Securities Act”), and under Section 10(b) and 20(a) of the Securities Exchange Act of 1934 and Securities Exchange Commission (“SEC”) Rule 10b5 promulgated thereunder (“Exchange Act”). Securities litigation risks may also materialize from enforcement actions filed in federal court by the SEC for alleged violations of the anti-fraud provisions of the securities laws of the Exchange Act, Securities Act, or the Investment Advisors Act of 1940. Publicly available research published by SAR that contains economic estimates on the impact of securities litigation risk are only estimates, and actual results may vary from those estimates or projections, which are based on many variables, assumptions, and forecasts, many of which are beyond the control of SAR and any of which may present differences with estimates that are quantified using different techniques that may not be accepted in legal proceedings in the U.S. Federal Judiciary.
No fraud or wrongdoing of any kind is alleged or implied by the information published and made publicly available by SAR in this research report. Sources: SAR ACE Database as of August 31, 2026, FINRA, U.S. Securities and Exchange Commission, S&P Global Market Intelligence, and S&P Down Jones Indices.
Contact Information:
Nessim Mezrahi CEO T: 202.891.3650 E: Nessim@sarlit.com
Stephen Sigrist, MFE Senior Vice President T: 202.891.3652 E: Stephen@sarlit.com
Rolando Hernandez, MSc Senior Analyst T: 202.436.9994 E: Rolando@sarlit.com
About Securities Analytics Research (SAR): SAR LLC is a specialized data analytics company focused on securities litigation risk management analytics of U.S. public companies, founded in 2018 and based in Bethesda, MD. Through the SAR Platform®, users license verifiably independent and high-quality data analytics based on near real-time stock price performance in response to public companies’ corporate disclosures. SAR is the developer and publisher of the SAR Risk Score®, which is assigned to issuers that trade on the NYSE or NASDAQ at the close of trading. SAR applies the court-approved event study methodology to test stock price reaction on the universe of corporate disclosures to accurately estimate the probability and magnitude of securities litigation risk impacting directors and officers. SAR provides verifiably independent securities class action settlement valuations as evidentiary support in mediated negotiations that resolve securities claims that allege violations of the federal securities laws under the Exchange Act of 1934 and Securities Act of 1933. The company is committed to the verifiable independence and accuracy of the licensed data and has been publishing quarterly statistical back-testing results since 2018. SAR does not rely on artificial intelligence (AI) or machine learning (ML) and operates in accordance with documented standard operating procedures with assigned process owners to ensure independent, human accountability. The company does not engage in economic consulting, nor places capital at risk on behalf of investors or insurers. SAR does not actively trade, hold, or intend to hold positions on the universe of equity issuances listed on the NYSE or NASDAQ, and whose principals and full-time professionals are restricted from actively trading.
SAR U.S. Securities Litigation Risk Trends – August 2026
Page 2 of 2
Copyright 2026 SAR LLC. All Rights Reserved.