Temporalvariabilityinpotentiallytoxicelements(PTE’s) andbenthicForaminiferainanestuarineenvironment inPuertoRico
MichaelMartínez-Colón 1,PamelaHallock 2,CarlosR.Green-Ruíz3 andJosephM.Smoak 4
1 SchooloftheEnvironment,FloridaA&MUniversity,Tallahassee,FL,USA
2 CollegeofMarineScience,UniversityofSouthFlorida,St.Petersburg,FL,USA
3 UnidadAcadémicaMazatlán,InstitutodeCienciasdelMaryLimnología, UniversidadNacionalAutónomadeMéxico,MazatlánSinaloa,México
4 EnvironmentalScience,UniversityofSouthFlorida,St.Petersburg,FL,USA
email:michael.martinez@famu.edu
ABSTRACT: BulkconcentrationsofPTEs(potentiallytoxicelements)wereassessedandcomparedwithforaminiferalassemblages fromcoresedimentsfromTL(TorrecillasLagoon),onthenorthcoastofPuertoRico.Temporaldistributionsofmud,Fe,Al(proxyfor terrigenoussedimentation),andrhenium(proxyforanoxia)reflected changesinlandusewithinthedrainagebasinassociatedwithhumanactivitiesoverthepastcentury.Themud-dominatedsedimentsprovidedamajor“sink”forPTEs,whileFeoxidesandsulfides servedasasecondary“sinks”.TemporalvariabilityofRerevealedintervalsofaerobic vs anaerobicconditionsinthelagoon.Thedominantforaminiferaltaxa, Ammoniabeccarii, Quinqueloculinarhodiensis, Quinqueloculinaseminula,and Ammobaculitesagglutinans, coupledwithlowforaminiferaldensitiesandspeciesdiversities,aswellasbarrensamples,arecharacteristicofstressedestuarineenvironments.OverallbulkconcentrationsofCuandZnnegativelycorrelatedwithforaminiferalabsolute/relativeabundances,diversityindicesandincidencesoftestdeformities.However,thereareno correlationswiththeassumedbioavailablecounterparts(F2Tess-Cuand F2Tess-Zn)wereobserved.TheseresultsindicatethatfractionationofPTEsneedtobeconsideredinrelationtotheirbiologicalsignificancetoforaminiferalecology,whichmaydiffersubstantiallyfrombioavailabilitytometazoansthatingestsediments.Theapplication oftheacid-solubleF2Tess isnotrecommendedinenvironmentalstudiesusingforaminifersasbioindicators,asPTEsinthisfractionare likelynotbioavailabletotheseprotists.
Keywords: Heavymetals,ForaminiferalEcology,Fractionation,Bioavailability,Hypoxia
INTRODUCTION
Estuariesareuniqueecotonesthatprovidehabitatfornumerous organisms,aswellasecosystemservicesincludingnurseryand feedinggroundsfordevelopmentalstagesofneriticandcoastal marinespecies.Unfortunately,inadditiontonaturalstressors, thesecoastalecotonesreceivecopiousamountsofpollutantsas aconsequenceofindustrializationandcoastalurbanization ( Balachandranetal.2006;Zitelloetal.2008;Seshanetal. 2010;manyothers) .Numerousstudiesworldwidehaveassessedestuarineresiliencyinresponsetostressorssuchassewage(Abu-Zeidetal.2013)andPTEs(Martínez-Colónetal. 2009,2018).Estuarineenvironmentsarewellknownassinksof PTEs,organicpollutants,andmorerecently,microplastics (e.g.,Lingetal.2017;SharmaandChatterjee2017).Inaddition,PTE(re)mobilizationandpotentialbioaccumulationare dependentuponsolubilityinseawater,salinity,typeoforganic matteramongotherfactors(e.g.,Martínez-Colónetal.2009). TheimpactsofPTEsonmacro-/microbiotaarehighlydependentonbioavailability,concentration,anddurationandtimingof exposure(Pinto2003).AsPTEshavelonglastingeffectsonthe overallhealthofanestuary,theyimpactthediversityandabundanceofbenthicforaminifers(Yankoetal.1998;Martinsetal. 2015),therebyprovidingusefulbioindicatorsofsuchpollution.
TheTL(TorrecillasLagoon)innorthernPuertoRicoisinfluencedbymanypointandnonpointsourcesofpollution(e.g., sewagedischarge,boatmarinas,etc.)(text-fig.1).SeveralstudieshavecharacterizedanddocumentedthepresenceofPTEsin sediments,waterortissuesamples(fish,clams,etc.)alongwith anoxicconditions,highfecalcoliformcountsandexcessofnutrients(EllisandGómez-Gómez1976;Ellis1976;Webband Gómez-Gómez1998;SJBE2000;SJBE2009;Martínez-Colón andHallock2010;andMartínez-Colónetal.2018).Onlytwo studieshavedocumentedorganicpollutants(e.g.PCBs,Dieldrin,etc.)fromsurfaceandcoresedimentsofTL(SanJuanBay Estuary2000;WebbandGómez-Gómez1998).Forexample, Vistamar,VillaCarolina,andRoundHillssewagetreatment plantsdischargedintoQuebradaBlasinauntil1986,whenthe effluentswereredirectedtowardstheCarolinaRegionalSewageTreatmentPlant(SJBE2000).Rawsewagefromthe VistamarcollectionsystemoccasionallyreachesTLdueto overflow(SJBE2000).
Ecologicalindicatorsallowassessmentofenvironmentalconditionsandtrendsovertime(DaleandBeyel2001).Bioindicators ofenvironmentalstressinestuarineenvironmentscanbevery usefulinidentifyingsourcesofpollution(Pintoetal.2009; Bouchetetal.2012;Emrichetal.2017).Overthepast50years,
MichaelMartínez-Colónetal:TemporalvariabilityinpotentiallytoxicelementsandbenthicForaminifera,estuarineenvironment,PuertoRico
TEXT-FIGURE1
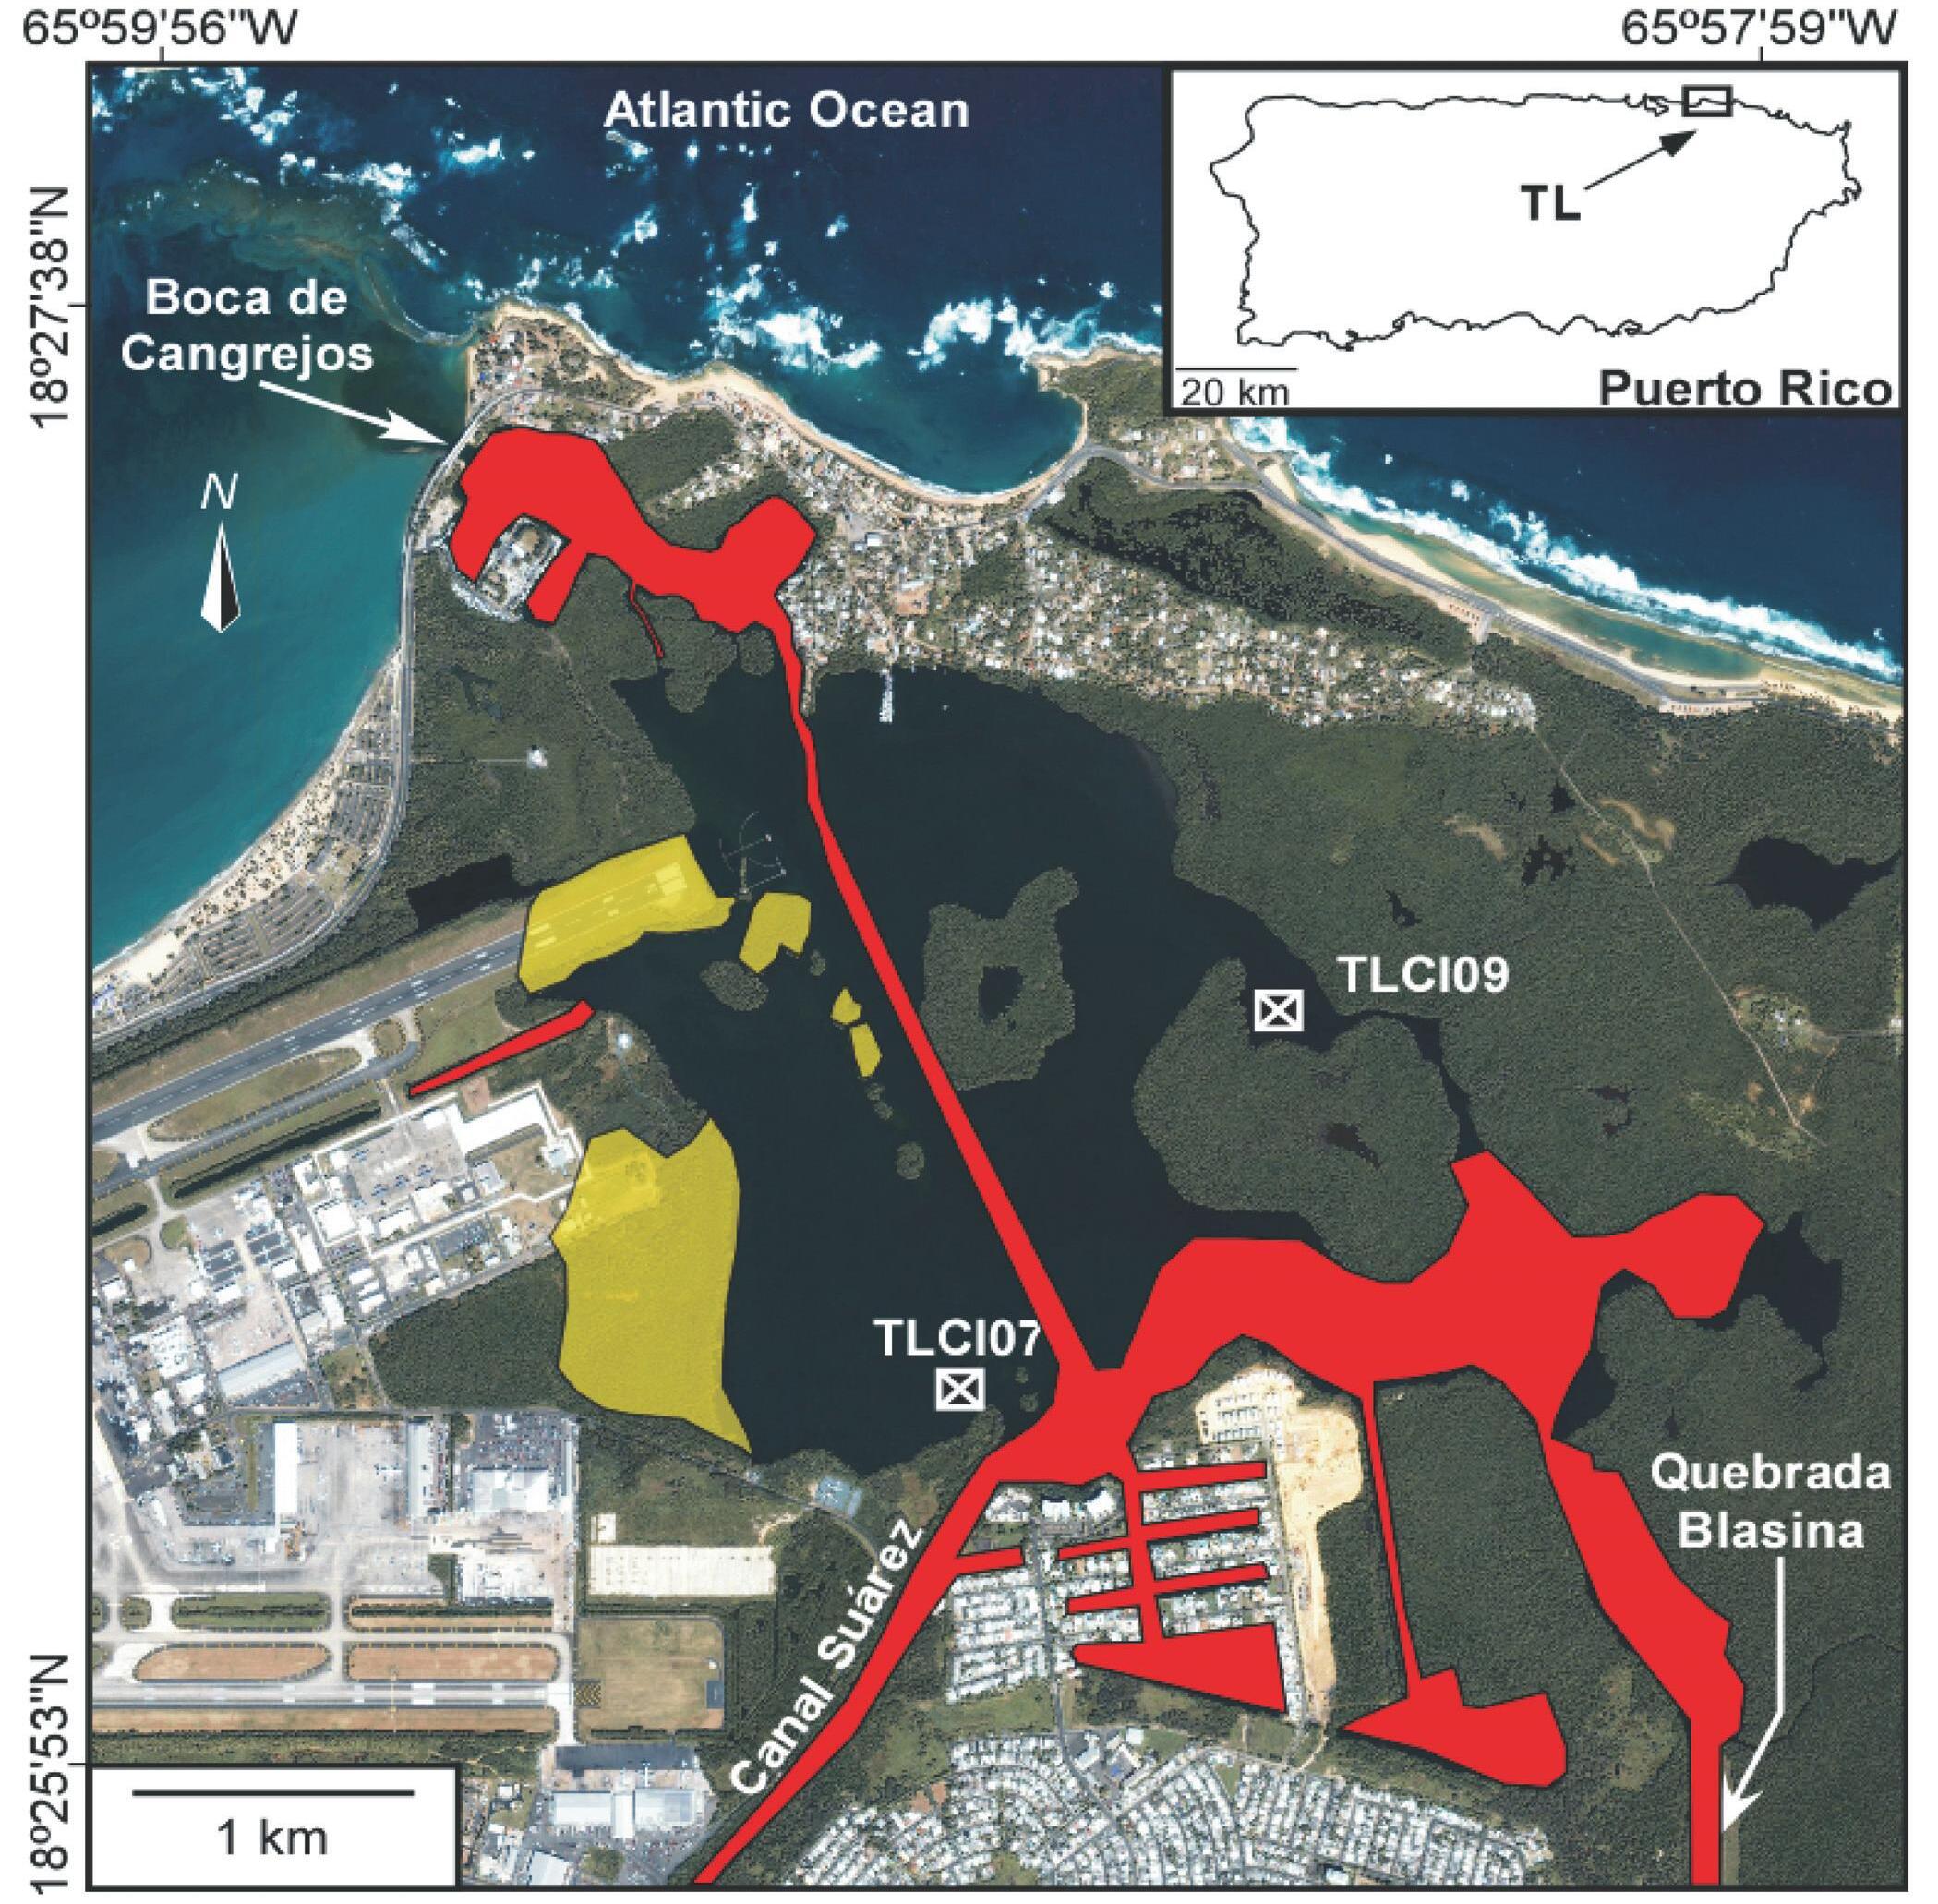
CoresitesinTorrecillasLagoon(TL):TLCI07andTLCI09.Insert:blackarrowpointstostudyareaontheislandofPuertoRico. Red:dredging.Fadedyellow:dredgespoilfill(fromEllis,1976).AdaptedfromMartínez-Colónetal.(2018).
benthicforaminiferalassemblageshavebeenusedaspollution bioindicators(Martínez-Colónetal.2009;Schönfeldetal. 2012;SenGupta2013).Benthicforaminifersaresensitiveto spatial/temporalenvironmentalchangesandtheirrelatively rapidresponsesmakethemexcellentsentinelorganismsofpollution(e.g.,Alve1995;Martínez-Colónetal.2009).Forexampletestdeformitiesareabiologicalresponsetostress.These deformitiescanbeattributedtotheincorporationofCu+2 and otherPTEsduringbiomineralizationbypotentiallychanging
thecrystallinestructureofCaCO3 (calcite)intootherformsof themineral(e.g.,malachite).Moreover,benthicforaminifers, withinherentlyhighsurface-to-volumeratios,arepotentially susceptibletoPTEexposureassociatedwithcontaminatedsedimentsandporewaters.
Changesintemperature,salinity,DO(dissolvedoxygen),pH, sedimentinput,dissolvednutrientsandorganiccarbonsources, andothernaturalandanthropogenicparametersinfluence
TEXT-FIGURE2
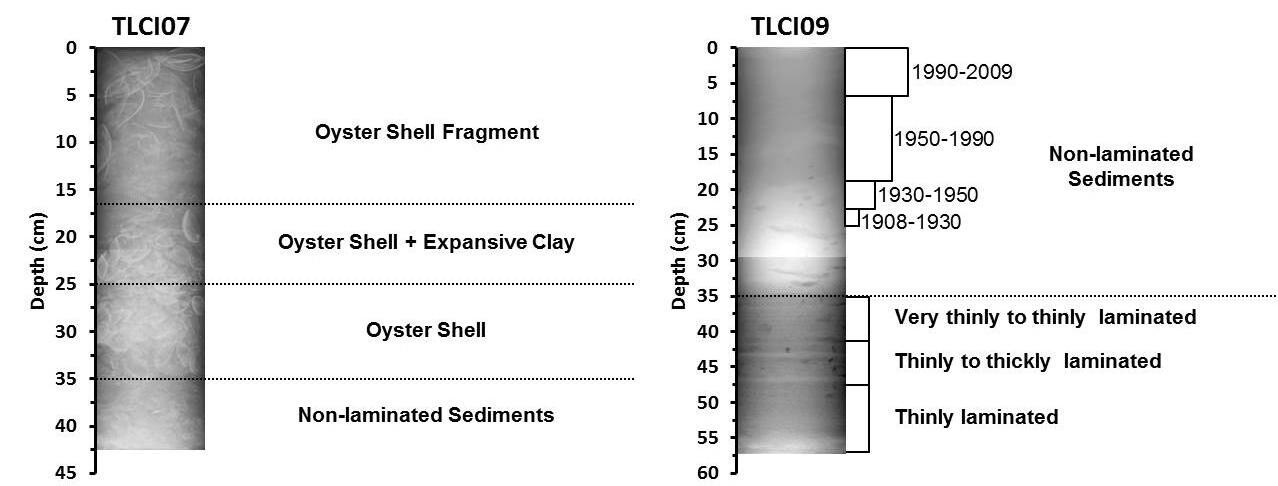
Compositex-rayradiographsofcoresTLCI07andTLCI09.
foraminiferalassemblages(e.g.,Martínez-Colónetal.2009; Mateu-Vicensetal.2014;Yankoetal.2017).InestuarineenvironmentsinPuertoRico,benthicforaminiferswerefirstusedas bioindicatorsofpollutionbySeiglie(1968,1971,1974).InTL onlythreestudieshavepreviouslyassessedforaminiferalassemblagedistributionsandthedominanceof Ammoniabecarii and Quinqueloculinarhodiensis andtheirdeformitiesasresponsesignalsofexcessorganicmatterandPTEpollutioncoupledwithsub-toanoxicconditions(Seiglie1975b; Martínez-ColónandHallock2010;Martínez-Colónetal. 2018).
ThisresearchinvestigatedtheuseofbenthicforaminiferalassemblagesasbioindicatorsofPTEpollutioncomingfromsedimentcorescollectedinTL. Theobjectivesweretodetermine the distributionandbioavailabilityofPTEsinthecorestoassesstheirinfluenceonthetemporaldistributionsofbenthic foraminifers.
METHODOLOGY
Location
TheSJBE(SanJuanBayEstuary)system,thelargestestuaryin PuertoRico,comprises~240km2 ofland(drainagebasin),of which25km2 aresubmerged(WebbandGómez-Gómez1998). TheSJBEsystemconsistsofsemi-enclosedbays,lagoons,and naturalanddredgedchannels(Martínez-Colónetal.2018). WithintheeasternsubtidalportionoftheSJBEsystem (text-fig.1),TLhasanaveragedepthof2.4mandisinfluenced bysourcesofnormalmarine,fresh,andbrackishwaters (Gómez-Gómezetal.1983).
Thesemidiurnaltidal rangeofTLisapproximately0.60m (Bunchetal.2000). Thetidalregimehasbeenimpactedby dredgingactivities,resultinginincreased residencetimesand increasedvolumeof110%comparedtopre-dredgingconditions(Ellis1976).InseveralareasinTL,anoxicconditions (>3.5mwaterdepth),awell-definedhalocline(1–2m)and thermocline(0–6m),andwaterscorrosivetoCaCO3 (>5m; pH<7.4)havebeendocumented(Martínez-Colónetal.2018).
Thesestratificationsareattributedtodisruptionofcirculation bydredging(Ellis1976;Martínez-Colónetal.2018),whichimpedesmixinganddiffusionofoxygen,allowingslightlydeeper areastoserveas“nutrienttraps”(Ellis1976).Theaveragesurface-watersalinity(27PSU),pH(7.9),temperature(32°C),and DO(6.9mg/L)wererecordedatthetimeofsurface-sediment samplingdescribebyMartínez-Colónetal.(2018).Highestsalinity(35PSU)wasrecordedintheNEsector,whilethelowest DO(0.6mg/L)valueswerefoundtowardstheSEsectionofthe lagoon.
FieldSampling
Sedimentpushcores(43–57cm)werecollectedduringsamplingtripsinJune2007(TLCI07:18°26’22”N,65°58’59”W; 1.4mwaterdepth)andJune2009(TLCI09:18°26’52”N, 65°58’35”W;12mwaterdepth)(text-fig.1).Acid-washed polycarbonatecoreliners(10cmdiameter)wereusedtocollect sedimentcores.Tominimizepotentialdisturbancesofsedimentswithinthecorebarrel,excesstubingwithoutsediment wasremoved.Thetopofthecorewascappedascloseaspossibletothesedimentsurface.Withinthreehoursaftercollection, coreswerefrozenat-4°C.AYSI-probewasusedtodetermine insituwatercolumntemperature(°C),pH,salinity,andDO (mg/L)profilesduringfieldsampling.
LaboratorySamplePreparation
SedimentSamples
FrozencoreswereX-rayedtoidentifysedimentstratification, structure,andpotentialbioturbation.Thecoreswheresubsequentlythawed,extruded,placedintoacid-washed(10%HCl solution)plasticNalgene© containers,frozen,andsubsequently freezedriedandsubsampled.Thefollowinganalyseswereconductedonallsubsamples:grainsize,TOC(percenttotalorganic carbon),CO3 (percentcarbonatecontent),bulksedimentPTE concentrations,andbioavailablePTEconcentrationsinthemud fraction.Inthisstudy,whatisreportedas“bioavailable” (F2Tess-Cu,F2Tess-Zn,F2 Tess-Fe)wastheF2Tess-CO3 fraction basedonoperational“bioavailability”anddefinedasthesecond
TEXT-FIGURE3
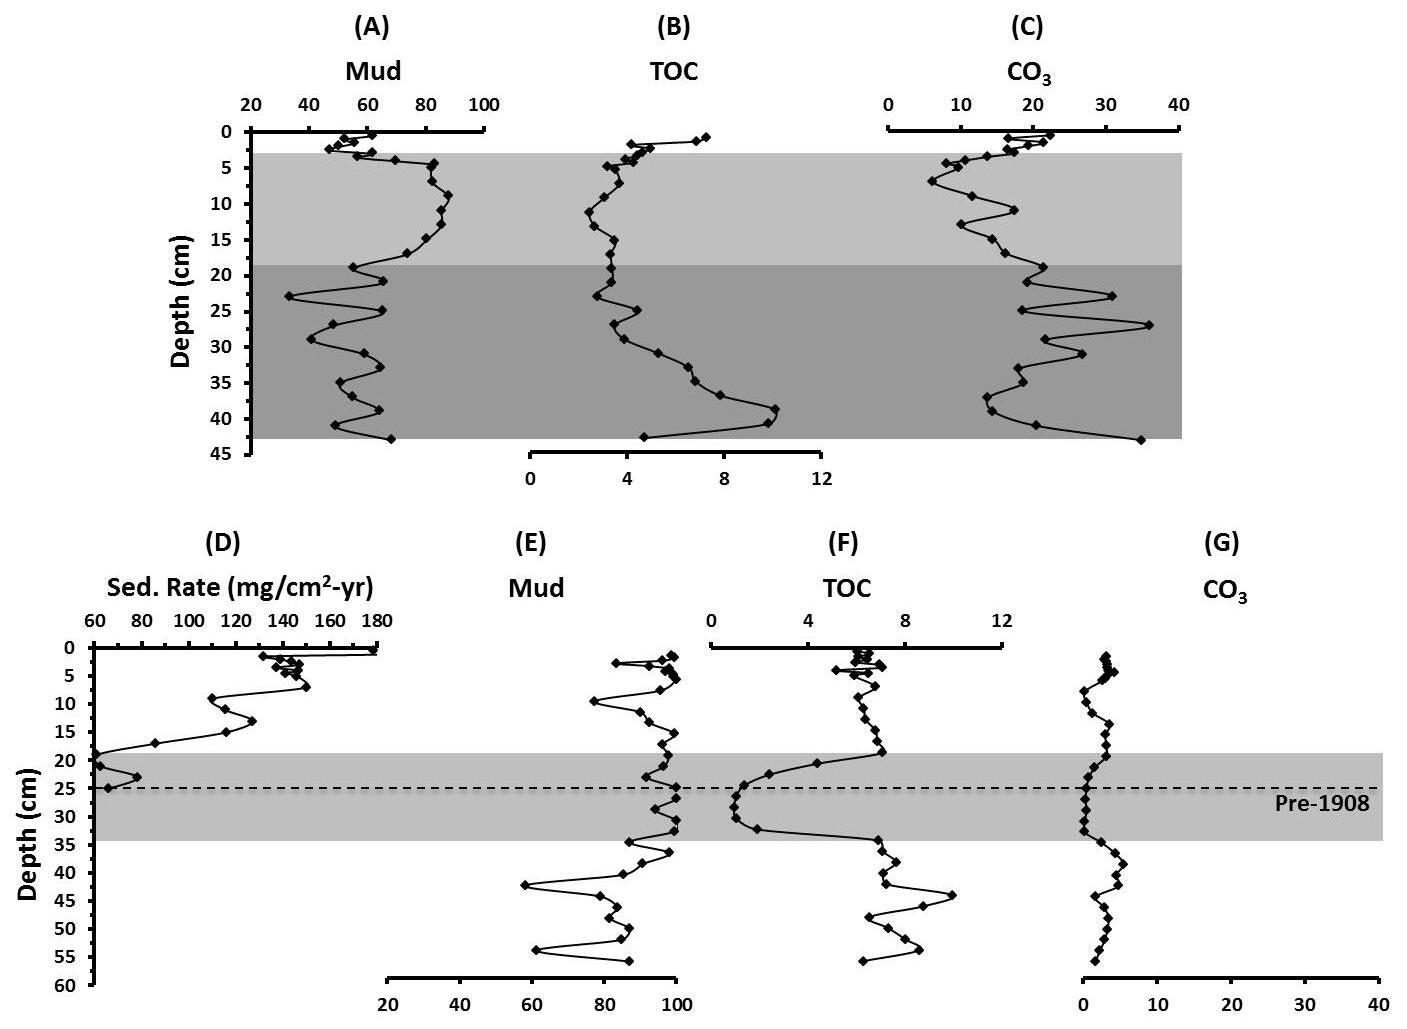
VerticaldistributionsofMud(percentmud),TOC(percenttotalorganiccarbon),andCO3 (percentcarbonate)incoresTLCI07 (A–C)andTLCI09(D–G).Lightgraybar:higherterrigenousinfluence.Darkgraybar:anoxicconditions.
mostbioavailablefractionbyTessieretal.(1979).Forsedimentationratesanddating,samplingresolutionwas0.5cmforthe first5cm(Pb/Csdating)and2cmintervalsthereafter.
Grainsize,TOC,CO3,bulkandbioavailablePTEconcentrationswereanalyzedfollowingtheprotocolsdescribedindetail inMartínez-Colónetal.(2018).Insummary,subsampleswere wetsievedovera63µmmesh(assessmud-sizesedimentsby weighdifference)anddriedfollowedbystandardsievingfor grainsizeanalysis.Unitsareexpressedinphi(Ö).ForTOCand CO3,subsampleswereanalyzedbytitrationusingaUICCarbonCoulometer.ForbulkPTEanalyses,subsamplesweresent toACTLABSLaboratoriesInc.(www.actlabs.com)inCanada forpreparationandgeochemicalanalysis(ICP-MS)ofCu,Zn, Ni,Pb,As,Li,Se,Fe,Mn,V,Re,andAl.Fortheacid-soluble concentrationsofF2Tess-Cu,F2Tess-Zn,andF2Tess-Fe, subsampleswereanalyzedbyAtomicAbsorptionSpectroscopy.
Radiometricdatingwasachievedbymeasuring 210 Pbvia gammaspectrometryandapplyingtheCRS(ConstantRateof
Supply)modelwhichtakesintoaccountexcess 210Pbandsedimentmassfromeachintervaltodeterminemassaccumulation ratesandages(Appleby2001).Thismodelisidealinshallow systemssuchasTLwhere 210Pb-supplyisdominatedbyatmosphericinput(Appleby2001).Foradetailedaccountoftheproceduresandinstrumentsusedforsamplepreparationand gammacounting,seeBreithauptetal.(2014)andSmoaketal. (2013).
ForaminiferalSamples
Subsamplesofsedimentwereanalyzedfortotalforaminiferal assemblagesfollowingtheprotocolsdescribedinMartínezColónetal.(2018).Freeze-driedsedimentsubsamples(sedimentmassrange3.0–4.6g[TLCI07];2.7–10.6g[TLCI09]) werewetsieved(63µmmesh)toremoveclayparticlesandthen driedat50oC.Wellpreservedforaminiferaltestswerepicked until160–300individualswerecounted.SpecimenswereidentifiedusingthegenerictaxonomyestablishedbyLoeblichand Tappan(1987)andtospecieslevelwhenpossible,following Poag(1981)andSeiglie(1971,1975a,b).Therelativeabundancesofthedominantspeciesassemblagewerecalculatedas
TABLE1
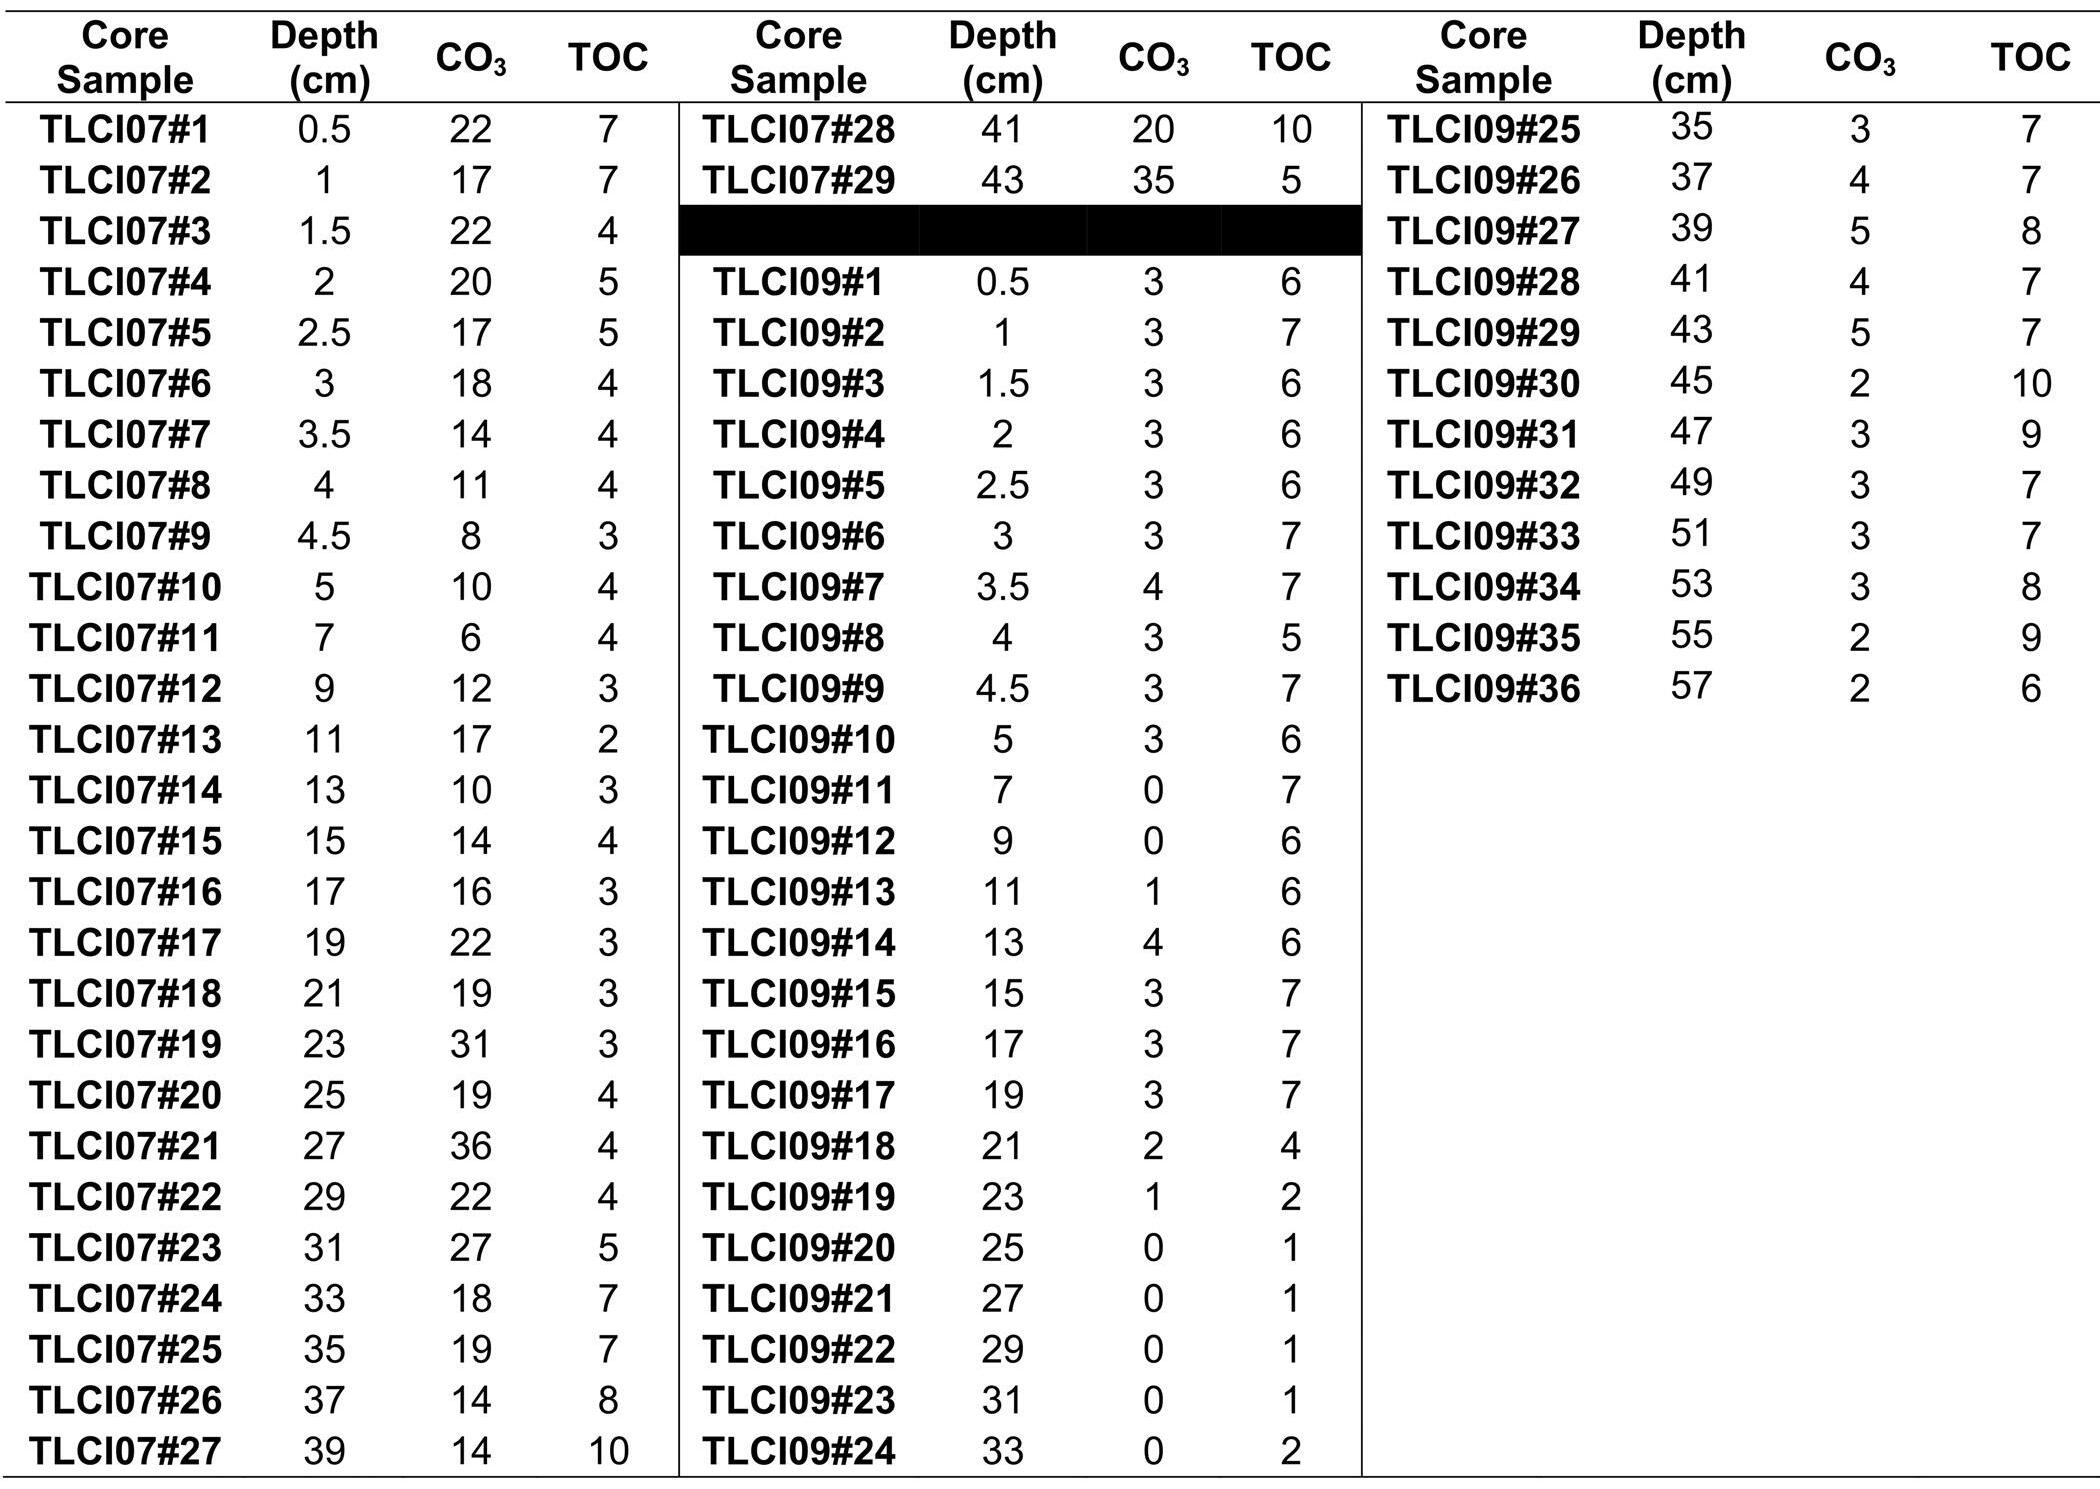
Depth,percentCO3 (carbonate)andTOC(percenttotalorganiccarbon)forallsamples.
thenumberoftestsofeachspeciesdividedbythetotalnumber ofspecimensinthesubsample(ARA- Ammoniabeccarii; QRA- Quinqueloculinarhodiensis;AmRA- Ammobaculites agglutinans;andQsRA- Quinqueloculinaseminula).Absolute abundancesforallthespeciesrefertonumberoftestspergram foundinasubsample.
DataAnalysis
Fordiversityindicesandstatisticaltools,theprotocolsdescribedbyMartínez-Colónetal.(2018)wereimplemented.In summary,theparametersassessedinclude:(1)S(Speciesrichness);(2)FD(ForaminiferalDensity);(3)H(S)(ShannonIndex);(4)E(EquitabilityIndex);and(5)DF(Deformed Foraminifers).Hierarchicalclusteranalysiswasperformedon foraminiferaldata,afteradjustmentsfordistributionandtransformations(fourth-root)todetermineecologicalassemblages asdescribedinMartínez-Colónetal.(2018).
ThePTEdatawereassessedfollowingtheprotocolsof Acevedo-Figueroaetal.(2006)forEF(enrichmentfactor):
EF=([M]i /[E] i)sediment /([M]r /[E] r)earth’scrust
WhereMi isthePTEconcentrationandEistheconcentrationof thenormalizingelement(Al)insediment;Mr andEr arethePTE andnormalizingelement(Al)concentrationsintheEarth’s crust.AlthoughAbrahimandParker(2008)demonstratedthe utilityofusingthepre-industrialconcentrationsofthenormalizingelementfromthestudiedarea,ourtemporaldatainboth coreswerenotsufficientlycleartoassignalocalbaselineof pre-industrialvaluesforAl.Forthisreason,thePTEswerenormalizedfortheaverageAlconcentrationfoundinshales,which areconsideredaworld-widestandardreferenceguideforunpollutedsediments(Ekengeleetal.2008).
TheEFindexdeterminestherelativeincorporationofPTEsinto thesediments.Valuescalculatedrepresentthenumberoftimes theconcentrationofthePTEisabovebackgroundlevel (Green-Ruízetal.2005).ValuesofEF<1show“noenrichment”;1–3“minorenrichment”;3–5“moderateenrichment”; 5–10“moderatesevereenrichment”;10–25“severeenrichment”;25–50“verysevereenrichment;and>50“extremelysevereenrichment”(Acevedo-Figueróaetal.2006).
PearsoncorrelationanalysiswasperformedusingPRIMER© (v. 6)statisticalsoftware(ClarkeandGorley2006)todetermineif anysignificanttrendswerefoundbasedonlog-transformed data(ParkerandArnold1999).Pearsoncorrelationanalysesincludedmud,TOC,andCO3 ,bulkPTEconcentration,
F2Tess-bioavailablecopper(F2Tess-Cu),zinc(F2Tess-Zn),and iron(F2Tess-Fe)concentrations,foraminiferalspeciesabsolute andrelativeabundances,S,FD,H(S),E,andDF.
RESULTS
CoreDescription
CoreTLCI07,withamaximumlengthof43cm,wascollected atawaterdepthof0.65m.Aradiographimageofthecorerevealedfourdistinctivesedimentary“units”(text-fig.2).The lowerfacies,whichrepresentanoxicconditions,andconsistsof threeunits:Unit1,observedbetween43–35cm,consistedof non-laminatedsediments;Unit2isanoyster-shelllayerbetween35–25cmdepth;andUnit3consistedofalayerofoyster shellfragmentsinplasticclayatthe25–19cmdepthinterval. Theupperfacies,whichrepresentoxicconditions,consistsof Unit4whichisalayerofshellfragmentsmixedwithmudbetween19–0.5cm.
Percentmudfluctuatedbetween33–68%between43–19cm depth(text-fig.3a).From19cmupward,aconsistentincrease wasobserved,peakingat86%at9cmdepth,decreasingto47% abovethatmaximum.ThehighestTOCwas10.1%at39cm (Table1),decreasingfour-foldfromcore-basetocore-top (text-fig.3b).TheCO3 fractionvariedfrom6–36%(Table1), withhighestpercentagesinthelowerfacieswhereoystershell fragmentswerevisuallydominant(text-fig.2),withlowerpercentagesabove30cmdepthinthecore(text-fig.3c).
CoreTLCI09,withamaximumlengthof57cm,wascollected atawaterdepthof12m.Aradiographimageofthecore showedtwodistinctivesedimentary“units”.Thelowerfacies consistedoflaminatedsedimentsbetween53–33cm(Unit1). TheupperfaciesconsistofUnit2whichiscomprisedby non-laminatedsedimentsalthoughthiscouldbean overexposureartifactoftheradiographduetoexcessicethat maskedlaminations.BasedonPTE,TOC,andCO3 distributions,twodistinctintervalsareobservedbetween33–19cm(intermediate)and19–0.5cm(upper).
Allsamplesweremuddominated.Thevariabilitywasminimal (77–100%)throughmostofthecore(text-fig.3e).Below43 cm,mudwassomewhatmorevariable.TheTOCvaluesranged from1–10%(Table1)withvaluesaslowat1%inthe35–19cm depthinterval,andvaluesof~6%atboththecorebaseandcore top(text-fig.3f).TheCO3 wasconsistently<6%(Table1, text-fig.3g).
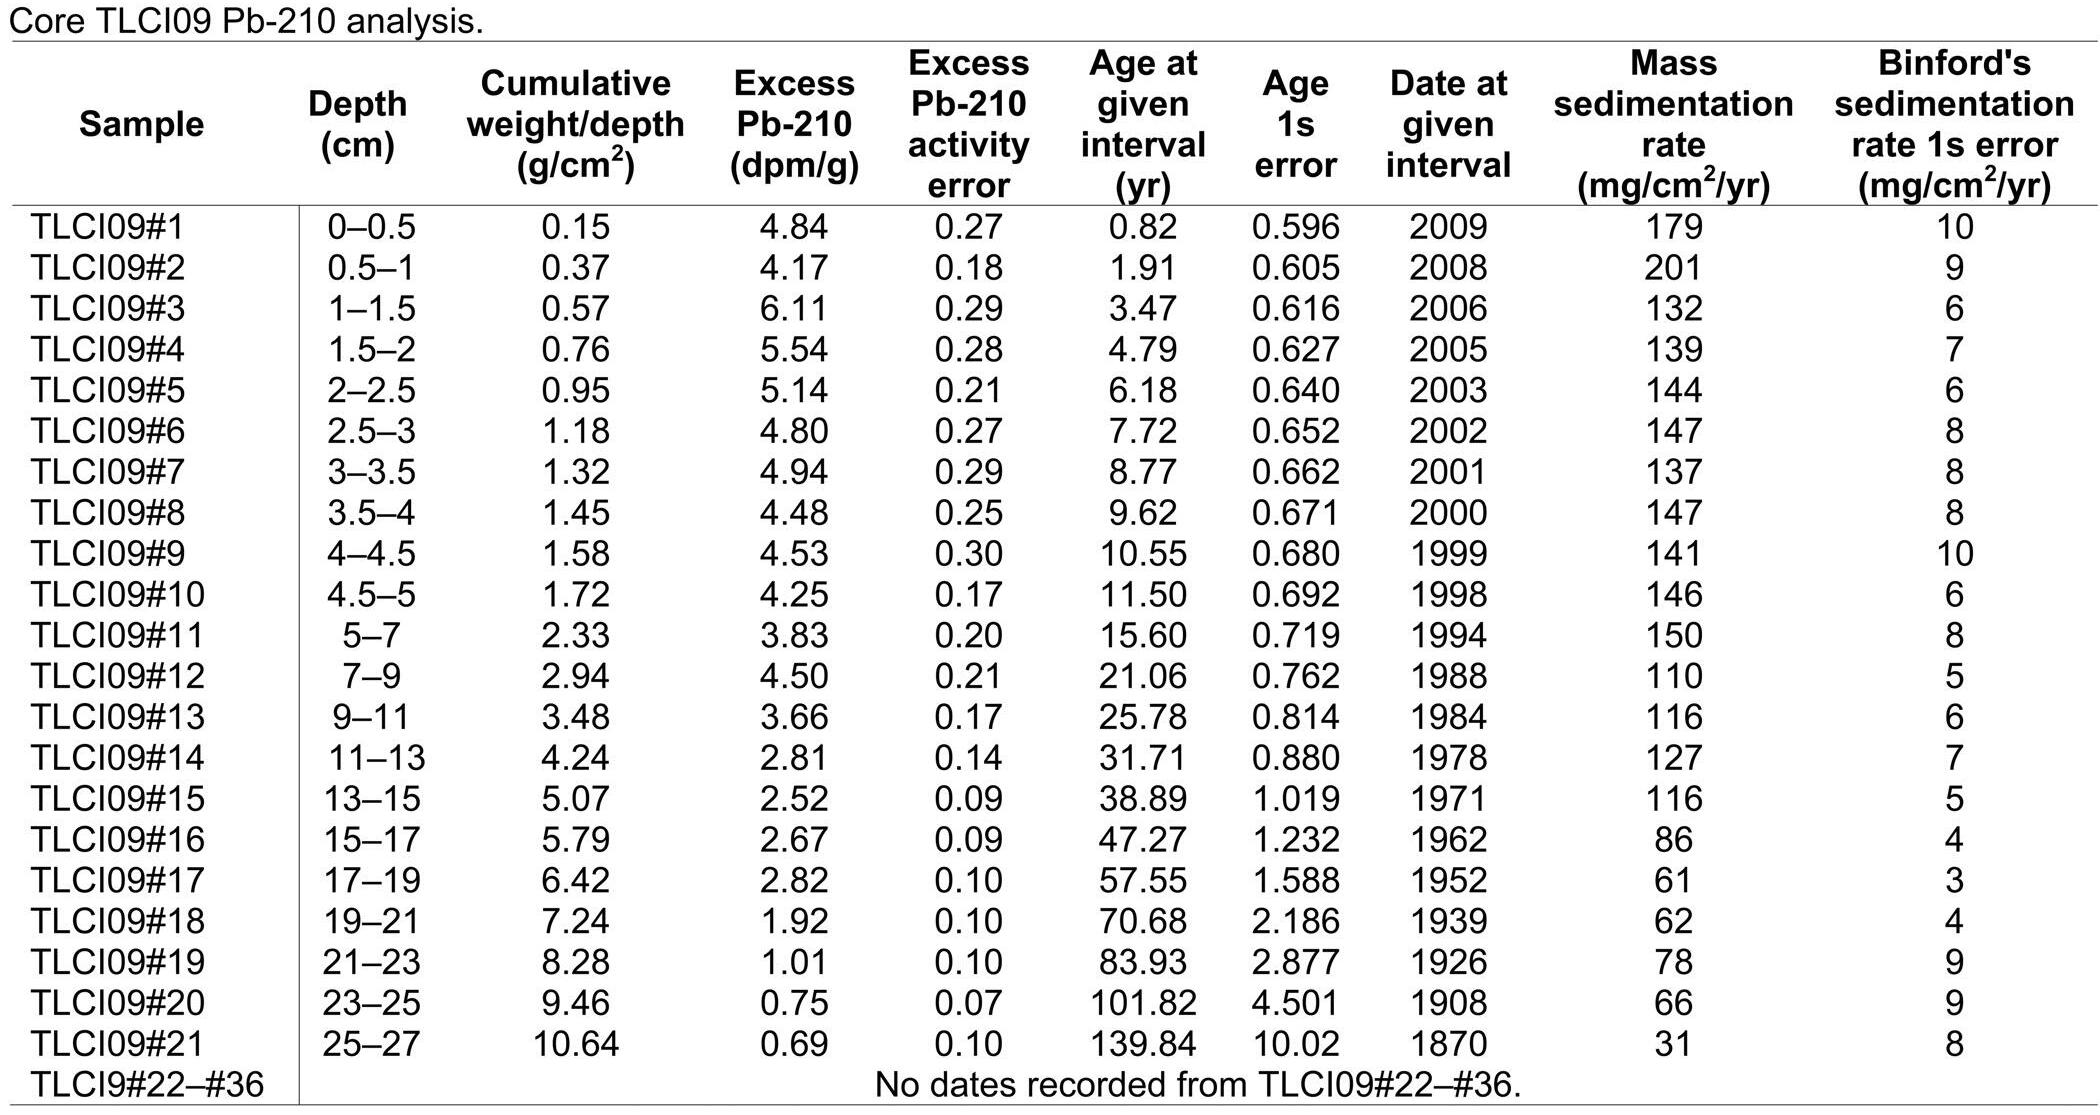
OnlyCoreTLCI09,sampledonMay22,2009,providedreliablesedimentationratesandages.Calibrateddatesforthecore rangedfrom2009(0–0.5cminterval)to1908(23–25cminterval),withaveragemass-sedimentationrateof124mg/cm2-yr (text-fig.3d).Duetopossiblebioturbation,noearlierageswere determined.Allrawdataandcalculateddatesarepresentedin AppendixA(supplementalmaterial).
PotentiallyToxicElementDistributioninSediments TwelvePTEswereassessedforbulkconcentrations.OnlyCu, Zn,andFewereconsideredforbioavailability,sinceCuandZn previouslyhavebeencorrelatedwithforaminiferalassemblage changesinfieldandculturestudies;Fewasselectedduetoits significanceasaredoxindicator.
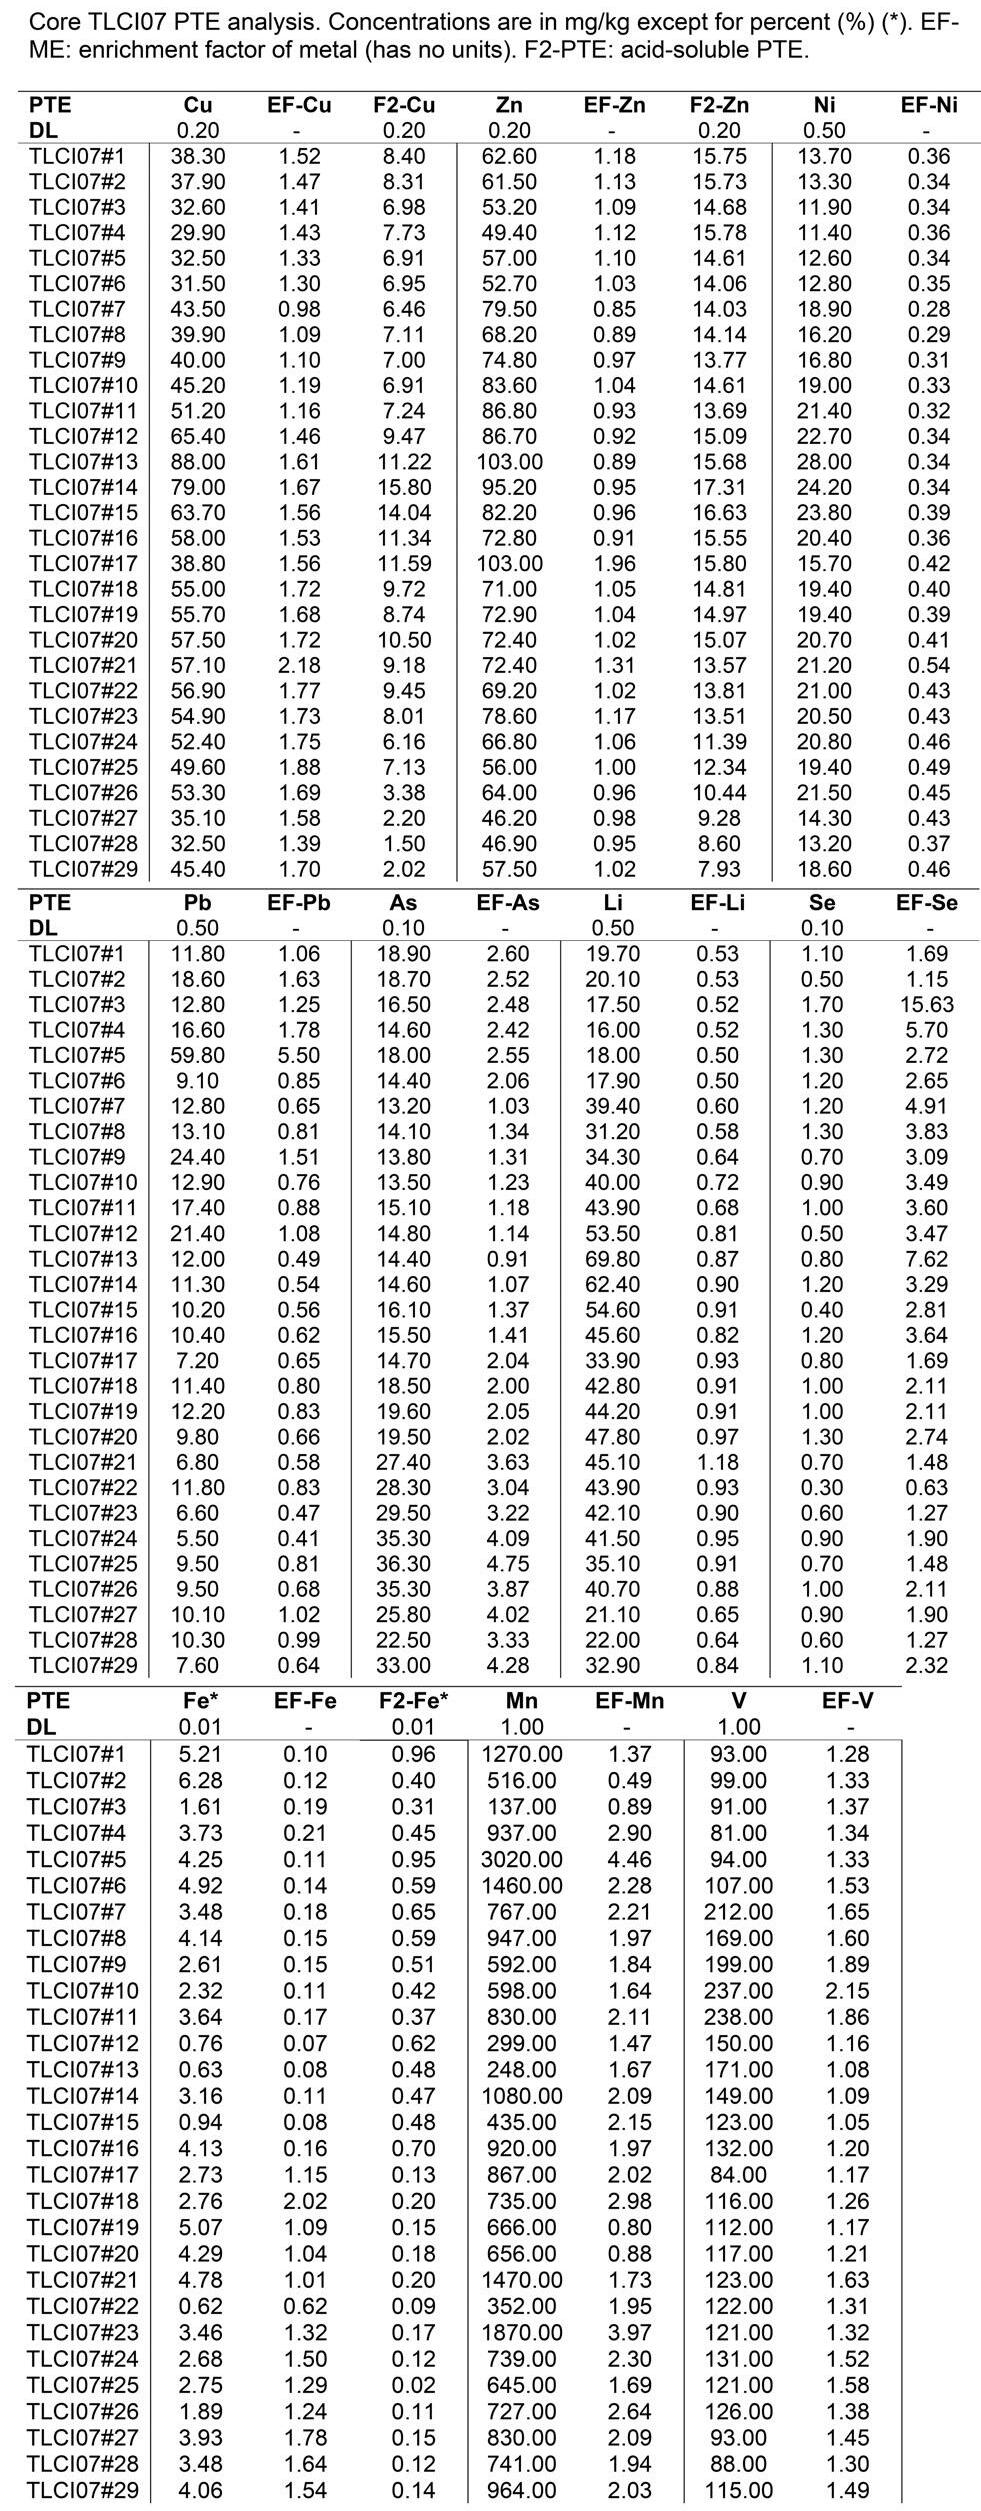
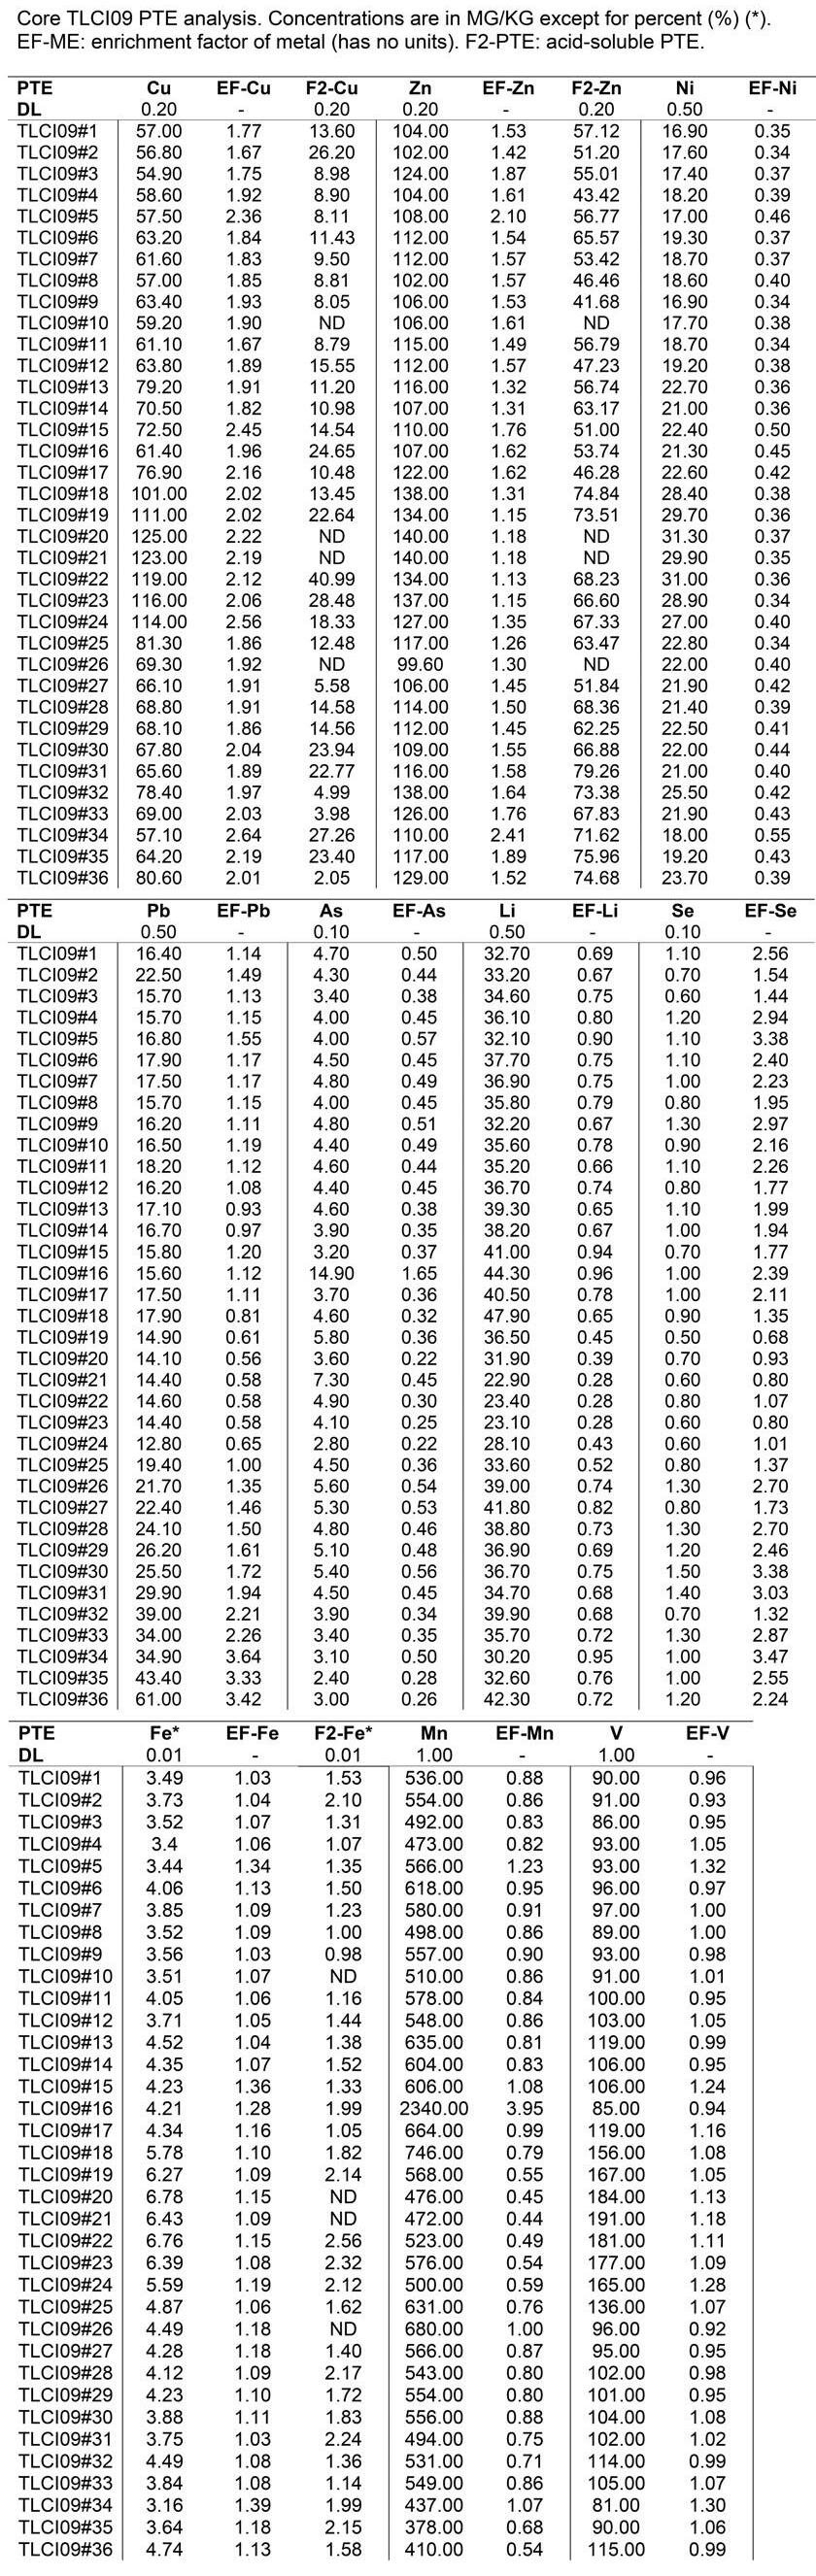
Rawdataforallcoresamples(TLCI07andTLCI09),including theirrespectiveEFandbioavailableconcentrations,arefound inAppendixB(supplementalmaterial).
TorrecillasLagoonCoreTLCI07
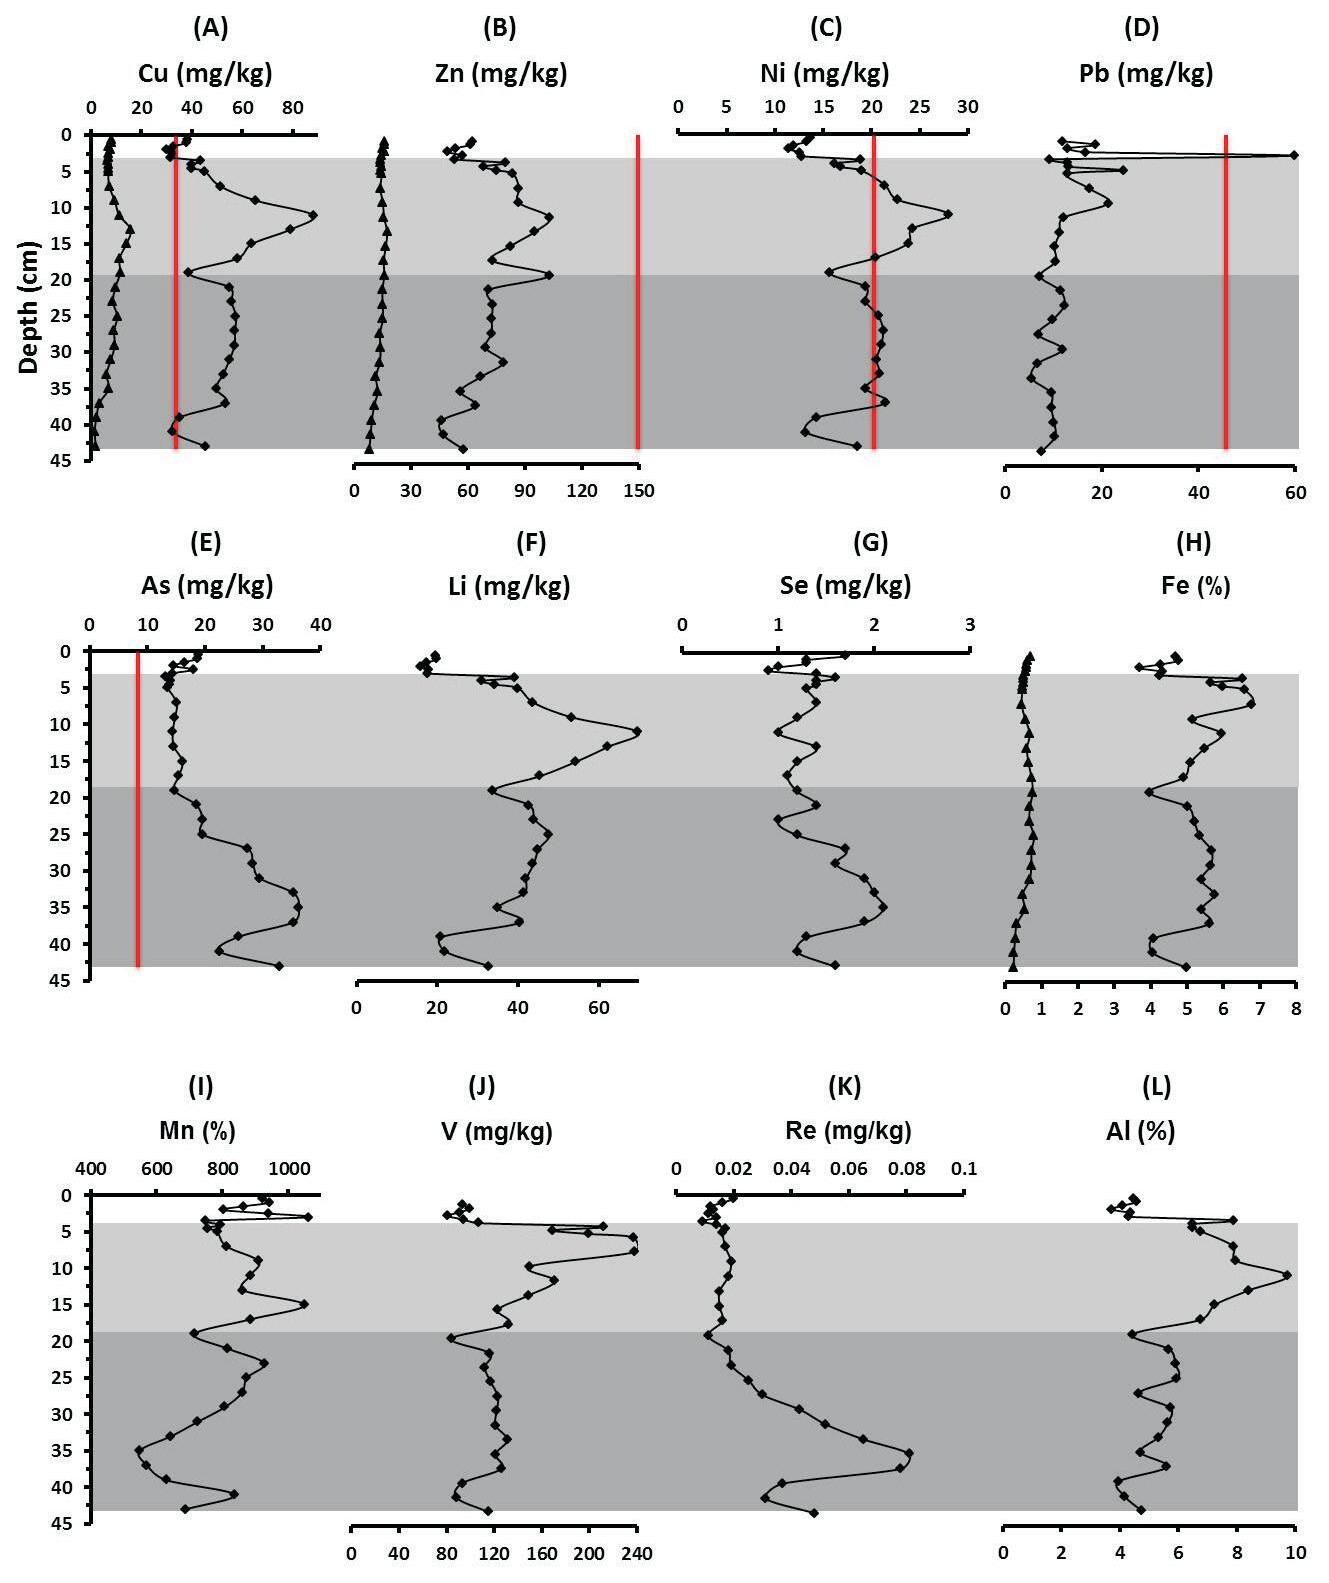
TemporaldistributionsofPTEsareshownintext-figure4.Copper,Zn,Ni,Pb,Li,FeandVallshowedpeaksinthe3–19cm coreinterval,consistentwiththehighestmudandAl(text-figs. 3aand4l).Othernoticeabletrendsincludeinthestratigraphic distributionofAs,SeandRe,withpeaksat~35cmdepth (text-figs.4e,4g,and4k),whichwereconsistentwithTOC (text-figs.3b).Manganesegenerallyincreasedfromcore-base tocore-top(text-fig.4i).
TheERL(Effectsrangelow)criteria,asdefinedbyLongetal. (1995),wereonlyavailableforCu(34–270ppm),Zn(150–410 ppm),Ni(20.9–51.6),Pb(46.7–218),andAs(8.2–70)(text-fig. 4).CopperandAswerebothconsistentlyabovetheERLconcentrations,ZnandPbwerebelow,andNiexceededthedefined ERLatitspeakinthe3–19cmdepthrange.
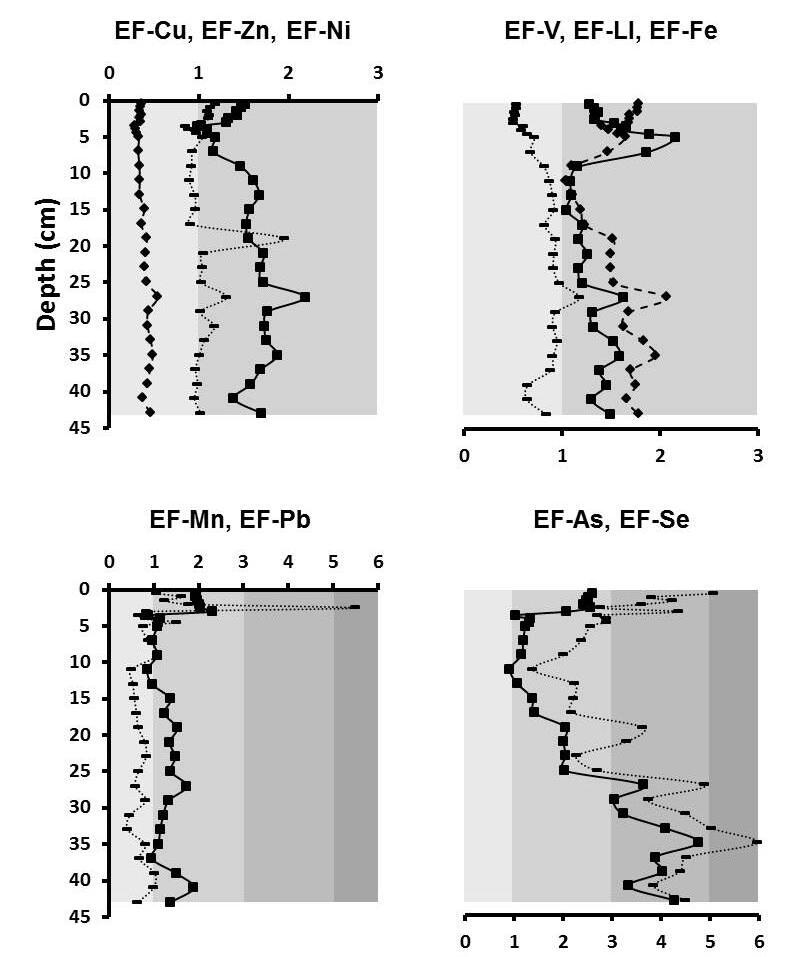
RelativetoEF,NiandLishow“noenrichment”whileother bulkPTEconcentrationsindicated“minorenrichment”ofCu, Zn,V,Fe,Mn(text-fig5).SeleniumandAsdecreasedupcore. Theirconcentrationrangefrom“moderate-severeenrichment” to“noenrichment”from43–11cm.Arapidincreasetowards “moderate-severeenrichment”and“minorenrichment”ofAs andSe,respectively(text-fig5)occurredfrom11–0.5cm.From core-basetocoretop,Pbdistributionreveal“noenrichment” exceptforaspiketo“moderate-severeenrichment”at2.5cm.
Aluminumconcentrationsrangefrom3.7–6%below19cm depthinthecore(text-fig.4l).Aconsistentupcoreincrease from19cmreachingamaximumvalueof9.7%atadepthof11 cmisobserved.Itsconcentrationdecreasesto3.7%atadepthof 3cm.TheconcentrationsofRerangefrom0.009–0.081mg/kg (text-fig.4k).TheoveralldistributiontrendofRethroughout thecore(base:0.05mg/kg;top:0.02mg/kg)wassimilartothat ofTOC,AsandSe,butoppositetoMnandV.Asaconservative elementintheoceans,Reconcentrationinsedimentsincreases whensequesteredbyorganicmaterial.Inthisstudy,Rewas usedasanindicatorofanoxicconditions.
Acid-solublefractionsofonlythreePTEswereassessedtoindicatebioavailability,andallrevealedsimilartemporaldistributions.TheF2Tess-CuandF2Tess-Znhada10-foldandtwo-fold increaseinconcentrationsrangingfrom1.50–15.8mg/kgand 7.93–17.31mg/kgrespectivelyfromcore-basetocore-top (text-fig.4aand4b).Bothacid-solubleandbioavailablePTEs reachedmaximumconcentrationsat13cmsimilartotheirbulk concentrationcounterparts.TheF2Tess-Ferangedinconcentrationsbetween0.23%(43cm)and0.79%(25cm)(text-fig.4h).
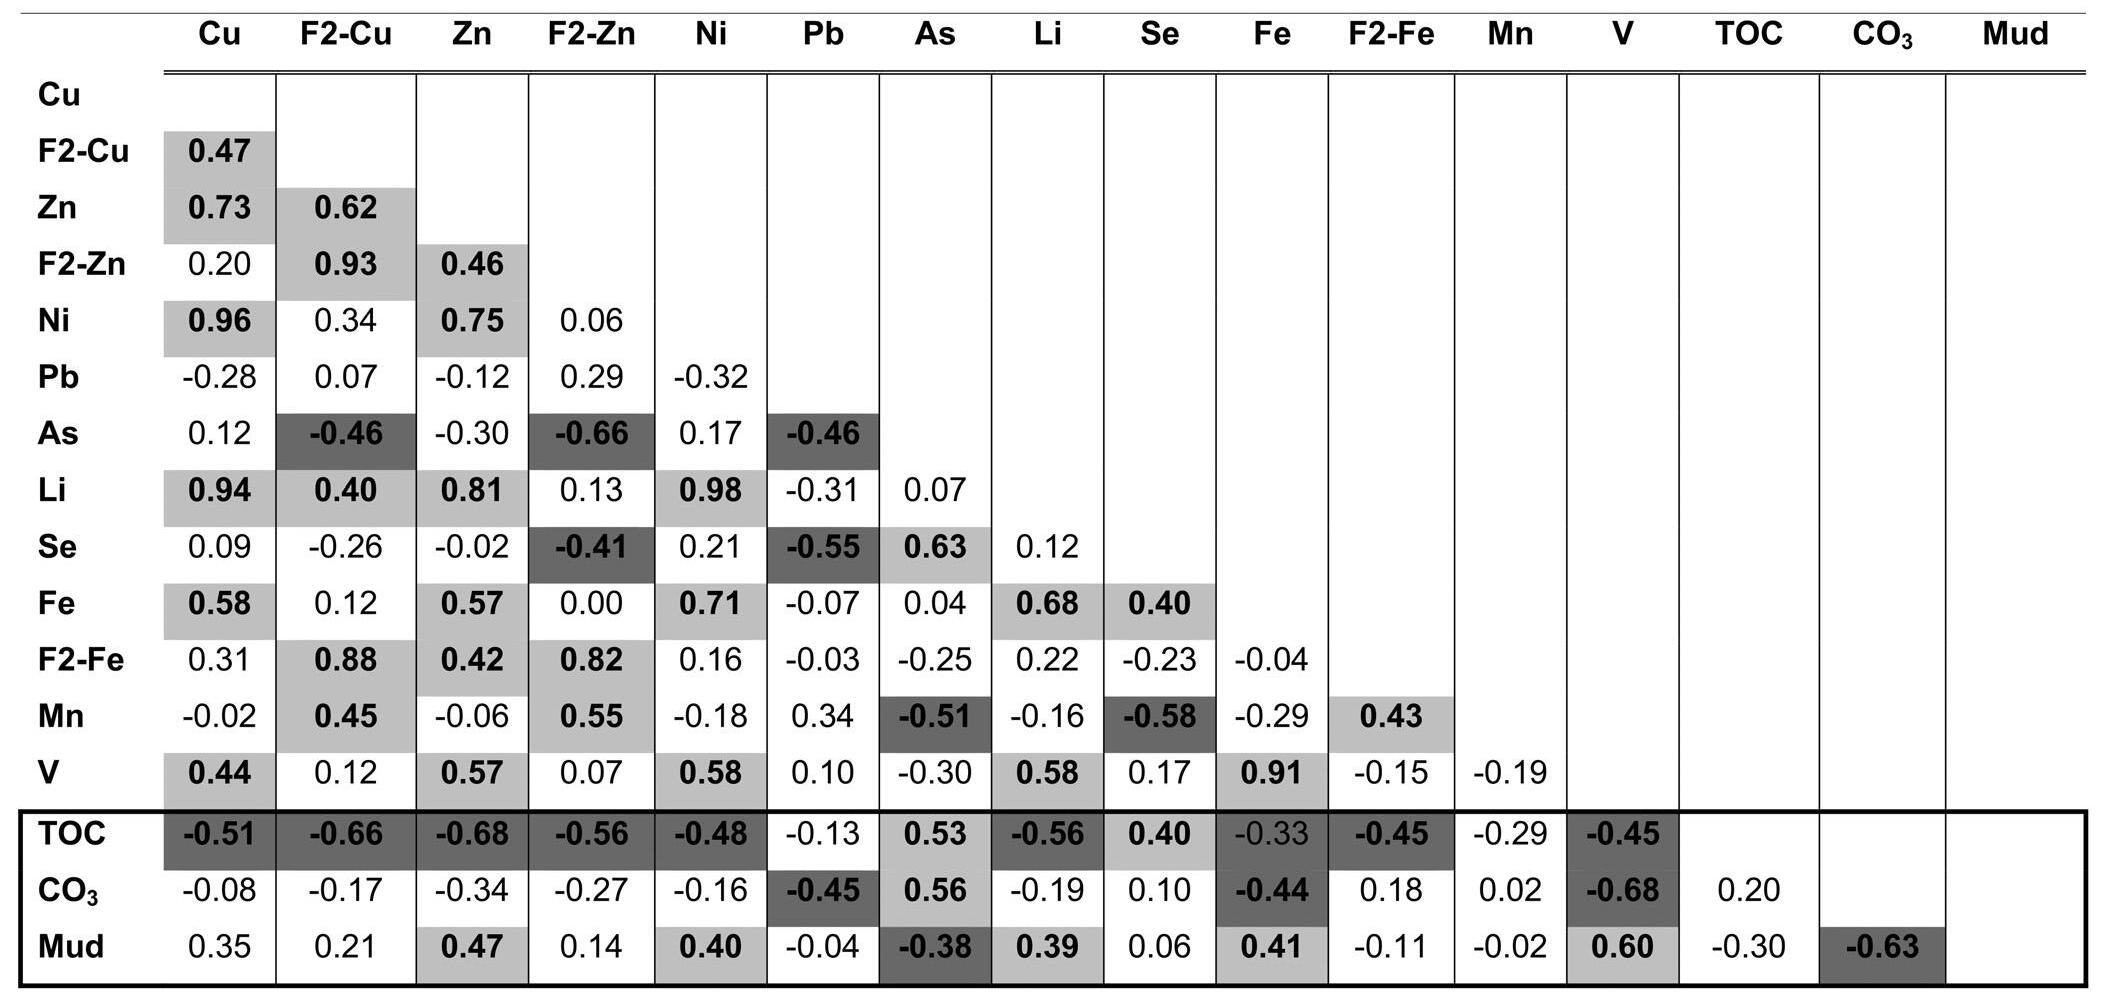
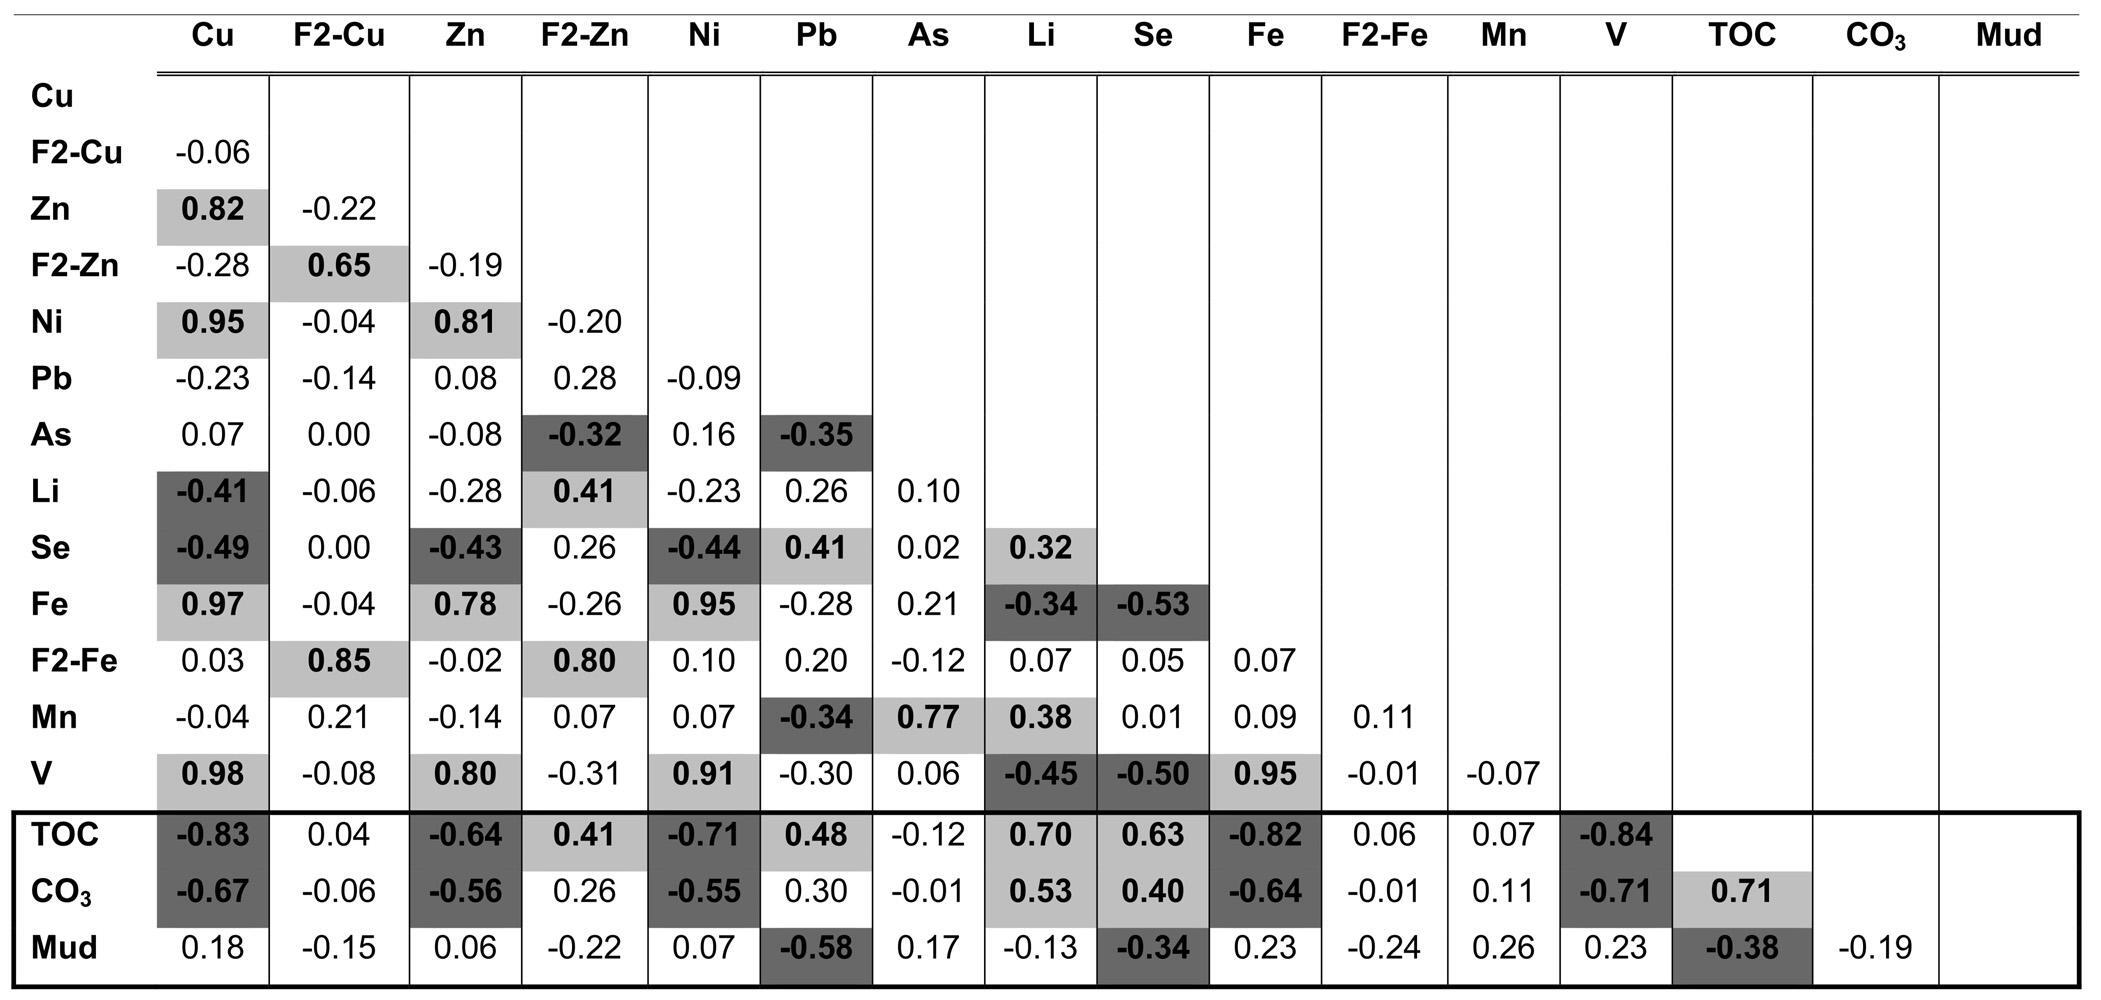
APearsoncorrelationmatrix(AppendixC,supplementalmaterial)wascalculatedforthe10PTEsofconcern,including acid-solublePTEfractions(F2Tess-Cu,F2Tess-Zn,F2 Tess-Fe), TOC,CO3 andmud.Zinc,Ni,Li,Fe,andVareallsignificantly correlatedwithmud.Copper withacorrelationcoefficientof 0.35,ascomparedto0.37at95%confidence,is alsoweakly correlatedwithmud.ArsenicistheonlyPTEthatshowsstrong negativecorrelationwithmud.MostPTEsexceptforAs,andSe arenegativelycorrelatedwithTOC.Noneoftheacid-soluble fractionscorrelatedwithCO3 ormud.CarbonatecontentcorrelatednegativelywithPb,FeandVandpositivelywithAs.
TEXT-FIGURE4
TemporaldistributionsofPTEsincoreTLCI07.Triangle:F2Tess-Cu,F2Tess-Zn,andF2Tess-Febioavailableconcentrations.Diamonds:bulkPTEconcentrations.Lightgraybar:intervalofhighersedimentation.Darkgraybar:intervalofanoxicconditions. Redline:ERL(Effectrangelow)valuesasdefinedbyLongetal.(1995).
TorrecillasLagoonCoreTLCI09
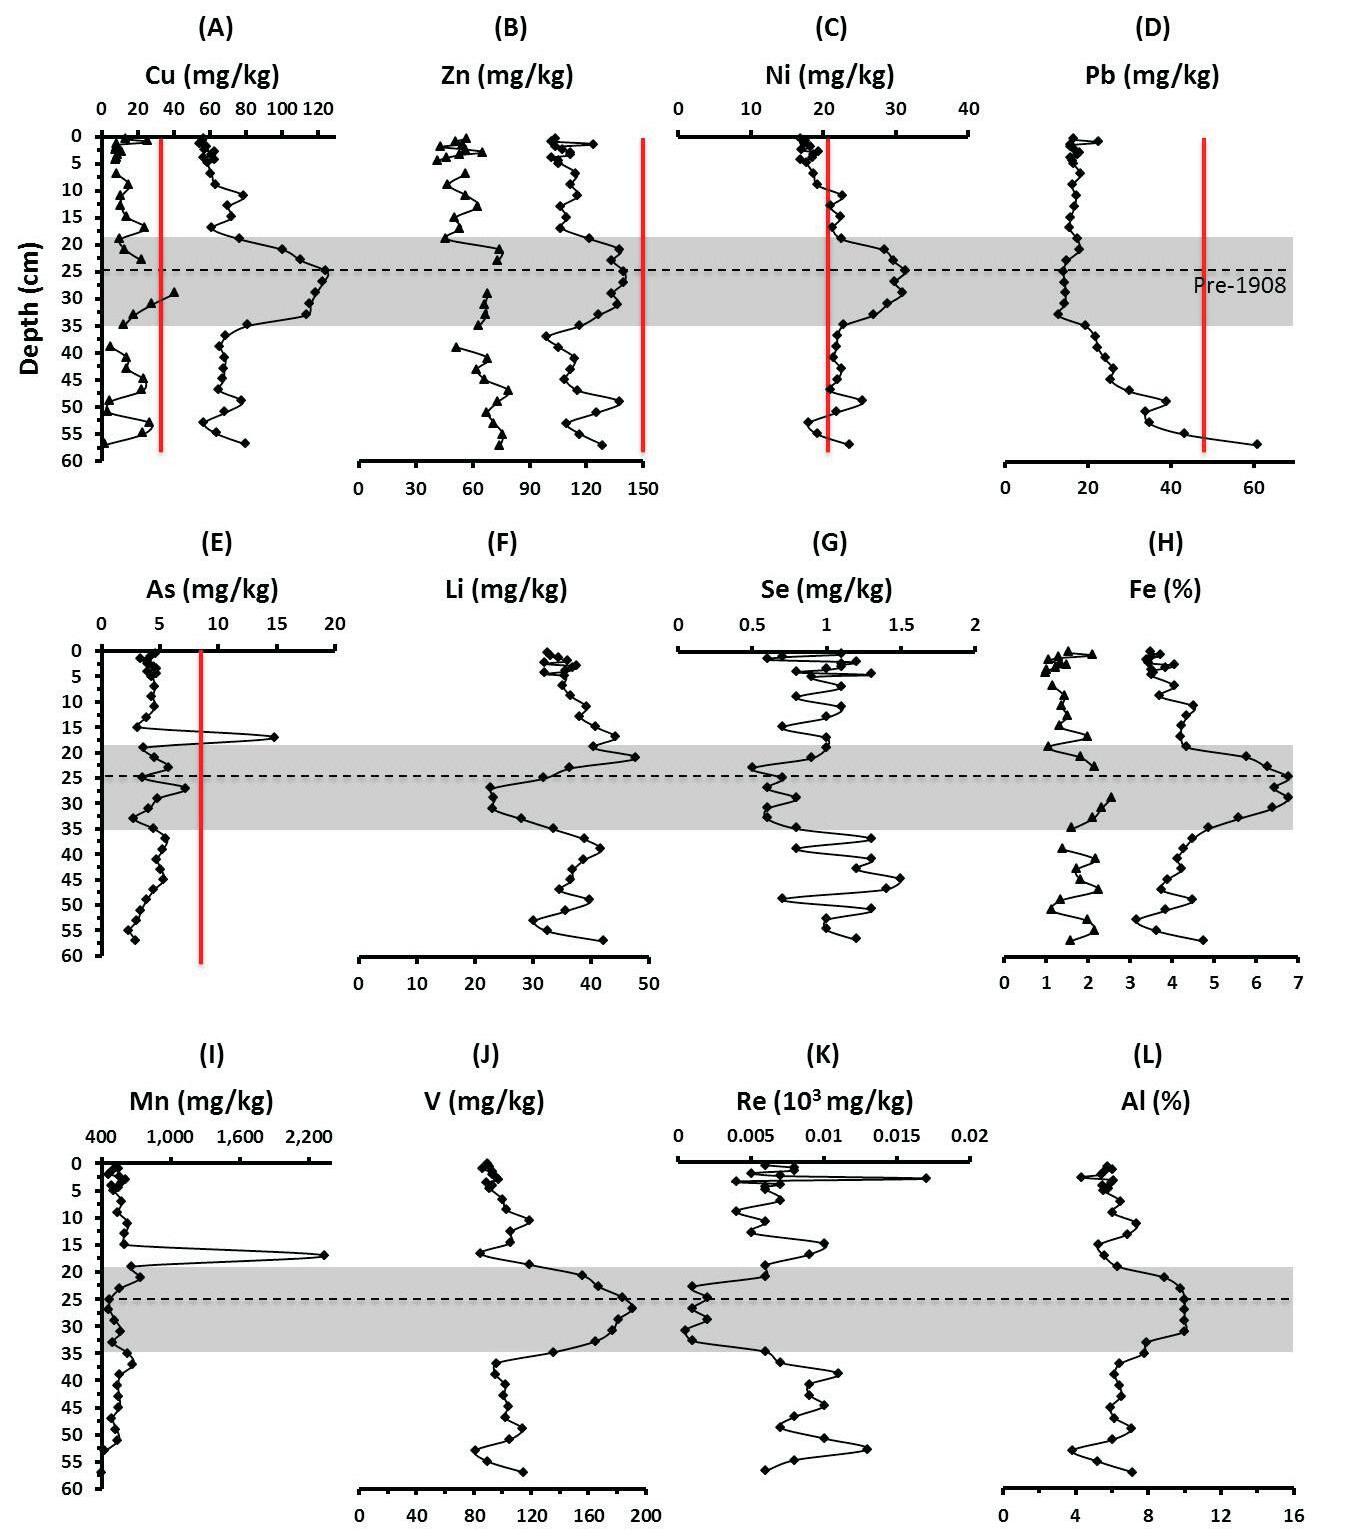
TemporaldistributionsofPTEsareshownintext-figure6.Copper,Zn,Ni,Fe,andV(text-figs.6a–c,6h,and6j)revealsimilar strongpeaksfrom~19–35cminterval,whichareconsistent withthelowestmudandhighestAlpercentages(3.84–10%) (text-figs.3e,6l).Lithium,Se,andRedeclinedatthesameinterval,asdidTOCandCO3 (text-figs.6f–g,6k,3f–g).Lead steadilydeclinedfromcore-baseto35cm,thenremainedconsistentlylowtothecore-topwhileAsandMnshowedno discernabletrendexceptfortheirhighestvaluesbeingat19cm depth(text-figs.6d–e,6i).
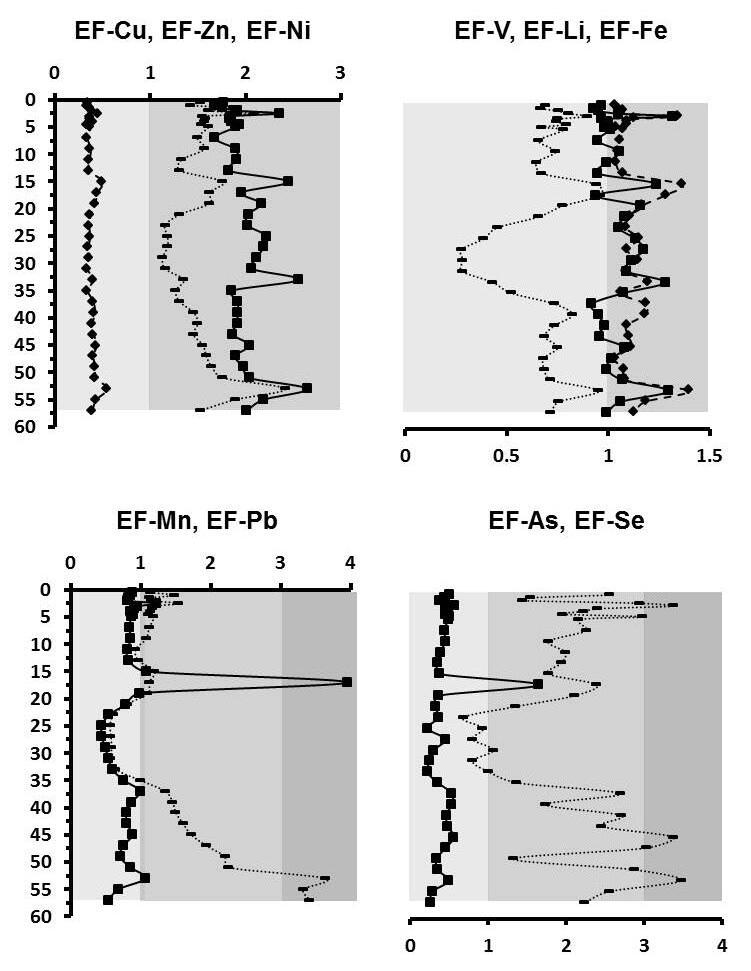
NickelexceededthedefinedERLconcentrationatitspeakin the19–35cmcoreinterval.RelativetoEF,theconcentrations ofNi,Li,Mn,Asshowed“noenrichment”whileCu,Zn,V,Fe, Seindicated“minorenrichment”(text-fig.7).Leaddecreased upcorefrom“moderateenrichment”to“minorenrichmentwith “noenrichment”at19–35cmdepth.
Aluminumconcentrationsrangefrom3.8–10%(text-fig.6l). Startingat35cmdepth,consistentincreasewithamaximum valueof10%at31–25cmdepthinterval,wasobservedfrom thebaseofthecoreatdepth35cm.Theconcentrationdecreasedtoaminimumof5.27%atadepthof15cm.TheRethe concentrationsrangefrom0.0005–0.0170mg/kg(text-fig.6k). AstrongdecreaseinconcentrationforReoccurredwithinthe 19–35cminterval,mimickingthepatternofTOC(text-fig.3f).
Thethreeacid-solublefractions(F2 Tess-Cu,F2Tess-Znand F2Tess-Fe)showedverysimilartemporaldistributionsresemblingthatofAl.TheF2Tess-Curangeinconcentrationsfrom 2–41mg/kg(text-fig.6a).TheF2Tess-ZnandF2Tess-Feconcentrationsrangefrom42–79mg/kgand1.05–2.56%respectively (text-fig.6b,6h).
APearsoncorrelationmatrix(AppendixD,supplementalmaterial)wascalculatedforthe10bulkPTEs,acid-solublefractions ofPTEs(F2Tess-Cu,F2Tess-Zn,F2Tess-Fe),TOC,CO3 andmud. NoPTEsignificantlycorrelatedwithmudatthe95%confidence.ExceptforanegativecorrelationwithPb,noneofthe PTEssignificantlycorrelatedwithmudatthe95%confidence intercal.Copper,Zn,Ni,Fe,andVnegativelycorrelatedwith TOCandCO3.Lead,LiandSepositivelycorrelatedwithTOC andLIandSewithCO3.F2Tess-Znwastheonlyacid-soluble bioavailablePTEfractionthatispositivelycorrelatedwith TOC.
ForaminiferalAssemblages
TorrecillasLagoonCoreTLCI07
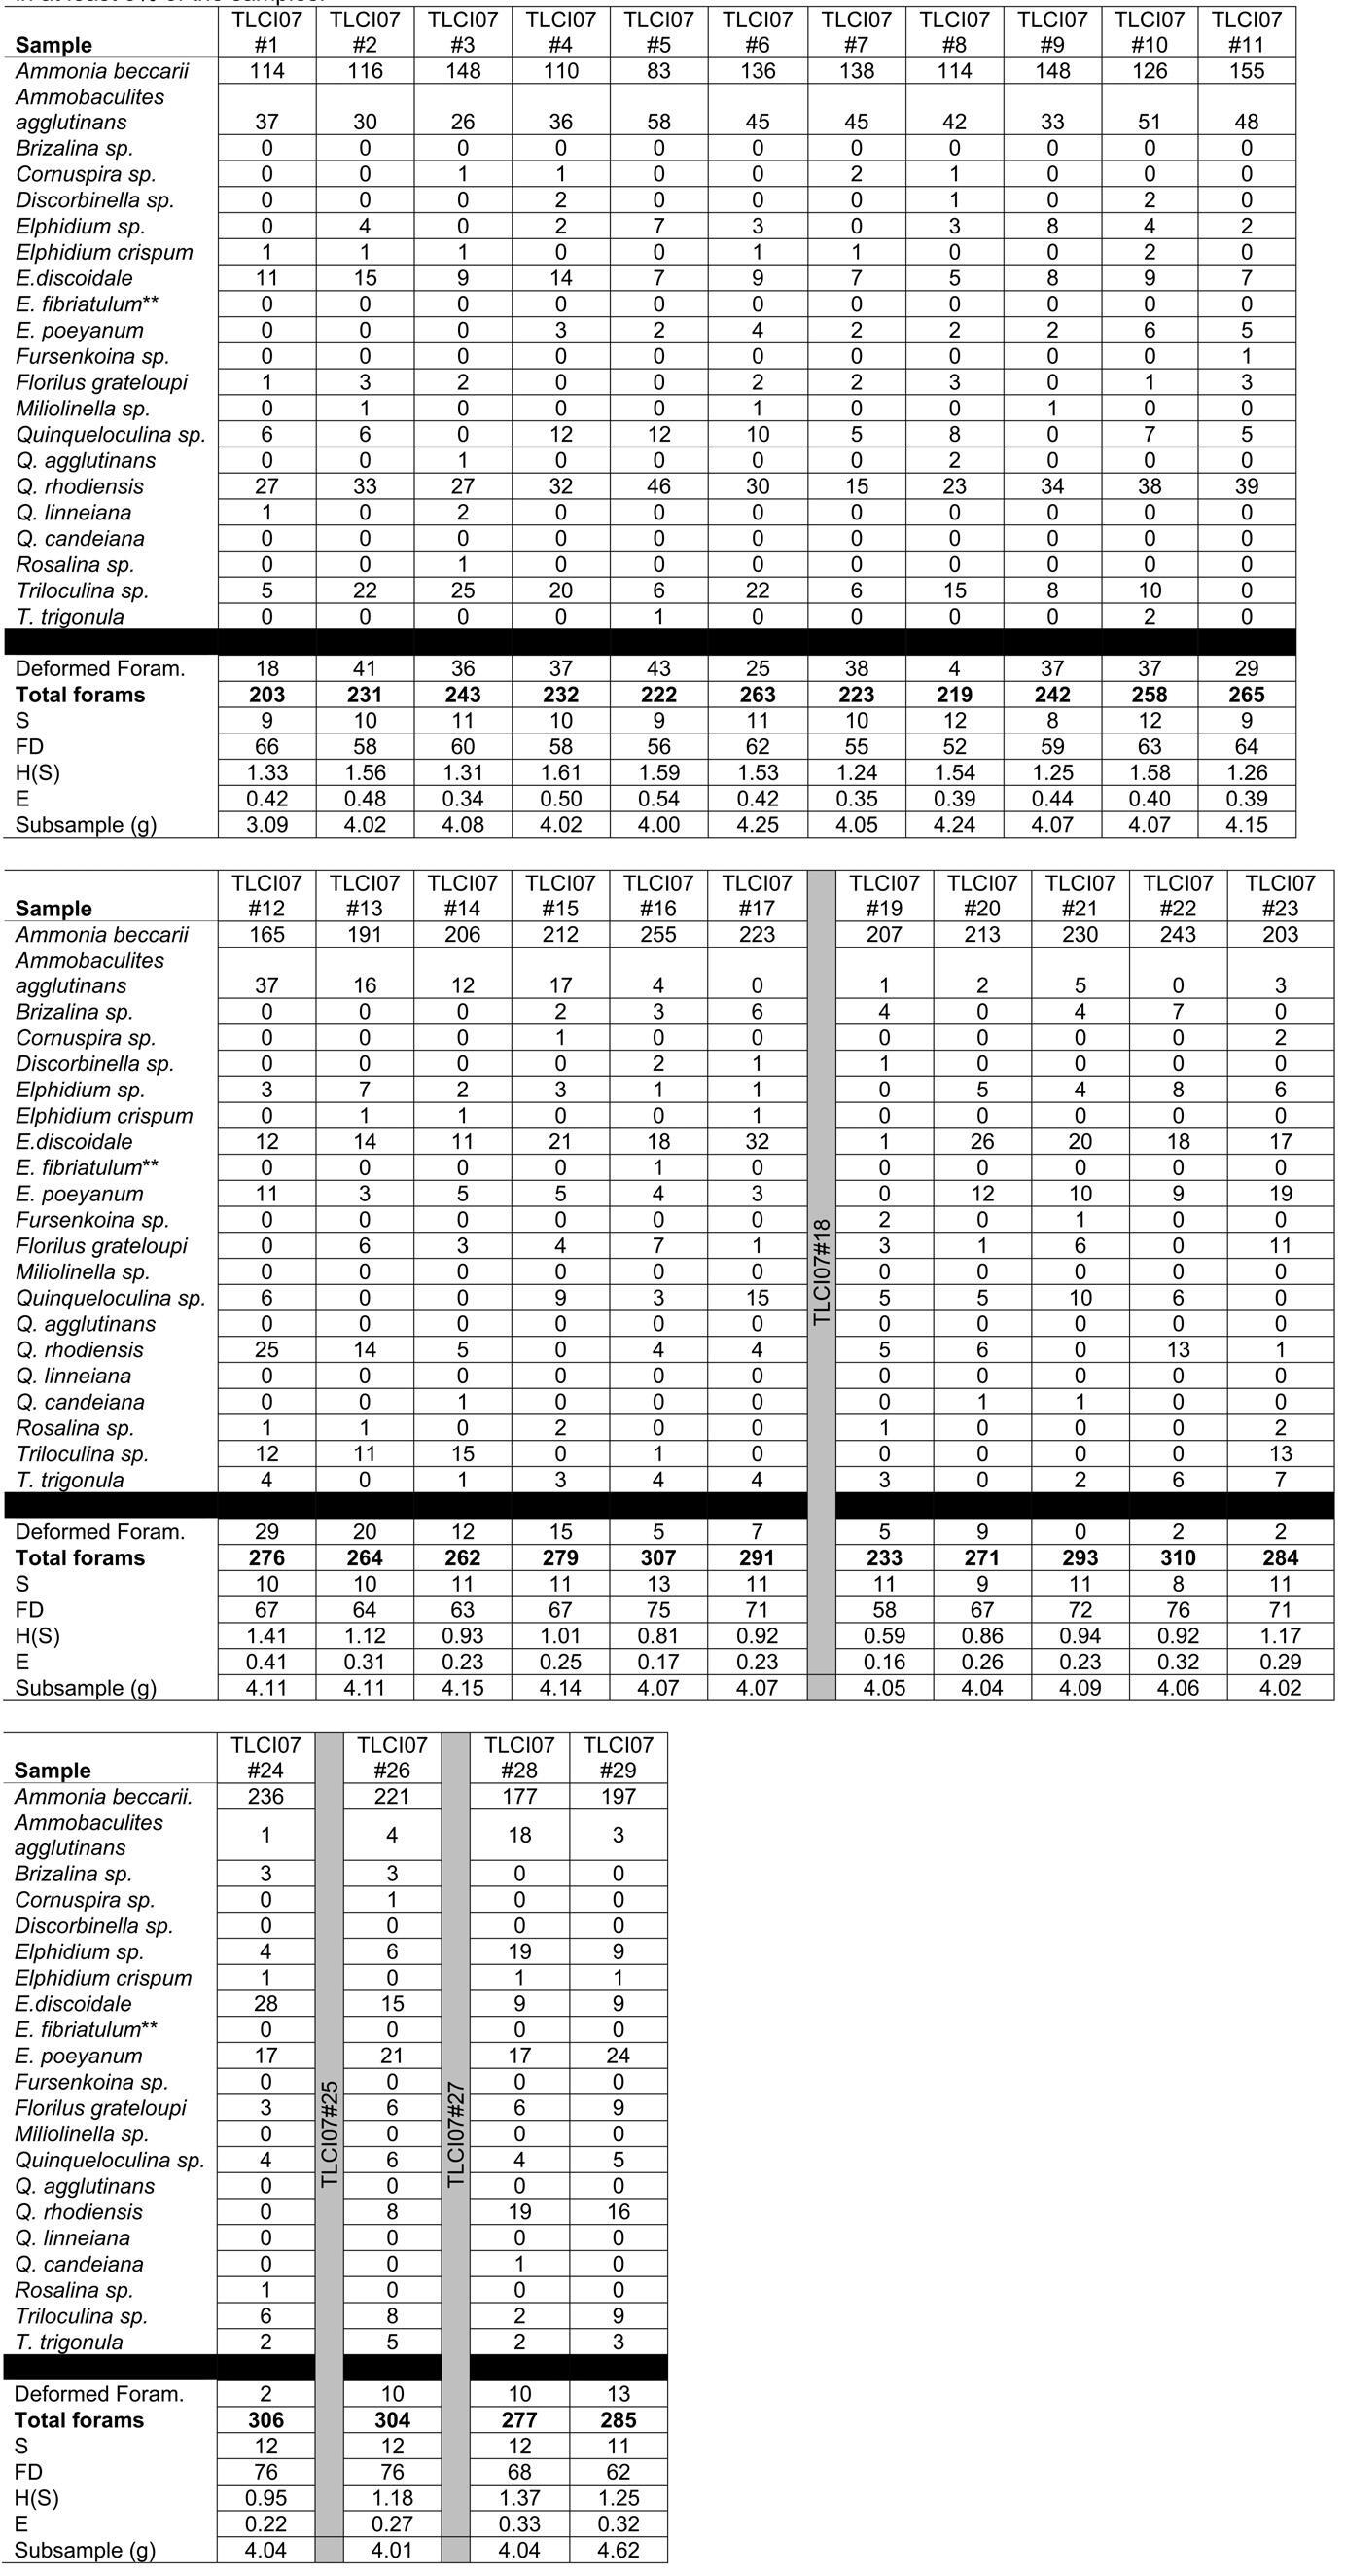
From29sedimentsubsamples,6,893benthicforaminifersrepresenting12generaand21specieswerepickedandidentified (AppendixE-supplementmaterial).Ofthe20speciespresent inatleast5%ofthesubsamples, A.beccarii (4,567individuals),A.agglutinans (574individuals), Q.rhodiensis (464individuals), Elphidiumdiscoidale (352individuals),and Triloculina sp.(261individuals)werethemostabundanttaxaacrossall samples.Noneoftheotherspeciesaccountedfor100individualsacrossallsamples.
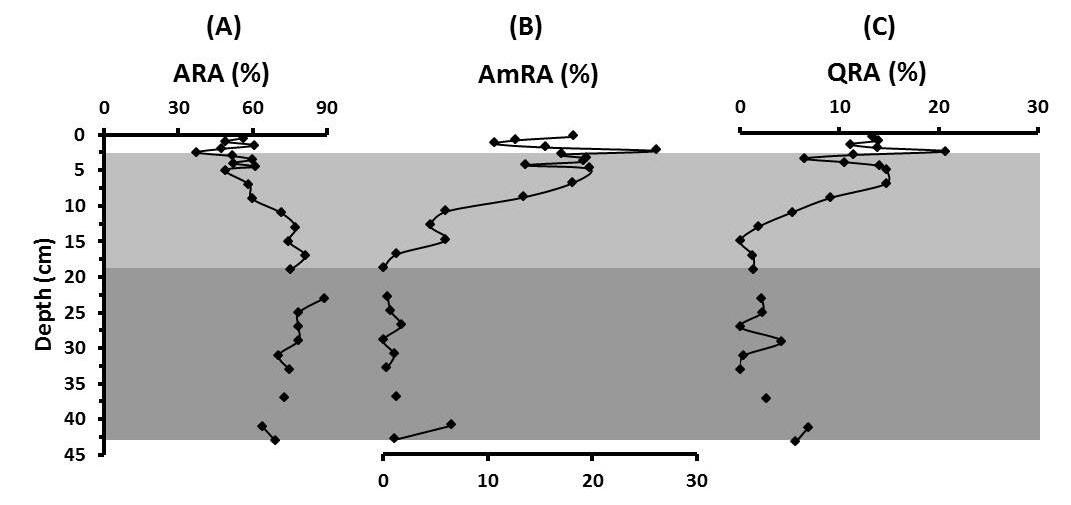
Text-figures8a–cshowthetemporalvariabilityoftherelative abundancesofthethreemostabundanttaxa. Ammoniabecarii (ARA)wasconsistentlydominantinthelowerfacies (69–89%),increasingsomewhatupto23cmdepth,followedby
astrongdecreasetoaminimumvalueof37%at2.5cm. Ammobacculitesagglutinans (AmRA)andQRAshowtheoppositetrends,withlowsbelow23cm,thenincreasingtowards thecoretop. Quinqueloculinarhodiensis wasthemostabundant miliolid.
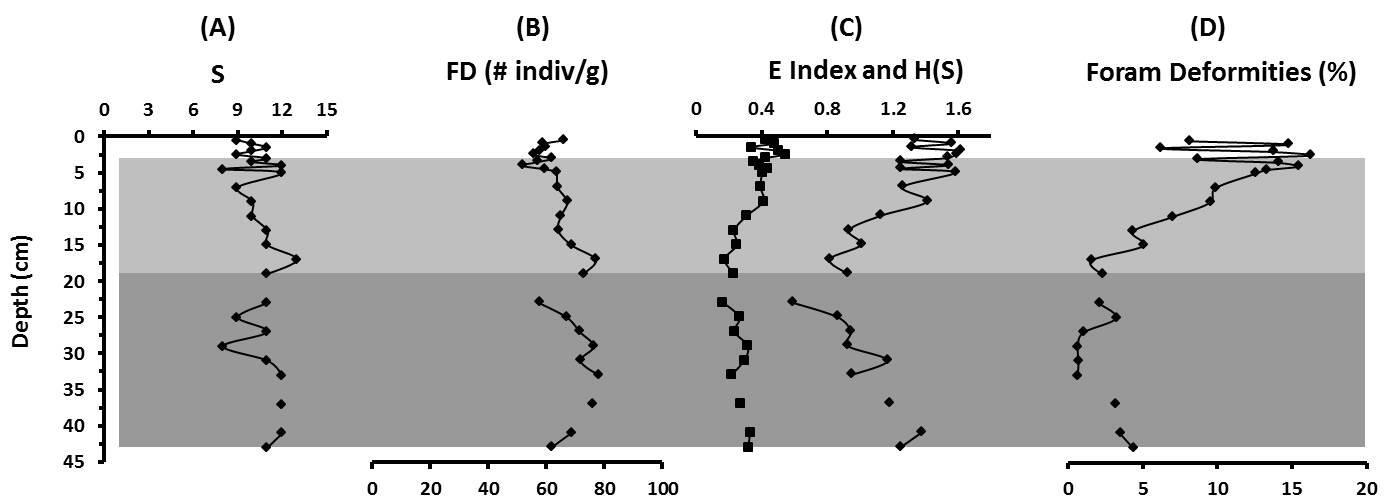
Exceptforthreesubsamplesdevoidofforaminiferaltests,speciesrichnessrangedfrom8–13species(text-fig.9a),whileFD wasconsistentlyat~60tests/g(text-fig.9b).Thetrendsindiversity[H(S)]andDF(text-figs.9c–d)reflectedthetrendsin AmRAandQRA,asdidtheEindextosomeextent.Deformities offoraminiferaltestswerefoundin25outof29samples,occurringinupto16%ofthespecimensidentifiedinasample. Nearlyalldeformitieswereobservedinmiliolidsexceptfortwo samplesinwhichdeformed A.beccarii testswerefound.
Foraminiferalclusteranalysis(Bray-Curtissimilarity)revealed onlythreeclusters.Cluster1wastheoverwhelminglydominant A.beccarii,whileCluster2wascomposedof A.agglutinans, and Q.rhodiensis.Cluster3includesothercommonnearshore andestuarinetaxa.
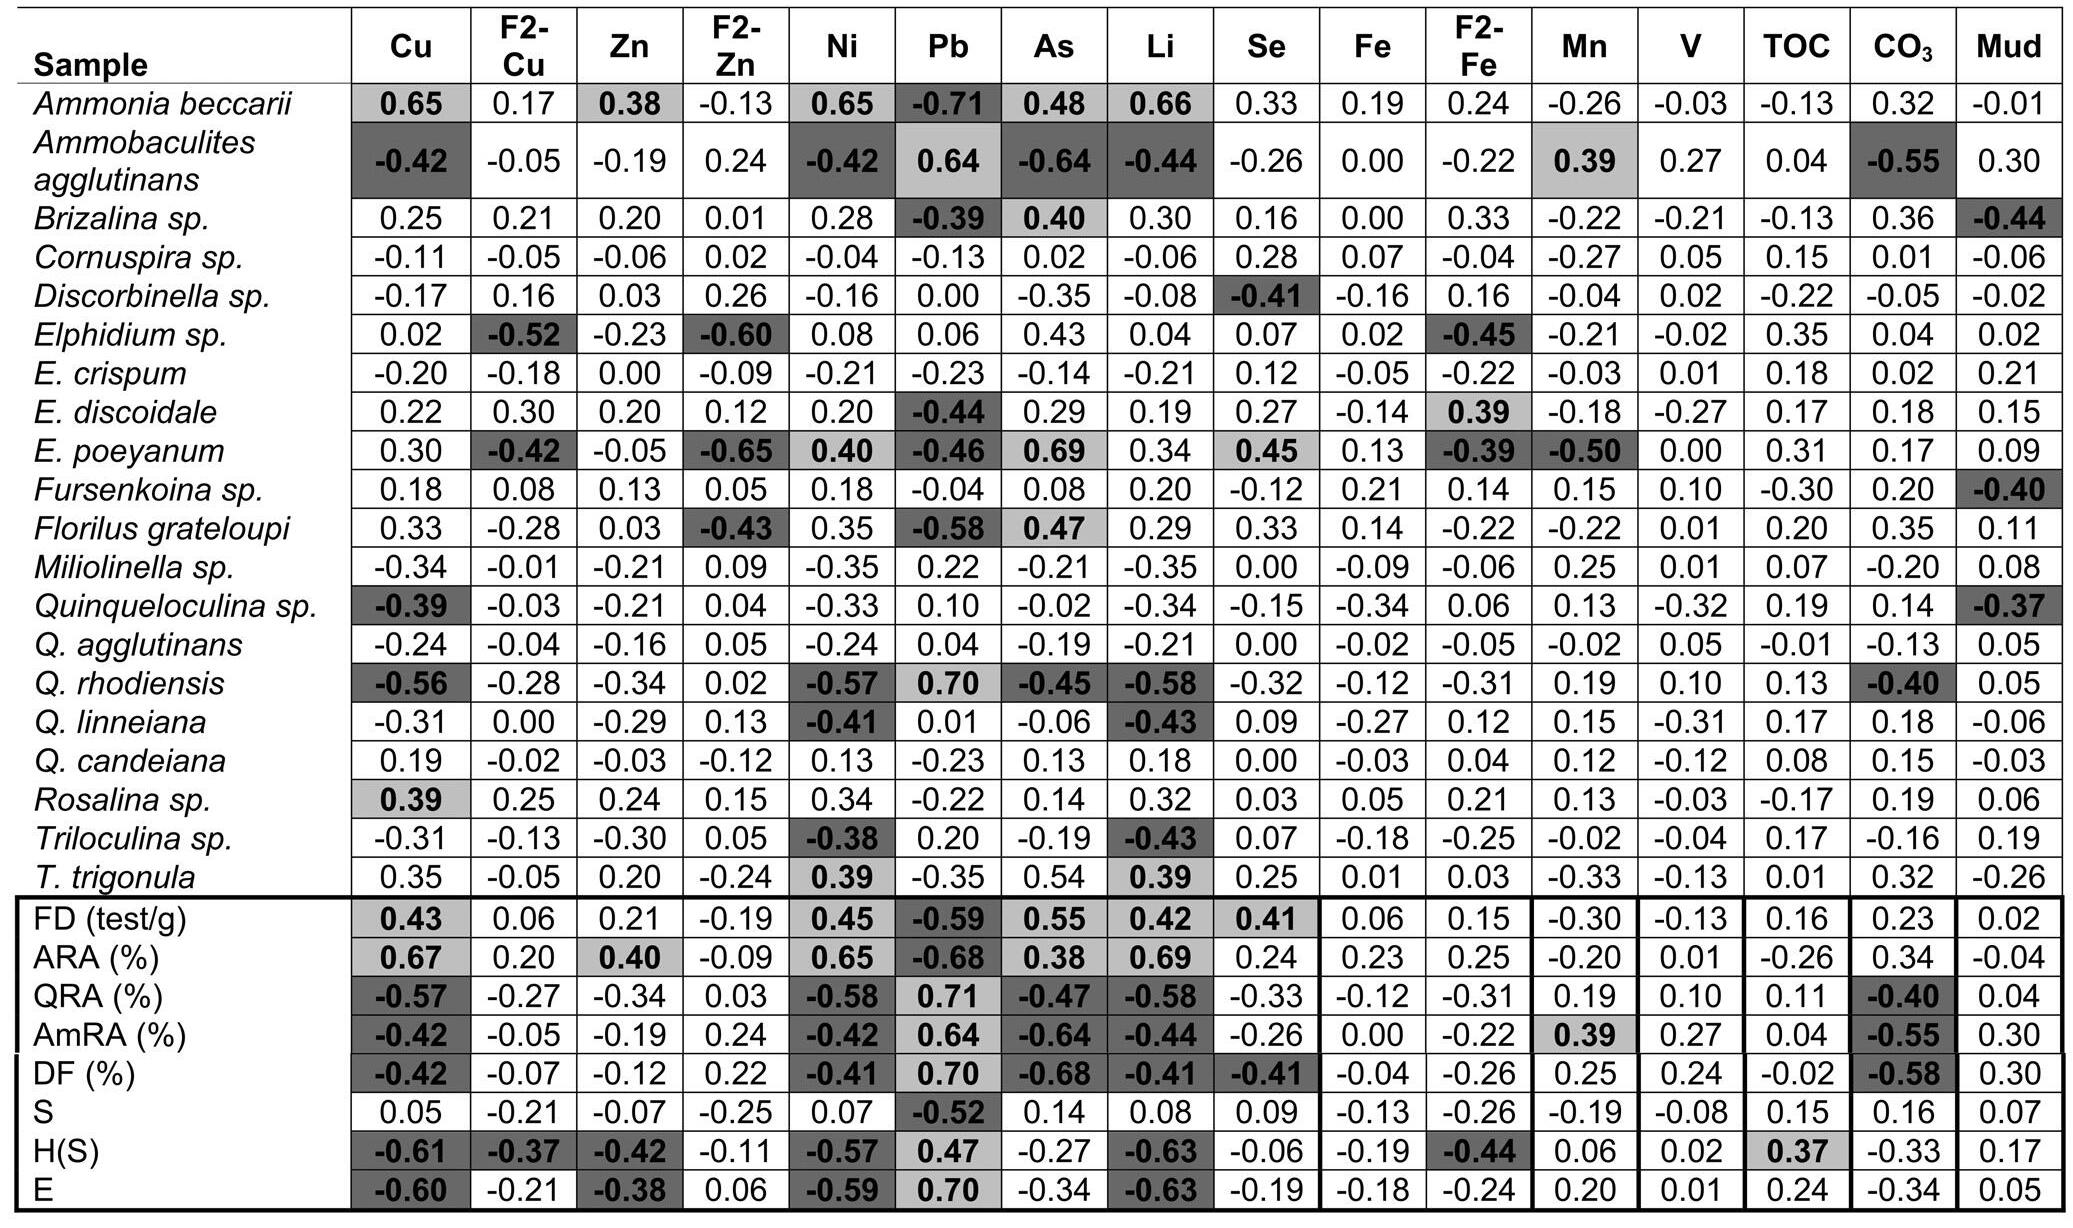
APearsoncorrelationmatrix(AppendixF,supplementalmaterial)wascalculatedforthe10PTEs,includingbioavailableelements(F2Tess-Cu,F2Tess-Zn,F2Tess-Fe),aswellasTOC,CO3, mud,foraminiferaltaxaabsoluteabundances,ecologicalindices,relativeabundancesandpercentagesoftestdeformities. Severalgeneracorrelatedeitherpositivelyornegativelywith PTEsandtheothersedimentcharacteristicsexamined,while nonecorrelatedwithFe,V,orTOC.Veryweakcorrelations werefoundbetweentheacid-solublePTEsandforaminiferal taxaortheirecologicalindicesexceptforanotablesignificant negativecorrelationwithtwo Elphidium species.Absoluteand relativeabundancesof A.beccarii positivelycorrelatewithCu, Zn,Ni,AsandLi,andnegativelywithPb. Ammobaculites agglutinans correlatepositivelywithPbandMn,and Q. rhodiensis withPb.Bothspeciesandtheirpercentdeformed testsshownegativecorrelationswithCu,Ni,As,LiandCO3 SpeciesrichnessnegativelycorrelatedwithPb,whileH(S)and EcorrelatedpositivelywithPb[H(S)alsopositivelywith TOC],andnegativelywithCu,Zn,Ni,andLi[H(S)alsonegativelywithF2Tess-CuandF2Tess-Fe].
TorrecillasLagoonCoreTLCI09
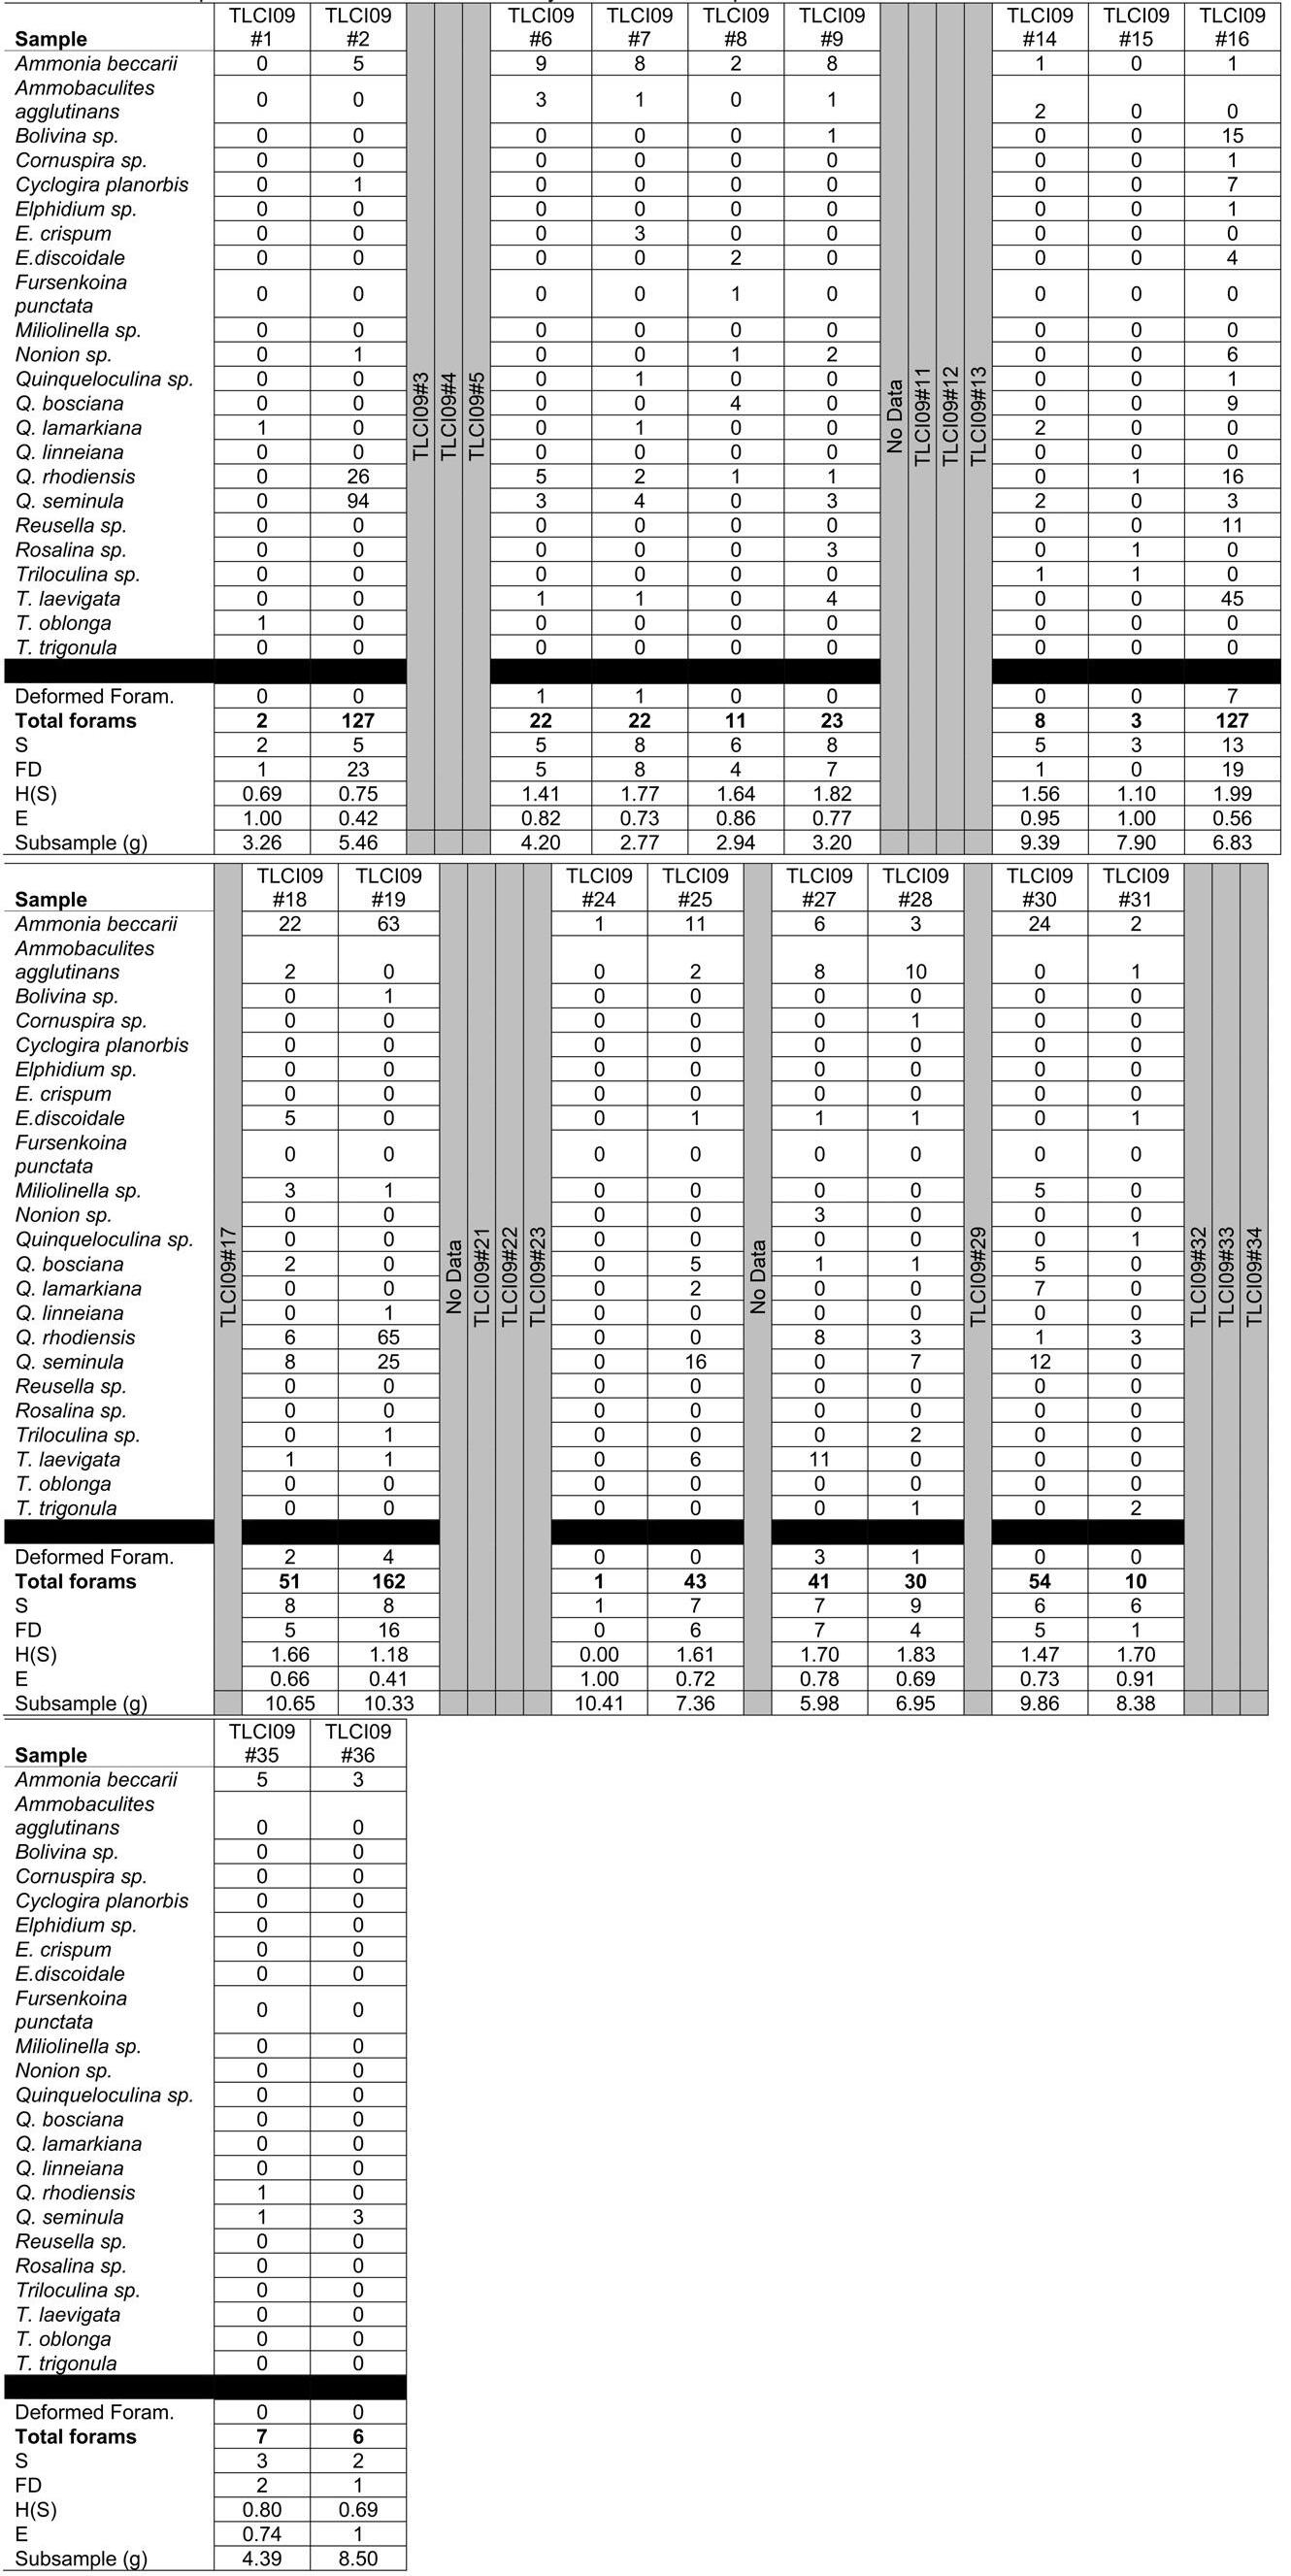
Atotalof33subsamplesexaminedinthecoreyieldedonly750 foraminiferalspecimens,whichwerepickedandidentifiedas belongingto13generaand23species(AppendixG,supplementalmaterial).Ofthe17speciespresentinatleast5%ofthe subsamples, Q.seminula (181individuals), A.beccarii (174individuals), and Q.rhodiensis (139individuals)werethemost abundantspecies.Noneoftheotherspeciesaccountedformore than70specimensacrossallsamples.
Thirteensubsamples,allwithverylowCO3 values(<3%),were barrenofforaminiferaltests(text-fig.3g).Thelow foraminiferalcountsandnumerousbarrensamplesproducedno discernabletemporalpatterns(AppendixG,supplementalmaterial).Asaconsequence,notemporalplotsofecologicalindices orabundancesofdominanttaxawereincluded.Speciesrichness rangedfrom0–13species,whileFDhadamaximumvalueof 23tests/gat1cmdepth.Testdeformities(0–7%)werefoundin onlysevensubsamples.ThetemporalvariabilityofQsRA, ARA,andQRAalsoshowednodiscernablepatterns.Cluster analysisagainyieldedthreeclusters:Cluster1wascomposedof
TEXT-FIGURE5
VerticaldistributionsofEF(enrichmentfactors)insedimentcoreTLCI07.Rangevalues:“noenrichment”(verylightgray);“minorenrichment”(lightgray);“moderateenrichment(gray);“moderate-severeenrichment(darkgray).Square,dash,anddiamondsymbolsrepresentthefirst,secondandthirdPTEineachpanel.
Q.seminula and A.beccarii, Cluster 2 wasonly Q.rhodiensis, whileCluster3includedtheotherspecies.
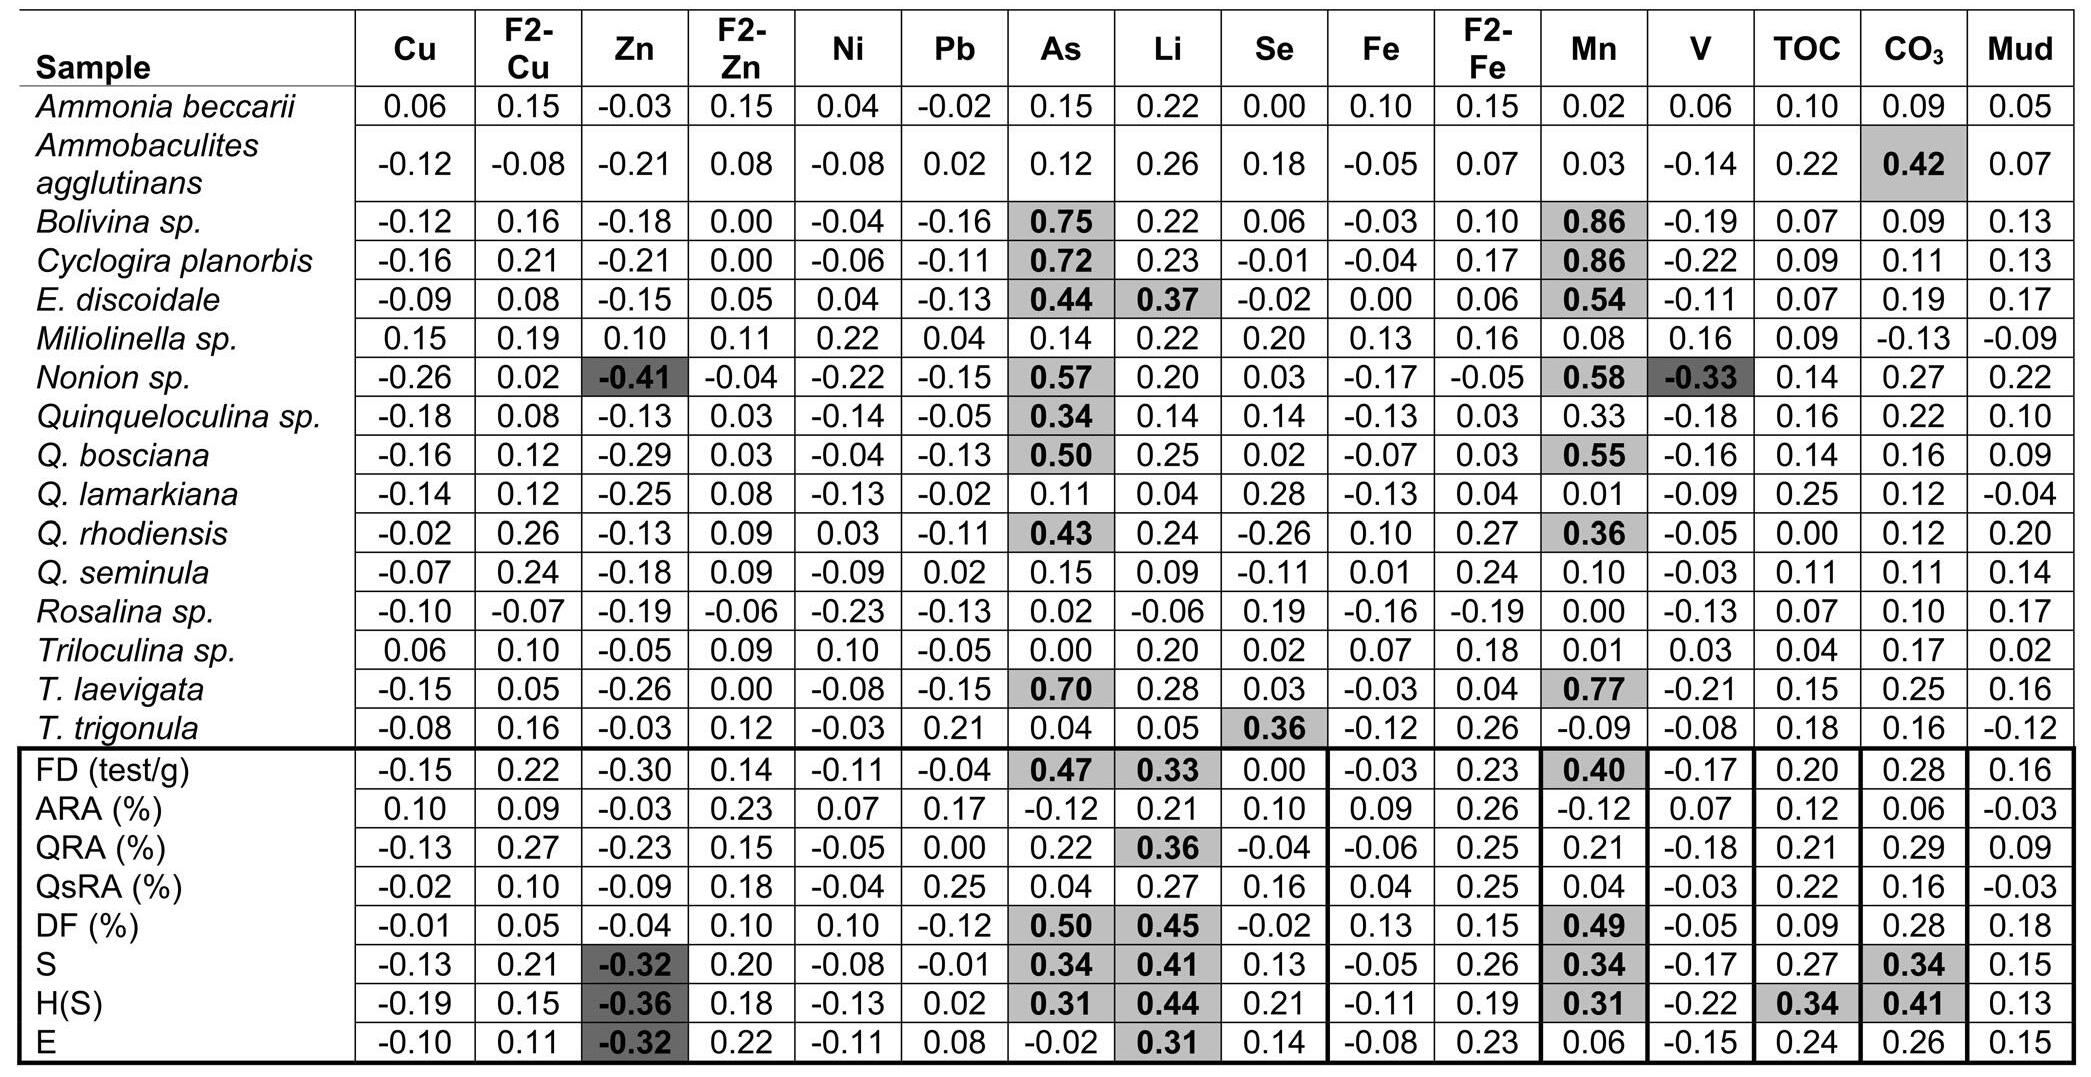
AswithTLCI07,aPearsoncorrelationmatrix(AppendixH, supplementalmaterial)wascalculated.Asexpected,relatively fewsignificantcorrelationswereidentifiedamongthestudied parameters.Arsenic,LiandMnaretheonlyPTEsthatarepositivelycorrelatedwithmultipletaxa.Amongthedominanttaxa, only Q.rhodiensis absoluteabundancescorrelatedpositively withAsandMnandtheQRAwithLi.Percenttestdeformities, S,andH(S)positivelycorrelatedwithAs,Li,andMn.Zincis theonlyPTEthatisnegativelycorrelatedwithS,H(S),andE.
DISCUSSION
TorrecillasLagoonCore(TLCI07)
PotentiallyToxicElementsinSediments
Fromcorebasetotop,twodistinctfaciesobservedfrom43–19 (lower,<60%mud)and19–4cm(upper,>60%mud)(text-fig. 3A)werereflectedinthedistributionsofPTEs,TOC,CO3 and benthicforaminiferaltests.Atadepthof~35cminthecore,the redox-sensitiveelementRepeaked,asdidTOC,AsandSe (text-fig.4k).Rhenium,whichisaconservativeelementinthe watercolumn,precipitatesandincreasesinconcentrationin sedimentsunderanoxicconditions(Seshanetal.2010; Hastingsetal.2016;Schwingetal.2016).InthecaseoftheTL, watercolumnstratificationandpoorcirculation(e.g., Martínez-Colónetal.2018),coupledwithrelativelyabundant organicmatter,promoteanoxiaassupportedbythepresenceof framboidalpyritewithinthetestsofforaminifers.Pyriteprecipitationcanindicatepost-mortemexposuretoanoxia (Buzas-StephensandBuzas,2005).BothMnandCO3 exhibit minimainthesamesectionofthelowerfacieswhereRe peaked.
Themuddierupperfacies(19–4cm)reflectedincreasederosion inthewatershedandgreaterterrigenousinputintoTL.This conclusionissupportedbythealmostidenticalpatternsbetweenmudandAl(text-fig.3a,4l),withacloseresemblance alsowithFe(text-fig.4h).AluminumandFehavebeenusedas proxiesforlithic/terrigenoussedimentationasthesearedominantcomponentsofaluminosilicate(e.g.,kaolinite)andferromagnesian(e.g.,biotite)minerals.Withinthedrainagebasinof SJBE,55km2 arecoveredbyplutonicandvolcaniclasticrocks (WebbandGómez-Gómez1998),whichstronglysuggeststhat themudfractioninTLhasanallochthonouslithicprovenance. ThevariabilityinAlandFehasbeenusedbyLarsonetal. (2015)assedimentologicsignaturesofrunoff/rainfalleventsin St.JohnIsland(USVirginIslands).Theincreaseinmudis likelyaresponsetolandscapealterationsbyanthropogenicactivitiessincethe1800’s.Similarchangesinsedimentationpatternstowardsterrigenousmuds,coupledwithadecreasein TOCandCO3,havebeendocumentedinsimilarenvironments inSt.JohnIsland’sCoralBayasbeinglinkedtolandscapealterationsbyhumans(Brooksetal.2007).
ConcentrationsofCu,Zn,Ni,Pb,Li,andVareelevatedinthe upper,mud-richfacies(text-fig.4).SincePTEsreadilyadsorb tomud-sizedsedimentsurfaces,mudsappearedtoprovidea “sink”forthesecontaminants.Mud-boundPTEscanbe bioavailabletoforaminifers,sincethesecontaminantscanbe readilydesorbedorscavengedwhenminorchangesinsalinity orpHoccur(Martínez-Colónetal.2009;Martínez-Colónetal.
2018).Moreover,ironoxideformationunderoxic/suboxic conditions(Daviesetal.2005)intheupperfaciesprovidesan ancillary“sink”forCu,Zn,Ni,Li,Se,andV,therebyreducing theirbioavailability(TessierandCampbell1987).Thismechanism,associatedwiththesedimentredoxboundarylayer,has beenobservedinestuarieselsewhere(e.g.,LeeandCundy 2001;Kalaivananetal.2017).ThetemporalvariabilityofSe mighthaveresultedfromsequestrationbyFeoxides(text-fig. 4)intheupperfacies.Martínez-Colónetal.(2018)notedthat PTEsthatcorrelatedpositivelywithFe/MninTLsurfacesedimentsindicatedoxic/anoxicboundaryconditions,inwhichsignificantfractionsofthesecontaminantsco-precipitatedwith Fe/Mngeochemicalphases.Intheloweranoxicfacies,allPTEs weresequesteredbyFesulfides(e.g.,FeS2-pyrite).SimilarobservationswerereportedbyKalaivananetal.(2017)inatropicalestuaryinIndiainwhichtheyconcludedthatFe/Mnoxide cyclingatthesedimentredoxboundaryisresponsibleforPTE sequesteringandre-precipitation.Overall,thehighestPTEconcentrationswerefound intimatelyassociatedwithmudas thedominant“sink”in theupperfacies.Asexpected, F2Tess-Cu,F2Tess-Zn,andF2Tess-FebioavailablePTEsshowno discernablepatternsbetweenfaciesexceptforrelativeminor upcoreincreases(text-fig.4).
DespitethemultiplepollutionsourcesinTL,PTEenrichment wassurprisinglylimited.ThePTEsshowing“minorenrichment”(Cu,Zn,V,Fe,Mn)indicatedthatthesourcesofthese contaminantshavenotchangedsubstantiallyovertime.Lead showed“noenrichment”exceptfora“minorenrichment”incursionat2.5cmdepth(text-fig.5).Thiscouldbeattributedto eitherlaboratoryprocedureerrororashort-terminputofPb. Thelatterisamorelikelyscenariobecauseaconstantdecreasingenrichmentcanbeobservedtowardsthecoretop.The upcoredeclineinAs(text-fig.5)mayreflectthereductionin agriculturalactivities;Aswasusedasableachingagentfor sugarprocessing(WebbandGómez-Gómez,1998).
ForaminiferalDistributions
TheforaminiferalassemblagesinTLarecharacteristicof estuarineenvironments,andtemporalvariabilityreflectsenvironmentalconditionsatthesediment/waterinterface.Thedominantspecies A.beccarii, A.agglutinans and Q.rhodiensis reflecttheisolationofthecoresitefromnormalmarineconditions(text-fig.1).Numerousspeciesinthegenus Ammonia havebeenshowntobeexceptionallyresilienttoenvironmental stressors,includingvariationsinsalinity,temperature,DOand manysourcesofPTEpollution,especiallyundernutrientpollutionwherelabileorganicmatterisabundant(e.g.,Seiglie1968; SenGuptaetal.1996;Jorissen1999;Unluetal.2006; FrontaliniandCoccioni2008;Geslinetal.2014;Arslanetal. 2017;Yankoetal.2017).Organicpollutionisacommonthread inestuarineenvironmentsinPuertoRico,fromwhichstudies havefound A.beccarii asthedominanttaxon(e.g.,Seiglie 1971;Martínez-ColónandHallock2010;Martínez-Colónetal. 2018).
Mostspeciesofthegenus Quinqueloculina arecharacteristicof open-marinesystemsandtendtobepollutionsensitive(Rao andRao,1979;Murray1991;BadawiandEl-Menhawey2016). However, Q.rhodiensis and Q.seminula arequitestresstolerant andhavebeenfoundthrivinginthesameenvironmentsas A. beccarii (Seiglie1968,1971;Martínez-ColónandHallock 2010).Similarly, A.agglutinans hasbeenreportedtobeadominanttaxoninenvironmentswithabundantorganicmatterin
TEXT-FIGURE6
VerticaldistributionsofPTEsincoreTLCI09.Triangle:F2Tess-Cu,F2Tess-Zn,andF2Tess-Febioavailableconcentrations.Diamonds:bulkPTEconcentrations.Lightgraybar:intervalofhighersedimentation.Redline:ERL(Effectrangelow)valuesas stipulatedbyLongetal.(1995).
PuertoRico(Seiglie,1968)andinKuwait(Al-Zameletal. 2009).
Thevariabilityoftheecologicalindicesthroughoutthecore wasrelativelysimilartothatrecordedinsurfacesamplesfrom TL(seeMartínez-Colónetal.2018).Speciesrichness,FD, H(S)andEwereconsistentlylow,indicativeofimpactedand stressedenvironments(e.g.,Schaferetal.1991;Yankoetal. 1998).MinimaldifferencesinSobservedinthecore(text-fig. 9a)indicatepersistentlystressedconditionsinthelagoon. Oxic/anoxicconditionsdonotfullyexplaintheoveralllowvaluesalthoughstudieshavefoundsimilarnumbersassociated withhighorganicmattercontent(Donnicietal.2012;Fosteret al.2012).OfallthePTEsstudied,Pbwastheonlycontaminant havinganegativecorrelationwithS.SincePbwaspositively associatedwithTOC,Pbcomplexedwithorganicmattermight serveastressorduetoitshigherbioavailability.
Theabundanceofforaminiferaltestsinthecoresamples(FD) variedminimally(52–77individuals/g).Interestingly,FDcorrelatedpositivelywithCu,Ni,As,Li,andSe,someofwhich havebeenpreviouslyreportedtoinfluenceforaminiferaldistributions(e.g.,Donnicietal.2012;Koufrietal.2005;Martinset al.2011;Martinsetal.2013).However,bulkconcentrationsof PTEsshouldbeinterpretedcautiously,astheycanprovidean overestimationofimpactonforaminiferalassemblages,and bioavailabilitydependsuponchemicalfractionation (Martínez-Colónetal.2009,2018).Thisisimportanttoconsidersincethereisnoclearconsensusonwhatchemicalfractionsarebioavailabletotheforaminifers(Martínez-Colónetal. 2018).
HigherH(S)andEvaluesintheupperfaciesindicatethatconditionsinthelagoonhaveimprovedslightlyforthe foraminifers(text-fig.9c).However,eventhe“improvedvalues”arestilllowandaretypicalofenvironmentsinfluencedby stressors(e.g.,Berginetal.2006;Fosteretal.2012;Schintuet al.2016).NegativecorrelationswithseveralPTEs,including F2Tess-CuandF2Tess-Fe,couldimplicatethesePTEsinstressing theforaminiferalassemblages,asinterpretedinotherstudies (e.g.,Martinsetal.2015;Schintuetal.2016).However,as notedabove,bulkPTEconcentrationspotentiallyoverestimate theirimpactssincethereportedvaluescanincludemultiple chemicalfractions(e.g.,exchangeable,acid-soluble,reducible, oxidizable,andresidual)(Martínez-Colónetal.2018)asseen bythepositivecorrelationandlackthereofbetween A.beccarii withCu/Zn,F2Tess-Cu,andF2Tess-Zn.Similarly,theF2Tess-Cu andF2Tess-Fecouldnothaveadirecteffectonforaminiferalassemblagesanddistributionssincethesepollutantsarebounded tothecrystallinestructureofcarbonatesandbecomingless bioavailable.
Theincreaseindiversity[H(S)]upcorereflectstheincreased prevalenceof Quinqueloculina and Ammobaculities (text-figs. 9c,8b–c).Moreover,sincedeformedtestswerefoundmostlyin miliolidtaxa,including Quinqeloculina,theupcoreincreasein DFreflectstheupcoreincreaseinQRA.Theseobservations couldbeinterpretedasimprovementsintheenvironmentalconditions,suchashigherormorestablesalinityanddissolvedoxygen,whichallowedmiliolidtaxatosurvive,butdemonstrate stressthroughtestabnormalities.Thisinterpretationissupportedbytheoveralldecreasingtrendsof A.beccarii and Elphidium sp.,whichareknownindicatorsofstressedconditions.Notethattheabsoluteandrelativeabundancesof A.
beccarii positivelycorrelated(andnegativelyinthecaseof A. agglutinans and Q.rhodiensis)withCu,Zn,andFeandnotwith thebioavailablecounterparts(F2Tess-Cu,F2Tess-Zn,F2Tess-Fe). WhilepreviousstudieshaveconcludedthatbulkPTEconcentrationscanbeforaminiferalstressors(e.g.,Alve,1991; Fontanieretal.2012;Schintuetal.2016),asnotedby Martínez-Colónetal.(2018),futurestudiestodeterminethe functionalbioavailabilitytotheforaminifers,insteadofrelying onpreviouslydefinedoperationalbioavailability(Tessieretal. 1979;BaconandDavidson,2008;ZimmermanandWeindorf, 2010),arecriticallyneededtofullyunderstandinconsistentresults.
TorrecillasLagoonCore(TLCI09)
PotentiallyToxicElementsinSediments
MudwasoverwhelminglydominantintheTLCI09core (text-fig.3e),andisconsistentwithashelteredenvironment (text-fig.1).TheTOCdecreasedbetween35–19cm(text-figs. 3f–g).ThelowCO3 inthesediment(<5%)mayreflectthecorrosiveenvironmentinthisrelativelydeeplocation(12m); Martínez-Colónetal.(2018)reportedstrongoxygenandpH gradientswithdepthinTL.
Twosedimentaryfacieswereobserved,theloweroneat57–35 cmandanupperonesubdividedintoanintermediateinterval (35–19cm)andupperinterval(19–0cm)(text-figs.2,6).The lowerfaciesconsistedoflaminatedsedimentscharacteristicof fluvialseasonalvariationsandnon-bioturbation.Themudcontentwassomewhatvariableinthelowerfacies,rangingfrom <60–100%,butwasconsistentlynear100%throughtheintermediateinterval,increasingagaininvariabilityintheupperinterval.TheTOCvariedbetween~6–9%inthelowerfacies, droppeddramaticallyto~1%intheintermediateinterval,then increasedto~6%intheupperinterval.ThetemporaldistributionofRewasconsistentwithTOC,withverylowvaluesinthe intermediateintervalandhigher,variablevaluesinthelower andupperfacies.Theintermediateandupperintervalsappeared tobenon-laminated,althoughthiscouldbeanoverexposureartifactintheradiographduetoiceinthecore.ThehighconcentrationofAl,Fe,andpeakmudcontentassociatedwithstrong declinesinTOC,Re,andLi,indicatedanintervalofhigh terrigenoussedimentationat35–19cm.
Themostnotablecharacteristicofthecorewastheconsistency ofthefollowingfeaturesinthe35–19cmcoreinterval.The TOC,ReandLidropped,mudwasquitestable,whileCu,Zn, Ni,Fe,V,Al,F2Tess-Cu,F2Tess-Zn,andF2Tess-Feallincreased (text-fig.6).AsnotedinthediscussionofTLCI07,PTEscanbe adsorbedorsequesteredbyFe/Mnoxi-hydroxides,aswellas withFesulfides(e.g.,pyrite),bothservingas“sinks”that greatlyreducesPTEbioavailability(Martínez-Colónetal. 2009;Martínez-Colónetal.2018).ThisinterpretationwassupportedbytherapidincreaseinbulkconcentrationsofCu,Zn, Ni,andVatthe35–19cminterval,parallelingthetemporal variabilityofFe(text-fig.6).Interestingly,unlikeTLCI07,mud contentonlycorrelatednegativelywithPb,AsandSe.However,thelackofpositivecorrelationsbetweenotherPTEsand mudmaybeanartifactofthedominanceofmudthroughoutthe core,eventhoughthemudwasconsistentlyhighestinthe35–19 cminterval.
AlsonotablewerethenegativecorrelationsofCu,Zn,Ni,Fe, andVwithTOCandCO3,indicatingthatorganicmatterand
TEXT-FIGURE7
VerticaldistributionsofEF(enrichmentfactors)insedimentcoreTLCI09.Rangevalues:“noenrichment”(verylight gray);“minorenrichment”(lightgray);“moderateenrichment”(gray).Square,dash,anddiamondsymbolsrepresent thefirst,secondandthirdPTEineachpanel.
MichaelMartínez-Colónetal:TemporalvariabilityinpotentiallytoxicelementsandbenthicForaminifera,estuarineenvironment,PuertoRico
TEXT-FIGURE8
TemporaldistributionofkeyforaminiferaltaxarelativeabundancesinCoreTLCI07.A:ARA(A.beccarii),AmRA(A. agglutinans ),andQRA(Q.rhodiensis).Lightgraybar:intervalofhighersedimentation.Darkgraybar:intervalofanoxicconditions.
carbonatewerenotfunctioningasPTE“sinks”.Interestingly, Pb,Li,andSepositivelycorrelatedwithTOC,whichpotentiallyincreasedtheirbioavailabilityforbenthicforaminifersas discussedbyMartínez-Colónetal.(2018).Overall,thehighest bulkconcentrationsformostPTEswerefoundintheintermediatefacies(35–19cm)intimatelyassociatedwithFeasthedominant“sink”.TheF2Tess-Cu,F2Tess-Zn,andF2Tess-Febioavailable PTEsshowadiscernableincreaseat35–19cmdepth(text-fig. 6).
ThesuccessfuldatingofcoreTLCI09above25cmdepthprovidedinsightintothetimingofthelowerandupperfacies changes.MostPTEsrapidlyincreasedinconcentrationduring thelate1800’s,reachingmaximumvaluesat25cm(ca.1908). Thesubsurfacepeaksmayindicatepollutionandwatershed changesassociatedwithagricultureinthelate19th andearly 20th centuries.ArapiddecreaseinPTEconcentrationsoccurred above19cm(ca.1962).WebbandGómez-Gómez(1998)documentedatemporaldecreaseinAsfrom1925–1995fromsedimentcores.TheyalsoreportedanincreaseinPbduringthe sametimeinterval,whilewerecordedrelativestabilityinPb concentrationsabove35cmdepthinTLCI09.
PuertoRicowasannexedbytheUSAin1898.Duringthe20th century,theSJBE,includingTL,experiencedtwopulsesofurbanization.Thefirstbeganinthelate1930’swithmigration fromruralareastothecities.WhenPuertoRicobecamea US-Commonwealthin1952,urbanizationincreasedexponentially.WebbandGómez-Gómez(1998)specificallynotedthat extensivepastureandforestareasintheSJBEwatershedunderwenthousingandcommercialdevelopmentbetween1900and 1970.
AswithTLCI07,PTEenrichmentwassurprisinglyminimal. MostPTEseitherexhibited“noenrichment”(Ni,Li,Mn,As)or “minorenrichment”(Cu,Zn,V,Fe,Se),indicatingnosubstantialchangeinPTEpollutionovertime.Leadactuallydecreased fromcore-baseupto29cm,changingfrom“moderateenrichment”andremainingmostlywith“minorenrichment”towards core-top.
ForaminiferalDistributions
Thedominantassemblagethroughoutthecoreiscomposedof Q.seminula, A.beccarii,and Q.rhodiensis.Thesespecieshave beenreportedinenvironmentswithhighTOCintropicalsettings(e.g.,Seiglie1968;Donnicietal.2012).Infieldexperiments, Q.seminula hasbeenfoundtothriveinanoxic environmentsbyexhibitinganexponentialgrowthattheinitial stagesofanoxiafollowedbyadecreaseovertime(Langletetal. 2014).Thisspeciespreviouslyhasbeenreportedassociated withdisturbedenvironmentssuchasbeneathshrimpponds (Debenayetal.2009)andonfreshvolcanicash(Hessand Kuhnt1996).As42%ofthesubsamplesinthiscoreweredevoidofforaminiferaltestsand15%ofsubsampleshad<10 tests/sample,interpretationsareprimarilyrestrictedtovariabilityinpreservationpotentialofforaminiferaltestswithinthe core.ThisscenariowasalsoobservedinacorecollectedinTL in2005inwhichsampleswerebarrenatdepths>16cm (Martínez-ColónandHallock2010).Theprevalenceofbarren samplesmorelikelyreflectslackofpreservationthanchanges insedimentation/erosionwithinthedrainagebasin.Theinterpretationofpost-depositionaldissolutionwasbasedonthelow CO3 values(<5%),absenceofostracods,lackofcorrelation withmostPTEs/TOC,andevidenceofetchingandcorrosionin someofthespecimensrecovered.Dissolutionscarsofbenthic
TEXT-FIGURE9
VerticaldistributionsofforaminiferalecologicalparametersinCoreTLCI07.A:S(NumberofSpecies),B:FD(Foraminiferal Density),C:H(S)(ShannonIndex)(diamonds),E(EquitabilityIndex)(squares).Lightgraybar:intervalofhighersedimentation. Darkgraybar:intervalofanoxicconditions.
foraminifershavebeenascribedtochemicallyanddomestically pollutedestuaries(e.g.,Al-Azmeletal.2009;Martínez-Colón etal.2010)aswellasinpHcultureexperiments(LeCadreetal. 2003).
ComparisonofTLCI07andTLCI09Cores
Thetwocoreswerecollectedinratherdifferentenvironmental conditions.TLCI07wascollectedfromanopenlagoonlocation atawaterdepthoflessthanameter,wheresurfacesediments werewelloxygenated.Incontrast,TLCI09wascollectedinan enclosedlocationat12mdepth,inanoxicconditions(sampling station#19-Martínez-Colónetal.2018).Thus,thephysicaland chemicalconditionswerequitedifferent.Thesedifferencescan explainsomeoftheimportantvariabilitiesbetweenthe sedimentologicalaspectsofthecores.Forexample,while TLCI07sedimentswerepredominantlymuddy,themudcontentvariedfrom~40–80%.Incontrast,theTLCI09sediments werecompletelymuddominated,especiallyinthemiddleand upperpartsofthecore.TheoppositetrendwasseeninCO3.In TLCI07,CO3 rangedfrom~5–30%,thoughitwaslowestinthe upperfacies.InTLCI09,therewerevirtuallynocarbonates, likelyreflectingdissolution.
Astrikingsimilaritybetweenthecoreswasinthezonesof higherterrigenousinfluence(text-fig.3),inwhichmudwas highest,CO3 andTOCwerelowest,bulkconcentrationsofCu, Zn,Ni,Fe,VandAlwereconsistentlyhighest,andRewasconsistentlylowest(text-figs.4,6).Interestingly,thatzonewas firstencounteredafewcentimetersbelowthesurfacein TLCI07and19cmbelowthesurfaceinTLCI09.Arethesimilaritiesinlithologyandgeochemistrycoincidental?Ordothey representcontemporaneousdeposition,withminimalsediment thicknessoverlyingthatunitinTLCI07asaconsequenceofthe veryshallowdepthfromwhichitwascollected?
Theforaminiferalassemblagesweremoredifficulttocompare betweencoresbecausethedensitiesweresolowinTLCI09.
ThetrendsinTLCI07wereclearinthat Ammonia completely dominatedthelowersection,while Ammobaculites and Quinqueloculina becamemoreprevalentintheuppersection,as wasreflectedintheH(S)andintheprevalenceofDF,which werefoundmostlyinmiliolidssuchas Quinqueloculina.
Interestingly,someecologicalindices(e.g.,FD,S,andDF),as wellasabsoluteabundancesofcertaintaxa( A.beccarii, A. agglutinans, E.discoidale)didpositivelycorrelatewithAs,Li andMn.Thesecontaminantsmaybehaveasessentialmicronutrients,asnotedinpreviousstudiesthatdocumented bioaccumulatedcontaminantsinmacrobenthicorganismsassociatedwithbioavailablefractionsofPTEs(LuomaandBryan 1978;Tessieretal.1984;TessierandCampbell1987).
Numerousstudieshaveaddressedthephysiochemicalprocesses thatmanipulatePTEfractionationandspeciationinmarineenvironments(e.g.,Caplatetal.2005;Gree-Ruíz2005; Marínez-Colónetal.2009).OtherstudieshaveestablishedprotocolsforPTEextractionsfromsediments,assumingthedegree ofbioavailabilitybasedontheoperationalsequenceofextractions.Tessieretal.(1979)proposedthatPTEscanexistsinfive differentfractionsrangingfrommostbioavailable(fraction1: exchangeable)totheleastbioavailable(fraction5:residual). However,bioavailabilitybaseduponmacroinvertebratesmay notextrapolatetobenthicforaminifersappropriatelyduetobasicbiologicaldifferences(Martínez-Colónetal.2018).This scenariohasledtodiscrepanciesininterpretationswhenassessingtheimpactofPTEsonbenthicforaminifers.AsrecommendedbyMartínez-Colónetal.(2009,2018),fractionation andsequentialextractionproceduresareessential,asisrecognizingthatcorrelationdoesnotimplycausation.Recognizing thephysiochemicalconditions(historicalifpossible)inwhich foraminiferswereexposed,aswellastheconditionsthatcandeterminethespeciation,fractionation,andbioavailabilityof PTEs,isessentialtovalidinterpretations.BaseduponobservationsfromthisstudyandfromMartínez-Colónetal.(2018),we
MichaelMartínez-Colónetal:TemporalvariabilityinpotentiallytoxicelementsandbenthicForaminifera,estuarineenvironment,PuertoRico
concludethattheF2Tess acid-solublefraction(secondmost bioavailableaccordingtoTessieretal.1979;TessierandCampbell1987)isnotasatisfactorychoicetoindicatebioavailability forbenthicforaminifers.ThePTEslockedinthecrystalline structureofCaCO3 minerals(e.g.,calcite,malachite,cerussite) arenotbioavailabletoforaminifers.Itisimportanttoconsider theactualbiologicalsignificanceofsediment-boundPTEsin relationtoforaminifersandfractionation.Thus,wefurtherconcludethatspecificexperimentalstudieswillbeessentialtodeterminewhatfractionsofsediment-associatedPTEscanbe takenupbybenthicforaminifers.
CONCLUSIONS
Twocoresprovideinformationonthetemporalvariabilityof environmentalconditionsinTLasitrelatestotheimpactof PTEsonbenthicforaminiferalassemblages.Thetwocoresreflectdifferentenvironmentalconditionswithinthelagoonthat couldinfluencesedimentationratesandsourcesofpollution. Oxygenationandsedimentcharacteristicshavebeeninfluenced bychangesinterrigenousinputsincetheearly1900s,which haveinturninfluencedthevariabilityandfractionationof PTEs.Enrichmentfactorsindicateminimalenrichmentinthe sedimentcoresassessed.Statisticalcorrelationssuggestthat mudandFe(e.g.,Feoxides)aremajor“sink”mechanismsfor mostPTEs,therebyreducingtheirbioavailabilityinthewater columnbandinsedimentsinthecaseofFe.ThePTEsadsorbed tomud(exchangeablefraction)arelikelytobebioavailablefor benthicforaminifers..
Theforaminiferalassemblagedominatedby A.beccarii, A. agglutinans, Q.rhodiensis,and Q.seminula, coupledwithvery lowdensitiesanddiversities,areindicativeofstressedenvironmentalconditions.KeyforaminiferaltaxaandecologicalindicesexhibitednegativecorrelationswithsomebulkPTE concentrations,butverylimitedcorrelationswithselected acid-solublefractions(F2Tess-Cu,F2Tess-Zn,F2Tess-Fe)assumed tobebioavailablebaseduponstudiesofmacroinvertebrates. Baseduponthisdiscrepancy,werecognizetheneedtobetter understandwhatPTEfractionsholdbiologicalsignificancefor foraminifers.Inaddition,werecommendnotconsideringthe F2Tess-bioavailablefractionasanadequateindicatorof bioavailabilityforbenthicforaminifersinenvironmentalassessments.
ACKNOWLEDGMENTS
TheauthorswouldliketothankDrJorgeBauzá,MrsAdelís CabánandGladysRiverafromtheSanJuanBayEstuarysystemfortheirfieldsupport.ICONOSimagesfromTorrecillas LagoonwereprovidedbytheGeologicalandEnvironmental RemoteSensingLaboratoryfromtheUniversityofPuerto Rico-MayaguezCampus.SpecialthankstoHumberto Bojórquez-LeyvafromUniversidadNacionalAutónomade México’sInstituteofMarineScienceandLimnologyforhis AtomicAdsorptionSpectroscopytrainingandtoMrs.MollyR. McLaughlinfromtheUSGSCoastalandMarineScienceCenterinStPetersburg,Florida,forfieldequipmentandfreezedrying.SpecialthankstotechniciansfromtheManatíMedical CenterinPuertoRicofortakingthecoreradiographs.Wewill liketoacknowledgethehelpfulcommentsofDr.LetiziaDi Bella,Dr.GuillemMateu-Vicens,andDr.LamidiBabalola. ThisworkwassupportedbyPuertoRicoSeaGrant(grantnumberR-21-1-08)andtheUSAGeologicalSurveyCooperative Agreement(grantnumber99HQAG0004).
REFERENCES
ABRAHIM,G.M.S.andPARKER,R.J.,2008.Assessmentofheavy metalenrichmentfactorsandthedegreeofcontaminationinmarine sedimentsfromTamakiEstuary,Auckland,NewZealand. EnvironmentalMonitoringandAssessment,136:227–238.
ABU-ZEID,R.H.,BASAHAM,A.S.andELSAYED,M.A.,2013.Effectofmunicipialwastewatersonbottomsedimentgeochemistryand benthicforaminiferaoftwoRedSeacoastalinlets,Jeddah,Saudi Arabia. EnvironmentalEarthSciences,68:451–469.
ACEVEDO-FIGUEROA,D.JIMENEZ,B.D.andRODRIGUEZ-SIERRA,C.,2006.Tracemetalsinsedimentsoftwoestuarinelagoons fromPuertoRico. EnvironmentalPollution,141:336–342.
ALVE,E.,1995.Benthicforaminiferalresponsestoestuarinepollution: areview. JournalofForaminiferalResearch,25:190–203.
———,1991.Benthicforaminiferainsedimentcoresreflectingheavy metalpollutioninSørfjord,westernNorway. JournalofForaminiferalResearch,21:1–19.
AL-ZAMEL,A.Z.,AL-SARAWI,M.A.,KHADER,S.R.and AL-RIFAIY,I.A.,2009.Benthicforaminiferafrompollutedmarine environmentofSulaibikhatBay(Kuwait). EnvironmentalMonitoringandAssessment,149:395–409.
APPLEBY,P.G.,1992.Chronostratigraphictechniquesinrecentsediments.In:Smol,J.P.,Birks,H.J.B.,andLast,W.M.Eds.,Uranium-seriesDisequilibrium:ApplicationstoEarth,Marineand EnvironmentalSciences,171–203.NewYork:KluwerAcademic Press.
ARSLAN,M.,KAMINSKI,M.A.,KHALIL,A.andTAWABINI,B.S., 2017.BenthicForaminiferainEasternBahrain:Relationshiptolocal pollutionsources. PolishJournalofEnvironmentalSciences, 26(3), 969–984.
BACON,J.R.andDAVIDSON,C.M.,2008.Isthereafutureforsequentialchemicalextraction? Analyst,133:25–46.
BADAWI,A.andEL-MENHAWEY,W.,2016.Toleranceofbenthic foraminiferatoanthropogenicstressorsfromthreesitesoftheEgyptiancoasts. TheEgyptianJournalofAquaticResearch,42:49–56.
BALACHANDRAN,K.K.,LAKURAJ,C.M.,MARTIN,G.D., SRINIVAS,K.andVENUGOPAL,P.,2006.Environmentalanalysis ofheavymetaldepositioninaflow-restrictedtropicalestuaryandits adjacentshelf. EnvironmentalForensics,7:345–351.
BERGIN,F.,KUÇUKSEZGIN,F.,ULUTURHAN,E.,BARUT,I., MERIÇ,E.,AV AR,N.andNAZIK,A.,2006.TheresponseofbenthicforaminiferaandostracodatoheavymetalpollutioninGulfof Izmir(EasternAegeanSea). EstuariesandCoastalShelfScience,66: 368–386.
BOUCHET,V.M.P.,ALVE,E.,RYGG,B.andTELFORD,R.J., 2012.Benthicforaminiferaprovideapromisingtoolforecological qualityassessmentofmarinewaters. EcologicalIndicators, 23: 66–75.
BREITHAUPT,J.L.,SMOAK,J.M.,SMITH,T.J.andSANDERS,C. J.,2014. Temporalvariabilityofcarbonandnutrientburial,sediment accretion,andmassaccumulationoverthepastcenturyinacarbonate platformmangroveforestoftheFloridaEverglades. JournalofGeophysicalResearch:Biogeosciences,119:2032–2048.
BROOKS,G.R.,DEVINE,B.,LARSON,R.A.andROOD,B.P.,2007. SedimentaryDevelopmentofCoralBay,St.John,USVI:Ashift fromnaturaltoanthropogenicinfluences. CaribbeanJournalofScience,43:226–243.
BUNCH,B.W.,CERCO,C.F.,DORTH,M.S.,JOHNSONB.H.and KIM,K.W.,2000.HydrodynamicandwaterqualitymodelofSan JuanBayestuary,TechnicalReportERDCTR-00-1,U.S.Army CorpsofEngineerWaterwaysExperimentStation.Vicksburg,Mississippi,USA.
BUZAS-STEPHENS,P.andBUZAS,M.A.,2005.PopulationdynamicsanddissolutionofforaminiferainNuecesBay,Texas. Journalof ForaminiferalResearch,35:248–258.
CAPLAT,C.,TEXIER,H.,BARILLIER,D.,andLELIEVRE,C.,2005. Heavymetalsmobilityinharbourcontaminatedsediments:thecase ofPort-en-Bessin. MarinePollutionBulletin,50:504–511.
CLARKE,K.R.andGORLEY,R.N.,2006.PRIMERv6:UserManual/TutorialPRIMER-E,Plymouth.
DALEV.H.andBEYEL,S.C.,2001.Challengesinthedevelopment anduseofecologicalindicators. EcologicalIndicators,1:3–10.
DAVIES,B.E.,BOWMAN,C.,DAVIES,T.C.andSELINUS,O., 2005.MedicalGeology:perspectivesandprospects.In:Selinus,O., Alloway,B.,Centeno,J.A.,Finkelman,R.B.,Fuge,R.,Lindh,U., andSmedley,P.,Eds., EssentialsofMedicalGeology,1–41.New York:ElsevierAcademicPress.
DEBENAY,J.-P.,PATRONA,D.andGOGUENHEIM,H.,2009.Colonizationofcoastalenvironmentsbyforaminifera:insightfrom shrimppondsinNewCaledonia(SWPacific). Journalof ForaminiferalResearch,39:249–266.
DONNICI,S.,SERANDREI-BARBERO,R.,BONARDI,M.and SPERLE,M.,2012. Benthicforaminiferaasproxiesofpollution: ThecaseofGuanabaraBay(Brazil). MarinePollutionBulletin,64: 2015–2028.
EKENGELE,N.L.,MYUNG,C.J.,OMBOLO,A.,NGOUNOU,N., EKODECK,G.andMBOME,L.,2008.Metalspollutioninfreshly depositedsedimentsfromriverMingoa,maintributarytothemunicipallakeofYaounde,Cameron. GeosciencesJournal,12:337–347.
ELLIS,S.R.1976.HistoryofdredgingandfillingoflagoonsintheSan Juanarea,PuertoRico. U.S.GeologicalSurveyWater-ResourcesInvestigationsReport,38:76p.
ELLIS,S.R.andGÓMEZ-GÓMEZ,F.,1976.HydrologiccharacteristicsoflagoonsatSanJuan,PuertoRico,duringaJanuary1974tidal cycle.U.S.GeologicalSurveyWater-ResourcesInvestigations,38: 52p.
EMRICH,K.,MARTÍNEZ-COLÓN,M.andALEGRÍA,H.,2017.Is untreatedsewageimpactingcoralreefsinCayeCaulker,Belize? JournalofForaminiferalResearch,47:20–33.
FONTANIER,C.,FABRI,M.-C.,BUSCAIL,R.,BISCARA,L., KOHO,K.,REICHART,G.J.,COSSA,D.,GALAUP,S., CHABAUD,G.,andPIGOT,L.,2012.Deep-seaforaminiferafrom theCassidaigneCanyon(NWMediterranean):Assessingtheenvironmentalimpactofbauxiteredmuddisposal. MarinePollution Bulletin,64:1895–1910.
FOSTER,W.J.,ARMYNOTDUCHÂTELET,E.andROGERSON, M.,2012.Testingbenthic foraminiferaldistributionsasacontemporaryquantitativeapproachtobiomonitoringestuarineheavymetal pollution. MarinePollutionBulletin,64:1039–1048.
FRONTALINI,F.andCOCCIONI,R.,2008.Benthicforaminiferafor heavymetalpollutionmonitoring:Acasestudyfromthecentral AdriaticSeacoastofItaly. EstuarineCoastalandShelfScience,74: 404–417.
GESLIN,E.,BARRAS,C.,LANNGLET,D.,NARDELLI,M.P.,KIM, J-H.,BONNIN,J.,METZGER,E.andJORISSEN,F.J.,2014.Survival,reproductionandcalcificationofthreebenthicforaminiferal speciesinresponsetoexperimentallyinduced hypoxia.In:Kitazato H.,andBernhard,J.M.,Eds., ApproachestoStudyLiving Foraminifera,163–193.Tokyo:Springer.
GÓMEZ-GÓMEZ,F.,QUIÑONES,F.andELLIS,S.R.,1983, HydrologiccharacteristicsoflagoonsatSanJuan,PuertoRico,duringandOctober1974tidalcycle:U.S.GeologicalSurveyOpen-File Report82–349,34pp.
GREEN-RUÍZ,C.,RUELAS-INZUNZA,J.andPÁEZ-OSUNA,F., 2005.Mercuryinsurfacesedimentsandbenthicorganismfrom GuaymasBay,eastcoastoftheGulfCalifornia. EnvironmentalGeochemistryandHealth,27:321–329.
GREEN-RUÍZ,C.,2005,Adsorptionofmercury(II)fromaqueoussolutionsbytheclaymineralmontmorillonite. BulletinofEnvironmental ContaminationandToxicology,75:1137–1142.
HESS,S.andKUHNT,W.,1996.Deep-seabenthicforaminiferal recolonizationofthe1991Mt.PinatuboashlayerintheSouthChina Sea. MarineMicropaleontology,28:171–197.
JORISSEN,F.J.,1999.Benthicforaminiferalmicrohabitatsbelowthe sediment-waterinterface.In:SenGupta,B.K.,Ed., Modern Foraminifera, 179–191.Boston:KluwerAcademicPublishers.
KALAIVANAN,R.,JAYAPRAKASH,M.,NETHAJI,S.,ARYA,V. andGIRIDHARAN,L.,2017.Geochemistryofcoresedimentsfrom tropicalmangroveregionofTamilNadu:implicationsontracemetals. JournalofEarthScienceandClimateChange, doi:10.4172/5127–7617.10000385.
KFOURI,P.B.P.,FIGUEIRA,R.C.L.,FIGUEIREDO,A.M.G., SOUZA,S.H.M.andEICHLER,B.B.,2005.Metallevelsand foraminiferaoccurrenceinsedimentcoresfromGuanabaraBay,Rio deJaneiro,Brazil. JournalofRadioanalyticalandNuclearChemistry,265:459–466.
LANGLET,D.,BAAL,C.,GESLIN,E.,METZGER,E.,ZUSCHIN, M.,RIEDEL,B.,RISGAARD-PETERSEN,N.,STACHOWITSCH,M.andJORISSEN,F.J.,2014.Foraminiferalspeciesresponsestoinsitu,experimentallyinducedanoxiaintheAdriaticSea. Biogeosciences,11:1775–1797.
LARSON,R.A.,BROOKS,G.R.,DEVINE,B.,SCHWING,P.T., HOLMES,C.W.,JILBERT,T.andREICHART,G-J.,2015.Elementalsignatureofterrigenoussedimentrunoffasrecordedin coastalsaltponds:USVirginIslands. AppliedGeochemistry,65: 573–585.
LECADRE,V.,DEBENAY,J.-P.andLESOURD,M.,2003.LowpHeffectson Ammoniabeccarii testdeformation:Implicationsforusing testdeformationasapollutionindicator. JournalofForaminiferal Research,33:1–9.
LEE,S.V.andCUNDY,A.B.,2001.Heavymetalcontaminationand mixingprocessesinsedimentsfromtheHumberEstuary,Eastern England. EstuarineandCoastalShelfScience,53:619–636.
LOEBLICH,A.R.andTAPPAN,H.,1987. Foraminiferalgeneraand theirclassification. NewYork:VanNostrandReinholdCompany.
LONG,E.R.,MACDONALD,D.D.,SMITH,S.L.andCALDER,F.D., 1995.Incidenceofadversebiologicaleffectswithinrangesofchemicalconcentrationsinmarineandestuarinesediments. Environmental Management,19:81–97.
LING,S.D.,SINCLAIR,M.,LEVIS,C.J.,REEVES,S.E.andEDGAR,G.J.,2017.Ubiquityofmicroplasticsincoastalseafloorsediments. MarinePollutionBulletin,121:10–110.
LUOMA,S.N.andBRYAN,G.W.,1978.Factorscontrollingtheavailabilityofsediment-boundleadtotheestuarinebivalve Scrobicularia plana.JournaloftheMarineBiologicalAssociationoftheU.K.,58: 793–802.
MARTÍNEZ-COLÓN,M. andHALLOCK,P.,2010. PreliminarysurveyonForaminiferalResponsestopollutantsinTorrecillasLagoon PuertoRico. CaribbeanJournalofScience,46:1–6.
MARTÍNEZ-COLÓN,M.,HALLOCK,P. andGREEN-RUÍZ,C., 2009. Strategiesforusingshallow-waterbenthicforaminifersas bioindicatorsofpotentiallytoxicelements:areview. Journalof ForaminiferalResearch,39:278–299.
MARTÍNEZ-COLÓN,M.andHALLOCK,P. andGREEN-RUÍZ,C. andSMOAK,J.M.,2018.Benthicforaminiferalasbioindicatorsof potentiallytoxicelements(PTE)pollution:TorrecillaLagoon, PuertoRico. EcologicalIndicatorsJournal,89:516–257.
MARTINS,V.A., FRONTALINI,F.,TRAMONTE,K.M., FIGUEIRA,R.C.,MIRANDA,P.,SEQUEIRA,C., FERNANDEZ-FERNANDEZ,S.,DIAS,J.A.,YAMASHITA,C., RENO,R.,LAUT,L.L.,SILVA,F.S.,RODRIGUES,M.A., BERNARDES,C.,NAGAI,R.,SOUSA,S.H.,MAHIQUES,M., RUBIO,B.,BERNABEU,A.,REY,D.andROCHA,F.,2013.AssessmentofthehealthqualityofRiadeAveiro(Portugal):heavy metalsandbenthicforaminifera. MarinePollutionBulletin,70: 18–33.
MARTINS,V.A., SILVA,F.,LAUT,L.L.M.,FRONTALINI,F., CLEMENTE,I.M.M.M.,MIRANDA,P.,FIGUEIRA,R., SOUSA,S.H.M.andDIAS,J.M.A.,2015.Responseofbenthic foraminiferatoorganicmatterquantityandqualityandbioavailable concentrationsofmetalsinAveiroLagoon(Portugal). PLoSONE, doi:10.1371/journal.pone.0118077.
MARTINS,V.A.,YAMASHITA,C.,SOUSA,S.H.M.,MARTINS,P., LAUT,L.L.M.,FIGUEIRA,R.C.L.,MAHIQUES,M.M., FERREIRADASILVA,E.,ALVEIRINHODIAS,J.M.and ROCHA,F.,2011.Theresponseofbenthicforaminiferatopollution andenvironmentalstressinRiadeAveiro(NPortugal)Larespuesta delosforaminíferosbentónicosalacontaminaciónyelestrés ambientalenlaRíadeAveiro(NdePortugal). JournalofIberianGeology,37:231–246.
MATEU-VICENS,G.,KHOKHLOVA,A.andSEBASTIAN-PASTOR,T.,2014.Epiphyticforaminiferalindicesasbioindicatorsin Mediterraneanseagrassmeadows. JournalofForaminiferalResearch,44:325–339.
MURRAY,J.W.,1991. Ecologyandpaleoecologyofbenthonic foraminifera.UK/NewYork:LongmanScientificandTechnical/Wiley,397pp.
PARKER,W.C.andARNOLD,A.J.,1999.Quantitativemethodsof dataanalysisinforaminiferalecology.InSenGupta,B.K.,Ed., ModernForaminifera,71–89.Boston:KluwerAcademicPublishers.
PINTO,E.,2003.Heavymetal-inducedoxidativestressinalgae. JournalofPhycology,39:1008–1018.
PINTO,R.,PATRICIO,J.,BAETA,A.,FATH,B.D.,NETO,J.M.and MARQUES,J.C.,2009.Reviewandevaluationofestuarinebiotic indicestoassessbenthiccondition. EcologicalIndicators,9:1–25.
POAG,W.,1981. EcologicAtlasofBenthicForaminiferaoftheGulfof Mexico.HutchinsonRossPublishingCompany,256pp.
RAO,K.K.andRAO,T.S.,1979.Studiesonpollutionecologyof ForaminiferaoftheTrivandrumcoast. IndianJournalofMarineScience,8:31–35.
SCHAFER,C.T.,COLLINS,E.S.andSMITH,J.N.,1991.RelationshipofForaminiferaandthecamoebiandistributionstosediments contaminatedbypulpmilleffluent:SaguenayFiord,Quebec,Canada. MarineMicropaleontology,17:255–283.
SCHINTU,M.,MARRUCCI,A.,MARRAS,B.,GALGANI,F., BUOSI,C.,IBBA,A.andCHERCHI,A.,2016.HeavymetalaccumulationinsurfacesedimentsattheportofCagliari(Sardinia,westernMediterranean):Environmentalassessmentusingsequential extractionandbenthicforaminifera. MarinePollutionBulletin,111: 45–56.
SCHÖNFELD,J.,ALVE,E.,GESLIN,E.,JORISSEN,F.,KORSUN, K.,SPEZZAFERRI,S., ABRAMOVICH,S.,ALMOGI-LABIN, A.,ARMYNOTDUCHATELET,E.,BARRAS,C.,BERGAMIN, L.,BICCHI,E.,BOUCHET,V.,CEARRETA,A.,DIBELLA,L., DIJKSTRA,N.,DISARO,S.T.,FERRARO,L.,FRONTALINI,F., GENNARI,G.,GOLIKOVA,E.,HAYNERT,K.,HESS,S., HUSUM,K.,MARTINS,V.,MCGANN,M.,ORON,S., ROMANO,E.,SOUSA,S.M.andTSUJIMOTO,A.,2012.The FOBIMO(FOraminiferalBIo-MOnitoring)initiative-Towardsa standardizedprotocolforsoft-bottombenthicforaminiferalmonitoringstudies. MarineMicropaleontology,94:1–13.
SEIGLIE,G.A.,1968.Foraminiferalassemblagesasindicatorsofhigh organiccarboncontentinsedimentsandpollutedwaters. American AssociationofPetroleumGeologistsBulletin,52:2231–2241.
———,1971.Apreliminarynoteontherelationshipsbetween foraminifersandpollutionintwoPuertoRicanbays. CaribbeanJournalofScience,1:93–98.
———,1974.ForaminifersofMayaguezandAñascoBaysanditssurroundings,Part4:relationshipsofforaminifersandpollutionin MayaguezBay. CaribbeanJournalofScience,14:1–68.
———,1975a.LateHolocenechangesontheForaminiferalassemblagesofJobosBayandsurroundings,PuertoRico.AguirrePower Project,EnvironmentalStudiesJobosBayPuertoRicoFinalReport, PuertoRicoNuclearCenter#196.
———,1975b.ForaminifersofGuayanillaBayandtheiruseasenvironmentalindicators. RevistaEspañoladeMicropaleontología,7: 453–487.
SENGUPTA,B.K.,2013.Therootsofenvironmentalmicropalaeontology:earlyinquiriesintomodernforaminiferaldistributions.In:Bowden,A.J.,Gregory,F.J.andHenderson,A.S.,Eds., Landmarksinforaminiferalmicropalaeontology:HistoryandDevelopment, 181–191.London:TheMicropalaeontologicalSociety, SpecialPublications.
SENGUPTA,B.K.,TURNER,R.E.andRABALAIS,N.N.,1996. Seasonaloxygendepletiononcontinental-shelfwatersofLouisiana: Historicalrecordsonbenthicforaminifera. Geology,24:227–230.
SESHAN,B.R.R.,NATESAN,U.andDEEPTHI,K.,2010.Geochemicalandstatisticalapproachforevaluationofheavymetalpollutionin coresedimentsinsoutheastcoastofIndia. InternationalJournalof EnvironmentalScienceandTechonology,7:291–306.
SHARMA,S.andCHATTERJEE,S.,2017.Microplasticpollution,a threattomarineecosystemandhumanhealth:ashortreview. EnvironmentalScienceandPollutionResearch,24:21530–21547.
SMOAK,J.M.,BREITHAUPT,J.L.,SMITHIII,T.J.andSANDERS, C.J.,2013.Sedimentaccretionandorganiccarbonburialrelativeto
sea-levelriseandstormeventsintwomangroveforestinEverglades NationalPark. Catena,104:58–66.
TESSIER,A.andCAMPBELL,P.G.C.,1987.Partitioningoftracemetalsinsediments:Relationshipswithbioavailability. Hydrobiologia, 149:43–52.
TESSIER,A.andCAMPBELL,P.G.C., AUCLAIR,J.C.andBISSON, M.,1984.Relationshipsbetweenthepartitioningoftracemetalsin sedimentsandtheiraccumulationinthetissuesofthefreshwater mollusc Elliptiocomplanata inaminingarea. CanadianJournalof FisheriesandAquiaticSciences,41:1463–1472.
TESSIER,A.andCAMPBELL,P.G.C.,andBISSON,M.,1979.Sequentialextractionprocedureforthespeciationof particulatetrace metals. AnalyticalChemistry,51:844–581.
UNLU,S.,ALPAR,B.,AYDIN,S., AKBULAK,C.,BALKIS,N., BARUT,I.,MERIC,E.,AKSU,A.,andKIRBASOGLU,C.,2006. AnthropogenicpollutioninsedimentsfromtheGulfofGemlik (MarmaraSea,Turkey);Cause-resultrelationship. FreseniusEnvironmentalBulletin,15:1521–1530.
WEBB,R.M.T.andGÓMEZ-GÓMEZ,F.,1998.Synopticsurveyof waterqualityandbottomsediments,SanJuanBayEstuarySystem, PuertoRico,December1994–July1995. U.S.G.S.WaterResources InvestigationsReport 97-4144,69pp.
YANKO,V.,AHMAD,M.andKAMINSKI,M.,1998.Morphological deformitiesofbenthicforaminiferaltestsinresponsetopollutionby heavymetals:implicationsforpollutionmonitoring. Journalof ForaminiferalResearch,28:177–200.
YANKO,V.,KONDARIUK,T.andMOTNENKO,I.,2017.Benthic Foraminiferaindicateenvironmentalstressfromriverdischargeto marineecosystems:ExamplefromtheBlackSea. Journalof ForaminiferalResearch,47:70–92.
ZIMMERMAN,A.J.andWEINDORF,D.C.,2010.Heavymetaland tracemetalanalysisinsoilbysequentialextraction:Areviewofprocedures. InternationalJournalofAnalyticalChemistry,2010:1–7.
ZITELLO,A.G.,WHITALL,D.R.,DIEPPA,A.,CHRISTENSEN,J. D.,MONACOM.E.andROHMANN,S.O.,2008.Characterizing JobosBay,PuertoRico:AwatershedmodelinganalysisandmonitoringPlan.NOAATechnicalMemorandumNOSNCCOS, 76,81pp
APPENDIXA CoreTLCI09Pb-210analysis.
MichaelMartínez-Colónetal:TemporalvariabilityinpotentiallytoxicelementsandbenthicForaminifera,estuarineenvironment,PuertoRico
APPENDIXB
APPENDIXC
CoreTLCI07.PearsoncorrelationmatrixofPTEsofinterest,acid-soluble(carbonate)bioavailablePTEs(F2-bioavailable),TOC,CO3,andmud(N= 29;grey=significantpositivecorrelation;red=significantnegativecorrelation;p<0.05[0.37]).
APPENDIXD
CoreTLCI09.PearsoncorrelationmatrixofPTEsofinterest,acid-soluble(carbonate)bioavailablePTEs(F2-bioavailable),TOC,CO3,andmud(N= 36;grey=significantpositivecorrelation;red=significantnegativecorrelation;p<0.05[0.32]).
MichaelMartínez-Colónetal:TemporalvariabilityinpotentiallytoxicelementsandbenthicForaminifera,estuarineenvironment,PuertoRico
APPENDIXE
CoreTLCI07samplesforaminiferalrawcounts.Graybar:barrensamplesunlessotherwisenoted.**:speciesnotpresentinatleast5%ofthesamples.
APPENDIXF
CoreTLCI07.PearsoncorrelationmatrixofbulkPTEsofinterest,bioavailablePTEs(F2Tess),foraminifers,TOC,mud,CO3,diversityindices,percent deformedforaminifers,andrelativeabundanceofkeytaxa(N=29;gray=significantpositivecorrelation;red=significantnegativecorrelation; p<0.05 [0.37]).S(Speciesrichness).FD(Foraminiferaldensity).H(S)(ShannonIndex).E(EquitabilityIndex).DF(Percentdeformedforaminifers).ARA (A. relativeabundance).QRA(Q. relativeabundance).AmRA(A. relativeabundance).
MichaelMartínez-Colónetal:TemporalvariabilityinpotentiallytoxicelementsandbenthicForaminifera,estuarineenvironment,PuertoRico
APPENDIXG
CoreTLCI09samplesforaminiferalrawcounts.Graybar:Barrensamplesunlessotherwisenoted.
APPENDIXH
CoreTLCI09.PearsoncorrelationmatrixofbulkPTEsofinterest,bioavailablePTEs(F2Tess),foraminifers,TOC,mud,CO3,diversityindices,percent deformedforaminifers,andrelativeabundanceofkeytaxa(N=29;gray=significantpositivecorrelation;red=significantnegativecorrelation; p<0.05 [0.31]).S(Speciesrichness).FD(Foraminiferaldensity).H(S)(ShannonIndex).E(EquitabilityIndex).DF(Percentdeformedforaminifers).QsRA(Q. seminula relativeabundance).ARA(A.beccarii relativeabundance).QRA(Q.rhodiensis relativeabundance).