
EnvironmentalPollution257(2020)113612
Contentslistsavailableat ScienceDirect
journalhomepage: www.elsevier.com /locate/envpol
Foraminiferaasbioindicatorsofwaterquality:TheFoRAMIndex revisited*
MartinaPrazeres a, *,MichaelMartínez-Colon b,PamelaHallock c
a MarineBiodiversityGroup,NaturalisBiodiversityCenter,Leiden,Netherlands
b SchooloftheEnvironment,FloridaA&MUniversity,Tallahassee,FL,USA
c CollegeofMarineScience,UniversityofSouthFlorida,St.Petersburg,FL,USA
articleinfo
Articlehistory: Received31July2019
Receivedinrevisedform 10November2019
Accepted10November2019
Availableonline11November2019
Keywords: Benthicforaminifera Coralreefs Monitoring Environmentalassessment abstract
1.Introduction

Coralreefsworldwidearedegradingatalarmingratesduetolocalandglobalstressors.Thereare ongoingneedsforbioindicatorsystemsthatcanbeusedtoassessreefhealthstatus,thepotentialfor recoveryfollowingdestructiveeventssuchastropicalstorms,andforthesuccessofcoraltransplants. Benthicforaminiferalshellsareubiquitouscomponentsofcarbonatesedimentinreefenvironmentsthat canbesampledatminimalcostandenvironmentalimpact.Herewereviewthedevelopmentand applicationoftheFoRAMIndex(FI),whichprovidesabioindicatormetricforwaterqualitythatsupports reefaccretion.Weoutlinethestrengthsandlimitationsofthe FI,andproposehowitcanbeappliedmore effectivelyacrossdifferentgeographicalregions.
© 2019ElsevierLtd.Allrightsreserved.
Acrosstheglobe,coralpopulationsandreefaccretionhave declinedastheenvironmentalconditionsuponwhichtheydepend havebeendegradedbyanthropogenicactivities.Asaresult,reef managementagenciesarefacedwiththechallengeofmanaging resourcestoincreasetheresilienceoflocalreefstothebroaderscaleenvironmentalchanges.Becauselong-termtrendsinphysicalandchemicalparametersofreefenvironmentscanbesubtle andmaskedbydiurnal,seasonalandinterannualvariability,the necessityforbioindicatorsthatintegrateenvironmentalconditions waswidelyrecognisedbythemid-1990s(e.g. Crosbyetal.,1995; Jacksonetal.,2000).
Evidenceforbothsubtlechangesanddramaticlossesincoral reefcommunitiesemergedinthe1970s.AroundtheCaribbean, growinghumanpopulationswereclearinguplandsforagriculture andcoastlinesforurbanandtouristdevelopment(e.g. Rogers, 1990;Ogden,1996).Withincreased fishingpressureonreef fish, theseaurchin(Diademaantillarum)populationsexploded, increasingreefbioerosion(e.g. Hay,1984;Sammarco,1982),while minimisingmacroalgalgrowth;followedbythediseaseoutbreak
* ThispaperhasbeenrecommendedforacceptancebyDr.SarahHarmon.
* Correspondingauthor.
E-mailaddress: martina.prazeres@naturalis.nl (M.Prazeres).
https://doi.org/10.1016/j.envpol.2019.113612 0269-7491/© 2019ElsevierLtd.Allrightsreserved.
andmassivedieoffoftheurchinsin1983,thathasalloweduncheckedmacroalgalproliferation(Lessios,2016).Ontheclearest offshorereefs,white-banddiseasewasdestroyingstandsof Acropora spp.(Antonius,1977;Bruckner,2016).InthePacific, Crown-of-Thornsstarfish(Acanthasterplanci)outbreakswerebeing documented(e.g. Sapp,1999,andreferencestherein).InKaneohe Bay,Oahu,Hawai’i,inthe1960sand1970s,coralreefswerebeing takenoverbymacroalgaesuchas Dictyospheria.Concernforthe reefspromptedaground-breakingstudyoftheinfluenceof nutrientpollutiononthereefcommunities(e.g. LawsandRedalje, 1979,1982;Smithetal.,1981).Thesestudiesfound,whilemonitoringsewagedischargeintothebay,dissolvedinorganicnitrogen wasrapidlytakenupbyphytoplankton,andthatchlorophyll a,and particulatenitrogenweremuchmoresensitiveandwidelyapplicableindicesofnutrientenrichmentthaninorganicnutrientconcentrations.Moreover,becausethetimeframeforinfluenceon benthicbiomassandcommunitystructureismuchlongerthanfor responseswithinthewatercolumn, LawsandRedalje(1982) concludedthatthebenthosmustbeconsideredwhenassessing theimpactofsewagepollution.
Ataboutthesametime,changesinassemblagesofbenthic foraminiferalshellsinsedimentswererecognisedasindicativeof nutrientpollutionintropicalcoastalwaters(e.g. Hirshfieldetal., 1968;Seiglie,1968,1971).Benthicforaminiferaareprotists,many ofwhichbuildcalciumcarbonateshells,andareacrucial
componentofthebenthos(Murray,2014).Whileassessingimpacts ofatomictestingatEnewetakAtollinthecentralPacific, Hirshfield etal.(1968) observedthatforaminiferalassemblagesweredominatedbylargerbenthicforaminifera,exceptinthevicinityofthe researchlaboratoryoutfall,whereother,fast-growing,smaller, heterotrophicforaminiferaltaxadominated.Insubtropicaland tropicalreefenvironments,reef-associatedlargerbenthicforaminiferaaregenerallydominant,astheyutilisealgalendosymbionts, andhaveenvironmentalrequirementssimilartothoseofreefbuildingcorals(e.g. Hallock,1999;PrazeresandRenema,2019). Moreintenseanthropogenicactivities,suchasagriculturaland sewagepollutionininshorebaysandlagoons,canproducemore extremeconditionsthatbenefitafewstress-tolerantforaminiferal taxa(e.g. Seiglie,1968,1971;Culver,1990;CulverandBuzas,1995). Therefore,foraminiferalabundances,diversityandassemblagelevelsensitivitytoshiftsinwatertransparencyandfoodsources, combinedwiththeirproductionofsand-sizedshellsthataccumulateinthesediments,makeforaminiferanaturalbioindicators ofwaterqualityincoastalenvironments(Alve,1995;Schaffer, 2000).
Theseobservationsofchangesinforaminiferalassemblages withthegradientofavailableorganicmatterprovidedthebasisof the ForaminiferainReefAssessmentandMonitoring (FoRAM)Index of Hallocketal.(2003).TheFoRAMIndex(FI)wasbasedonstudies ofnorthwestAtlanticandCaribbeanforaminiferalassemblagesin sedimentsamples,especiallyPuertoRicoandtheFloridaReefTract. The FI wasdesignedtoprovidearelativelysimple,low-costmetric toassessthepotentialforassociatedhard-bottombenthicenvironmentstosupportcalcifyingorganismsthathostalgalsymbionts,includingreef-buildingcorals.Thisindexisbasedon sedimentsamples,inwhichproportionsofshellsofthreefunctionalgroupsofforaminiferaaredetermined:(1)thelargerbenthic foraminifera(LBF),(2)fast-growing,smallerheterotrophictaxathat requirewell-oxygenatedconditions(OSF),and(3)stress-tolerant taxa(STF)thatcantolerateintermittenthypoxia.The FI was developedtobeacoral-independentmeasuretoprovideresource managerswithameansofassessingwhetherwaterqualityissufficienttosupportreefgrowthorrecoveryaftermajorstressor coral-mortalityevent.Therefore,the FI isnotapplicableinenvironmentsdominatedbymudorvery finesandparticles(<125 mm), suchasestuaries,whereSTFwouldlikelydominate(Hallocketal., 2003).
Sinceitspublicationin2003,the FI hasbeenappliedtoreef environmentsworldwideandhasalsobeenutilisedinmarginal andnon-reefalenvironments(e.g. Hallock,2012,andreferences therein).However,modificationsoftheoriginalmethodsmake comparisonsacrossstudieschallengingand,insomecases, impossible.Moreover,the FI thresholdsproposedforsediments fromtheCaribbeanregioncannotbeassumedtobeappropriate undermodifiedmethodsorinotherbiogeographicregions,suchas thePacificOceanorsouthwestAtlantic.Therefore,wepropose furtherstandardisationofthe FI,andproviderecommendations thatwillallowthebroadapplicationofthisindexasapowerfultool inassessmentandmonitoringprogramsinreefenvironments worldwide.Atthesametime,wenotethatsomevariationsin methodscanprovideusefuldataforlocalstudies,andwefurther explainwhythe FI isnotappropriateinsomesubregionsandreef environments.
Theobjectiveofthispaperistoclarifyandfacilitatetheuseof the FI inreefassessmentprogramsworldwide.Ourgoalsareto:(1) discussexamplesoftheuseandapplicationofthe FI,(2)address importantconsiderationsontheuseofthe FI suchassizerangeof specimensexaminedasafunctionofsieve-meshsizeusedin sampleprocessing,replicatesamplingandnumbersofspecimens counted,live(stained)versustotalassemblages,sedimenttextures,
depthofsamplecollection,andultimately,interpretationof resultingdata;and(3)proposestandardisedprotocolsforthe FI withthegoaltoimproveitsapplicabilityforcoralreefsinthePacific Oceanandotherreefareas,andtoproducecomparabledatathat willleadtowiderapplicabilityofthe FI inassessmentofwater qualityandmonitoringprograms.
2.Theneedforbioindicatorsinshallowcoralreef environments
Inthe1960sintothe1990s,localimpactssuchasincreased terrigenoussedimentationassociatedwithlandclearing,and nutrientinputfromagriculturalrunoffandever-increasinghuman populationsincoastalregions,aswellasoverfishing,were consideredthemajorcausesofreefdegradation(e.g. Pandolfi etal., 2003;Ramos-Scharron,2010;Burkeetal.,2011).Widespreadcoral bleachingeventsassociatedwithstrongElNinoconditions occurredin1982 83and1987,buttheconsequencesofocean warmingwerenotfullyrecogniseduntil1997‒98,whenanElNinoassociatedwarmingofsurfacewatersproducednearlycircumtropicalbleachingandwidespreadcoralmortality.Eventhough oceanwarmingisnowconsideredthemajorthreatfacingcoral reefsworldwide(Hughesetal.,2017),improvementsinwater qualityareconsideredparamounttotheresiliencyandrecovery ratesofreef-buildingcoralsafterbleachingevents(Wooldridgeand Done,2009;MacNeiletal.,2019).
Reefassessmentandmonitoringprogramsgenerallyare designedtoidentifythecausesandconsequencesofthelossof coralcoveronreefs.Thepotentialtodistinguishbetweenlocal(e.g. terrestrialrunoffandnutrification)andglobal(e.g.oceanwarming andacidification)stressors,aswellaspossiblewaystoreducelocal impactstoincreaseresiliencetoglobalstressors,havebecome increasinglyimperative(e.g. Bellwoodetal.,2004;Marshalland Schuttenberg,2006).Interestintheapplicabilityofspecificmarineorganismsasbioindicatorsinresourcemanagementemerged inthe1990s(e.g. Crosbyetal.,1995),withthegoaltoidentifyorganismsthatrespondtoenvironmentalstressorsinarelatively predictablemanner.Samplecollectionshouldberelativelylowcost andhaveminimalimpactonreefresources(Crosbyetal.,1995; Jacksonetal.,2000).Whiledirectmeasurementofwaterquality canprovideinformationabouttheconditionofthewatercolumnat thetimeofsampling,bioindicatorscanprovideatime-integrated measure(daystoyears)oftheeffectsofenvironmentalchanges (Cooperetal.,2009).
‘Waterquality’ isatermcommonlyusedtodescribethe chemical,physical,andbiologicalcharacteristicsofwater,usually concerningitssuitabilityforaparticularpurpose(e.g.drinking, swimming, fishing).However,whattheterm ‘waterquality’ indicatescanbedependentuponavarietyofenvironmentalparameters(e.g.coastalproximity,seasonality,andweather/climate). Incoastalsurfacewaters,waterqualityisrelatedtonutrient flux, whichlargelycontrolsthebiomassofplanktoninthewatercolumn andthereforelightpenetration,foodsupply,benthiccommunities, andbiological-oxygendemandatthesediment-waterinterface. Inspiredbytheobservationsof Hirshfieldetal.(1968) fromEnewetak,resultsfromKaneoheBayreportedby Smithetal.(1981) and LawsandRedalje(1979,1982),studiesofbioeroderabundancesby Highsmith(1981),andpersonalobservationsonboth Indo-PacificandWesternAtlanticreefs,Hallockproposedthat benthic-communitycompositionandcarbonate-sedimentconstituentscanprovideusefulintegratedsignalsofwaterquality(e.g. HallockandSchlager,1986;Hallock,1987,1988a).
Forcoralreefs,appropriatebioindicatorscanprovidespatialand temporalmeasuresoftheeffectsofwaterqualitychangesfrom
periodsofdaystoyears,eventodecadalandmillennialscaleswith theuseofsedimentcores.Asnotedthreedecadesagoby Hallock (1987,1988a) and WilkinsonandCheshire(1988),pre-impact baselinescandifferwidely,evenamongwhatwerethrivingreef systems.Coralreefecosystemsoccuracrossgradientsoftemperatureandsalinity,aswellasvaryinginfluencesofterrestrialrunoff orupwelling,bothofwhichinfluencewatertransparencyand benthiccommunitystructure(Hallock,1987;1988a).Althoughno singlebioindicatorcanbe “ideal” inallcircumstances, Dauvinetal. (2010) explainedthatanenvironmentalindicatorgathersabiotic informationbasedonthebioticandecologicalresponsesofthe organismsstudiedfromauniqueecosystemsetting.Similarly, Hu etal.(2019) arguedthatbioindicatorsareeffective insitu tools neededbyresourcemanagerstoprovidekeyinformationonthe causeandeffectofpollutantsandothermarinestressors.Thus, effectiveenvironmentalmanagementrequiresresearch-based monitoringprogramsthatusebothdirectmeasurementsandbioindicators,thelatterlinkingchangesinwaterqualityparameters withtheconditionofcoralreefecosystems(e.g. Hallocketal.,2004; Cooperetal.,2009;Oliveretal.,2014).
3.Challengesindevelopingsuitablebioindicators
Akeycategoricalaspectofamarinebioindicatorisitsresilience and fitnesstowardsshortand/orlongtermsenvironmental changes. BonannoandOrlando-Bonaca(2018) clearlyarticulated thatabioindicatormustbeabletocapturetheaccumulatedeffects ofpertinentstressorsbeforebiologicalfunctionalityisaltered, whichultimatelywouldhinderanorganismscapacitytorespond predictablytoenvironmentaldisturbances.Thisresonateswith majorchallengesindevelopingabioindicatorinreefecosystems giventhecomplexityofhabitatsandabioticconditionsfoundin theseenvironments.Asnotedby Adey(1978),Kinsey(1981), WilkinsonandCheshire(1988),and Birkeland(1988,1997),reefbuildingcoralsoccuracrossbroadregionalnutrientgradients, fromextremelynutrientdeplete,oligotrophicsubtropicalPacific gyres,totheintermediateconditionsofthesubtropical/tropical northwesternAtlantic/Caribbean/GulfofMexico(henceforth referredtoastheCaribbeanregion),totheupwelling-influenced easterntropicalPacificand fluviallyinfluencedIndonesianand Brazilianreefs. Hallock(1988a) discussedthisgradientsemiquantitativelybasedonwatertransparency,estimatedbythe depthtowhich~1%ofsurfacesolarirradiancecanpenetratesufficientlyandconsistentlytosupportsomezooxanthellatecorals: oligotrophic(>100m),mildlyoligotrophic(~50 100m),mesotrophic(~30 50m),mildlyeutrophic(~10 30m),andeutrophic (<10m).
Fullrecognitionofthesignificanceofregional-scalegradients washistoricallyimpededbyhighcoralcoveracrosssuchregions, especiallyatwaterdepths <10m.Recognitionwasalsohinderedby thepotentialofafewspeciesofcorals,undersuitableenvironmentalconditions,toproducereefswithveryhighcoralcover, thoughwhentheyexperiencedsignificantmortality,bio-erosion andchemicaldissolutiondestroyedreefframeworkatratesthat farexceededaccretionrates(e.g. Smithetal.,1981;Glynn,1988). Highsmith(1981),examiningmuseumspecimensfromdifferent regions,notedsuchgradientsintheabundanceofbio-erodingbivalvesincoralspecimens. Hubbard(1985) suggestedthatbioerosionratescouldexplaindifferencesinaccretionratesbetween PacificandAtlanticreefs.
Directproductionandbioerosionratescanchangealongthose gradients,andalsoalongmorelocalonshore-offshoregradients (Hallock,1988a,2001).Othermembersofthereefcommunities respondtothesamegradients,andassociatedsedimentscan reflectthosedifferences.Incoralreefscharacterisedbyveryclear,
nutrient-poorwaters,LBFarecommonlythedominantproducers ofcarbonatesandandgravel-sizedsediments(e.g. Chapman,1900; Wells,1957;Hallock,1988a).Asnutrientinfluxincreases,bioerodedcoralfragments,calcareousalgalandmolluscandebris (LidzandHallock,2000),andsmallerherbivorousanddetritivorous foraminifera(OSF)becomemorecommoninthesediment (Hirshfieldetal.,1968;Cockeyetal.,1996;Ebrahim,2000;Renema, 2002,2008).Onlyinquiterestrictedlagoonalorestuarineenvironments,inorganic-richanddysoxicconditions,willSTFtaxa thrive;fewifanystonycoralscansurviveinsuchconditions(e.g. Hallocketal.,2003;Carnahanetal.,2009;Cardinietal.,2014; Martínez-Colonetal.,2018).Asaresult,shiftsinbenthicforaminiferalassemblagesfromLBF-dominatedtoOSF-dominatedhave beendetectedandcorrelatedtoincreasesinnutrientinputtocoral reefenvironments.Somecommonreef-dwellingbenthicforaminiferalformsareillustratedin Fig.1
Mostreefmonitoringprogramsinvolveintensive fieldwork, measurementofphysicalandchemicalparameters,andphotographyofbenthictransects,followedbyequallyintensivevisualand digitalanalysesofcommunitycomposition.Unfortunately,while reefmacrobenthoscanrespondquicklytomajorevents,theymay respondslowlytoadeclineinwaterquality,aprocessnow commonlyreferredtoas “phaseshift” (e.g. Done,1992).For example,adultcoralscanpersistunderconditionsthatpreclude recruitment,asbenthicalgaeandspongesproliferateonhard substrata(e.g. Birkeland,1977,1988). Lidzetal.(1985) notedthat thesedimentconstituentsoftheFloridaReefTractreflectmicroandmeiobenthiccommunitystructure,and LidzandHallock (2000) observedincreasedproportionsoffragmentsof “reef rock”,coral, Halimeda,andmolluscshellsconsistentwiththe declineincoralcover. Cockeyetal.(1996) similarlynotedthat proportionsofOSFshellsinFloridareefsedimentshadincreased comparedtoLBF,whichprompted Hallocketal.(2003) topropose thatforaminiferalshellsinthesedimentscanbequantifiedtoyield acommunity-levelbioindicatorofaccretionpotentialinreefenvironments.Relativelysmallsamplescanbecollectedinconjunctionwithestablishedmonitoringprogramswithminimal additionalexpenseandenvironmentalimpact.However,processingandfullyevaluatingsedimentconstituentsorforaminiferal assemblagesinsamplesinthelaboratoryrequirestimeand expertisecomparabletootherassessmentprotocols(e.g. Hallock etal.,2004).Thus,theobjectiveofthe FI wastoprovidean approachthatwouldberelativelyrobustyetreducetheamountof timeandtaxonomicexpertiserequiredforroutineevaluationof foraminiferalassemblagesinreefsediments(Hallocketal.,2003).
4.ThedevelopmentoftheFoRAMIndex
Inreefecosystems,benthicforaminiferaareparticularlyuseful becausetheirlifespans(afewweeksupto~2years)arerelatively shortwhencomparedtoreef-buildingcorals.Assuch,theresponse tochangesinnutrient flux,forexample,canbedetectedinshorter timeframes(Crevisonetal.,2006)whencomparedtothepotential multi-yearresponseofcoralpopulations.Forexample,achangein waterqualitythatisnotdetectableinadultreef-buildingcoralsbut thatreduceslarvalrecruitmentsuccesscanresultinrapidincreases inthepopulationsofshorter-lived,purelyheterotrophicspeciesof benthicforaminifera,resultinginreductionintheproportionsof LBFshells(Hallock,1988b;Cockeyetal.,1996;KelmoandHallock, 2013).Additionally,foraminiferalpopulationscanrecoverwithina fewgenerations,asdemonstratedby Amphisteginagibbosa populationsalongtheFloridareeftractaftertheysufferedamassive bleaching-mortalityeventin1991(Hallocketal.,1995).TheLBFare immunetocoral-specificdiseases(Cockeyetal.,1996),and
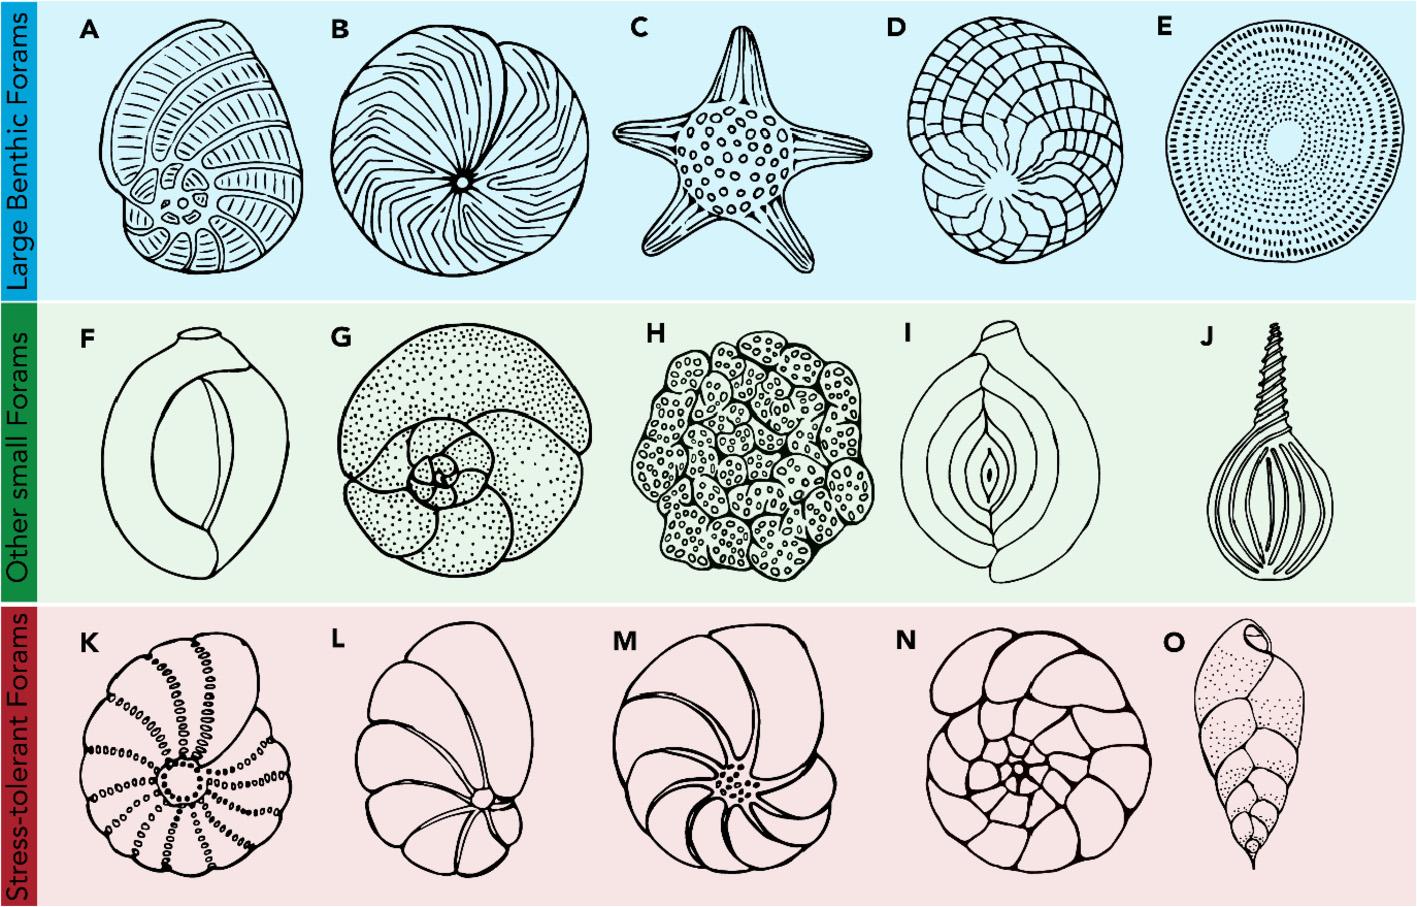
Fig.1. Commonshapesoflargebenthicforaminifera(LBF),othersmallheterotrophictaxa(SFT),andstress-tolerantforaminifera(STF)typicallyfoundinreefenvironments,and usedtocalculatethe FI.EachshapecorrespondstoacommonfamilyofLBF(A E),OSF(F J)andSTF(K O)trophicgroup.LBFspecimensusuallyrangebetween150 mmuptoafew centimetres,whileOSFandSTFarerarelylargerthan500 mm.(A)Peneroplidae,(B)Amphisteginidae,(C)Calcarinidae,(D)Nummulitidae,(E)Soritidae,(F)Hauerinidae,(G) Rosalinidae,(H)Planorbulinidae,(I)Spiroloculinidae,(J)Lagenidae,(K)Elphidiidae,(L)Nonionidae,(M)Haynesinidae,(N)Ammoniidaeand(O)Bolivinitidae.
assemblagecompositionsareminimallyaffectedbycycloneevents oroutbreaksofthecorallivorousCrown-of-Thornsstarfish Acanthasterplanci (Uthickeetal.,2010).Therefore,foraminiferal assemblagescanindicateifambientwaterqualitycansupportreef recoveryviacoralrecruitmentornurserytransplants.
TheSTFincludeforaminiferaltaxathatareadaptedtonatural sourcesofnutrientsfromterrestrialrunoffandaretypically tolerantoflowsalinityanddysoxia(e.g. Carnahanetal.,2009). Thesetaxaareespeciallywell-suitedtoutilisingabundantlabile organicmatteravailableinbothfreshphytoplanktonproduction andsewage.Atnon-reefalsiteswithlocallycompromisedwater quality,relativeabundancesofOSFtaxadeclinerelativetothoseof STF,asshownby Carnahanetal.(2009) and Koukousiouraetal. (2011).Inmostreefsystemsstudiedtodate(e.g. Hallock,2012), theSTFfunctionalgroupisonlyaminorcomponent,ifpresentat all.Thus,themajortrendsareintheproportionsofLBFcompared totheOSF.Theindexasoriginallyproposedisalsosimpleto calculate:
FI ¼ð10 Ps Þþð2 Ph Þþ P0
where Ps ¼ theproportionofLBFshellsinthetotalcountofbenthic foraminiferaltaxainasedimentsample, Ph ¼ theproportionofOSF inthesample,and Po ¼ theproportionofSTFinthesample.The originalabbreviationswere s forsymbiont-bearing(¼LBF), h for otherheterotrophictaxa(¼OSF),and o foropportunistic,later termed “stress-tolerant” (¼STF)by Carnahanetal.(2009). Basedonthisformula, FI valuesrangefrom1 10(Hallocketal., 2003).Thebasicpremiseofthe FI isthatanassemblageof100%OSF givesan FI ¼ 2(Carnahanetal.,2009).PresenceofLBFtaxaraises the FI,whilethepresenceofSTFlowersthe FI fromthatreference value.AnassemblagedominatedbyOSFimpliesthereisabundant food(i.e.autotrophicandheterotrophicprocessespredominate), butnotsomuch(orthereissufficientcirculation)thatbiological oxygendemandintheuppersedimentsbecomeslimiting.Asfresh, labileorganiccarbonbecomesmoreplentifulandoxygenisintermittentlylimitingatthesediment-waterinterface,STFcanthrive suchthat FI valuesdropbelow2.For FI valuestoexceed2,dissolved
nutrientsandorganicmattermustbesufficientlylimitingthatalgal symbiosisissomewhatadvantageous.Giventhefasterturnover ratesofsmallertaxa,waterqualitymustbesufficientlynutrientpooronaveragefortheshellsofsymbiont-bearingtaxatobe relativelyabundant.Thisisthebasisfortheoriginallyproposed FI thresholdsof >4tobeinterpretedaswaterqualitythatsupports reefgrowth,2 4asindicatinganenvironmentmarginalforreef growthandunsuitableforrecovery,and FI < 2indicatingwater qualityconditionsunsuitableforreefgrowth. Hallocketal.(2003) alsonotedthatthe FI insamplesfromhabitatsexperiencing nutrificationoftenvarybetween3and5.Thiscaveatisimportant becauserecognizingtheactualbenthicforaminiferalassemblage representingeachfunctionalgroup(e.g.LBF,OSF)willassistinthe interpretationandassessingthefeasibilityofthe FI outsidethe Caribbeanregion.
Sincethepublicationsby Hallocketal.(2003,2004),widespread assemblageshiftsfromdominancebyLBFtaxainreefsedimentsto anincreasingprevalenceofsmaller,faster-growingOSFhavebeen reported.Althoughthisformulawasdesignedforreefalsediments whereSTFarerelativelyrare,itnonethelessperformedwellasan indicatorofassemblagechangesinnon-reefalsampleswhereLBF occur,includingsamplesfrombaysinFlorida(Carnahanetal., 2009),Australia(NarayanandPandolfi,2010),Greece (Koukousiouraetal.,2011),andBrazil(Barbosaetal.,2016).Insuch environments,trendsin FI valuescanbeusefulindicatorsof nutrification,evenwheretheyneverexceed4.Forexample,as anthropogenicactivitiesinduceeutrophicationthatexpandsthe rangesofthenearshorestress-toleranttaxaattheexpenseofthe othersmallertaxa,theregionofnutrificationexpandssothatthe abundancesofOSFoverwhelmLBFfurtheroffshore(e.g. Carnahan etal.,2009).
5.ApplicationoftheFoRAMIndex
Sinceitspublicationin2003,the FI hasbeenappliedtoreef environmentsinbiogeographicregionsnearlyworldwide.The FI hasalsobeenutilisedinmarginalandnon-reefalenvironmentsin thesubtropicalnorth-andsouthwesternAtlantic,the
Mediterranean,andIndo-Pacific(e.g. Barbosaetal.,2009;Dimiza etal.,2016).Notesonmethodsutilisedandnotableobservations inavarietyofpertinentpapersaresummarisedin Table1. Asnotedby Hallock(2012),becauseLBFtaxadifferbetweenthe AtlanticandIndo-Pacific,andacrossregionswithinthoseoceans, keytaxaand FI thresholdsalsocanbeexpectedtodiffer(Fig.2). Additionally,insomeinstances,the FI isinappropriate.For
Table1
example,inthesouthwestAtlanticoffBrazil,theoccurrenceof uniquemushroom-shapedreefstructures(‘chapeiroes’)occurin somereefareas(e.g. Barbosaetal.,2009,2012).Thesestructures severelylimittheoccurrenceofLBF,asthe finesedimentsthat accumulatebeneaththesestructuresfavoursmallerheterotrophic species(Barbosaetal.,2012).Incontrast,the FI hasbeensuccessfullyappliedinotherareasoftheSouthAtlantic.Intheoffshore
Summaryofmain findingsandmethodologicaldetailsofstudiesthatappliedtheFoRAMIndexsinceitspublicationin2003. #individualsMeshsize(mm)DepthLocationReferenceNotes
150 20063Upto20mFloridaandCaribbean Hallocketal.(2003) ThisstudyproposedtheFI
120þ 637 9mGBR,PacificOcean UthickeandNobes(2008) TestedtheapplicabilityoftheFI formonitoringpurposes;used rarefactionanalyses
200þ 2500.5 3.5mGBR,PacificOcean SchuethandFrank(2008) Usedmediumandcoarser sand-sizefractions,which skewedthedatatowardlarger specimens;detectedlocal trends
150þ 632 20mBrazilianreefs,southwest Atlantic Barbosaetal.,(2009),(2012) FIvaluesinthe ‘chapeiroes’ do notreflecttruestateofcoral coverinthosereefs;very shallowreefsstructures
150þ 63 <10mBiscayneBay,Florida,USA, Caribbean Carnahanetal.(2009) Studiedsubtropicalbay:FI values < 2reflectedareasof pollutionandFIof2 4inopen bayandprotectedestuary
200þ 635mGBR,PacificOcean Uthickeetal.(2010) FIshowedsignificant correlationwithwater-quality parameters
3001250.2 6mEasternMediterranean Koukousiouraetal.(2011) Basedonlivespecimensinalgal samples,whichwasthe predominantsubstratum; locallyusefulcomparisons
AllindividualsNotusedNotgivenColombia, Caribbean
150þ 632 20mBrazilianreefs,southwest Atlantic
Velasquezetal.(2011) FoundhigherFIsatoffshore islandthanincoastalMPAs;no grain-sizeanalysisbutFI > 8 indicateshydrodynamic influence
Oliveira-Silvaetal.(2012) Foundsomeseasonal differencesinFIbetween summerandwintersamples, indicatingseasonal hydrodynamicinfluence
Notgiven63NotgivenGBR,PacificOcean Fabriciusetal.(2012) Reportedsignificantcorrelation ofFIwithwaterqualityon inshorereefs,GBR
60þ 6310 12mKirimati,PacificOcean CarilliandWalsh(2012) AuthorscomparedFI(including rarefactioncurves)forliveand deadassemblages,withhighly significantdifferences.
AllstainedindividualsNotusedSubtidalNorthernBahia,Brazil, southwestAtlantic
KelmoandHallock(2013) Basedonlivespecimens,10 replicates/reef,numbersof specimenscountedpersample notreported,butdataindicate typically >100speciesper replicate Producedlocally/interannually usefulcomparisons
150þ 63 <10mPuertoRico,Caribbean Oliveretal.(2014) Comparedtocoralcoverand sedimentquality;providedbest indicatorofhumanimpact
Allindividuals6313and26mFloridareeftractwestern Atlantic Stephensonetal.(2015) ComparedFIoftotal assemblagesfromrubble(mean 3.6)andsediment(mean5.6) samples
200 500630 40mFrenchPolynesia, PacificOcean Fajemilaetal.(2015) Examinedsedimentsamples acrossabroaddepthrange; grain-sizeanalysiswasnot reported
200 3001255 15mSouthChinaSea,PacificOcean ChenandLin(2017) SamplesdominatedbyOSF, onlytwosamplesFI > 4 (continuedonnextpage)
Table1 (continued )
#individualsMeshsize(mm)DepthLocationReferenceNotes
Allin1gor200 300632 5mBelize,Caribbean Emrichetal.(2017) Sedimentsamplescollected fromthebackreefenvironment. Assessed fixedamountof sediment;numberof specimenspersamplevaried overtwoordersofmagnitude
150 200Notused10mMaldives,IndianOcean Pisapiaetal.(2017) ComparedFIfromreefswith differentmanagementschemes
150þ 635 9mVirginIslands,Caribbean Oliveretal.(2018) FI2.8 6.5,highestoffshore awayfromland-useindicators
Notgiven631 46mGalapagos,EastPacific Humphreysetal.(2018) FIbetween1.2and4.2,most <2
NotavailableNotused3.5 4mNorthernPersianGulf Parsaianetal.(2018) OnlyLBFwasAmphistegina; comparedindustrial(FI > 4) andaquaculturepollution;FI 2 4
150þ Notused6 12mSerranaandRoncadorBanks, southwestCaribbean Sanchezetal.(2019) Reporteddeclineofcoral.FI averaged2.5 3
NotavailableN/A <3mEstuary,TamilNanduCoast, India,IndianOcean NagendraandNallapaReddy (2019) Assessedavarietyof assemblageparameters;FI1 1.45
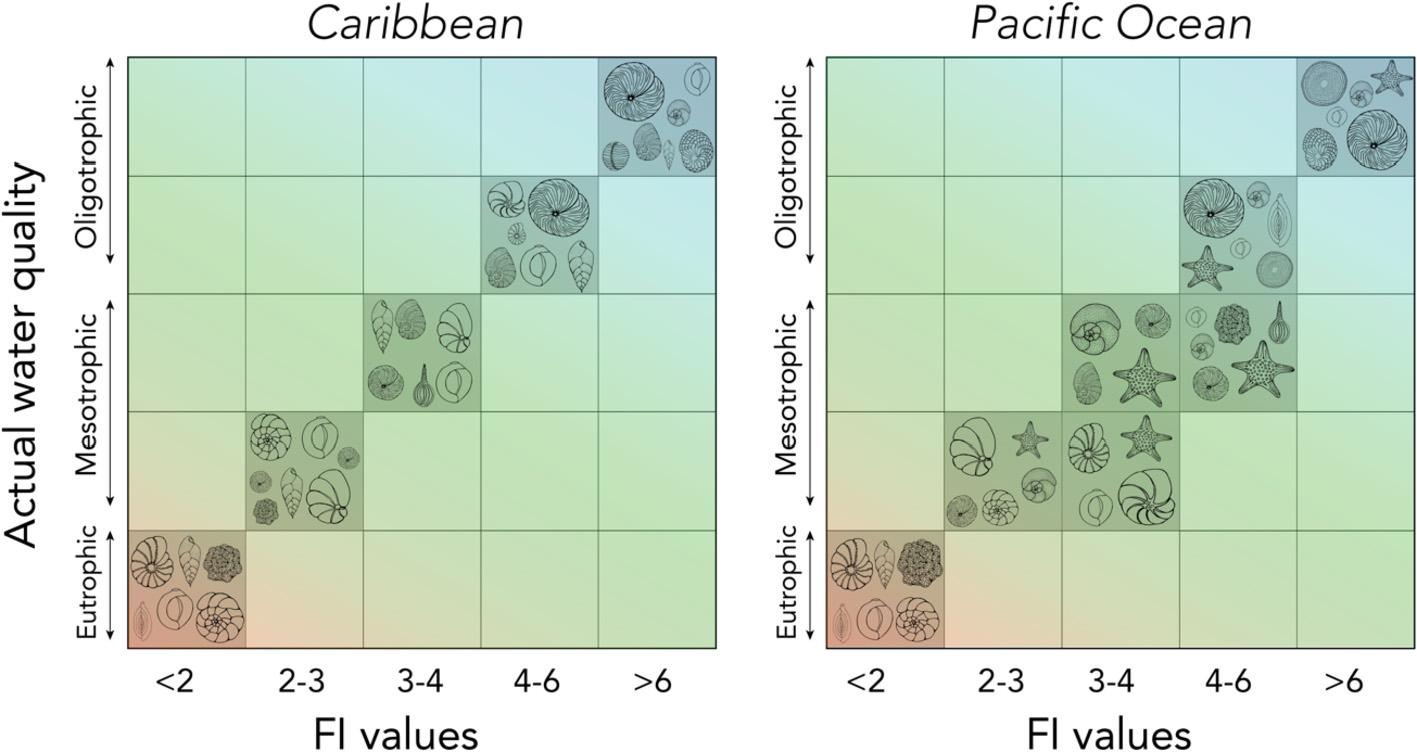
Fig.2. Differencesin FI valuesandinterpretationsofwaterqualitybetweentheCaribbeanandthePacificOcean.Thekindandsizeoftheforaminiferaoutline(picturedin Fig.1) representtrophicgroupsandabundanceofspecies,respectively,expectedtooccuratagiven FI rangeandequivalentwaterquality.ShiftsfromLBFtoSTFdominated-sedimentscan beobservedwhennutrientconcentrationincreasestoeutrophicconditions.However,mesotrophicconditionscanstillsupportabundantLBFcommunitiesinthePacificOcean, skewing FI valuesandmaskingdeclinesinwaterquality.
coralcommunitiesoftheFernandodeNoronhaarchipelago (Barbosaetal.,2012),the FI reflectswaterqualityandiscorrelated withcoralcover.OtherinshorereefsinBrazilshowedaconsistent correlationbetweenwaterqualityandsedimenttexture,andthe FI (Barbosaetal.,2009).Finally,changesinbenthicforaminiferalassemblageshavebeenlinkedtoorganicmatterinputinthelast3kyr,withaconsistentdeclineofLBFinrecentsamples(Almeida etal.,2013).Thisimpliesthat,exceptforreefareaswherethe mushroom-shapedreefstructuresareprevalent,the FI canbe appliedinfringingreefsoftheSouthAtlantic.
IncontrasttotheAtlanticOcean,intheIndo-westernPacific region,LBFspeciesofthefamilyCalcarinidaecandominateshallow reef flats.Forexample, Renema(2010) notedthatcalcarinidsthrive inenvironmentsinIndonesiawheremesotrophicconditionsand algalovergrowthprecludecoralrecruitment.Itispossiblethatthe abundanceofcalcarinidsinthesereefsmightskewthe FI values, howeverthishasnotbeentestedyetforthatregion.Whenthe purposeofdetermining FI valuesisonlyforcomparisonamong samplestoassesstrendsforaspecificarea(e.g.asappliedby Koukousiouraetal.,2011),consistencyinsamplepreparationand
analysesareofprimaryimportance.Insuchcases, FI datacan simplybeusedtoassesstrendsalonggradients.However,to compareresultswithstudieselsewhere,astandardprotocolis necessary.Someoftheconsiderationsthatweaddresshereinclude sizerangeofspecimensexaminedasafunctionofmeshsizeofthe sievesusedinsampleprocessing,replicationandinterpretationof individualsamples,thenumberofspecimenscounted,live (stained)versustotalassemblageanalysis,anddepthofsample collection.
6.Technicalissueswhileapplyingthe FI
Samplingdesign: The FI wasoriginallydevelopedusingsamples fromdepthsof~3 15m.Fordetailedcomparisonsofreefswithin anarea,thestrategyemployedby Pisapiaetal.(2017) canberecommended.Additionally, Pisapiaetal.(2017) successfullyintegratedtheutilisationofthe FI withpre-existingmonitoring programswithoutanycompromise.Theyselectedlocationsofinterestbasedonthemanagementstatusoftheadjacentisland,and thencollectedthreesamplesat~50mintervalsfrom10mdepth
alongthereefslopeateachlocation.Theycouldhavesampledat perhaps5mdepthinsteadof10m,likelywithsimilarresults,given thattheirsamplingdepthisstillwithintherangeproposedbythe FI.If noprior knowledgeofreefsitesorenvironmentaldatais readilyavailable,researcherscanutilisealine-intersecttransect, andsamplescanberandomlyorhaphazardlycollectedalongthe transect,asdescribedin Stephensonetal.(2015)
Samplingsedimentsanyshallowerthan~3mdepthrisksbias towardsveryhighlysortedsedimentsinhigh-energyenvironments,andverymuddysedimentsinshelteredenvironments(e.g. Mosesetal.,2017).Also,itisimportanttoconsiderthereef’s rugosity.Forexample,insouthernPuertoRico,thefringingreefsof JobosBayaresmall,andwithina100-mtransectthewaterdepth canrangefrom2to10m.Thehighrugosityofthesereefsandthe associatedhigh-energyenvironmentproducescoarse-grained sedimentswhereforaminiferaldensityanddiversityarelowand LBFarerelativelyabundantandabraded(MM-C,per.observations) yieldingbiased FI values.Similarly,samplingdeeperthan~10m, sometimesevenshallower,inlagoonalenvironmentsmayyield samplesdominatedby finesedimentsandOSF.Moreover,reef flats andshallownearshoreenvironmentscanbeproblematic.Evenin quiteturbidwaters,sufficientlightcanpenetrate,atleastduring lowertideorcalmconditions,forsomeLBFtothrive,including A.angulatus intheCaribbeanregion,and Neorotaliagaimardi and Calcarinahispida inthewesternPacificregion.
Replication: Thenumberofreplicatesexaminedhasalsovaried amongstudies.Samplereplicationallowsresearcherstocontrolfor stochasticfactors,whichcaninfluenceresultsandsubsequent interpretation(Hurlbert,1984).Replicationisalsocrucialto determinevariabilityamongsamplesandaccountforpatchiness (Murray,2006).Higherlevelsofreplicationincreasesampling sensitivity,allowinginterpretationsofrandomvariationsor ‘noise’ , increasingtheprecisionofanestimateofthemeanofatreatment orthedifferencebetweentwotreatments(Hurlbert,1984).Samplingdesignsarealsocriticaltoanalyses.Forexample,ifcomparing samplesfromatransectinapotentiallyimpactedareawithsamplesfromareferencetransect,thesetofsamplesfromeachtransect canrepresentreplicates.Moreover,nosinglesampleshouldbe interpretedinisolation;outliersshouldbeidentifiedandcanbe useful.Forexample, Emrichetal.(2017) detected “hotspots” of pollutantsandrecognisedlikelygroundwaterseepageonareef flat inBelize.Asderiveddatasuchas FI valuesaregenerallynonnormallydistributed,mediansofreplicatesmaybemoreappropriatethanmeansforcomparisonsamongsitesorstudies.
Howareplicateisdefined,andthenumberofreplicatesused canbeproblematic. Hallocketal.(2003) didnotaddresstheissueof replicatesamplesdirectly,astheywerecomparingtrendsinmultiplesamplescollectedoverseveraldecadesandalongonshoreoffshoretransects.FortheFOBIMO, Schoenfeldetal.(2012) recommendedamandatorythreereplicatespersamplingsite. Oliver etal.(2014),assessingresponsestosedimentcontaminationand humandisturbance,surveyed24sitesforavarietyofresponse parameters.Threesedimentsamplesforgrain-sizeand FI analyses werecollectedalongtransectsateachsite.The FI producedthe strongestnegativecorrelationswithproxiesforanthropogenic disturbancesamongthereefbiotaassessed(Oliveretal.,2014).
Thequestionofthenumberofreplicatesiscloselyrelatedtothe numberofspecimenstocount.Threereplicatesamplesof~100 specimenspersampleprovidemorestatisticalpowerthan300 specimensfromonesample(e.g. HayekandBuzas,2013).Similarly, counting100specimensfrom fivereplicatesamplesshouldprovide morepowerthan150 200specimensfromeachofthethree replicates.However,becausesamplepreparationisrequiredfor bothgrain-sizeanalysisand FI analysis,inacost/benefit
consideration,thebenefitofcounting fivereplicatesamplesof~100 specimensversus~150fromthreereplicateswouldlikelybelostin theadditionalsamplepreparationtimefor fivesamplesversus three.Additionally,giventhat FI studiesshouldbebasedonthe interpretationoftheproportionaldistributionofthedominanttaxa withintheLBF,OSF,andSTF,countsaslowas100specimensper samplecanbesufficient(e.g. FatelaandTaborda,2002).
Meshsizeandsedimenttexture:Standardproceduresforpreparingsedimentsamplesforanalysisofforaminiferalassemblages includetheremovalof finesedimentsanddebrisusinga fine-mesh sieve.Meshsizeisamajorcontroversy,asdiscussedby SenGupta etal.(1987),subsequentlyby Schonfeldetal.(2012) regardingthe developmentoftheFOBIMOprotocols(softandmuddysediments), andinapplicationsofforaminiferalindicessuchasForam-AMBI (Alveetal.,2016;Jorissenetal.,2018).Meshsizescansignificantlyinfluenceresultsbecauseforaminiferarangefrom~40 mmto asmuchasafewcentimetresindiameter.Theoriginalstudies, uponwhichthe FI thresholdinterpretationswerebased,used 63 mmmeshsieves,whichremovesilt-andclay-sizedparticles(i.e. mud)whileretainingallsand-sizedparticles.Useofa125 mmmesh sieve,whichalsoremovesvery finesand-sizedparticles(e.g. Koukousiouraetal.,2011),ismoretime-efficient,asiteliminates small “juveniles” thatareoftendifficulttoidentify(Schoenfeld etal.,2012).Moreover, Hallocketal.(2003) recommended includinganalysesofsedimenttexture,assamplesthatarepredominantlycomposedofvery finesedimentscanexhibitasorting biasthatskewsthe FI valuesto3orless(Hallocketal.,2003).This approachiscriticalsincesedimenttextureplaysaroleinforaminiferalassemblagedistributions(e.g. Emrichetal.,2017;MartínezColonetal.,2018).
Useofcoarsersievesizescanskew FI datatoanomalouslyhigh values,asLBFspeciestendtobelarger(>500 mm)thanmostOSF andSTFtaxa.AdultLBFspeciescanreachsizesthatareanorderof magnitudelargerthansomesmallerspeciesthatoccurinreefenvironments(Hallock,1999). SchuethandFrank(2008),usingasize fraction >250 mm(mediumandcoarsesand),reportednosupport foroveralllowwaterqualityintheLowIsles,intheGreatBarrier Reef(GBR),basedonthe FI,detectingonlylocalpollutionsources. Thisreefareaishistoricallyimpactedbyterrestrialrunoffand presentshighturbidity,whichincreasedfollowingEuropean colonisationofthecoastofQueensland(WolanskiandSpagnol, 2000)andischaracterisedbyalowhard-coralcoverandsubstantialphytalsubstrata(FrankandJell,2006).Examiningonly mediumandcoarsersandfractionscanresultinunderrepresentationofsmallerheterotrophicspecies(Schonfeldetal.,2012; Hallock,2012).
Anotherconsiderationforwhatsizefractiontoexamineisthe intendedanalysesofthesamples.Iftheyareonlytobeassessedfor the FI,thenwerecommendtheuseofmeshsize >125 mm.However, ifdetailedassemblageanalysesareplannedinadditiontodetermining FI (e.g. Carnahanetal.,2009;Koukousiouraetal.,2011), considerationofthesizerangesusedinotherstudiesisessential,as speciesdiversityandothercommonassessmentmetricsalsoare stronglysize-dependent(Murray,2006).Thedifferencesbetween theuseof63and125 mmmeshsievesshouldnotproduceserious discrepanciesinthe FI,asthe125 mmfractionwillretainmost smallertaxainadditiontoLBFspecies.However,additionalworkis neededtoassesshowthe FI differsbetweenstudiesusing63 mm and125 mmmeshsieves.Suchstudiesmayrecommendmodified FI thresholds,correctionfactors,orevenamodifiedformula,to accommodatereducednumbersofsmallertaxainanalysesusing 125 mmmeshsieves.
Somestudiesofforaminiferalassemblagesalsosieveoutthe coarsersedimentfraction.Forexample,someresearchershave
examinedonlythe fineandmediumsizefraction(125 500 mm). Thatsize-rangecanbeusefulforlocalcomparisonsoftrends,but cannotbecomparedmorewidely.Forsamplesthatmaycontain foraminiferaltaxahostingalgalsymbionts(orthatencrustphytal substrata),anuppersievesizeshouldbeatleast2mm(transition fromsandtogravel),andtheresultingcoarsefractionshouldbe scannedforlargeforaminiferalshells.
Samplesizeandprocessing:Anothertypicaldiscrepancythatcan limitcomparisonsacrossstudiesisthenumberofspecimens identifiedpersample. Hallocketal.(2003) suggestedtheuseofa1gsedimentsample,andsubsamplingbetween150and200specimens,orallwell-preservedforaminiferalshellsinthe1gsample,if necessary.Reportingthenumbersofspecimenspergramofsample,toprovideinformationonabsoluteabundance,isessential.Ifa 1gsamplecontainsfewerthan50identifiableforaminiferalshells, thesampleshouldnotbeincludedinthe FI assessmentbutshould benotedasverylowdensity.Incontrast,ifsamplescontainover 1000individualsper1-gofsediment,thentheycouldbesubsampled,tomaintaintheapplicationofthe FI astime-efficient butstillrobust.
Moststudieshaveexaminedbetween150and300specimens persample(Table1). UthickeandNobes(2008) and Carilliand Walsh(2012) countedfewerspecimenspersample,basedupon rarefactioncurvesofspeciesaccumulation(e.g. Ludwigand Reynolds,1988;Colwelletal.,2004).Moreover,themaingoalof thestudyby UthickeandNobes(2008) wastodeveloparapidindicatormethodtoassesswaterqualityatawholereeflevelinthe GBR.Somestudiesdidnotreportthetotalnumberofspecimens countedpersample(e.g. Fabriciusetal.,2012;Velasquezetal., 2011),thuslimitingthepotentialforcomparisonwithother studies.
Hallocketal.(2003) notedthatidentificationtogenuslevel requirescountingfewerindividualspersamplethanstudiesidentifyingtospecies(e.g. Buzas,1990).Thenumberofspecimens necessarytocapturediversityvariesregionallyandamongreef environments.Thus,ifdiversityindicesarebeingassessedalong withotherparameters,apreliminarysurveyonthetotalnumberof individualstocapturediversityshouldbeconductedusingrarefactioncurves.However,capturingdiversityisnotessentialfor routineuseofthe FI asabioindicator,socountingfewerspecimens canbemorecost-effective,asnotedby UthickeandNobes(2008)
Live versus totalassemblage: Thespecimensthatwerealiveina samplewhencollected,asindicatedbyavitalstainoralgalsymbiontcolour,reflectstheforaminiferalresponsetolocal-scale environmentalconditionsinthedaysorweeksimmediatelyprecedingsamplecollection(e.g. Buzasetal.,2002).Thedead assemblagerepresentsthesuccessiveaccumulationofgenerations offoraminiferalshellsoversometimedependingonspeciesproductionandtaphonomicfactors,suchaspost-mortemdestruction, sortingandredeposition(Schonfeldetal.,2012).Whilemost studieshaveanalysedtheabundanceofbenthicforaminiferaand calculated FI fromtotalassemblages(Table1),somestudies assessedlivespecimensandcalculated FI valuesbasedonthose datasets(e.g. CarilliandWalsh,2012;KelmoandHallock,2013). Thetotalassemblage(dead þ live)datareflecttheoverallenvironmentalconditions,whiletheliveassemblagedataprimarily revealtheresponseofforaminiferatorecentlocalconditions (Buzasetal.,2002). CarilliandWalsh(2012) foundmajordifferencesbetweentheaverage FI valuecalculatedforlive(4.6)and dead(9.1)assemblagesatreefsitesinKiritimatiIslandaffectedby anthropogenicimpacts.Theyattributedthedifferencestoincreases innutrientpollutionand fishingpressureinrecentdecades. Kelmo andHallock(2013) examinedonlylive(stained)specimensin sedimentscollectedannuallyover17years.Althoughthecalculated
FI valueswereconsistently <4,theinter-annualchangesinlive foraminiferalassemblagesandcorresponding FI valueswere consistentwithchangesinrainfalland fluvialrunoffassociated withElNino-SouthernOscillationcycles.Bothofthesestudies revealedthatuseofthe FI conceptprovidedimportantinsightinto environmentalchanges,despitethedeviationfromoriginallyproposedprotocols(i.e.evaluationofliveassemblages).
Intheory,assessingliveassemblagesshouldbeidealtoassess ongoingenvironmentalconditions.However,sincelivingspecimenstypicallymakeuponlyasmallpercentageoftheassemblage inreef-sedimentsamples,distinguishingandidentifyingadequate numbersrequiresasmuchas20timeslonger,greatlyincreasing thecostofsampleanalysis.Nevertheless,stainingofsamplescan stillbeconductedifresearcherswishtoidentifyliveindividualsin thetotalassemblage,andiftheabundanceoflivespecimens changesovertime,forexample.Inpractice,assessmentofliveassemblagesrequiresnotonlystainingofsamples,butacompletely differentsamplingstrategy.Relativelyfewshallow-water (e.g. < 20m)reef-associatedforaminiferaliveinsediments,but ratherliveonhardorphytalsubstrata,asnotedabove. Stephenson etal.(2015) comparedforaminiferalassemblagesfromsediment andreef-rubblesubstrata,concludingthatdiversityofheterotrophicgeneraishigheron firmsubstratethaninsediments.Moreover,becausesedimentscanbeintermittentlystabilisedby filamentousalgalmats,theforaminiferathatcanrecruitand completetheirlifecyclesinsuchenvironmentstendtobesmall, fast-growingspecies. Donnelly(1993) studiedthelive(stained)and totalassemblagesfromreef-rubbleandsedimentsamplescollected offsouthwestPuertoRicoin1985,documentingthatliveindividualsaccountedfor~15%ofspecimensfromrubblesamples and <3%ofspecimensfromsedimentsamples.Andwhilethe numberofspeciesidentifiedfromrubblesamples(211)wasstatisticallyidenticaltothenumberfromsedimentsamples(215),the numberofspeciesidentifiedaslivefromrubblesamples(124)was 55%morethanthenumberofspeciesfoundliveinsediment samples(80).
Inanidealtotalassemblage,theproportionsofallspecieswould bethesameasinthelivingassemblage.However,avarietyof environmentalandlife-historyprocessesproducethedisparities commonlyobservedbetweenthelivingandtotalassemblages,and betweentherubbleandsedimentassemblages(e.g. Donnelly, 1993;Stephensonetal.,2015). Renemaetal.(2013) notedthat short-livedtaxacanproducefarmoreshellswithinagivenperiod thanlong-livedtaxa(i.e. r versus k-strategists). Crevisonetal. (2006) observedseasonaldifferencesintheproportionsoftaxain sedimentsamples,withahigherproportionofLBFshellsinspring samples,followingwinterandspringstormconditionscompared withsamplescollectedinlatesummer/earlyautumnfollowing summerconditionsunderminimalstormactivityandmaximum algal-matstabilisation. Barbosaetal.(2016) alsofounddifferences betweensummerandwintersamplesfromBrazilianreefs.Thus, seasonalitymustbeconsideredindevelopingsamplingstrategies; studiesthatspanmultipleyearsshouldcollectsamplesduringthe sameseasoneachyear.
Additionally,insedimentsthathavebeenhistoricallydominatedbyLBF,theretentionofforaminiferalshellsissuchthateven wherewaterqualityisobviouslyindecline,thesedimentscanstill bedominatedbythesespecies(e.g. CarilliandWalsh,2012).This issuecanbeespeciallyproblematicinhigh-energyenvironments suchasbeaches(Hallock,2012).Moreover,suchsedimentscanbe transportedintootherhabitats,especiallydownslopeonshelf margins(BriguglioandHohenegger,2011).Thus,assemblagescan becomprisedofamixofmodernandrelictmaterial(Renemaetal., 2013),andlong-termstorageofsedimentsinareassuchasreef flats
canoccur(DawsonandSmithers,2014;Nageletal.,2016).Allof thesecomplexitiesfurtherindicatethatbaselinestudiesusing multivariateanalysesapproachesshouldbecarriedoutinpreparationforwider-scaleortemporalimplementationofassessments focusingonamoresimplifiedstrategyutilisingthe FI
Whethertoassessliveortotalassemblagesshouldbedeterminedbythegoalsofthestudyandresourcesavailable.Ifthe purposeistoassessongoingenvironmentalconditionssuchas seasonalorinter-annualcycles,theliveassemblageshouldbeused. However,theinterpretationthresholdsmustberecalibrated because FI valuesassessedfromliveassemblagesarelowerthan valuesfromtotalassemblages(e.g. CarilliandWalsh,2012;Kelmo andHallock,2013;Stephensonetal.,2015).Ifthegoalistodecipher theintegratedsignaloverrecentyearsordecades,thetotal assemblagecanprovidethatinformation.Wecanfurtherrecommendthatassessingtheliveassemblagesonreefrubbleorphytal substratescanindicateconditionspresentatthetimeandimmediatelybeforesampling,whilethe FI basedonthetotalassemblage fromsedimentsprovidesatooltoassessthecombinedeffectsof naturalandanthropogenicstressorsovertime.
Classificationlevel:Indesigningaprojectinwhichthe FI willbe assessed,investigatorsmustdecideonthetaxonomicorfunctional leveltowhichforaminiferalspecimensareidentified.Theoriginal intentionofusingthreefunctionallevels(i.e.LBF,STF,andOSF)was toprovidealowcost,rapid-assessmentmethodforwhichtechnicianscouldbereadilytrainedtoidentifyforaminiferalspecimens foreachofthosecategories.Withtheuseofacountingdeviceanda stereo-microscope,atechniciancouldassessmultiplesamplesper day.However,theapplicationofthe FI asalow-cost,low-technologyassessmenttool,asoriginallyintendedbasedonfunctional groups,hasnotyetbecomereality,withtheexceptionofasingle study(e.g. Pisapiaetal.,2017).Instead,mostapplicationsofthe FI todatehaveincludedbroaderfaunalassessmentsandmultivariate analysisofassemblages.Thus,theforaminiferalspecimensin sampleshavebeenidentifiedeithertogenusorspecieslevel.The advantageofthebroaderassessmentsistheextractionofmore detailedinformationregardingforaminiferalassemblages.The disadvantageisthatthetimerequiredtoassesseachsampleto genuscanbeatleastthreetimeslonger,andtospeciesupto five timeslonger.Theclassificationofbenthicforaminiferalshellsto genuslevelefficientlygeneratesreliabledata.
Studiestodatethathaveutilisedmultivariateanalysesofforaminiferalassemblageshaveprovidedinsightintowhattaxatendto occurtogetherinalocalityorregion.InareassuchastheCaribbean, BrazilianandAustraliareefs,thereef-associatedforaminiferalassemblageshavebeenreasonablywellstudied(e.g. Cockeyetal., 1996;UthickeandNobes,2008;Barbosaetal.,2009,2012;Oliver etal.,2014;Emrichetal.,2017).Thus,taxathataresufficiently abundanttosignificantlyinfluencethe FI arewellknownand anomaliesusuallycanberecognised.Ideally,beforeapplyingthe FI asanassessmenttoolinanewarea,foraminiferalassemblages shouldbewelldefinedusingmultivariateanalysesthatgroupby taxa(e.g.r-modeclusteranalyses,multidimensionalscaling,or someformoffactor-basedmultivariateanalysis),whichcanpromoteunderstandingoftheforaminiferalfaunaandthemagnitude oftheinterrelationshipsamonggenera/species.Ifassessmentsare beingcarriedoutbytechniciansjustlearningaboutforaminiferal assemblages,theyshouldbesupervisedoratleast,aspecialist consultantshouldbeavailabletodiscussanomalies.However,an advantageofusingsedimentsamplesisthattheyarereadily archivedandcanbequalitycheckedatspecificintervalsandif anomalousresultsarenoted.
AmajorconcernregardsthepresenceofcalcarinidsintheIndoPacificregion,wherespeciescanreachhighdensitiesevenin mesotrophicreefs(e.g. Renema,2010).Thisisbecausesomespecies
ofthefamilyCalcarinidaethriveepiphyticallyonavarietyof macrophytes,especiallycorallineredalgae(bothcrustoseandnoncrustosetaxa),calcareousgreenalgae, filamentousalgae,some macroalgae,andseagrasses(e.g. Renema,2010).Inareaswhere bleaching,disease,overfishingofherbivorous fish,orotherimpacts havereducedcoralcover,aslongasthereissufficientsunlight, somecalcariniddensitiesincreaseasalgalcoverincreases.Therefore,calibrationofthe FI fortheIndo-westPacificregionwherethe Calcarinidaeoccurisneeded,especiallywherealgalcoverisvisuallyhigherthancoralcover.
7.Towardsastandardisedprotocol
Theoriginalgoalofthe FI wastoprovidearapidandcosteffectiveassessmenttoolofwaterqualityincoralreefecosystems (Figs.2and3).Modifiedapproachesappliedbysomeresearchers havedemonstratedhowthe FI canbeusedtoreveallocalgradients ortemporalchanges(e.g. Koukousiouraetal.,2011;Carilliand Walsh,2012;KelmoandHallock,2013),whicharelegitimateapplications.Inothercases,regionalcharacteristicsofthereefscan resultin FI valuesthatarenotuseful,evenlocally.Thesuccessofan environmentalindicatorisbasednotonlyonitsapplicabilitybuton howwellprotocolsaredesignedandcommunicated.Withinthe Caribbeanregion,becausetheforaminiferalassemblagesarewell knownandrelativelypredictable,the FI shouldbedirectlyapplicabletototalassemblagesfromsedimentsinmostareas.However, ifthegoalisforspecificindexvaluestobecomparableacross studiesandregions,futureapplicationsofthe FI shouldconsider thefollowing:
(1)Theprocessofcollectionofsmallsamplesofsurficialsedimentsintosmallvials,bagsorminicoresissimpleand straightforward.However,wheresamplesarecollectedcan limittheirusefulness.The firstconsiderationissampling depthandexposuretowavesandcurrents. Hallock(2012) recommendeddepthsnoshallowerthan~3m,especiallyin veryhighenergyorverylowenergyenvironments,andno deeperthan~15m,withthe5 10mrangepreferred.
(2)Aminimumofthreeindependentreplicatesamplesshould beused,preferablyalongatransectasdescribedby Pisapia etal.(2017)
(3)Sedimenttextureplaysaroleinthepatchinessofforaminiferaldistributions,sothatsortingisaninherentproblem (e.g. Ramirez,2008).Applicationofthe FI shouldinclude grain-sizeanalysisandsamplesthatarewell-sorted,very coarse(>2mm)sedimentsshouldbeexcludedfrom FI analysis,asshouldsamplesthatarepredominantlymud (<63 mm).Also,formulti-yearmonitoringprojects,samples shouldbetakenwithinthesameseasoneachyearandnot immediatelyaftermajorstormevents.Aroundthesummer solsticecanbeoptimuminsubtropicalregionssuchas Florida,asitisafterthedirectinfluenceofwinterstormsand beforelatesummerwheneitherprolongedcalmweatheror tropicalstormstendtooccur.
(4)Towashoutmudand finesandsbeforeforaminiferal assessment,sievemeshof125 mmcangeneratesreliableand time-efficientresults.Useof125 mmmeshalsocanreduce theproblemofsamplesdominatedbyvery finesandsand muds.Thismeshsizeisalsorecommendedforotherprotocols(e.g.FOBIMO,Foram-AMBI)utilisingbenthicforaminiferaasbioindicatorsofenvironmentalchange(Schonfeld etal.,2012;Alveetal.,2016;Jorissenetal.,2018).However,becausetheoriginal FI thresholdswerebasedonsamples sievedover63 mmmesh,previouslypublishedassessment thresholdslikelywillneedtobemodified.
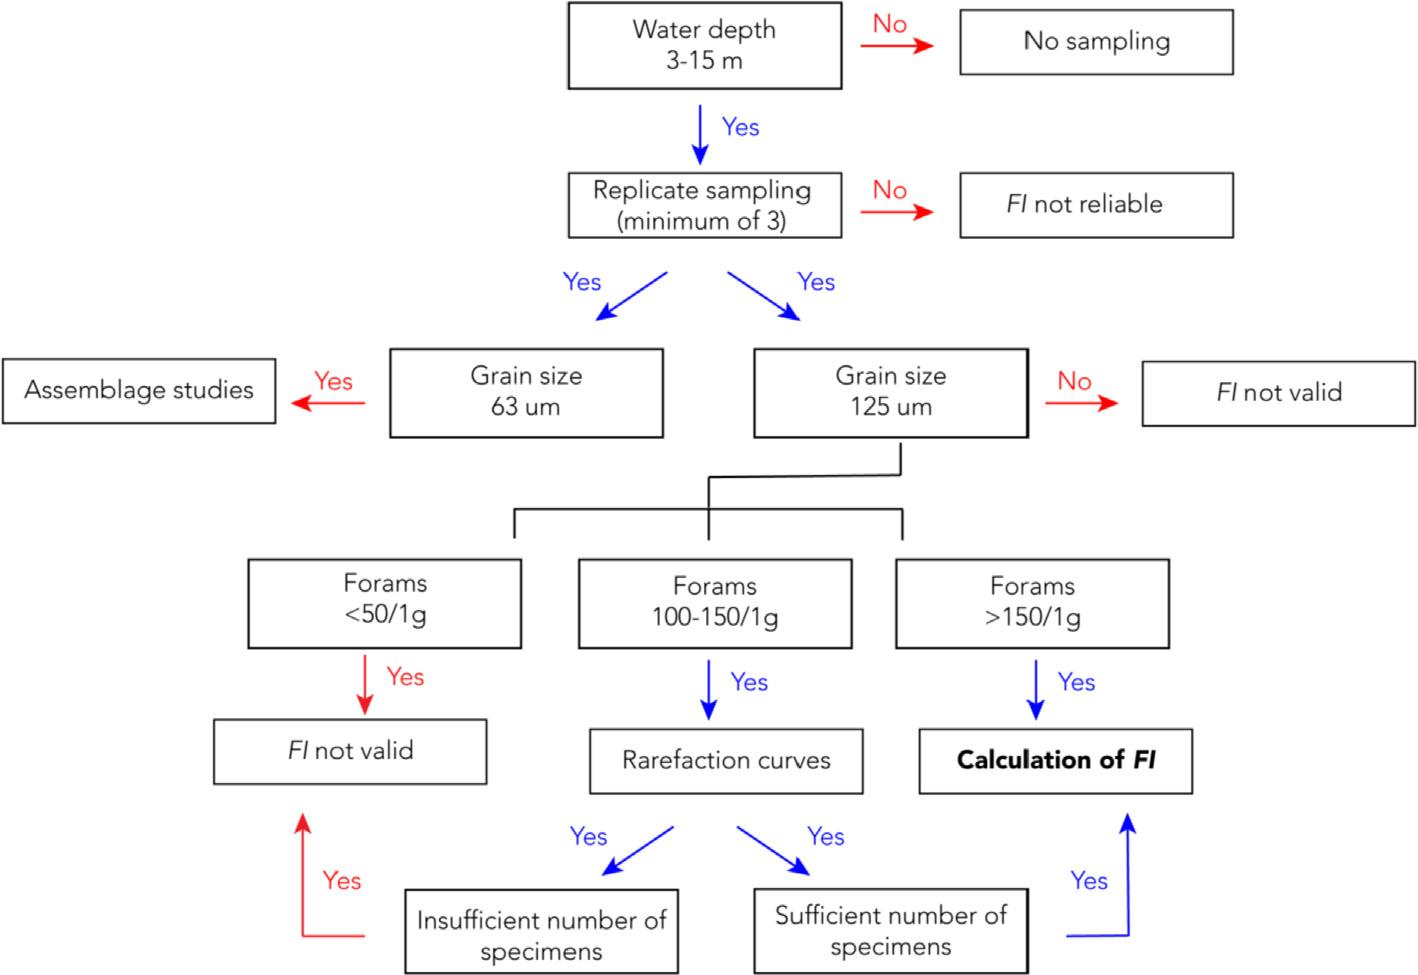
Fig.3. Quickguideforthecollectionandprocessingofsedimentsamplesforthecalculationofthe FI.Redarrowsdenoteimpossibilityof FI calculation,whereasbluearrowsmean thatresearchercanproceedtonextstep.Thegreenarrowstandsforthealternativepossibilityof FI calculation.
(5)Recordingthenumberofforaminiferalshellspergramof sedimentisessentialforinter-samplecomparisons,atminimumtoanorderofmagnitudeestimate(e.g.rare~101/g, common~102/g,abundant~103/g),especiallyincoarser samplesorsampleswithterrigenouscomponents(e.g. quartzsand).
(6)Assessmentofallrelativelyfresh-appearingforaminiferal shellsinsedimentsamples(i.e.totalassemblage)isrecommendedforbasicanalysesasresultingassemblagescan providereliableinformationonbothshort-andlong-term impacts,andshouldberegionallycomparable.Badly brokenorpossiblyreworkedspecimensshouldnotbe includedin FI calculations.
(7)Ifpreviousforaminiferalassemblagestudiesareunavailable fortheareaorspecifichabitatofinterest,apreliminarystudy comparingreferenceandimpactedsites,usingfullassemblageidentificationfollowedbymultivariateanalyses,is recommendedtodeterminespeciesthattendtoco-occur andunderwhatenvironmentalconditions,todetermine whattaxatocountineachofthethree FI categories.Alternatively,thecollectionofsedimentorreef-matrixcores couldalsoprovidebaselineinformationtoanalyselocal changesinforaminiferalassemblages(e.g. Reymondetal., 2013).
(8)Arecommendedminimumof150foraminiferalspecimens shouldbeidentifiedandclassifiedtoafunctionalgroupin eachsample.Foreachsamplingstation,the final FI willbe calculatedastheaverageamongreplicatesamples.Ifless than100individualsarefoundin1gofsedimentsamples, theFIcanstillbeapplied,butrarefactiontestsshouldbe carriedouttoverifythereliabilityofassessing100specimens(orpossiblyfewer,see CarilliandWalsh,2012).This approachcanreducethephysicalandmonetaryinvestments bystakeholdersandend-userswhoareinterestedin implementingthe FI intotheirshortorlong-termenvironmentalassessmentefforts.
(9)WhenworkingintheIndo-westPacificregion,wherecalcarinidsaccountforasubstantialproportionofthesediment,
theyshouldberemovedfromthe final FI calculationifthere isno a-priori historicalinformationavailableforthesitetobe studied.Thisisparticularlyimportantinveryshallow, mesotrophic(i.e.inshore)reefs,whereturbiditycanbehigh, thoughthisissuemaynotbeaconcernifsamplesaretaken attherecommendeddepthsof5 15m.Inoligotrophicareas, suchastheMaldives,calcarinidsshouldstillbeincludedin theFIcalculationsastheyrepresentasignificantproportion ofthesediment(Pisapiaetal.,2017).Alternatively,calcarinidssuchas Neorotaliagaimardi and Calcarinahispida may beusefulindicatorsofintermediatenutrification,asthey replace Amphistegina andmoresensitivecalcarinidsandincreaseinparallelwithsomeheterotrophictaxaand Elphidium (e.g. Renema,2010;Reymondetal.,2013).In oligotrophicreefareas,wheretheabundanceofalgaeisnot significant,butcalcarindsareabundantlypresent,they shouldstillbeincludedinthe FI count.
(10)FoRAMIndexvaluesfromnon-standardisedprotocolscanbe comparedlocallywithinterpretationsbasedontrends, ratherthanontheoriginallyproposedthresholds;they shouldnotbedirectlycomparedtodatacollectedusingthe recommendedprotocols.Forexample:
(a)Samplesfrombeachsandsandotherhighenergyenvironments <3mcanbeexamined,buttherelativeabundanceofLBFshellstonon-foraminiferalconstituentscan bemoreindicativeofwaterqualitythanisthepresence ofOSF,becausethelatterwillhavebeenselectively removedbybreakageandsorting(e.g. LidzandHallock, 2000).
(b)Live(stained)assemblagescanprovideinsightsonrecent stresseventsandinter-annualorseasonaltrends.
(c)Valuesobtainedfromsamplesforwhicha63 mmmesh sievehasbeenusedtoremovemuds-sizedsediments canbecomparedwitheachotherandwithprevious studiesinwhichthatsievemeshwasused.However,in futureapplicationsofthe FI,useofsieveswith125 mm meshisrecommendedtoincreaseprocessingefficiency.
8.Assessmentofforaminiferalpopulationsandglobal climatechange
Anapproachmoresuitabletomonitoringonseasonalscalesisto assesstheresponsesofkeytaxa,withrespecttoabsoluteabundancesand “condition”,throughvisualandmoleculartoolsusing the “omics” approach,ifavailable.Forexample, Hallock(1996) and Hallocketal.(2006) proposedthepossibilityofdifferentiating betweenlong-termwaterqualitydeclineandtheeffectsofphotooxidativestress(i.e.fromelevatedwatertemperatureorphotic stress)byanalysingpopulationsof A.gibbosa.Thisspeciesoccurs throughouttheCaribbeanregion;itscloserelative, A.lessonii,is foundthroughoutmostoftheIndo-Pacificregion.Thesetaxa typicallycanbecollectedalivefromreefrubbleatdepthsbetween 5and30m.Theassessmentstrategyisbaseduponsizedistributions(i.e.theabundanceofadultsand “juveniles”)andbleaching prevalenceandintensity,whichcanbequantifieduponreturnfrom the field(e.g. Hallocketal.,1995;Prazeres,2018).
In1991,thediscoveryofbleachingin A.gibbosa populationsin thereefsofFloridaKeysledtomonitoringofreef-tractpopulations, samplingofpopulationselsewhereasresourcespermitted,and laboratoryobservationsandexperiments,revealingnotonlysymbiontloss,butimpairedorfailedasexualreproduction,shellmalformationsandbreakage,andmicrobialinfestationonannual cyclesreflectingsolarirradianceratherthanhabitattemperature (e.g. Hallocketal.,2006,andreferencestherein).SamplingatHeron Island,GBR,inMarch1992,confirmedthatbleachingwasoccurring in A.lessonii and A.lobifera populations,andalsorevealedunusual shellbreakageandrepair(HallockandTalge,1994).Since1992, bleachinghasbeenobservedin Amphistegina populationsinall threeoceans(Hallock,2000;Hallocketal.,2006;Spezzaferrietal., 2018).Thediscoveryandintensivestudyofbleachingintheubiquitous Amphistegina spp.havecontributedtounderstandingthe cascadeofenvironmentalconsequencesofstratosphericozone depletion,whichhavecontributedtothecontinuedphotooxidativestressoncoralreefsworldwidesincethe1980s(Hallock etal.,2006),includingroughly20%oftheincreaseinglobaltemperature(WorldMeteorologicalOrganization,2018).
Amphistegina respondtoacutephoto-inhibitionwithinhoursto daysandtochronicstressoverseveraldaystoweeks(e.g. Talgeand Hallock,2003;Prazeresetal.,2016).Consequently,thisgenus providesabioindicatorofdamagingintensitiesofphoto-oxidative stressonthereefthatcanprecedeelevatedtemperature(Hallock etal.,2006). Spezzaferrietal.(2018) appliedthisstrategy,which theycalledthe Amphistegina BleachingIndex(ABI),tosamplesof Amphistegina from10-mdepthsinNorthAriAtollintheMaldives, IndianOcean,whichwerecollectedjustpriortoamasscoralbleachingevent.Theirresultsshowedthattheanalysisofbleachingprevalencein Amphistegina populationshasthepotentialto predicttheonsetofcoralbleaching.Temperature-induced bleachinghasalsobeenobserved(Prazeresetal.,2017;Prazeres, 2018),andhighlightlevelscombinedwithheatstresscanleadto severebleachingandimpairmentofreproduction(Prazeresetal., 2017).Therefore,in Amphistegina,bleachingcanbeinducedby photo-inhibitorystressassociatedwithhightemperatures(usually exceeding30 C)duringpeakseasonalsolarirradianceandwater transparency(e.g. Prazeres,2018;Spezzaferrietal.,2018).The observedbleachingin Amphistegina demonstratesthepotentialof thisgenustoidentifystressorsincoralreefs.Whenmonitoredin conjunctionwithexistingglobaltemperaturenetworks, Amphistegina providesthepotentialforforecastingnotonlymasscoral bleachingeventsbutalsoelevatedsusceptibilitytodisease(Hallock etal.,2004,2006).
9.Conclusions
Managinglocalwaterqualityincoastal-marineenvironmentsis fundamentalforthelong-termprotectionofdiversityandto maintaincarbonateaccretioninreefecosystems(Hughesetal., 2003;WooldridgeandDone,2009).Establishingbiologicaltime seriesbasedonforaminiferaisarelativelystraightforwardandcosteffectivewaytoevaluatechangesintheenvironmentovertime (Hallocketal.,2003).Theuseofbenthicforaminiferaprovidesa simpletoolforassessmentoflocalandglobalenvironmental stressors,byinvestigatingforaminiferalassemblagesthroughthe applicationofthe FI andassessmentofpopulationsof Amphistegina throughtheapplicationoftheABI(Spezzaferrietal.,2018).Thus, benthicforaminiferaaretheidealbioindicatortodistinguishbetweenlocalimpacts,whichcanbelocallymanaged,andregionalto globalstresses,whichrequireregionaltoglobalactiontoameliorate.
The FI wasdesignedtobearelativelysimpleindicatorof whetherwaterqualitysupportscalcifyingorganismsthathostalgal endosymbionts.Aswithanygroupoforganisms,somespeciesmay notbehaveexactlyaspredictedby a-priori assignmenttoafunctionalgroup.Moreover,regionaltaxonomicdifferencesmayprecludetheestablishmentofgloballyrelevantmetricthresholdsfor the FI.Nevertheless,thevarietyofapplicationsreportedtodate, includingcomparisonswithspecificbiologicalandgeochemical parameters(e.g. Fabriciusetal.,2012;Oliveretal.,2014),comparisonsacrossspecificgradientsofimpact(e.g. Carnahanetal.,2009; Koukousiouraetal.,2011),andeventheinter-annualtrendsina multi-yeardatasetbasedonspecimenscollectedlive(Kelmoand Hallock,2013),alldemonstratethatthebasicpremiseofthe FoRAMIndexissoundandreadilyapplicable.
Finally,additionalstudiesareneededtodeterminehowrelevant proposed FI thresholdsareandtodeterminewherethe FI should notbeused.Thisknowledgecanprovidelocalresourcemanagementagencieswithrecommendationsastowhetherthe routineapplicationofthe FI bytechnicianstrainedtoenumerate thosespecificfunctionalgroupscanbepractical,cost-effective,and worthincorporatinginmulti-yearevaluationsofreefresourcesor sitesofconcern.
Acknowledgements
Dr.T.EdwardRobertsforillustratingthespecimensofforaminiferain Figs.1and2.Dr.WillemRenemaforhiscommentsonearly versionsofthemanuscript.Thisworkwaspartiallysupportedby thePuertoRicoSeaGrant(grantnumberR/104-1-18)awardedto MM-C.
References
Adey,W.,1978.Coralreefmorphogenesis:amultidimensionalmodel.Science(NY) 202,831 837
Almeida,C.M.,Barbosa,C.F.,Cordeiro,R.C.,Seoane,J.C.S.,Fermino,G.M.,Silva,P.O., Turcq,B.J.,2013.Palaeoecologyofa3-kyrbiosedimentaryrecordofacoralreefsupportingcarbonateshelf.Cont.ShelfRes.70,168 176
Alve,E.,1995.Benthicforaminiferalresponsestoestuarinepollution:areview. J.Foraminifer.Res.25,190 203
Alve,E.,Korsun,S.,Schonfeld,J.,Dijkstra,N.,Golikova,E.,Hess,S.,Husum,K., Panieri,G.,2016.Foram-AMBI:asensitivityindexbasedonbenthicforaminiferalfaunasfromNorth-EastAtlanticandArcticfjords,continentalshelvesand slopes.Mar.Micropaleontol.122,1 12
Antonius,A.,1977.Coralmortalityinreefsaproblemforscienceandmanagement. In:ProceedingsoftheThirdInternationalCoralReefSymposium,Miami(USA), vol.2,pp.618 623
Barbosa,C.F.,Prazeres,MdF.,Ferreira,B.P.,Seoane,J.C.S.,2009.Foraminiferal assemblageandreefcheckcensusincoralreefhealthmonitoringofEastBrazilianmargin.Mar.Micropaleontol.73,62 69.
Barbosa,C.F.,Ferreira,B.P.,Seoane,J.C.S.,Oliveira-Silva,P.,Gaspar,A.L.B., Cordeiro,R.C.,Soares-Gomes,A.,2012.Foraminifer-basedcoralreefhealth assessmentforsouthwesternAtlanticoffshorearchelagos,Brazil.J.Foraminifer. Res.42,169 183 M.Prazeresetal./EnvironmentalPollution257(2020)113612
Barbosa,C.F.,Seoane,J.C.S.,Dias,B.B.,Allevato,B.,Brooks,P.O.S.,Gaspar,A.L.B., Cordeiro,R.C.,2016.HealthenvironmentalassessmentofthecoralreefsupportingTamandareBay(NE,Brazil).Mar.Micropaleontol.127,63 73 Bellwood,D.R.,Hughes,T.P.,Folke,C.,Nystrom,M.,2004.Confrontingthecoralreef crisis.Nature429,827 833
Birkeland,C.,1977.Theimportanceofrateofbiomassaccumulationinearlysuccessionalstagesofbenthiccommunitiesinsurvivalofcoralrecruits.In:ProceedingsoftheThirdInternationalCoralReefSymposium,Miami,(USA),vol.1, pp.16 21 Birkeland,C.,1988.Geographiccomparisonsofcoral-reefcommunityprocesses.In: ProceedingsoftheSixthInternationalCoralReefSymposium,Townsville (Australia),pp.211 220 Birkeland,C.,1997.Symbiosis, fisheriesandeconomicdevelopmentoncoralreefs. TrendsEcol.Evol.12,364 367
Bonanno,G.,Orlando-Bonaca,M.,2018.Perspectivesonusingmarinespeciesas bioindicatorsofplasticpollution.Mar.Pollut.Bull.137,209 221 Briguglio,A.,Hohenegger,J.,2011.Howtoreacttoshallowwaterhydrodynamics: thelargerbenthicforaminiferasolution.Mar.Micropaleontol.81,63 76 Bruckner,A.W.,2016.WhitesyndromesofWesternAtlanticreef-buildingcorals. Dis.Coral316 332.
Burke,L.,Reytar,K.,Spalding,M.,Perry,A.,2011.ReefsatRiskRevisited.World ResourcesInstitute,WashingtonD.C.,p.114
Buzas,M.,1990.Anotherlookatconfidencelimitsforspeciesproportions. J.Palaeontol.64,842 843
Buzas,M.A.,Hayek,L.C.,Reed,S.A.,Jett,J.A.,2002.Foraminiferaldensitiesover five yearsintheIndianRiverLagoon,Florida:amodelofpulsatingpatches. J.Foraminifer.Res.32,68 92
Cardini,U.,Bednarz,V.N.,Foster,R.A.,Wild,C.,2014.BenthicN2 fixationincoral reefsandthepotentialeffectsofhuman-inducedenvironmentalchange.Ecol. Evolut.4,1706 1727
Carilli,J.,Walsh,S.,2012.BenthicforaminiferalassemblagesfromKiritimati (Christmas)Islandindicateincreasednutrificationhasoccurredonadecadal scale.Mar.Ecol.Prog.Ser.456,87 99
Carnahan,E.A.,Hoare,A.M.,Hallock,P.,Lidz,B.H.,Reich,C.D.,2009.Foraminiferal assemblagesinBiscayneBay,Florida,USA:responsestourbanandagricultural Influenceinasubtropicalestuary.Mar.Pollut.Bull.59,221 233 Chapman,F.,1900.OnsomenewandinterestingforaminiferafromtheFunafuti atoll,Elliceisland.Zool.J.Linn.Soc.28,715 722
Chen,C.S.,Lin,H.L.,2017.Applyingbenthicforaminiferalassemblagestoevaluate thecoralreefconditioninDongshaAtolllagoon.Zool.Stud.56,20
Cockey,E.M.,Hallock,P.,Lidz,B.,1996.DecadalscalechangesinbenthicforaminiferalassemblagesoffKeyLargo,Florida.CoralReefs15,237 248
Colwell,R.K.,Mao,C.X.,Chang,J.,2004.Interpolating,extrapolating,andcomparing incidence-basedspeciesaccumulationcurves.Ecology85,2717 2727. Cooper,T.F.,Gilmour,J.P.,Fabricius,K.E.,2009.Bioindicatorsofchangesinwater qualityoncoralreefs:reviewandrecommendationsformonitoringprogrammes.CoralReefs28,589 606
Crevison,H.,Hallock,P.,McRae,G.,2006.SedimentcoresfromtheFloridaKeys (USA):isresolutionsufficientforenvironmentalapplications?J.Environ. Micropaleontol.Microbiol.Meiobenthol.3,61 82
Crosby,M.P.,Drake,S.F.,Eakin,C.M.,Fanning,N.B.,Paterson,A.,Taylor,P.R., Wilson,J.,1995.TheUnitedStatesCoralReefInitiative:anoverviewofthe first steps.CoralReefs14,1 3
Culver,S.J.,1990.BenthicforaminiferaofPuertoRicanmangrove-lagoonsystems; potentialforpaleoenvironmentalinterpretations.Palaios5,34 51
Culver,S.J.,Buzas,M.A.,1995.Theeffectsofanthropogenichabitatdisturbance, habitatdestruction,andglobalwarmingonbenthicforaminifera.J.Foraminifer. Res.25,204 211
Dauvin,J.-C.,Bellan,G.,Bellan-Santini,D.,2010.Benthicindicators:fromsubjectivitytoobjectivity whereistheline?Mar.Pollut.Bull.60,947 953
Dawson,J.L.,Smithers,S.G.,2014.Carbonatesedimentproduction,transport,and supplytoacoralcayatRaineReef,NorthernGreatBarrierReef,Australia:a faciesapproach.J.Sediment.Res.84,1120 1138
Dimiza,M.,Triantaphyllou,M.,Koukousioura,O.,Hallock,P.,Simboura,N., Karageorgis,A.P.,Papathanasiou,E.,2016.TheForamStressIndex:anewtool forenvironmentalassessmentofsoft-bottomenvironmentsusingbenthic foraminifera.AcasestudyfromtheSaronikosGulf,Greece,EasternMediterranean.Ecol.Indicat.60,611 621.
Done,T.J.,1992.Phaseshiftsincoralreefcommunitiesandtheirecologicalsignificance.Hydrobiologica247,121 132
Donnelly,K.B.,1993.CharacterizationoftheForaminiferalAssemblageoffthe SouthwestCoastofPuertoRicoatLaParguera.Unpublishedthesis.Universityof SouthFlorida,Tampa,FL,p.272
Ebrahim,M.T.,2000.Impactofanthropogenicenvironmentalchangeonlarger foraminifera Tarawaatoll,Kiribati,SouthPacific.In:Martin,R.E.(Ed.),EnvironmentalMicropaleontology.TopicsinGeobiology,vol.15.Springer,Boston, MA,pp.105 119
Emrich,K.,Martínez-Colon,M.,Alegría,H.,2017.Isuntreatedsewageimpacting coralreefsinCayeCaulker,Belize?J.Foraminifer.Res.47,20 33
Fabricius,K.E.,Cooper,T.F.,Humphrey,C.,Uthicke,S.,De’ath,G.,Davidson,J., LeGrand,H.,Thompson,A.,Schaffelke,B.,2012.Abioindicatorsystemforwater qualityoninshorecoralreefsoftheGreatBarrierReef.Mar.Pollut.Bull.65, 320 332
Fajemila,O.T.,Langer,M.R.,Lipps,J.H.,2015.Spatialpatternsinthedistribution, diversityandabundanceofbenthicForaminiferaaroundMoorea(Society
Archipelago,FrenchPolynesia).PLoSOne10,e0145752
Fatela,F.,Taborda,R.,2002.Confidencelimitsofspeciesproportionsinmicrofossil assemblages.Mar.Micropaleontol.45,169 174
Frank,T.D.,Jell,J.S.,2006.Recentdevelopmentonanearshore,terrigenousinfluencedreef:lowIslesreef,Australia.J.Coast.Res.22,474 486
Glynn,P.W.,1988.ElNinowarming,coralmortalityandreefframeworkdestruction byechinoidbioerosionintheeasternPacific.Galaxea7,20 30
Hallock,P.,1987.Fluctuationsinthetrophicresourcecontinuum:afactoringlobal diversitycycles?Paleoceanography2,457 471
Hallock,P.,1988a.Theroleofnutrientavailabilityinbioerosion:consequencesto carbonatebuildups.Palaeogeogr.Palaeoclimatol.Palaeoecol.63,275 291
Hallock,P.,1988b.Diversificationinalgalsymbiont-bearingforaminifera:a responsetooligotrophy?Rev.Paleobiol.2,789 797(Benthos ’86)
Hallock,P.,1996. Amphistegina (Foraminiferida)densitiesasapractical,reliable, low-costindicatorofcoralreefvitality.In:Crosby,M.P.,Gibson,G.R.,Potts,K.W. (Eds.),ACoralReefSymposiumonPractical,Reliable,Low-CostMonitoring MethodsforAssessingtheBiotaandHabitatConditionsofCoralReefs,January 26-27,1995.OfficeofOceanandCoastalResourceManagement,NOAA,Silver Spring,MD,pp.37 44.
Hallock,P.,1999.Chapter8.Symbiont-bearingforaminifera.In:SenGupta,B.(Ed.), ModernForaminifera.KluwerPress,Amsterdam,pp.123 139
Hallock,P.,2000.Symbiont-bearingforaminifera:harbingersofglobalchange. Micropaleontology46(S-1),95 104
Hallock,P.,2001.Coralreefs,carbonatesediments,nutrients,andglobalchange.In: Stanley,G.D.(Ed.),TheHistoryandSedimentologyofAncientReefSystems. TopicsinGeobiology,vol.17.Springer,Boston,MA,pp.387 427
Hallock,P.,2012.TheFORAMIndexrevisited:usefulness,challengesandlimitations.In:Proceedingsofthe12thInternationalCoralReefSymposium,Cairns (Australia).In: http://www.icrs2012.com/proceedings/manuscripts/ICRS2012_ 15F_2.pdf
Hallock,P.,Schlager,W.,1986.Nutrientexcessandthedemiseofcoralreefsand carbonateplatforms.Palaios1,389 398
Hallock,P.,Talge,H.K.,1994.Apredatoryforaminifer, Floresinaamphiphaga,n.sp., fromtheFloridaKeys.J.Foraminifer.Res.24(4),210 213
Hallock,P.,Talge,H.K.,Cockey,E.M.,Muller,R.G.,1995.Anewdiseaseinreefdwellingforaminifera:implicationsforcoastalsedimentation.J.Foraminifer. Res.25,280 286
Hallock,P.,Lidz,B.H.,Cockey-Burkhard,E.M.,Donnelly,K.B.,2003.Foraminiferaas bioindicatorsincoralreefassessmentandmonitoring:theFORAMIndex.Environ.Monit.Assess.81(1 3),221 238
Hallock,P.,Barnes,K.,Fisher,E.M.,2004.Fromsatellitestomolecules:amultiscale approachtoenvironmentalmonitoringandriskassessmentofcoralreefs. J.Environ.Micropaleontol.Microbiol.Meiobenthol.1,11 39.
Hallock,P.,Williams,D.E.,Fisher,E.M.,Toler,S.K.,2006.BleachinginForaminifera withalgalsymbionts:implicationsforreefmonitoringandriskassessment. Anu.doInst.Geociencias29,108 128
Hay,M.E.,1984.Patternsof fishandurchingrazingonCaribbeancoralreefs:are previousresultstypical?Ecology65,446 454
Hayek,L.C.,Buzas,M.A.,2013.Ontheproperandefficientuseofdiversitymeasures forindividual fieldsamples.J.Foraminifer.Res.43,305 313
Highsmith,R.C.,1981.Coralbioerosion:damagerelativetoskeletaldensity.Am.Nat. 117,193 198
Hirshfield,H.L.,Charmatz,R.,Helson,Lawrence,1968.Foraminiferainsamples takenmainlyfromEniwetokAtollin1956.J.Protozool.15,497 502 Hu,C.,Yang,X.,Gao,L.,Zhang,P.,Li,W.,Dong,J.,Li,C.,Zhang,X.,2019.Comparative analysisofheavymetalaccumulationandbioindicationinthreeseagrasses: whichspeciesismoresuitableasabioindicator?Sci.TotalEnviron.669,41 48 Hubbard,D.K.,1985.Whatdowemeanbyreefgrowth?.In:Proceedingsofthe5th InternationalCoralReefSymposium,Tahiti,vol.6,pp.433 438
Hughes,T.P.,Baird,A.H.,Bellwood,D.R.,Card,M.,Connolly,S.R.,Folke,C., Grosberg,R.,Hoegh-Guldberg,O.,Jackson,J.B.,Kleypas,J.,Lough,J.M., Marshall,P.,Nystrom,M.,Palumbi,S.R.,Pandolfi,J.M.,Rosen,B.,Roughgarden,J., 2003.Climatechange,humanimpacts,andtheresilienceofcoralreefs.Science 301,929 933
Hughes,T.P.,Kerry,J.T., Alvarez-Noriega,M.,etal.,2017.Globalwarmingand recurrentmassbleachingofcorals(43moreauthors).Nature543,373 377 Humphreys,A.F.,Halfar,J.,Ingle,J.C.,Manzello,D.,Reymond,C.E.,Westphal,H., Riegl,B.,2018.Effectofseawatertemperature,pH,andnutrientsonthedistributionandcharacteroflowabundanceshallowwaterbenthicforaminiferain theGalapagos.PLoSOne13,e0202746
Hurlbert,S.T.,1984.Pseudoreplicationandthedesignofecological fieldexperiments.Ecol.Monogr.54,187 211
Jackson,L.E.,Kurtz,J.C.,Fisher,W.S.,2000.EvaluationGuidelinesforEcological Indicators.U.S.EnvironmentalProtectionAgency,ResearchTrianglePark,NC, p.107.EPA/620/R-99/005
Jorissen,F.,Nardelli,M.P.,Almogi-Labin,A.,Barras,C.,Bergamin,L.,Bicchi,E.,El Kateb,A.,Ferraro,L.,McGann,M.,Morigi,C.,Romano,E.,Sabbatini,A., Schweizer,M.,Spezzaferri,S.,2018.DevelopingForam-AMBIforbiomonitoring intheMediterranean:speciesassignmentstoecologicalcategories.Mar. Micropaleontol.140,33 45
Kelmo,F.,Hallock,P.,2013.ResponsesofforaminiferalassemblagestoENSOclimate patternsonbankreefsofnorthernBahia,Brazil:a17-yearrecord.Ecol.Indicat. 30,148 157
Kinsey,D.W.,1981.ThePacific/Atlanticreefgrowthcontroversy.In:Proceedingsof the4thInternationalCoralReefSymposium,vol.1,pp.493 498
Koukousioura,O.,Dimiza,M.D.,Triantaphyllou,M.V.,Hallock,P.,2011.Living benthicforaminiferaasanenvironmentalproxyincoastalecosystems:acase studyfromtheAegeanSea(Greece,NEMediterranean).J.Mar.Syst.88, 489 501
Laws,E.A.,Redalje,D.G.,1979.Effectofsewageenrichmentonthephytoplankton populationofasub-tropicalestuary.Pac.Sci.33,129 144
Laws,E.A.,Redalje,D.G.,1982.Sewagediversioneffectsonthewatercolumnofa sub-tropicalestuary.Mar.Environ.Res.6,265 279
Lessios,H.A.,2016.Thegreat Diademaantillarum die-off:30yearslater.Annu.Rev. Mar.Sci.8,267 283
Lidz,B.H.,Hallock,P.,2000.Sedimentarypetrologyofadecliningreefecosystem, FloridaReefTract(U.S.A.).J.Coast.Res.16,675 697
Lidz,B.H.,Robbin,D.M.,Shinn,E.A.,1985.Holocenecarbonatesedimentary petrologyandfaciesaccumulation,LooeKeyNationalMarineSanctuary,Florida.Bull.Mar.Sci.36,672 700
Ludwig,J.A.,Reynolds,J.F.,1988.StatisticalEcology APrimeronMethodsand Computing.JohnWileyandSons,Toronto
MacNeil,M.A.,Mellin,C.,Matthews,S.,Wolff,N.H.,McClanahan,T.R.,Devlin,M., Drovandi,C.,Mengersen,K.,Graham,N.A.J.,2019.Waterqualitymediates resilienceontheGreatBarrierReef.Nat.Ecol.Evolut.3,620 627. Marshall,P.,Schuttenberg,H.,2006.Adaptingcoralreefmanagementinthefaceof climatechange.In:Phinney,J.T.,Hoegh-Guldberg,O.,Skirving,W.,Strong,A. (Eds.),CoastalandEstuarineStudies.AmericanGeophysicalUnionWashington, pp.223 241
Martínez-Colon,M.,Hallock,P.,Green-Ruíz,C.,Smoak,J.,2018.Benthicforaminifera asbioindicatorsofpotentiallytoxicelements(PTE)pollution:TorrecillaLagoon, PuertoRico.Ecol.Indicat.89,516 527
Moses,E.F.,Hallock,P.,Fauth,J.,2017.DynamicsofLargerBenthicForaminiferal PopulationsintheUpperFloridaKeysReefTract,USA:ComparisonswithOther CoralReefBioindicators.MicropaleontologyanditsApplications.Scientific Publisher,NewDelhi,pp.15 39
Murray,J.W.,2006.EcologyandApplicationsofBenthicForaminifera.Cambridge UniversityPress,London,p.440
Murray,J.W.,2014.EcologyandPalaeoecologyofBenthicForaminifera.Routledge Taylor & Francis,London,p.380
Nagel,T.,Rosendahl,D.,Hua,Q.,Moss,P.,Sloss,C.,Petchey,F.,Ulm,S.,2016. Extendedresidencetimesforforaminiferainamarine-influencedterrestrial archaeologicaldepositandimplicationsforpalaeoenvironmentalreconstruction.J.Archaeol.Sci.:Rep.5,25 34
Nagendra,R.,NallapaReddy,A.,2019.Benthicforaminiferaresponsetoecosystem pollutionintheUppanarEstuary,TamilNaduCoast,India.J.Geol.Soc.India93, 555 566
Narayan,Y.R.,Pandolfi,J.M.,2010.BenthicforaminiferalassemblagesfromMoreton Bay,South-EastQueensland,Australia:Applicationsinmonitoringwaterand substratequalityinsubtropicalestuarineenvironments.Mar.Pollut.Bull.60, 2062 2078
Ogden,J.C.,1996.Ecosysteminteractionsinthetropicalcoastalseascape.In: Birkeland,C.(Ed.),LifeandDeathofCoralReefs.Chapman & Hall,NewYork, pp.288 297
Oliveira-Silva,P.,Barbosa,C.F.,deAlmeida,C.M.,Seoane,J.C.S.,Cordeiro,R.C., Turcq,B.J.,Soares-Gomes,A.,2012.SedimentarygeochemistryandforaminiferalassemblagesincoralreefassessmentofAbrolhos,SouthwestAtlantic.Mar. Micropaleontol.94(95),14 24
Oliver,L.M.,Fisher,W.S.,Dittmar,J.,Hallock,P.,Campbell,J.,Quarles,R.L.,Harris,P., LoBue,C.,2014.Contrastingresponsesofcoralreeffaunaandforaminiferal assemblagestohumaninfluenceinLaParguera,PuertoRico.Mar.Environ.Res. 99,95 105
Oliver,L.M.,Fisher,W.S.,Fore,L.,Smith,A.,Bradley,P.,2018.Assessinglanduse, sedimentation,andwaterqualitystressorsaspredictorsofcoralreefcondition inSt.Thomas,USVirginIslands.Environ.Monit.Assess.190,213
Pandolfi,J.M.,Bradbury,R.H.,Sala,E.,Hughes,T.P.,Bjorndal,K.A.,Cooke,R.G., McArdle,D.,McClenachan,L.,Newman,M.J.,Paredes,G.,Warner,R.R., Jackson,J.B.,2003.Globaltrajectoriesofthelong-termdeclineofcoralreef ecosystems.Science301,955 958
Parsaian,M.,Shokri,M.R.,Pazooki,J.,2018.Theresponseofbenthicforaminiferato aquacultureandindustrialpollution:AcasestudyfromtheNorthernPersian Gulf.Mar.Pollut.Bull.135,682 693. Pisapia,C.,ElKateb,A.,Hallock,P.,Spezzaferri,S.,2017.Assessingcoralreefhealthin theNorthAriAtoll(Maldives)usingtheFoRAMindex.Mar.Micropaleontol.133, 50 57
Prazeres,M.,2018.Bleaching-associatedchangesinthemicrobiomeoflargebenthic ForaminiferaoftheGreatBarrierReef,Australia.Front.Microbiol.9,2404
Prazeres,M.,Renema,W.,2019.EvolutionarysignificanceofthemicrobialassemblagesinlargebenthicForaminifera.Biol.Rev.94,828 848
Prazeres,M.,Uthicke,S.,Pandolfi,J.M.,2016.Influenceoflocalhabitatonthe physiologicalresponsesoflargebenthicforaminiferatotemperatureand nutrientstress.Sci.Rep.6,21936
Prazeres,M.,Roberts,T.E.,Pandolfi,J.M.,2017.Variationinsensitivityoflarge benthicForaminiferatothecombinedeffectsofoceanwarmingandlocal
impacts.Sci.Rep.7,45227
Ramirez,A.,2008.PatchReefsinBiscayneNationalPark,FL:Sediments,ForaminiferalDistributions,andaComparisonofThreeBioticIndicatorsofReefHealth. MScThesis.UniversityofSouthFlorida,USA,p.137. https://scholarcommons. usf.edu/etd/465/
Ramos-Scharron,C.E.,2010.Sedimentproductionfromunpavedroadsinasubtropicaldrysetting,SouthwesternPuertoRico.Catena82,146 158
Renema,W.,2002.Largeforaminiferaasmarineenvironmentalindicators.Scr.Geol. 124,1 260
Renema,W.,2008.Habitatselectivefactorsinfluencingthedistributionoflarger benthicforaminiferalassemblagesovertheKepulauanSeribu.Mar.Micropaleontol.68,286 298
Renema,W.,2010.Isincreasedcalcarinid(foraminifera)abundanceindicatinga largerroleformacro-algaeinIndonesianPlio-Pleistocenecoralreefs?Coral Reefs29,165 173
Renema,W.,Beaman,R.J.,Webster,J.M.,2013.Mixingofrelictandmoderntestsof largerbenthicforaminiferaontheGreatBarrierReefshelfmargin.Mar. Micropaleontol.101,68 75
Reymond,C.E.,Roff,G.,Chivas,A.R.,Zhao,J.-X.,Pandolfi,J.M.,2013.MillenniumscalerecordsofbenthicforaminiferalcommunitiesfromthecentralGreat BarrierReefrevealspatialdifferencesandtemporalconsistency.Palaeogeogr. Palaeoclimatol.Palaeoecol.374,52 61
Rogers,C.S.,1990.Responsesofcoralreefsandreeforganismstosedimentation. Mar.Ecol.-Prog.Ser.62,185 202
Sammarco,P.W.,1982.Effectsofgrazingby Diademaantillarum Philippi(Echinodermata:Echinoidea)onalgaldiversityandcommunitystructure.J.Exp.Mar. Biol.Ecol.65,83 105
Sapp,J.,1999.WhatIsNatural?:CoralReefCrisis.OxfordUniversityPress,New York,p.275
Sanchez,J.A.,Gomez-Corrales,M.,Gutierrez-Cala,L.,Vergara,D.C.,Roa,P.,GonzalezZapata,F.L.,Gnecco,M.,Puerto,N.,Neira,L.,Sarmiento,A.,2019.Steadydecline ofcoralsandotherbenthicorganismsintheSeaFlowerbiospherereserve (SouthwesternCaribbean).Front.Mar.Sci.6,73
Schaffer,C.T.,2000.Monitoringnearshoremarineenvironmentsusingbenthic foraminifera:someprotocolsandpitfalls.Micropaleontology46,161 169
Schonfeld,J.,Alve,E.,Geslin,E.,Jorissen,F.,Korsun,S.,Spezzaferri,S.,2012.The FOBIMO(FOraminiferalBIo-MOnitoring)initiative:towardsastandardised protocolforsoft-bottombenthicforaminiferalmonitoringstudies.Mar. Micropaleontol.94 95,1 13
Schueth,J.D.,Frank,T.D.,2008.Reefforaminiferaasbioindicatorsofcoralreef health:LowIslesReef,northernGreatBarrierReef,Australia.J.Foraminifer.Res. 38,11 22
Seiglie,G.A.,1968.Foraminiferalassemblagesasindicatorsoforganiccarboncontentorofwaterpollution.Am.Assoc.Pet.Geol.52,2231 2241. Seiglie,G.A.,1971.Apreliminarynoteontherelationshipsbetweenforaminifers andpollutionintwoPuertoRicanbays.Caribb.J.Sci.11,93 98 SenGupta,B.K.,Shin,I.C.,Wendler,S.T.,1987.Relevanceofspecimensizeindistributionstudiesofdeep-seabenthicforaminifera.Palaios2,332 338
Smith,S.V.,Kimmerer,W.J.,Laws,E.A.,Brock,R.E.,Walsh,T.W.,1981.KaneoheBay sewagediversionexperiment:Perspectivesonecosystemresponsestonutritionalperturbation.Pac.Sci.35,279 395
Spezzaferri,S.,ElKateb,A.,Pisapia,C.,Hallock,P.,2018. Insitu observationsof foraminiferalbleachingintheMaldives,IndianOcean.J.Foraminifer.Res.48, 75 84
Stephenson,C.M.,Hallock,P.,Kelmo,F.,2015.Foraminiferalassemblageindices:A comparisonofsedimentandreefrubblesamplesfromConchReef,Florida,USA. Ecol.Indicat.48,1 7
Talge,H.K.,Hallock,P.,2003.Ultrastructuralresponsestobleachingin Amphistegina gibbosa (Foraminifera).J.Eukaryot.Microbiol.50,324 333 Uthicke,S.,Nobes,K.,2008.BenthicForaminiferaasecologicalindicatorsforwater qualityontheGreatBarrierReef.Estuar.Coast.ShelfSci.78,763 773 Uthicke,S.,Thompson,A.,Schaffelke,B.,2010.Effectivenessofbenthicforaminiferal andcoralassemblagesaswaterqualityindicatorsoninshorereefsoftheGreat BarrierReef,Australia.CoralReefs29,209 225
Velasquez,J.,Lopez-Angarita,J.,Sanchez,J.A.,2011.EvaluationoftheFORAMindex inacaseofconservation:Benthicforaminiferaasindicatorsofecosystem resilienceinprotectedandnon-protectedcoralreefsofthesouthernCaribbean. Biodivers.Conserv.20,3591 3603. Wells,J.W.,1957.Coralreefs.Geol.Soc.Am.Mem.67,609 631 Wilkinson,C.R.,Cheshire,A.C.,1988.Cross-shelfvariationsincoralreefstructure andfunction:influencesoflandandocean.In:Proceedingsofthe6thInternationalCoralReefSymposium,vol.1,pp.227 233
Wolanski,E.,Spagnol,S.,2000.StickywatersintheGreatBarrierReef.EstuarCoast. ShelfSci.50,27 32
Wooldridge,S.A.,Done,T.J.,2009.Improvedwaterqualitycanameliorateeffectsof climatechangeoncorals.Ecol.Appl.19,1492 1499 WorldMeteorologicalOrganization,2018.ScientificAssessmentofOzoneDepletion:2018.GlobalOzoneResearchandMonitoringProject,Geneva, Switzerland,p.67.ReportNo.58