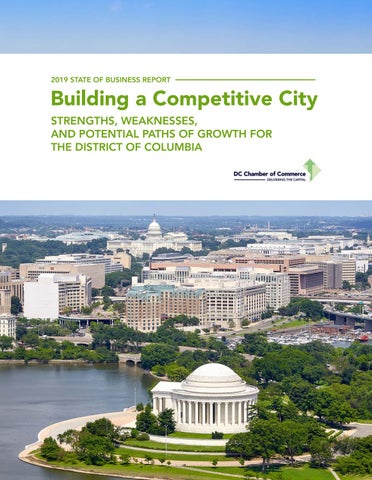
2019 STATE OF BUSINESS REPORT
Building a Competitive City STRENGTHS, WEAKNESSES, AND POTENTIAL PATHS OF GROWTH FOR THE DISTRICT OF COLUMBIA
Chamber State of Business Report 2019 FINAL.indd 1
9/25/19 11:01 AM
ABOUT THE DISTRICT OF COLUMBIA CHAMBER OF COMMERCE The DC Chamber of Commerce is the voice of business in Washington, DC, the nation’s capital. It advocates on behalf of businesses and entrepreneurs, and provides services to improve the business climate and attract new companies to the District of Columbia. As a leading advocate for economic growth, the DC Chamber reflects the diversity and prosperity of the District’s robust business community, from tech startups to Fortune 500 corporations.
photo: Aime
ACKNOWLEDGEMENTS Washington, DC is a flourishing and diverse global city. Its leadership—including Mayor Muriel Bowser, the Council of the District of Columbia, and the DC Chamber of Commerce under the stewardship of President and CEO Vincent B. Orange Sr.— are the catalysts for the production of the 2019 State of Business Report: Building a More Competitive City. The Office of the Deputy Mayor for Planning and Economic Development, under the leadership of Interim Deputy Mayor for Planning and Economic Development John Falcicchio, and Karima Woods, Director of Business Development and Strategy, provided financial support for the production of this report. ABOUT THIS REPORT This report was prepared and produced by the D.C. Policy Center for the DC Chamber of Commerce. The D.C. Policy Center is an independent nonprofit think tank committed to advancing policies for a strong and vibrant economy in the District of Columbia.
photo: Aimee Custis
The views expressed in this report should not be attributed to the members of the D.C. Policy Center’s Board of Directors or its funders. Funders do not determine research findings or the insights and recommendations of D.C. Policy Center employees and experts. Further information about the D.C. Policy Center is available at dcpolicycenter.org/about.
Chamber State of Business Report 2019 FINAL.indd 2
9/25/19 11:01 AM
photo: Aimee Custis
CONTENTS Message from the Chamber .........................................................................................................
3
Executive summary: Building a competitive city ........................................................................
4
I. Introduction: Intra-regional dynamics in the Washington metropolitan area ..........................
10
II. Comparative regional outcomes ............................................................................................
12
Business establishments ..................................................................................................
12
Employment ..................................................................................................................... 14 Residents .......................................................................................................................... 16 III. Intra-regional mobility .............................................................................................................
18
How establishments move across the metropolitan region ............................................
18
How workers move across the metropolitan region ........................................................ 20 How residents move across the metrpolitan region ........................................................ 21 IV. Building a competitive city: A framework for analysis ..........................................................
24
Factors for businesses ...................................................................................................... 24 Factors for workers ..........................................................................................................
32
Factors for residents ........................................................................................................
36
V. Conclusion ................................................................................................................................ 44 VI. An agenda for the Chamber ..................................................................................................
46
Endnotes ....................................................................................................................................... 50
THE 2019 STATE OF BUSINESS REPORT
Chamber State of Business Report 2019 FINAL.indd 1
1
9/25/19 11:01 AM
WASHINGTON, D.C. WASHINGTON, WASHINGTON, D.C. WASHINGTON,D.C. D.C.
DELIVERS DELIVERS DELIVERS DELIVERS
The DC Chamber of Commerce is the region’s largest and most dynamic business network, creating a better TheThe DC DC Chamber Chamber of Commerce of Commerce is the is the region’s region’s largest largest environment to work, play, and do business in the andand most most dynamic dynamic business business network, network, creating creating a better a better District. No other business organization delivers what environment environment to work, to work, play, play, andand do business do in the in the TheWe DCdeliver Chamber Commerce is business the region’s largest we do: theofcapital. District. District. No other No other business business organization organization delivers delivers what what and most dynamic business network, creating a better we do: we do: We We deliver deliver the the capital. capital.
environment to work, play, and do business in the District. No other business organization delivers what we do: We deliver the capital.
Markets for Real Estate Markets Markets for Real for Real Investment Estate Estate No. 1 Investment Investment Forbes No. No. 1 January 2019
Global Cities Ranking for 2019 Global Global Cities Cities TOPfor 10 2019 Ranking Ranking for 2019 A.T. Kearney TOP TOP 10 2019
1
Forbes Forbes January January 2019 2019
Best Cities for Markets for Real Job Seekers Best Best Cities Cities for for Estate 10 JobTOP Job Seekers Seekers
Investment
Fast Company TOP TOP 10 10 June 2019
A.T. Kearney A.T. Kearney 2019 2019
Best Cities for Global Cities New College Best Best Cities Cities for for Ranking Grads for 2019 NewNew College College TOP 15 Grads Grads
TOP 10
Business Insider TOP TOP 15 15 May 2019
No. 1
Fast Company Fast Company June 2019 June 2019
A.T. Kearney Business Business Insider 2019Insider
Forbes January 2019
May 2019 May 2019
TOP 10
TOP 15 2
Business Insider
Most Influential Global Cities Most Most Influential Influential TOP 10 Cities Global Global Cities
U.S. News & World Report TOP TOP 20 20 April 2019
Business Insider TOP TOP 10 10 June 2019
U.S. News U.S. News & World & World ReportReport April 2019 April 2019
Business Business InsiderInsider June 2019 June 2019
Best Places Best Places to to Retire Best Best Places Places Live in the U.S. toTOP Retire to10 Retire
TOP 10 20
LEED Platinum City Most in theInfluential World LEED LEED Platinum Platinum Global Cities CityCity in 1st the in the World World
TOP 1st 1st10
The Balance TOP TOP 10 April 2019
U.S. Green Building Council August 2017
The Balance The Balance
U.S. Green U.S. Green Building Building Council Council Business Insider August August 2017 2017
U.S. News & 2019 World Report April 2019 April April 2019
Best Cities for Best Places New College to Retire Learn more at DCCHAMBER.ORG Grads Learn Learn moremore at DCCHAMBER.ORG at DCCHAMBER.ORG
Best Cities for Job Seekers Fast Company Chamber State ofJune Business Report 2019 FINAL.indd 2019
10
Best Places to Live in the U.S. Best Best Places Places to to TOP 20the LiveLive in the in U.S.U.S.
TOP 10
The Balance April 2019
June 2019
LEED Platinum City in the World 1st U.S. Green Building Council August 20179/25/19 11:01 AM
tial s
tial um s orld
uncil
MESSAGE FROM THE CHAMBER
The District of Columbia Chamber of Commerce is pleased to present the 2019 State of Business Report: Building a Competitive City. Businesses in the District are working hard and doing well. In 2018, 39,400 private sector establishments of the District employed collectively 534,225 employees, making the District the largest private sector employment center in the metropolitan area. In 2018, resident employment increased by 1.1 percent, further pushing down the unemployment rate to 5.5 percent. The District’s economy generated $7.7 billion in local fund revenue during the last fiscal year, realizing a growth of 4 percent. Last year, the DC Chamber’s 2018 State of Business report documented many challenges in the District of Columbia, and was the beginning of the DC Chamber’s aggressive advocacy for quality education for all, affordable housing, and a highly trained workforce for every business. The DC Chamber’s mission and goal are a more inclusive economy—one that, first and foremost, serves the needs of all District residents. The DC Chamber recognizes that our long-term goals as an organization and as a city cannot be achieved if the social fabric of the District of Columbia is not stable, inclusive, and enduring. To provide economic opportunities to all, the District must become an attractive place for businesses of all types and sizes, employing workers of all skill levels. We must compete not only with other major employment centers across the country, but also with the highly competitive jurisdictions within our metropolitan region for residents, businesses, and jobs. The 2019 State of Business Report begins our conversation on building a competitive city and
um orld
uncil
the critical issues involved. A competitive city is one that attracts, supports, and maintains business establishments, workers, and residents, all at once. Each of these factors helps create an economic environment that can provide opportunities for growth and upward mobility. When business acts in its own enlightened selfinterest to support residents in every ward of the District, it has proven time and time again to be good for growth and bottom lines as well as for upward mobility for the people who live in the nation’s capital, Washington, DC. Our experience tells us that the daunting problems of concentrated poverty, a lack of affordable housing, and a besieged education system can be overcome if District businesses work in concert with the government and civic organizations to find solutions so that we become a more competitive city. An important part of this cooperation is ensuring the District adopts policies and laws offering the best amenities to DC businesses, employees, and non-DC resident employees in the region, creating an environment where DC businesses and DC residents can flourish—thus, building a competitive city.
Vincent Bernard Orange, Sr. President and CEO
contact@dcchamber.org | dcchamber.org Follow us on Twitter: @dcchamber
THE 2019 STATE OF BUSINESS REPORT
Chamber State of Business Report 2019 FINAL.indd 3
3
9/25/19 11:01 AM
EXECUTIVE SUMMARY
BUILDING A COMPETITIVE CITY
A competitive city is one that is attractive to businesses, workers, and residents, all at once. Each of these factors—business establishments, workers, and residents—helps create an economic environment that can provide opportunities for growth and upward mobility. In this way, a competitive city creates economic value that can be tapped to eliminate extreme poverty and promote shared prosperity. How can DC become more competitive within the Washington metropolitan area? The Washington metropolitan area is one of the top regions in the country for economic innovation, entrepreneurship, and high-growth firms. Within the metropolitan area, however, jurisdictions experience different economic outcomes because of the decisions they make that affect the flow of businesses, workers, and residents across their borders. These forces are constantly shifting: The District has seen significant economic and residential growth in recent years. At the same time, the dynamics of the metropolitan area—and DC’s place within it—have changed over time, moving jobs and
4
people out beyond the core counties of the metropolitan area and altering the relative power of DC and its suburbs and exurbs. In order to adjust to these changes and become a more competitive city within the Washington metropolitan area, the District of Columbia must assess its strong and weak competitive factors for businesses, workers, and residents. Businesses need strong economic conditions, skilled workers, and a stable business climate. A significant challenge for any business is managing uncertainty and risk. The most salient sources of uncertainty and risk that affect the metropolitan area are beyond its control: Recessionary and expansionary cycles, changes in interest rates and aggregate demand, federal government actions, and so forth. But while these circumstances have a deeper effect on business fundamentals, state and local decisions including regulatory actions and changes to jurisdictional tax regimes also shape business decisions on where to locate within the Washington metropolitan area. In DC, business establishments most frequently mentioned slow business or lost sales as a barrier to profitability, followed by unpredictability of business conditions and taxes. Concerns across the metropolitan area are similar, and sometimes stronger for these
BUILDING A COMPETITIVE CITY
Chamber State of Business Report 2019 FINAL.indd 4
9/25/19 11:01 AM
issues. The District is also less welcoming to and supportive of women- and minority-owned businesses than some other jurisdictions in the region.
workers who wish to break into middle-wage jobs. Nearly 12 percent of DC’s private sector employment is in occupations regulated by a professional licensing board.
Workers need an attractive compensation package, a depth of employment opportunities, and manageable commutes.
Residents need affordable housing, quality amenities, and paths to upward economic mobility.
In the region, DC has many factors in its favor making it attractive to workers: high average wages, a variety of employer benefits, strong worker protections, and relatively short commute times. At the same time, the concentration of DC’s employment opportunities in high-skill, high-paying jobs means that there are few opportunities for workers without professional degrees. In contrast, the rest of the metropolitan area has a higher concentration of middle- and lowwage jobs, including sales occupations, and occupations in education, transportation, and construction. Through aggressive professional licensing, DC also has created barriers for
DC is still the region’s most expensive place to live, even after taking higher average wages into account. This higher cost of living includes not only high housing costs, but also costs like childcare—which can account for over a third of the household budget for a family of four. However, DC is not alone in its struggles to provide housing that is affordable to families at a variety of income levels: 12 of the 24 jurisdictions in the metropolitan region are estimated to have higher housing costs than DC for families, including Fairfax and Arlington counties. However, unlike jurisdictions such as Fairfax City, Fairfax, and Loudoun, which offer low- and middle-income residents opportunities
FREQUENTLY USED TERMS IN THIS REPORT Core counties The urban and suburban counties that make up the core of the Washington metropolitan area, such as DC, Fairfax County, Montgomery County, Prince George’s County, and Arlington County. Exurban counties (or exurbia) The parts of the metropolitan area that are less dense than traditional core urban counties and suburbs, such as Rappahannock, Frederick, and Charles counties. Sprawl Sprawl generally refers to an ever-expanding footprint of a metropolitan area that results from population shifting to new development in suburbs and exurbs.
THE 2019 STATE OF BUSINESS REPORT
Chamber State of Business Report 2019 FINAL.indd 5
5
9/25/19 11:01 AM
COMPARATIVE REGIONAL OUTCOMES Despite operating under similar economic conditions, the jurisdictions that make up the Washington metropolitan area follow different growth trends. In recent years, business activity, employment opportunities, and population have moved away from key employment centers toward suburban counties. Business establishments The District houses the region’s greatest number of business establishments, ahead of other key business centers including Fairfax, Montgomery, and Prince William counties. Loudoun County exhibits the region’s highest rate of establishment growth. Since 2010, it has added the same number of establishments as its much larger neighbor, Fairfax County. Other exurban counties showed strong growth as well, as most new establishments have been following the strong population growth in the outer jurisdictions of the metropolitan area. Employment DC has always been the center of employment in the region, but in 2016, it reclaimed its position as the region’s top private sector employer, a distinction it had lost to Fairfax County in 1996. In fact, between 2010 and 2018, DC’s private sector employment growth rate of 19.3 percent was almost twice the rate of growth across the broader Washington metropolitan region. Part of the District of Columbia‘s attraction for employees is higher wages. Notably, the “DC wage premium” is highest for lower-paying jobs. For example, DC’s hotel and restaurant jobs pay 1.5 times more than similar jobs in
6
neighboring jurisdictions, and twice those of exurban counties. Arlington is another strong performer in private sector employment: its private employment grew by nearly 17 percent (with average wages on par with DC). Exurban counties, which collectively grew by 15 percent, follow. Residents The District has experienced strong population growth since 2006, though the rate of this growth has slowed in recent years. In 2018, new births and international immigration were entirely responsible for DC’s growth, replacing domestic migration, which was previously the main engine of population growth. In fact, in 2018, 936 more people left DC than moved in. The District’s immediate neighbors, including Fairfax, Arlington, Montgomery, and Prince George’s counties, as well as the City of Alexandria, have also seen out-migration since 2010, although births and new residents arriving from abroad have offset these losses.
photo: Ted Eytan
for economic mobility, DC scores extremely low on economic mobility measures in comparison to other parts of the metropolitan region and to the rest of the country.
INTRA-REGIONAL MOBILITY How business establishments move across the metropolitan area Fairfax County is the clear winner of interjurisdictional competition for business establishments. Between 2000 and 2015, for every 10 jobs lost because an establishment left Fairfax County, 14 jobs arrived because some new establishment moved in. In contrast, for every 10 jobs the District of Columbia received because an establishment moved in from other parts of the metropolitan area, it lost 24 jobs along with the establishments that decided to move out. How employees move across the metropolitan area The District’s workforce draws from the entire metropolitan area. Most DC workers live in the
BUILDING A COMPETITIVE CITY
Chamber State of Business Report 2019 FINAL.indd 6
9/25/19 11:01 AM
photo: Ted Eytan
District itself and nearby neighborhoods of Virginia and Maryland. Interestingly, while some other jurisdictions employ workers from even broader catchment areas, commute patterns are still somewhat localized: Fairfax County attracts very few workers from Maryland, for instance, and Montgomery County draws almost all of its workforce from within its own county borders. Workers often move to improve their commutes or find new jobs. Jobs are the top reason why people move to DC. Commute times and housing are the top reasons why people leave DC for other parts of the metropolitan area. How residents move across the metropolitan area The Washington metropolitan region sees an average of roughly 620,000 moves per
year that involve residents who moved from one location to another within the region. Meanwhile, people rarely move into the District of Columbia from the broader metropolitan area: Each year, 412,000 moves within the metropolitan area originate outside of the District, and of this group, only about 7,000 are moving into DC. Prince George’s County has been the most common destination for DC residents in recent years, followed by Montgomery County and Arlington. BUILDING A COMPETITIVE CITY: A FRAMEWORK FOR ANALYSIS To truly become competitive in the region, the District must become attractive to businesses, workers, and residents all at once. The factors
THE 2019 STATE OF BUSINESS REPORT
Chamber State of Business Report 2019 FINAL.indd 7
7
9/25/19 11:01 AM
Factors for businesses The viability and longevity of business establishments depend heavily on broader economic conditions, but the regulatory and fiscal environment in a jurisdiction, which is shaped by that jurisdiction’s government institutions, can be of enormous significance for business performance. Government policy— both fiscal and regulatory—can make it easy or difficult to start a business, sustain a business, and grow a business. Comparing these factors across jurisdictions in the Washington metropolitan area shows that despite its relative success, the District has significant room for improvement. One example of this is that DC consistently has fallen behind Fairfax, Loudoun, and Arlington counties in terms of survival rates for new businesses, with a performance similar to that of Montgomery County (and better than Prince George’s County). The top factors that DC firms report as negatively affecting their profitability are taxes, slow business or lost sales, and unpredictability of business conditions— similar concerns to those elsewhere in the metropolitan area. DC businesses are less likely than those elsewhere in the metropolitan area to cite lack of qualified labor as a negative impact on profitability. The District also has lower shares of businesses owned by women and people of color than most other jurisdictions in the area, while the highest rates of ownership for women are in Prince George’s County, Fairfax, and Manassas Park City, and the highest rates of minority business ownership are in Falls Church City, Prince George’s County, and Fairfax City.
8
Factors for workers Workers’ decisions about where to live and work are shaped by many factors, including ease and cost of commute and the depth of work opportunities. DC’s ability to compete for workers is mixed: DC leads the region in some measures, but its benefits are often unevenly and unequitably distributed. For instance, DC has a notable concentration of high-wage, high-skill jobs with extensive benefits, but fewer opportunities for workers who lack advanced degrees. The rest of the metropolitan area, in contrast, has a higher concentration of middle- and low-wage jobs that are available to workers from a wider variety of backgrounds. In addition, nearly 12 percent of private sector employment in DC is covered by occupational licensing restrictions, which often limit opportunities to middle- or low-wage jobs that do not require credentialing. Therefore, while DC employers draw workers from all over the United States (and the rest of the world) to fill lucrative positions, fewer localborn residents are able to benefit from DC’s own job market. Among all DC residents who were born in the District, only about one in 10 earn $75,000 or more per year, compared with one in three residents who moved here from other parts of the US. Factors for residents DC’s average wages are some of the highest in the Washington metropolitan area, but its cost of living is even higher: Overall, a family of four needs to be able to spend over $10,000 each month to meet its basic needs in the District, thanks largely to high housing and child care costs. The cost of living is also high in Fairfax, Arlington, and Loudoun counties, as well as the City of Fairfax. Prince George’s County has the lowest cost of living among the inner counties of the Washington metropolitan area, with a
photo: Aimee Custis
that matter for each of these three elements may be different, but they reinforce each other and help create an economic environment that can provide opportunities for growth and upward mobility.
BUILDING A COMPETITIVE CITY
Chamber State of Business Report 2019 FINAL.indd 8
9/25/19 11:01 AM
projected monthly budget for a family of four of $7,400.
photo: Aimee Custis
Low-income families fare poorly in the District compared to the rest of the metropolitan area, as DC has high levels of income inequality and low levels of economic mobility. Jurisdictions like Fairfax and Loudoun, meanwhile, may have high costs of living, but they also provide high levels of economic mobility for children born to low-income families. DC also has the lowest high school graduation rate in the metropolitan area—though graduation rates vary greatly by school. Other jurisdictions tend to report less variation in graduation rates.
Chamber State of Business Report 2019 FINAL.indd 9
Health outcomes also vary drastically across the metropolitan area, reflecting demographic differences and variations in the built environment. DC, for example, has been a national leader in health insurance expansion, and boasts an extremely low uninsured rate of around 4 percent. Consequently, DC ranks moderately well in some health outcomes such as the share of its population with low levels of physical activity, but it scores relatively poorly on measures such as its preventable hospitalization and vaccination rates compared to the rest of the region.
THE 2019 STATE OF BUSINESS REPORT
9
9/25/19 11:01 AM
INTRODUCTION
The Washington-Arlington-Alexandria, DC-VA-MD-WV Metropolitan Area (Washington metropolitan area, for short) is one of the top regions in the US for entrepreneurship, economic innovation, and high-growth firms.
photo: Ted Eytan
I. INTRA-REGIONAL DYNAMICS IN THE WASHINGTON METROPOLITAN AREA
With a strong employment base anchored by 364,000 federal employees and many more in adjacent private industries, the Washington metropolitan area has the fifth largest GDP in the country1 and the third-highest density of high-growth companies.2 The region has attracted over 44 new company headquarters
WHAT IS THE WASHINGTON METROPOLITAN AREA? Washington-Arlington-Alexandria, DC-VA-MD-WV Metropolitan area spans 24 jurisdictions across three states and DC. These include: District of Columbia
Virginia:
Maryland:
Arlington, Clarke, Culpeper, Fairfax, Fauquier, Loudoun, Prince William, Rappahannock, Spotsylvania, Stafford and Warren counties
Calvert, Charles, Frederick, Montgomery, and Prince George’s counties West Virginia: Jefferson County
The cities of Alexandria, Fairfax, Falls Church, Fredericksburg, Manassas, and Manassas Park
Of these jurisdictions, Calvert, Charles, and Frederick counties in Maryland, Jefferson County WV, and Clarke, Culpeper, Fauquier, Rappahannock, Spotsylvania, Stafford and Warren counties and the city of Fredericksburg in Virginia are considered exurban.
10
BUILDING A COMPETITIVE CITY
Chamber State of Business Report 2019 FINAL.indd 10
9/25/19 11:01 AM
photo: Ted Eytan
with 500 or more employees since 2000— including the recent addition, in late 2018, of Amazon’s much-anticipated HQ2.3 The various jurisdictions that make up the region benefit from each other’s economic strength, as they share the same consumer base, workforce, and economic opportunities. The Washington metropolitan area is made up of 24 jurisdictions that span across three states and the District of Columbia. Each jurisdiction contributes different types of labor, housing opportunities, and entrepreneurial talent to the region’s large economic base. Administrative differences across the region create a mosaic of communities with different amenities, business environments, housing opportunities, and education systems. Yet the metropolitan area’s jurisdictions share many other factors, such as underlying economic conditions, access to capital, the skill levels of the labor force, or availability of employment opportunities within a commuting distance.
These shared economic factors mean that residents, workers, and business establishments move often, and frequently cross jurisdictional lines. Businesses—start-ups, new transplants, and existing establishments—must choose where to locate within the region, continuously considering whether to open their doors in DC or Arlington, Rockville or Crystal City, Manassas or Fairfax, with an eye to profitability and growth. Residents and workers weigh their potential earnings and benefits from holding a job against various costs, such as the time and money spent commuting, the cost of childcare and housing, or the quality of neighborhood amenities—all with an eye toward prosperity and a shot for upward economic mobility. Thus, while they go through the ups and downs of the business cycle together, jurisdictions within the metropolitan area constantly compete for business establishments, employees, and residents. Policies that shape economic, fiscal, and business conditions can help jurisdictions capture a larger share of the economic activity in the region.
THE 2019 STATE OF BUSINESS REPORT
Chamber State of Business Report 2019 FINAL.indd 11
11
9/25/19 11:01 AM
II. COMPARATIVE REGIONAL OUTCOMES
Economic outcomes and population trends vary greatly across the jurisdictions that make up the Washington metropolitan area, even though they operate under similar economic conditions. Business activity, employment opportunities, and population centers have also moved outwards from the core counties over time, and
as a result, some of these core counties have lost their relative importance in the region in these areas. BUSINESS ESTABLISHMENTS Among the jurisdictions that make up the region, the District of Columbia houses the greatest number of business establishments within the Washington metropolitan area. In 2018, DC had 39,399 establishments, ahead
COMPARING THE JURISDICTIONS THAT MAKE UP THE REGION Unlike boundaries that are drawn to hold similar size populations for statistical or representational purposes, such as census tracts or the wards that make up DC, the county- and city-level jurisdictional boundaries that divide the metropolitan region are historical creations that are not comparable in size. Some are small and others are very large; some are residential population centers and others are business centers. Because jurisdictions in the metropolitan region encompass areas of different size, shape, and history looking solely at absolute numbers showing how businesses, workers, and residents are distributed across these jurisdictions does not allow us to draw any conclusions about their relative performance. For this reason, when comparing the outcomes across metropolitan area jurisdictions, this report focuses on growth rates to judge whether some regions are growing faster than others, and on changes in share of establishments, workers, and residents in each jurisdiction, to identify trends in competitive factors.
12
BUILDING A COMPETITIVE CITY
Chamber State of Business Report 2019 FINAL.indd 12
9/25/19 11:01 AM
of other core business centers such as Fairfax County and Montgomery County.4 This has been due to the District’s strong performance in increasing its number of net new establishments since 2010: During that period, the number
of establishments grew by 5,012 (15 percent). DC was particularly strong in adding new establishments in professional and business services, the core strength of the region. The District was also strong in adding new
FIGURE 1 – NET NEW START-UPS ACROSS WASHINGTON METROPOLITAN AREA JURISDICTIONS, 2010 TO 2018 Professional and business services
Other services
3,092
1,390
District of Columbia
Fairfax Co.
935
Exurbia
826
Leisure and hospitality
1,252
Information & Financial activities
529
754
310
Trade, transportation, and utilities
Construction and Manufacturing
228
95
309
-172
-48
414
195
139
-119
232
315
151
69
511
227
146
-205
-88
-30
-15
843
568
1,497
1,174
1,230
Loudoun Co.
Education and health services
568
430
Montgomery Co.
271
-546
Arlington Co.
294
399
161
89
148
-34
127
124
60
14
-102
-32
173
-73
248
193
-133
62
64
Others
Prince George's Co. 2010
2018
2010
2018
2010
2018
2010
2018
2010
2018
2010
2018
2010
2018
Source: Bureau of Labor Statistics, State and Metropolitan Area Employment, Hours, and Earnings
THE 2019 STATE OF BUSINESS REPORT
Chamber State of Business Report 2019 FINAL.indd 13
13
9/25/19 11:01 AM
establishments in education and health services, as well as in “other services,” a category which includes personal services and non-profits. However, the District is not the strongest performer in the region when it comes to the rate of establishment growth. That distinction belongs to Loudoun County, which added 3,300 net new establishments during the same period—on par with the much larger Fairfax County. Given its low starting point, this meant a growth rate of over 36 percent, or more than twice the rate of the second-best performers, DC and Arlington. Exurban counties showed strong growth, too, as most new establishments have been following the strong population growth in the outer jurisdictions of the metropolitan area. Both Loudoun and other parts of exurbia built their strength on net new start-ups in professional and business services, becoming important contenders for competing with the region’s core urban employment centers. The weakest performer in overall establishment growth—including establishment births, deaths, and in-migration—was Montgomery County,
which added just 323 net new establishments during the same nine-year period (1 percent growth), mostly due to its tepid establishment growth since 2015. The second-weakest performer, Prince George’s County, added 529 establishments on net (3.5 percent growth). EMPLOYMENT The District has always been the center of employment in the region, but this has been largely attributable to the presence of a large federal workforce. In 2016, the District reclaimed its role as the region’s top private sector employment center, a distinction it had lost to Fairfax County in 1996. By 2018, private sector employment in DC stood at 534,225, growing by 86,287 since 2010. This represented a growth rate of 19.3 percent, almost twice the rate of growth across the broader Washington metropolitan region. Other strong performers in private sector employment are Arlington, which grew by nearly 17 percent, and exurbia in general, which grew by 15 percent. Among the core counties
Number of Employees Number of Employees FIGURE 2 – EMPLOYMENT ACROSS COUNTIES OF THE METROPOLITAN AREA, 2000 TO 2018 Employment Levels, 2010 and 2018 Employment Levels, 2010 and 2018
Change since 2010 Change since 2010
% Change % Change
2010
2018
District of Columbia
2010 447,938
2018 534,225
District of Columbia
86,287
District of Columbia
19%
District Columbia Fairfax of Co.
447,938 495,750
534,225 530,037
District Columbia Fairfax of Co.
86,287 34,287
District Columbia Fairfax of Co.
19% 7%
Fairfax ExurbiaCo.
495,750 349,271
530,037 401,731
Fairfax ExurbiaCo.
34,287 52,460
Fairfax ExurbiaCo.
7% 15%
Exurbia Montgomery Co.
349,271 358,479
401,731 380,823
Exurbia Montgomery Co.
52,460 22,344
Exurbia Montgomery Co.
15% 6%
Montgomery Co. Co. Prince George's
358,479 212,404
380,823 230,431
Montgomery Co. Co. Prince George's
22,344 18,027
Montgomery Co. Co. Prince George's
Prince George's Co. Loudoun Co.
212,404 111,498
230,431 143,414
Prince George's Co. Loudoun Co.
18,027 31,916
Prince George's Co. Loudoun Co.
8% 29%
Loudoun Arlington Co. Co.
111,498 118,152
143,414 137,893
Loudoun Arlington Co. Co.
31,916 19,741
Loudoun Arlington Co. Co.
29% 17%
Arlington Others Co.
118,152 100,096
137,893 98,353
Arlington Others Co.
19,741 -1,743
Arlington Others Co.
17% -2%
Others
100,096
98,353
Others
-1,743
Others
-2%
6% 8%
https://www.bls.gov/sae. Source: Bureau of Labor Statistics, State and Metro Area Employment, Hours, and Earnings. Available at https://www.bls.gov/sae/.
Source: Bureau of Labor Statistics, State and Metro Area Employment, Hours, and Earnings. Available at https://www.bls.gov/sae/.
14
BUILDING A COMPETITIVE CITY
Chamber State of Business Report 2019 FINAL.indd 14
9/25/19 11:01 AM
FIGURE 3 – AVERAGE ANNUAL DC PAY RELATIVE TO OTHER JURISDICTIONS IN THE WASHINGTON METROPOLITAN AREA, BY INDUSTRY Average annual pay in DC relative to jurisdictions in the metropolitan Professional and Business
Education and Health
Leisure and Activity
Other Services
250% 245%
Financial Activities and Ins..
259%
200% 185%
151% 136%
134% 113%
158%
161% 131%
113%
118%
Source: Quarterly Census of Employment and Wages, Bureau of Labor Statistics. The list includes administrative units with 20,000 or more in private sector employment.
of the metropolitan region, Alexandria shrank by 4 percent, and Montgomery County showed the weakest growth at 6 percent. Part of the attraction of the District of Columbia to employees is the pay. Salaries and wages in the District have always been higher than the rest of the region, partly because of the direct competition with the federal government for talent, partly because business establishments attract workers with stronger qualifications, and partly because workers demand a premium for commuting from places outside the city. The premium attached to a DC job over jobs in its immediate neighboring jurisdictions
2017
2015
2013
2011
2017
2015
2013
2011
2015
2013
2011
2017
2015
2013
113% 2011
117% 2017
2013
2011
114%
117%
154%
187%
2017
150%
2013
169%
2011
159%
184%
179%
2017
179%
2015
200%
2015
DC Pay Relative to Other Jurisdictions
All Private
area
Geographical area Exurbia Neighboring jurisdictions
increased between 2010 and 2018 from 14 percent to 17 percent.5 In 2010, wages offered in Fairfax County were, on average, 4 percent higher than those offered in DC; by 2018, DC and Fairfax County wages had equalized. Private sector jobs in every industry now command a wage premium in the District compared to all of its neighboring counties and cities. Notably, the “DC wage premium” is highest for lower-paying jobs. For example, jobs in DC hotels and restaurants pay over 1.5 times hotel and restaurant jobs in nearby jurisdictions, and twice those in exurbia.
THE 2019 STATE OF BUSINESS REPORT
Chamber State of Business Report 2019 FINAL.indd 15
15
9/25/19 11:01 AM
photo: Aimee Custis
RESIDENTS The District’s economic boom came hand in hand with strong population growth. A larger population means more economic activity in the form of higher demand for goods and services and a more robust tax base. This has been evident in DC in the form of growing personal incomes and revenue collections. In fiscal year 2018, the District collected $8.86 billion in general fund revenue—a 73 percent increase (not adjusted for inflation) from the end of recession in fiscal year 2010. DC’s population boom peaked in 2009. Since then, the city has continued to add new residents—nearly 100,000 since 2010—albeit at a slower pace. Nearly 80 percent of this increase is due to natural growth (births minus deaths), and the remainder from net migration (both international and domestic). DC also had the highest level of internal mobility in the metropolitan area, with 10.1 percent of residents having moved within DC in the past year; another 8.3 percent having moved to DC from elsewhere in the country; and 1.6 percent having moved from abroad.6
16
In 2018, DC’s population grew by 2,400 fewer residents than the previous year. Furthermore, these gains were propelled entirely by new births and international immigration, rather than by domestic migration, which was previously the engine of population growth.7 In 2018, 936 more people left the District8 than moved in, reversing the trend of strong in-migration.9 Prince George’s County has been the most common destination for DC residents in recent years, followed by Montgomery County and Arlington.10 Every other jurisdiction in the metropolitan area has also seen net growth over time, but the degree and pace of that growth has varied widely. In Maryland, both Montgomery and Prince George’s counties have seen a high number of births and positive international migration—but also domestic out-migration, with roughly 50,000 more people leaving each of those counties than migrating in during that same time. In Virginia, DC’s immediate suburbs have also experienced domestic out-migration levels since 2010, although these have likewise been offset by births and new residents arriving from abroad.
BUILDING A COMPETITIVE CITY
Chamber State of Business Report 2019 FINAL.indd 16
9/25/19 11:01 AM
DC’s (less than 30,000). The greatest domestic out-migration has happened in Fairfax County, where over 93,000 more residents have left for other parts of the country than have moved in.
FIGURE 4 – COMPONENTS OF POPULATION CHANGE, 2010-18 AND 2017-18 200K
2010-2018
150K
127,711
100K
78,391
50K
29,540
0K
83,454
-40,740 -94,119
-100K
114,916 100,330
32,265
-50K
76,155
44,010
-52,084
-50,740
-53,636
-47,203
42,470 43,282
62,340 23,252
30,973
26,043
22,818
3,144
2,780
-19,390
-43,937
-150K
20K
10K
2018
photo: Aimee Custis
When residents move within the US and within the Washington metropolitan area, they are increasingly choosing the exurbs. Since 2010, Loudoun County’s net domestic migration levels (over 43,000) have been greater than
14,856
12,044
5,305
9,788 10,432
0K
13,475
3,592 -5,684 -14,533
-10K
9,302
3,793
5,404
-10,792
-9,946
-7,006
-7,002
Montgomery County
Prince George's County
7,443 3,033 -2,991
3,789 4,451 -2,509
-3,386
-2,288
-6,236
-20K District of Columbia
Fairfax
Loudoun County
Notes: Fairfax includes the combination area of Fairfax County, Falls Church City, and Fairfax City; Prince William includes the combination area of Prince William County, Manassas City, and Manassas Park City. ..
Prince William County
Frederick County
Arlington County
Alexandria
Components of population change Births Deaths Domestic Migration International Migration
THE 2019 STATE OF BUSINESS REPORT
Chamber State of Business Report 2019 FINAL.indd 17
17
9/25/19 11:01 AM
III. INTRA-REGIONAL MOBILITY
Unlike tax and regulatory regimes, which stop at administrative borders, residents, businesses, and capital flow quite easily across state and city lines within the metropolitan area, as people can live in one jurisdiction and own a business or work in another and invest their capital and energies in where their returns would be greatest.
this could mean proximity to their jobs, or the availability of short (or affordable) commutes. For residents, this could mean housing they can afford, or neighborhoods with amenities they desire. Thus, the region’s business, resident, and workforce flows are shaped by these pull and push factors—as evidenced by the strong flow of the businesses, workers, and residents within the region.
Employers can draw workers from across the region, as workers either make relatively short moves from one county to another, or simply take on a longer commute. In this sense, the DC area’s concentration of highly educated workers may draw an employer to choose this area over another part of the country, but that employer will not need to locate within the borders of the District in order to access its residential workforce. We have just experienced this with Amazon’s decision to locate HQ2 in Arlington.
Business establishments move a lot, but usually to nearby locations so they can stay close to their customer base, production networks, and employees. Between 2000 and 2015, the Washington metropolitan area witnessed the cross-jurisdictional movement of 52,291 establishments with five or more employees.11 Of these, 41,100 moved within the metropolitan area, and sometimes just a few blocks away,12 but nearly 40 percent—16,556, to be precise—were establishments moving across jurisdictional lines within the metropolitan area.13 These establishments moved with them 552,200 jobs.
With access to similar economic opportunities, the people and establishments that make up the metropolitan economy must each consider what else each location has to offer them. For businesses, this could be proximity to a cluster of similar establishments, regulatory and tax environment, ease of finding suitable space, or proximity to their customer base. For workers,
18
HOW ESTABLISHMENTS MOVE ACROSS THE METROPOLITAN REGION
The clear winner of inter-jurisdictional business establishment moves within the metropolitan area has been Fairfax County, when measured between 2000 and 2015, and for establishments with more than five employees. Between
BUILDING A COMPETITIVE CITY
Chamber State of Business Report 2019 FINAL.indd 18
9/25/19 11:01 AM
In
Chamber State of Business Report 2019 FINAL.indd 19
In In
In
24,857
5,561 4,099 5,008 7,005
In
Out In
Out
9,523 7,546
In
9,885
THE 2019 STATE OF BUSINESS REPORT In
In
In
In
28,974
108,422
635
326
289
321
215
1,256
1,529
1,194
1,025 741 548
1,350
1,335
1,026
732
454 179
0K
In
29,040 13,663
Out
Out
In
Out
In
Out
39,151
41,448
In
41,675
In
0K
Out
44,775
46,635
1,493
1,174
1,926 1,876
2,836
3K
Out
19,626
68,922
53,671
1K
Out
50K
In
Out
60,989 57,229
150K 152,615
2K
Out
111,473
Establishments
3,744
3,929
4K
Out
Employment at the time of move
Falls Church City
Manassas City
Stafford County
Frederick County
Fairfax City
Prince William County
Prince George's County
Alexandria City
District of Columbia
Loudoun County
Arlington County
Montgomery County
Fairfax County
FIGURE 5 – MOVEMENT OF ESTABLISHMENTS WITH FIVE OR MORE EMPLOYEES ACROSS Establishments with five orINmore and METROPOLITAN their employment REGION, at the time DIFFERENT JURISDICTIONS THEemployees, WASHINGTON 2000 TO 2015 of move Measure Names In Out
100K
Out and In for each Jurisdiction broken down by Class. Color shows details about Out and In. The marks are labeled by Out and In. The view is filtered on Jurisdiction, which keeps 18 of 24 members.
19
9/25/19 11:01 AM
2000 and 2015, after accounting for all the establishments that left, Fairfax County had net new 185 establishments that moved in from other jurisdictions in the metropolitan area. These firms brought with them 41,150 net new jobs. For every 10 jobs that left Fairfax County because an employer moved to a different jurisdiction, 14 new jobs came in because a new employer moved to Fairfax County.
In other words, for every 10 jobs the District received because an establishment moved in from other parts of the metropolitan area, it lost 24 jobs along with establishments that moved out.
While many start-ups are created in the District of Columbia, DC is a net exporter of business establishments (and therefore employees) to the rest of the metropolitan area. Compared to Fairfax’s influx of new establishments, the District lost 1,486 business establishments on net to other jurisdictions in the metropolitan area, taking with them 63,650 employees.
The Distirct’s private sector employers are as reliant on non-resident employees as the federal government is. Seven out of 10 private sector employees in the city are commuters from Maryland and Virginia. And about a third of District residents working in the private sector are reverse-commuters, living in DC but working in the suburbs.
HOW WORKERS MOVE ACROSS THE METROPOLITAN REGION
FIGURE 6 – CENSUS TRACTS WITH MORE THAN 150 RESIDENTS WORKING IN A GIVEN EMPLOYMENT CENTER: DC, FAIRFAX AND MONTGOMERY Tracts with +150 residents who work in DC
© Mapbox © OSM
...in Fairfax County
© Mapbox © OSM
Notes: The data presented are for 2015. Only census tracts with 25 or more workers working in the destination county are included.
...and in Montgomery County
© Mapbox © OSM
Total Workers 25
2,000
Source: US Census Bureau LODES database version 7.3.
20
BUILDING A COMPETITIVE CITY
Chamber State of Business Report 2019 FINAL.indd 20
9/25/19 11:01 AM
The District’s resident workforce is younger than the workforce in most other parts of the metropolitan area. Therefore, DC workers receive lower average salaries than the workers who reside in other jurisdictions. Commuters, on the other hand, tend to be older and tend to receive higher salaries: Just 20 percent of commuters who live outside of DC but work within it are under the age of 30— compared to 30 percent of DC residents who live and work in the city. Sixty eight percent of commuters earn an annual salary over $40,000; compared to 58 percent of DC residents who work in the city. While labor in the region is quite mobile, definite trends emerge for where people live and work when considering the key employment centers in the region. US Census Bureau data show that DC, Fairfax County, and Montgomery County have carved their own niches into the region in terms of where they attract the bulk of their respective workforce:14 •
•
•
While the District’s workforce includes residents from nearly all census tracts in the metropolitan area, the greatest number of workers live in the District, Prince George’s County, and parts of northern Virginia and Montgomery County closest to DC, such as Bethesda, Arlington, Falls Church, and McLean. Fairfax County’s workforce is spread even more broadly than the District’s, but most of its workforce lives in Virginia: Within the county and its cities within (Falls Church, Alexandria, and Fairfax City) and in surrounding neighborhoods in Arlington, Prince William, Loudoun, and Fauquier counties. Fairfax County attracts very few workers from Maryland. The few DC residents who do work in Fairfax tend to live west of Rock Creek Park. In Maryland, Montgomery County has the most geographically concentrated
workforce. It draws almost all of its workers from within its own county borders, with some concentration of workers in lower parts of Frederick County and neighborhoods in Prince George’s County along the border. These findings suggest that there is a greater concentration of workers by where they work than meets the eye. It also suggests that while the District can attract workers from all over the metropolitan area, it is not the only jurisdiction with this distinction, as Fairfax County also is quite competitive on this front. HOW RESIDENTS MOVE ACROSS THE METROPOLITAN REGION Like businesses, people move frequently within the Washington metropolitan area. And when people move, they also mostly move nearby. In the five years between 2013 and 2017, the Washington metropolitan region witnessed an average 837,000 moves per year where it was the final destination. Of these, 216,000 were new residents moving from other parts of the country, and another 80,000 were residents moving here from abroad. The remaining 620,000 were Washington metropolitan area residents who relocated within the region. When DC residents move to a neighborhood outside of the city, they tend to relocate to Arlington, Alexandria, Fairfax County (and especially its northern tip, around McLean), or Falls Church in Virginia, and along the Interstate 270 corridor up to Frederick County in Maryland. Meanwhile, reverse moves from the broader metropolitan area into the District of Columbia are rare. Each year, 412,000 moves within the metropolitan area originate outside of the District, and of this group, only about 7,000 move their households into the District.
THE 2019 STATE OF BUSINESS REPORT
Chamber State of Business Report 2019 FINAL.indd 21
21
9/25/19 11:01 AM
FIGURE 7 – ANNUAL MOVES WITHIN THE WASHINGTON METROPOLITAN AREA, BY CENSUS TRACT Tracts to where 50+ DC residents have moved
© 2019 Mapbox © OpenStreetMap
Tracts to where 50+ non-DC residents have moved
© 2019 Mapbox © OpenStreetMap
Note: Census tracts are displayed if they have at least 500 residents and have received more than 50 new residents over the year prior to the survey. Source: US Census Bureau American Community Survey, 2017.
Housing is also a notable push factor: Almost a quarter (23 percent) of those who left DC for the suburbs cite cheaper or better housing as their reason, and housing is also the biggest driver for moves that happen between Maryland and Virginia.
22
Jobs constitute the third most important reason for intra-regional moves. Among metropolitan area residents who moved within the region, about 19 percent who relocated to the District, 17 percent who relocated to Maryland and Virginia from DC, and 13 percent who moved between Maryland and Virginia cite a change in job status as their reason for moving. Change in marital status or other familyrelated changes also prompt moves from one jurisdiction in the region to another, but less frequently. photo: Aimee Custis Photography
Region-wide, housing and an easier commute are the top two reasons why people move within the Washington metropolitan area. For residents of the District, an easier commute is the most common reason why they move from Maryland or Virginia into DC.
BUILDING A COMPETITIVE CITY
Chamber State of Business Report 2019 FINAL.indd 22
9/25/19 11:01 AM
photo: Aimee Custis Photography Chamber State of Business Report 2019 FINAL.indd 23
23
9/25/19 11:01 AM
IV. BUILDING A COMPETITIVE CITY: A FRAMEWORK FOR ANALYSIS
A competitive city is one that attracts, supports, and maintains business establishments, workers, and residents, all at once. Each of these factors helps create an economic environment that can provide opportunities for growth and upward mobility. Business establishments offer goods and services to residents and other businesses, investment opportunities for investors, and opportunities for work for the labor force; workers offer talent and labor; and residents of all backgrounds offer a strong customer base, as well as contribute to a vibrant and cosmopolitan culture. In addition, businesses, workers, and residents all directly or indirectly contribute to their jurisdictions’ revenue. The government plays a key role in the competitiveness of a jurisdiction by deciding how much to invest in public programs, amenities, and infrastructure; and how to shape the fiscal and regulatory environment. Public investments, when made wisely, can add to future opportunities—both through tangible infrastructure such as roads, public transportation systems, parks, and libraries, and through investments in the businesses,
24
workers, and residents themselves. Businesses benefit from a fiscally stable government with strong services. Workers benefit from workforce investments that help them thrive and increase the workforce’s overall quality and productivity. Residents benefit from strong safety nets and better health and education services that can help them maximize future opportunities. The rules that governments set (for example, through regulations and zoning) can deeply affect business formation, survival, and growth; the cost of doing business; and business owners’ ability to expand employment. Government policy also affects wages through minimum wage laws, as well as through requirements regarding employer-provided benefits and industry-wide requirements such as professional licensing. Finally, government policy can affect not only the cost of living for residents, but also the likelihood of improving their future economic trajectories through public education and other public supports. FACTORS FOR BUSINESSES The viability and longevity of business establishments depend heavily on broader economic conditions. At the same time, the regulatory and fiscal environment in a jurisdiction, which is shaped by that
BUILDING A COMPETITIVE CITY
Chamber State of Business Report 2019 FINAL.indd 24
9/25/19 11:01 AM
FIGURE 8 – SOURCES, FACTORS, AND MEASURES OF COMPETITIVENESS POTENTIALLY SHAPED BY POLICY Competitiveness dimension
Selected factors
Areas impacted by government policies
Business establishments
Opportunity for growth
•
Start-up rates
•
Survival rate
•
Barriers to profitability
•
Opportunitites for all
•
Regulatory certainty
•
Tax regime
Proximity to work
•
Commute times
Depth of talent and opportunities
•
Occupational diversity
•
Worker supports
Economic opportunity
•
Upward mobility
Life outcomes
•
Housing costs
•
Health and education
Business and regulatory environment
Workers
Residents
jurisdiction’s government institutions, can be of enormous significance for business performance. Government policy—both fiscal and regulatory—can make it easy or difficult to start a business, sustain a business, and grow a business. Comparing these factors across jurisdictions in the Washington metropolitan area shows that despite its relative success, the District has significant room for improvement. Start-up rates Many aspiring entrepreneurs dream of starting a new business; some even take the step to fill out the paperwork to start one. But only a portion of these applications will actually turn into wage-paying businesses within the next year. The Census Bureau classifies those with a solid business plan or paid employees as high-propensity businesses, meaning that they
have already developed beyond aspirations, and their founders have taken steps to form a functioning business.15 In the District of Columbia, only about a fifth of business license applications from highpropensity firms turn into actual establishments within a year. By this metric, the District lags behind its neighbors. In Virginia, about a third of business applications by high-propensity applicants turn to actual businesses, and a quarter do so in Maryland. Survival rates Many factors play a role in business survival, including the quality of the business plan, management capability and performance, the broader business cycle and economic conditions that shape demand, as well as access to credit and investments and tax and
THE 2019 STATE OF BUSINESS REPORT
Chamber State of Business Report 2019 FINAL.indd 25
25
9/25/19 11:01 AM
FIGURE 9 – BUSINESS SURVIVAL RATES IN KEY EMPLOYMENT CENTERS IN THE WASHINGTON METROPOLITAN AREA Years in Business
District of Columbia
Fairfax County
Montgomery County
5-Year Survival Rate 80%
83%
76%
75%
81%
79%
83% 80%
77%
75%
84%
83%
83% 80%
Loudoun County
81%
82% 77%
76%
88% 82%
81%
81%
80%
77%
75%
73% 75% 71% 64%
60%
57% 58%
60% 10-Year Survival Rate
55%
58%
55%
60%
60%
60%
62% 60%
55% 54%
58%
55%
65%
59%
57%
55% 55%
50%
45%
60%
60% 49%
48%
50% 15-Year Survival Rate 45% 40%
Arlington County
86%
83%
70%
50%
86%
87%
86% 85%
Prince George's County
43% 39%
37%
43% 40%
37%
40%
47%
49%
51%
45%
41%
40%
37% 48%
20-Year Survival Rate
40%
42%
37%
37% 33%
30%
35%
33%
32%
33%
32%
30%
27%
45%
45%
40% 25-Year Survival Rate 35%
35%
34%
31%
2005-09
After 2010
2000-04
1995-99
1990-94
2005-09
After 2010
2000-04
1995-99
1990-94
2005-09
After 2010
2000-04
1995-99
1990-94
After 2010
2005-09
2000-04
1995-99
1990-94
2005-09
After 2010
2000-04
1995-99
1990-94
2005-09
After 2010
2000-04
27% 1995-99
1990-94
30% 28%
Five-year windows when establishments first appear in the dataset. Note: Survival rates are calculated based on where establishments closed. Source: NETS database, excludes public administration, K-12 education and universities.
26
BUILDING A COMPETITIVE CITY
Chamber State of Business Report 2019 FINAL.indd 26
9/25/19 11:01 AM
regulatory changes that can impact costs, productivity, and ultimately profitability. Across the Washington metropolitan region, establishments operate under similar economic conditions. As such, survival rates16 of establishments, when broken down by jurisdiction, are relatively close—within five to eight percentage points of each other over the first five years. Yet, jurisdictional differences persist—and, in some cases, increase over time. In the District of Columbia, the five-year survival rate for establishments that first began their operations between 1990 and 1994 was 76 percent, on average, but improved over time. For the cohort that began operations after 2010, the average five-year survival rate was 81 percent. Still, DC consistently has lagged behind Fairfax, Loudoun, and Arlington counties, and its performance was similar to that of Montgomery County (and better than Prince George’s County). Taking the longer-term view, DC’s 10-year business survival rates have ranged from 58 percent for the cohort that started operations between 2000 and 2005 to 55 percent for the cohort that started operations between 2005 and 2009, when the Great Recession hit the economy. The District’s performance here has been slightly worse than Fairfax and Montgomery counties, except for establishments that hit their 10-year mark during the Great Recession. Loudoun County really begins to shine at the 10-year range, with survival rates that are more than 10 percentage points higher than other jurisdictions in the region. Prince George’s County, on the other hand, showed a much weaker performance in this range. These differences have compounded into a much higher establishment formation rate in Loudoun County, as shown elsewhere in this report. DC establishments’ survival rates after 15 and 20 years are consistently below regional rates, though not as low as Prince George’s County.
For every 100 establishments that began their operations between 2000 and 2004 in the District of Columbia, 37 were still in operation after 15 years. The comparable numbers are 40 in Fairfax and Montgomery counties, 41 in Arlington, and 49 in Loudoun County. These gaps hold for 20-year survival rates as well. Barriers to profitability It is very difficult to measure how jurisdictional policies shape the entrepreneurial landscape since policy decisions are largely dependent on economic conditions. In these cases, the perceptions of business owners can be enlightening. The US Census Bureau’s Annual Survey of Entrepreneurs asks firms about the factors that most negatively impact their profitability. The most recent data from 2016 show that the top factors that DC firms report as negatively affecting their profitability are taxes, slow business or lost sales, and unpredictability of business conditions. Entrepreneurs’ responses to this question of barriers to profitability highlight the importance of economic conditions. The most frequently mentioned barrier among the District’s business owners is slow business or lost sales: 39 percent of all establishments that responded to this question in the District of Columbia mention broader economic conditions as a concern. This is followed by “unpredictability,” which can reflect both economic conditions and policy actions. Taxes are the third most frequent concern, mentioned by 37 percent of businesses that responded to the question. Larger firms are more likely than small firms to cite regulations and finding qualified labor as harming profitability. Firms of all sizes say late payment or nonpayment from customers has negative effects. Small firms are more likely to say a lack of access to financial capital has harmed their profitability—about one in nine firms (11.4 percent) say this has had a negative impact, but these establishments collectively hire only one in 15 employees (6.6 percent).
THE 2019 STATE OF BUSINESS REPORT
Chamber State of Business Report 2019 FINAL.indd 27
27
9/25/19 11:01 AM
FIGURE 10 – NEGATIVE IMPACTS ON PROFITABILITY REPORTED BY ESTABLISHMENTS IN DC AND WASHINGTON METROPOLITAN AREA Slow business or lost sales
Unpredictability of business conditions
Taxes
50%
Government regulations
Finding Access to qualified labor financial capital
Changes or updates in technology
Cost of financial capital
45%
42% 37%
39%
36% 29%
30%
30%
28%
28% 17%
17% 11%
10%
17%
11%
13%
12%
13%
12%
photo: wocintechchat.com
20%
Washington Metropolitan Area
22%
District of Columbia
Share of firms
40%
39%
Late or nonpayment from customers
0%
Share in employment
40%
35%
35%
34%
37%
39%
41% 33% 28%
30%
28%
30%
29% 25%
20%
17%
10%
7%
19%
8%
Source: US Census Bureau, Annual Survey of Entrepreneurs, Characteristics of Businesses, 2016. The percentages are calculated for firms that have responded to the questions. For the District of Columbia, the response rate was 49 percent; for the Washington metropolitan area, it was 61 percent.
Across the metropolitan area, businesses mention similar concerns, but more frequently. Some 45 percent of regional firms see taxes as a negative impact on profitability compared to 36 percent within the District. This is not necessarily an indication of the differential tax burdens on businesses, as it could also be a reflection of the types of firms that have responded to the survey questions: The average DC firm in this sample had 23 employees compared to 17 for the average
28
Washington Metropolitan Area
District of Columbia
Washington Metropolitan Area
District of Columbia
Washington Metropolitan Area
District of Columbia
Washington Metropolitan Area
District of Columbia
Washington Metropolitan Area
District of Columbia
Washington Metropolitan Area
District of Columbia
Washington Metropolitan Area
District of Columbia
Washington Metropolitan Area
District of Columbia
0%
District of Columbia Washington Metropolitan Area
metropolitan area firm, and DC firms paid higher average salaries ($78,000) than firms across the entire metropolitan area ($64,000). Business climate unpredictability As discussed in the previous section, unpredictability of business conditions is one of the most highly cited concerns for profitability among DC firms, with 37 percent of firms (representing 34 percent of DC’s private employment) reporting this has a negative
BUILDING A COMPETITIVE CITY
Chamber State of Business Report 2019 FINAL.indd 28
9/25/19 11:01 AM
photo: wocintechchat.com
impact. A slightly lower share of firms report the same in the rest of the metropolitan area (39 percent of firms, representing 37 percent of employment), although it is still a broadlyshared issue across jurisdictions. Business climate unpredictability can take the form of whether new taxes, regulations, or other requirements will be enacted, and whether and how they will be implemented. Other types of unpredictability can also play larger roles in different industry sectors. In real estate, for instance, the combination of regulatory requirements, zoning restrictions, and legal challenges often leads to a high degree of uncertainty and delay, increasing the overall cost of new housing and other developments. The total impact of regulatory burdens represents roughly a quarter of the average price of newly built single-family homes, according to estimates by the National Association of Home Builders.17
Taxes Research generally finds that in explaining economic growth, overall economic conditions, federal tax policy, and the availability of strong public services play a much larger role than a jurisdiction’s tax regime, specifically when considering corporate taxes at the state level.18 Yet there is also increasing consensus that local tax regimes and regulatory environment play a stronger role in intra-jurisdictional competition.19 In other words, while broader economic conditions have a greater overall impact on a jurisdiction’s economic growth than changes to the local tax code, tax and regulatory differences between jurisdictions within a single metropolitan area—such as between DC and Fairfax, or between Arlington and Montgomery County—may have a noticeable effect on where businesses locate and the relative extent of their growth in those areas.
THE 2019 STATE OF BUSINESS REPORT
Chamber State of Business Report 2019 FINAL.indd 29
29
9/25/19 11:01 AM
Taxes on businesses in the District of Columbia tend to be higher than taxes in surrounding jurisdictions. Tax differentials are especially large for commercial property taxes. Taxes the District of Columbia are 5.7 percent of total value added in the city, according to one research report.20 Of this amount, property taxes account for the largest share at 2.21 percent of all value added. DC is the only jurisdiction in the region with a commercial property tax regime different from its residential property tax regime.21
Equally important is the frequency with which commercial property tax rates have been changed in recent years.22 Since the beginning of 2018, the District has adjusted its commercial property tax regime multiple times.23 As much of commercial space is leased through agreements that pass on any increases in property taxes to tenants, this has been a source of uncertainty (and cost) for business establishments of all sizes and kinds. At the same time, DC also enacted a variety of property tax breaks to selected entities
FIGURE 11 – COMPARATIVE TAX RATES IN THE REGION Income/ franchise
Personal property tax
Gross receipts
General sales tax
Parking tax
(Value less than $250,000)
Commercial Paid property family leave (per $100 of assessed value)
District of Columbia 8.25%
3.4%1
See note3
6%
18%
$1.65/ 1.77/ 1.899
0.62%10
Montgomery County
8.25%
1.8535%2
n/a
6%
n/a
$0.981
n/a
Prince George’s County
8.25%
2.5%2
n/a
6%
n/a
$1.112
n/a
Arlington County
6%
5%
0.36%4
6%
n/a
$0.9939
n/a
Fairfax County
6%
4.57%
0.31%5
6%
n/a
$1.159
n/a
City of Fairfax
6%
4.13%
0.4%6
6%
n/a
$1.083
n/a
City of Alexandria
6%
4.75%
0.58%7
6%
n/a
$1.13
n/a
Table Notes: [1] 3.4% taxable personal property tax greater than $225,000. [2] Montgomery and Prince George’s County municipalities add additional supplemental property tax. [3] Imposed on firms with gross receipts greater than $5 million at a flat rate of $5,000 to $16,500, depending on the size of gross receipts. Will expire when the District repays baseball bonds. [4] Arlington County Gross Receipts Taxes are based on company industry: Professional Services (0.36%), Business Services (0.35%), Software (0.18%). [5] Fairfax County Gross Receipts Taxes are based on company industry: Professional Services (0.31%), Business Services (0.19%), Software (0%). [6] City of Fairfax Gross Receipts Taxes are based on company industry: Professional Services (0.40%), Business Services (0.27%), Software (0%). [7] City of Alexandria Gross Receipts Taxes are based on company industry: Professional Services (0.58%), Business Services (0.35%), Software (0.35%). [8] Lowest rate applied to assessed values less than $5 million; second rate applied to assessed value between $5 and $10 million; highest rate applied to assessed value greater than $10 million. [9] In Arlington County, Fairfax County, and Fairfax City, properties designated as “commercial” are also subject to the additional real estate tax of (surcharge) per $100 of assessed value if they are in the transportation district (Transportation Capital Fund). [10] As of July 2019. The tax is imposed on total payroll of all businesses in the District. Benefits to begin in July of 2020.
30
BUILDING A COMPETITIVE CITY
Chamber State of Business Report 2019 FINAL.indd 30
9/25/19 11:01 AM
FIGURE 12 – SHARE OF ESTABLISHMENTS, EMPLOYMENT, AND GROSS RECEIPTS FOR ESTABLISHMENTS OWNED BY WOMEN AND MINORITIES (AMONG BUSINESSES WITH FIVE OR MORE EMPLOYEES)
Women-owned 15%
Prince George's County
12%
11%
Fairfax County
8%
10%
Manassas Park City Prince William County
10%
Falls Church City
10%
Montgomery County
10%
Loudoun County
9%
Stafford County
9%
Fairfax City
9%
District of Columbia
9%
13% 5% 8%
7%
6%
7% 8% 12%
9% 5%
9%
7%
5%
4%
3%
3% 0%
6%
5%
6%
Manassas City
8%
7%
7%
Fauquier County
13%
7%
8%
Alexandria City Arlington County
9%
9%
4%
3%
5%
10%
15%
0%
Share of Establishments
3%
5%
10%
15% 0%
Share of Employment
5%
10%
15%
Share of Gross Receipts
Minority-owned Falls Church City
12%
Prince George's County
12%
12%
11%
Fauquier County
11%
8%
Fairfax County
11%
8%
Fairfax City
11%
Loudoun County
11%
8%
Arlington County
8% 0%
5%
10%
Share of Establishments
7% 5%
8%
6%
7%
5%
4%
4%
5%
4% 9%
8%
Manassas Park City
11% 7%
8%
10%
District of Columbia
7%
7%
10%
Prince William County
7%
8%
10%
Alexandria City
7%
12%
11%
Montgomery County
7% 10%
Stafford County
Manassas City
9%
9%
0%
5%
10%
Share of Employment
9% 0%
5%
10%
Share of Workers
Source: D.C. Policy Center analysis of the NETS database; excludes public administration, K-12 Education and universities.
THE 2019 STATE OF BUSINESS REPORT
Chamber State of Business Report 2019 FINAL.indd 31
31
9/25/19 11:01 AM
through individual tax abatements. In fact, while many other business tax incentives have received much attention, the biggest source of incentives for businesses in the District of Columbia are individual tax abatements. In the last two years, the city has also increased general sales taxes and sales taxes on hotel rooms, imposed a new gross receipts taxes on car-sharing companies, increased deed taxes on high-value transactions, added new surcharges on electricity and gas consumption, and enacted a 0.62 percent payroll tax for paid family leave. Entrepreneurship climate for women and people of color In recent years, businesses owned by women24 and people of color25 have been the fastest growing source of employment across the nation. However, among businesses with five or more employees, women- and minority-owned businesses constitute a smaller share of the economy in the District.26 In the District, only 8 percent of establishments with five or more employees are owned by women, and they account for only 4 percent of employment and gross receipts. In Fairfax County, 11 percent of all businesses with five or more employees are owned by women, and these businesses account for 8 percent of employment and 7 percent of gross receipts. Meanwhile, all other large employment centers in the metropolitan area outperform the District in terms of the share of businesses that are owned by people of color. In the District, minority-owned establishments are 9 percent of all establishments with five or more employees, accounting for 5 percent of employment and gross receipts alike. Prince George’s County leads the region when it comes to minority-owned businesses, which account for 15 percent of establishments, 12 percent of employment, and 9 percent of gross receipts among establishments with five or more employees.
32
FACTORS FOR WORKERS Ease of commute The average commute time for the Washington metropolitan area is 34.9 minutes. Across the metropolitan area and in all jurisdictions, the most common commute mode is driving, with an average commute time of 33 minutes – 7.4 minutes longer than the national average of 25.6 minutes. Meanwhile, the average public transportation commute time for the region (49.6 minutes) is similar to the national average (50.4 minutes), while public transportation commute times for Alexandria, DC, and Arlington are significantly lower. Public transportation use is highest in DC (32.7 percent), but the proportion of workers commuting by transit has seen a pronounced decline from previous years. Depth of work opportunities Compared to DC, no other jurisdiction in the region has such a combination of high- and low-skilled workers. Educational attainment of residents aged 25 and older shows that the District has a large concentration of both highly educated residents, and residents with few qualifications. A third of all DC residents aged 25 and older have an advanced degree— the third highest percentage among the major employment centers in the Washington metropolitan region, behind Falls Church and Arlington. At the same time, 10 percent of DC residents 25 and older did not graduate from high school. For them, employment opportunities are even more limited given the type of worker they compete against in the competition in the regional job market. This education gap is highly relevant because DC’s economy is far more concentrated in the types of workers that it employs compared to the overall Washington metropolitan region. Just four occupation groups— business and financial, management, office
BUILDING A COMPETITIVE CITY
Chamber State of Business Report 2019 FINAL.indd 32
9/25/19 11:01 AM
FIGURE 13 – COMMUTE TIMES IN THE REGION
FIGURE 14 – EDUCATIONAL ATTAINMENT IN THE WASHINGTON METROPOLITAN AREA’S JURISDICTIONS Share of residents age 25+ with advanced degrees
Share of residents age 25+ who did not graduate high school 43%
Falls Church
39%
Arlington DC
33%
Prince George's County
Alexandria
33%
Jefferson County
32%
Montgomery County
14% 11% 11% 10%
DC
27%
Fairfax City
24%
Loudoun County
18%
Prince William County
30%
Fairfax County
19%
Manassas City Manassas Park City
Montgomery County
9%
Fauquier County
9%
Prince William County
16%
Alexandria
9%
Stafford County
16%
Fairfax County
8%
Prince George's County
14%
Fairfax City
Fauquier County
13%
Loudoun County
8% 7%
Manassas City
12%
Stafford County
6%
Jefferson County
12%
Arlington
6%
10%
Manassas Park City 0%
10%
Falls Church 20%
30%
40%
50%
2% 0%
10%
20%
30%
40% 50%
Source: US Census Bureau, American Community Survey, 2017.
THE 2019 STATE OF BUSINESS REPORT
Chamber State of Business Report 2019 FINAL.indd 33
33
9/25/19 11:01 AM
and administrative support, and food service occupations—account for some 45 percent of private sector employment in the District. DC also has a particularly high concentration of lawyers, scientists, and designers compared with other parts of the Washington metropolitan area. In contrast, the rest of the metropolitan area has a higher concentration of middle- and lower-wage jobs—including sales occupations, occupations in education, transportation, and construction—compared to the District. As a result, while DC employers draw workers from all over the United States (and the rest of the world) to fill high-skill, high-paying jobs, its residents are less likely to benefit from this job market. DC residents born and raised in the District have higher unemployment levels than those born elsewhere and are more likely to
34
hold lower-wage jobs. Among all DC residents who were born in the District, only about one in 10 earn $75,000 or more per year, compared with one in three residents who moved here from other parts of the US.27 Barriers to work Occupational licensing plays an important role in employment, wages, mobility, and the health of the labor market. State licensing can act as an impediment to worker mobility and when onerous, can close paths to well-paying jobs.28 Licensed workers generally earn more and experience less unemployment than their unlicensed peers across the country. This seems like a good thing, but only for those workers who can pay the requisite fees or meet regulatory requirements. Licensing also limits mobility, as licensed workers are less likely to move across state lines, which limits their ability
BUILDING A COMPETITIVE CITY
Chamber State of Business Report 2019 FINAL.indd 34
9/25/19 11:01 AM
Professional Licensing Administration. This is in addition to 20 other boards that are responsible for the licensing of more than 50 health and mental health occupations. In 2017, DCRA licensed 69,863 individuals for professional activities in DC—nearly 12 percent of private sector employment in the city in that year.29 Most of the licensing under DCRA focuses on middle- or low-wage jobs that do not require levels of education or formal training.
to seek higher-paying opportunities in more lucrative markets. Professional licensing in DC impacts many of the city’s middle-wage jobs, sometimes closing opportunities for low-income residents. The District Department of Regulatory Affairs (DCRA) regulates 125 occupational and professional categories organized under 18 different boards under its Occupational and
FIGURE 15 – DISTRIBUTION OF THE WORKFORCE BY TYPE OF OCCUPATION, WASHINGTON DC AND WASHINGTON METROPOLITAN AREA 15%
15%
District of Columbia
12% 11% 10% 8% 6%
6%
5%
5%
5%
5%
4%
4%
3%
3%
2%
2%
2%
2%
2%
2%
1%
0%
1%
13%
10%
10% 8%
8%
9% 7% 6% 5% 2%
2%
Arts, Design, Entertainment, Sports, and Media Occupations
5%
Legal Occupations
Washington Metropolitan Area
15%
3%
3%
4% 3%
4% 2%
2%
3% 2%
2%
1%
Production Occupations
Installation, Maintenance, and Repair Occupations
Community and Social Service Occupations
Architecture and Engineering Occupations
Construction and Extraction Occupations
Healthcare Support Occupations
Transportation and Material Moving Occupations
Personal Care and Service Occupations
Building and Grounds Cleaning and Maintenance Occupations
Life, Physical, and Social Science Occupations
Sales and Related Occupations
Protective Service Occupations
Healthcare Practitioners and Technical Occupations
Education, Training, and Library Occupations
Computer and Mathematical Occupations
Food Preparation and Serving Related Occupations
Office and Administrative Support Occupations
Management Occupations
Business and Financial Operations Occupations
0%
Source: Bureau of Labor Statistics, May 2018 Occupational Employment Statatistics
THE 2019 STATE OF BUSINESS REPORT
Chamber State of Business Report 2019 FINAL.indd 35
35
9/25/19 11:01 AM
Worker supports and protections With the federal government playing such a strong role in DC employment and, to a lesser extent, the metropolitan region, it should come as no surprise that a high share of workers receives paid time off, health insurance, retirement contributions, and other employerprovided benefits. Across both public and private sectors and all employment types, 84 percent of employed workers in DC have private health insurance, a share that is roughly similar to rates in Maryland and Virginia. However, while all three jurisdictions have expanded their share of public coverage among employed workers since 2012, DC remains in the lead with 13 percent of private workers covered by public plans (compared to 9 percent in Maryland and 5 percent in Virginia), and just 5 percent of employed workers reporting no health insurance coverage (compared to 9 percent in Maryland and 12 percent in Virginia). At a higher level, the availability of worker supports and benefits does not vary dramatically by state, according to state-level data from the US Census Bureau’s Survey of Entrepreneurs. However, this survey does not cover contractors, subcontractors, temporary staffing, paid day laborers, or other types of non-employee workers. Within this private employer universe, roughly nine in 10 paid employees work at a business that offers paid holidays, vacation, and/or sick leave, and a similar share work at a business that offers some level of health insurance coverage. DC employers are also more likely than those in Maryland and Virginia to offer contributions to retirement plans and profit sharing or stock options, but somewhat less likely to offer tuition assistance. Nationally, roughly one third (34 percent) of organizations increased the benefits offered to employees in the past year, according to the Society for Human Resource Management,
36
most often in order to retain employees, attract new talent, or in response to feedback.30 However, more nuanced differences emerge in the type and extent of benefits offered. While almost all organizations offer exempt employees paid vacation (96 percent) and paid sick leave (79 percent) nationally, only 35 percent offer paid maternity leave—although this share has increased from 26 percent just two years prior.31 The type and amount of paid leave offered to employees can vary by state and by locality. DC’s universal paid family leave requirement, for instance, is scheduled to be available to employees who work in the District beginning in July of 2020. This change could make DC-based businesses more attractive for high-skill workers than those based in Virginia or Maryland. The research on the impact of paid leave has mixed findings. Paid leave benefits have made improvements in child outcomes and publicly provided paid leave can be a boon to small businesses: According to the 2018 State of Entrepreneurship Report from the Ewing Marion Kauffman Foundation, 63 percent of startups and 46 percent of older businesses nationally said that providing all workers paid family leave would have a positive impact on their businesses.32 At the same time, other research suggests that paid leave might reduce employment opportunities among lower-skilled workers and in occupations with high shares of women workers.33 FACTORS FOR RESIDENTS Cost of living and incomes DC is the most expensive jurisdiction in the region to live in, even when accounting for the District’s higher average wages. Overall, a family of four needs to be able to spend over $10,000 each month to meet its basic needs in the District. The cost of living is also high in
BUILDING A COMPETITIVE CITY
Chamber State of Business Report 2019 FINAL.indd 36
9/25/19 11:01 AM
FIGURE 16 – PERCENTAGE OF EMPLOYED WORKERS RECEIVING BENEFITS
Among paid workers of private employers . Paid holidays, vacation, and/or sick leave
.
90.30
84.00
84.20
79.30
80.40
63.50
61.90
. . Health insurance
.
89.30
. . Contributions to retirement plans, including 401(k), . Keogh, etc. . .
68.50
Profit sharing and/or stock . options . . Tuition assistance and/or reimbursement
29.10
33.30
. . .
None of the above
27.70
37.30
42.40
42.00
. .
6.40
11.80
10.50
District of Columbia
Maryland
Virginia
Source: US Census Bureau, 2016 Annual Survey of Enterpreneurs, Statistics for US Employer Firms that totally or partly paid employee benefits.
Fairfax, Arlington, and Loudoun counties, and the City of Fairfax (all above the $9,000 per month mark). Prince George’s County has the lowest cost of living among the inner counties of the Washington metropolitan area, with a projected monthly budget of $7,400.
other jurisdiction in the region faces such high childcare costs. In Fairfax and Arlington counties—the next highest-cost jurisdictions in terms of childcare—a family with two young children would need to spend about half of that amount, or $1,800 per month.
While housing costs in the District are high, childcare can also be a significant—or even the largest—source of household expenditures for families with young children. It is estimated that childcare in DC accounts for a third of household budgets for a family of four, at an estimated cost of $3,300 per month.34 No
Taxes come second in DC as a family budget item, accounting for nearly one fifth of family budgets. This share is comparable to the rest of the region, where taxes account for 15 to 17 percent of family budgets. While housing costs are high in DC, they are not the highest in the area. Twelve jurisdictions in the metropolitan
THE 2019 STATE OF BUSINESS REPORT
Chamber State of Business Report 2019 FINAL.indd 37
37
9/25/19 11:01 AM
FIGURE 17 – COST OF LIVING FOR A FAMILY OF FOUR ACROSS THE WASHINGTON METROPOLITAN AREA Estimated monthly costs
Share in total costs
$1.8K
Fairfax Arlington
$1.8K
Loudoun
$1.7K
$1.7K
$1.5K
$1.7K
Alexandria
$1.6K
Prince William
$1.6K
Montgomery
$1.5K
$2.0K
$1.9K $1.7K
$1.4K $1.4K $1.4K
$1.2K $0.9K $1.0K $0.9K
$1.7K
$1.2K
$1.0K $0.9K
$1.2K
Falls Church
$1.6K
$1.4K
$1.6K
$1.4K
$1.6K
$1.0K $0.9K
Manassas Park
$1.6K
$1.4K
$1.6K
$1.0K $0.9K $0.8K $1.2K
Charles
$1.5K
Spotsylvania
$1.5K
Fauquier
$1.4K
Manassas
$1.5K
Frederick
$1.4K
$1.3K $1.2K $1.2K $1.1K
$1.7K
$1.1K $0.9K $0.9K $1.0K $1.3K
$1.0K $0.9K
$1.5K
$1.3K
$0.9K $0.9K
$1.3K
$1.3K $0.9K $0.9K $0.9K $1.5K
$0.9K $0.9K
$0.9K $0.9K
$1.1K
$1.3K
$1.1K
$1.2K $0.8K $0.9K $0.9K $1.1K
$1.4K
10K
11.78% 10.43% 8.45% 12.72% 11.97% 10.20% 10.09%
19.80% 19.70%
11.58% 10.83% 9.00%
20.87%
18.60%
15.87%
19.27%
11.51% 11.15% 9.24%
Charles
17.58%
15.51%
15.37% 14.60%
Prince George's
18.06%
14.32%
Clarke
17.44%
14.87%
17.94% 0% 10%
14.75% 20%
30%
19.63%
12.18% 11.00% 10.56% 11.91%
19.85%
11.73% 10.83% 9.23%
18.39% 16.22%
11.00% 11.61% 8.88% 11.03% 11.80% 11.10%
18.46% 18.30% 19.09% 15.26% 15.90% 40%
14.03%
12.51% 10.20% 10.14% 12.92%
Manassas Park
15.39%
15.33%
12.65% 10.82% 11.54% 10.30%
11.30% 11.13% 9.11%
Monthly Cost
Source: Economic Policy Institute, Family Budget Calculator. March 2018. Data are in 2017 dollars.
20.76% 19.58%
18.92%
Fredericksburg 8K
10.18% 9.00%
16.04%
18.64%
$1.4K
12.78%
15.89%
15.09%
7.11%
11.78% 10.10% 9.35% 13.36%
18.68%
17.37%
$1.2K $0.8K $0.9K $0.8K
21.49% 19.84%
18.38%
Frederick
$1.1K
16.25% 15.61%
9.50% 9.19%
12.08% 9.98% 9.44% 11.94%
Falls Church
Manassas
$1.1K
16.25%
14.34%
20.52%
Stafford
$1.2K
$1.4K
6K
18.61% 17.75%
18.45%
$0.9K $0.9K $0.8K $1.3K
4K
Prince William Montgomery
17.40%
$1.4K
16.97% 15.86%
18.65%
Spotsylvania
$1.3K
2K
18.89% 16.97%
Fauquier
Prince George's
0K
17.59% 17.43%
$1.4K
Clarke Fredericksburg
18.97% 18.14%
Alexandria
$1.1K $0.9K $0.9K $1.1K
17.61%
Arlington
Fairfax City
$1.1K $0.9K $1.0K $0.9K
18.90%
18.42%
Loudoun
Calvert
$1.4K
Stafford
$1.3K
$1.7K
$1.1K $0.9K
31.74%
Washington Fairfax
$1.1K $0.9K $0.9K $1.3K
$1.1K $0.9K $0.9K
$1.7K
$1.8K
$1.0K $1.0K $1.0K $0.7K
$1.1K $0.9K $0.9K $1.1K
$1.9K
$1.5K $1.4K
$1.5K
$2.0K
$1.6K
$1.7K
Fairfax City Calvert
$2.0K
11.32% 11.82% 9.62% 11.44% 11.77% 10.06% 11.72% 11.73% 9.96% 10.57% 12.57% 10.93% 11.35%
50%
12.78%
60%
70%
12.23% 80%
15.28% 14.36% 15.68% 16.16% 17.06% 14.76% 16.44% 15.11% 18.36% 15.06% 90%
% of Total Monthly Cost Child care
Other necessities
Taxes
Health care
Housing
Food
Transportation
region are estimated to have higher housing costs than DC for families, including Fairfax and Arlington counties. These budget figures reflect not just how much things costs, but also how much income capacity residents have to pay for the things they need.
DC, compared to 4.38 in Montgomery County, the county with the next highest ratio, and 3.47 in Loudoun, the county with the lowest ratio overall.
As the 2018 State of Business Report documented, while the DC region has made some gains on inclusive growth, its economic prosperity has not always been distributed evenly. DC has the highest level of income inequality in the metropolitan area: the ratio between lower-income households at the 80th percentile of income and higher-income households at the 20th percentile is 7.29 in
Research on income mobility and the impact of neighborhoods on future outcomes for children finds that jurisdictions that build inclusive and well-resourced neighborhoods could increase the future incomes of children who live in these neighborhoods. These impacts are strongest for children from low income families. Children from low income families who grow up in mixed income neighborhoods tend to have higher
38
Upward mobility
photo: Aimee Custis
$3.3K
Washington
BUILDING A COMPETITIVE CITY
Chamber State of Business Report 2019 FINAL.indd 38
9/25/19 11:01 AM
incomes (and are less frequently incarcerated) than otherwise similar children who grow up in neighborhoods of concentrated poverty.
photo: Aimee Custis
In the Washington metropolitan region, the District has the worst performance when it comes to income mobility. Children raised in the District tend to have lower future incomes than any other jurisdiction in the metropolitan area. Children who were raised in households in DC that are at the bottom income quarter in the nation only reach the 39th percent of income distribution by the time they turn 26. This compares poorly against the performance of other jurisdictions in the metropolitan area.
Chamber State of Business Report 2019 FINAL.indd 39
Growing up in Fairfax County lifts incomes of similarly situated children to the 51st percentile of income; growing in Montgomery County to the 48th percentile. Economic mobility in the District is far more constrained that the rest of the nation. Children in the bottom income quarter are observed to lose 0.06 percent of their future personal incomes and 0.17 percent of their future household incomes for every year they spend in DC. The only other jurisdiction that seems to have a negative correlation with future incomes of children is Prince George’s County.
THE 2019 STATE OF BUSINESS REPORT
39
9/25/19 11:01 AM
FIGURE 18 – INCOME AT AGE 26 FOR CHILDREN WHO GREW UP IN WASHINGTON METROPOLITAN AREA Percentage gain (or loss) in income at age 26 from spending one more year of childhood in a given county relative to the national mean Household Income Parents income at 25th percentile
Individual Income
Parents income at 75th percentile
1.1%
Fairfax City Rappahannock
0.8%
Manassas Park City
0.8%
Fairfax
0.8%
Falls Church City
0.7%
Loudoun
0.6%
Arlington
0.6%
0.4%
0.3%
Warren
0.4%
0.1%
0.4%
0.2%
Charles
0.1%
Prince George's
-0.1%
District Of Columbia
-0.2% -1%
0.1%
0.0%
0.2% 0.1%
0.3%
0.3%
0.3%
0.2% 0.2%
0.1%
0.4%
2% -1%
0.4%
0.3%
-0.1%
0.5%
0.0%
0.0%
0.1%
-0.5% 1%
0.4%
0.2%
-0.1%
0%
0.5% 0.3%
0.4%
0.2%
0.2%
0.4%
0.8% 0.6%
Fauquier
0.1%
0.5%
0.6%
0.1% 0.1%
Prince William
0.1%
0.7%
0.0%
Manassas City
1.0%
0.8%
-0.2%
0.5%
0.3%
0.4%
0.5%
0.6%
0.5%
Alexandria City
0.8% 0.1%
0.2%
0.3%
Frederick
0.3%
Parents income at 75th percentile
1.1%
0.1%
Montgomery
Calvert
Parents income at 25th percentile
-0.2%
-0.1% 0%
1%
2% -1%
0%
1%
2% -1%
0%
1%
2%
Expected rank of children whose parents are at the 25th percentile of the national income distribution 53.3
Fairfax City Rappahannock Manassas Park City Fairfax Falls Church City Loudoun Arlington Montgomery Frederick Warren Fauquier Calvert Alexandria City Manassas City Prince William Charles Prince George's District of Columbia
44.8 45.1 51.2 47.3 48.4 47.9 47.7 45.6 43.6 42 43.5 43.7 45 42.8 42.9 40.2 35.8 0
10
20
30
40
50
60
70 photo: US Dept. of Education (CC BY 2.0)
Income Percentile Source: Opportunity Insights, Preferred Estimates of Causal Place Effects by County, and Geography of Mobility: Replication Code and Data
40
BUILDING A COMPETITIVE CITY
Chamber State of Business Report 2019 FINAL.indd 40
9/25/19 11:01 AM
Health insurance
The quality of public services and private amenities that increase residents’ quality of life is important in attracting residents. One obvious way of measuring cross-jurisdictional differences would be to compare government spending across these jurisdictions. However, because the Washington metropolitan area is made up of multiple types of governments, such comparisons could be misleading. For example, per-capita public spending is generally much higher in the District, because it combines public spending for government services offered at multiple levels of government (state, county, city, and school districts). Therefore, it is more meaningful to compare life outcomes to get a better sense of the attractiveness of each jurisdiction in the metropolitan area.
On health insurance coverage for all residents, including those who are unemployed or not in the labor force, the District leads the region. DC has been a leader in health insurance expansion since 1999, when it created the locally funded DC HealthCare Alliance to expand access to health insurance for low-income residents who are not eligible for Medicaid or Medicare.35 The District also expanded its Medicaid coverage under the Affordable Care Act (ACA) and has been very successful in enrolling a high number of residents—including younger residents—in health insurance programs through the DC Health Link insurance marketplace and Cover All DC. While the District’s individual mandate for health insurance went into effect in January 2019, its uninsured rate had already been one of the lowest in the nation for years.
photo: US Dept. of Education (CC BY 2.0)
Quality of services
Chamber State of Business Report 2019 FINAL.indd 41
THE 2019 STATE OF BUSINESS REPORT
41
9/25/19 11:01 AM
100%
97% 99% 95% 96%
91%
95%
91% 92%
80%
88%
92% 88%
92% 88%
91% 87%
90%
85%
District of Columbia
Prince George's
Alexandria
Manassas
Manassas Park
Spotsylvania
Montgomery
Prince William
Arlington
Charles 95%
96% 91%
Fairfax County
Calvert
Fauquier
Loudoun
Falls Church
FIGURE 19 – GRADUATION RATES, 2011 TO 2017
89% 83%
85% 77%
81% 75% 78% 79%
60%
72%
59%
40%
20%
2012 2014 2016
2012 2014 2016
2012 2014 2016
2012 2014 2016
2012 2014 2016
2012 2014 2016
2012 2014 2016
2012 2014 2016
2012 2014 2016
2012 2014 2016
2012 2014 2016
2012 2014 2016
2012 2014 2016
2012 2014 2016
2012 2014 2016
0%
Source: Kids Count, four-year cohort adjusted graduation rates by county, 2011-2017.
Public education A key factor for residents as they decide where to locate is the availability and quality of public education. The District has increased its public school enrollment for 12 consecutive years, with public school enrollment growing faster than the school-age population. Between 2011 and 2017, for every new school-age resident the District added, its public school enrollment grew by almost three.36 The District—the jurisdiction with the deepest income disparities in the region—has a particularly high-need school population. Across all public schools, 47 percent of students are atrisk for academic failure, a factor that is closely tied to lower household incomes and other economic barriers.37 As a result, educational outcomes in the District tend to be lower than those in more affluent suburbs. In the 2016-
42
17 school year, the District’s graduation rate was 72 percent, 11 percentage points behind the next worst-performing jurisdiction, Prince George’s County. Graduation rates across different schools in the District also vary dramatically, with some schools reporting rates of close to 100 percent, and others at or around 50 percent. In comparison, school districts such as those in Falls Church, Loudoun, Fauquier, and Fairfax have graduation rates of more than 95 percent, suggesting that almost all their schools achieve excellence in graduating their students. Health outcomes In terms of health outcomes, DC ranks well in some measures, but struggles in others compared to the rest of the metropolitan area. Along with several exurban jurisdictions—
BUILDING A COMPETITIVE CITY
Chamber State of Business Report 2019 FINAL.indd 42
9/25/19 11:01 AM
Jefferson County, Manassas City, and Manassas Park City—the District scores particularly poorly on measures such as the share of the population in fair or poor health. The jurisdictions with the highest preventable hospitalization rates include both urban areas (such as DC, Alexandria, and Prince George’s County) and exurban areas (such as Stafford and Fauquier counties). This pattern also holds for vaccination: DC and Prince George’s County have the lowest overall vaccination rates in the
metropolitan area, along with Jefferson and Stafford counties. Several exurban counties— Fauquier and Jefferson—as well as Manassas City, and Manassas Park City, have relatively high rates of physical inactivity, as does Prince George’s County. The counties of Fauquier and Jefferson also have the highest number of driving-related deaths per 100,000 residents.
FIGURE 20 – HEALTH INDICATORS FOR WASHINGTON METROPOLITAN AREA COUNTIES Alexandria City
13
Arlington
12
District of Columbia
13
Fairfax
5,185 3,001
Fairfax City
3,271
13
Falls Church City
53
16
18 12
4,625
Manassas City
17
Manassas Park City
15
Prince William Stafford 10
9 6
52
7
46
15
5,263
0K
5K
10K 0
Preventable hospitalization rate (per 100,000) % in fair/poor health
51
22
178
200
400
Driving deaths (per 100,000)
0
10
20
11 47
19
121
7
37
18
78
6,010
16
15
71
4,544
20
4
22
14 0
9
39
21
16
2,980
15
51
16
61
3,715
10
Prince George's
9
49
22
19
Montgomery
49
51
22
248
4,060
7 4
20 372
5,056
Jefferson
36
18
2,954
13
Loudoun
17
94
12
49
49
3,285
11
Fauquier
46
15
21 5,778
11
14
23
10 7
42 30 0
% Physically Inactive
20
40
60 0
% Vaccinated
5
10
15 20
% Uninsured
Source: Data compiled by the County Health Rankings & Roadmaps program, a collaboration between the Robert Wood Johnson Foundation and the University of Wisconsin Population Health Institute. Note: Data not available for select counties for some measures.
THE 2019 STATE OF BUSINESS REPORT
Chamber State of Business Report 2019 FINAL.indd 43
43
9/25/19 11:01 AM
V. CONCLUSION
To become more competitive in the region, the District of Columbia must understand what factors and policies could attract businesses, workers, and residents to the city, and what factors and policies could push them out. In this regional picture, the District stands out as the key employment center and an attractive place to live, with strong growth in jobs, population, and incomes. But the deeper look presented in this report into what makes a city competitive in a region—attracting businesses of all kinds, workers of all skill levels, and residents of all backgrounds—finds weaknesses alongside these strengths. The District has successfully grown its share of the region’s private sector, adding more businesses and jobs since 2010 than most other jurisdictions. The city’s dynamic economic activity is an attraction in and of itself, as businesses and workers choose the District to benefit from its rich business environment and strong talent pool. But the District is not as strong in its ability to help businesses grow and thrive. DC is, in fact, a net exporter of businesses to the rest of the metropolitan area, with lower survival rates for its businesses. While DC’s economy is strong, there are fewer opportunities to establish and grow a business, especially for women and people of color.
44
DC’s business and regulatory environment also presents challenges: Strong unpredictability regarding business regulations, and higher tax rates than elsewhere in the region. While it is not unusual to see higher tax rates in urban centers of metropolitan areas, these differentials are especially high in commercial property taxes, and the uncertainty around the tax regime can hit businesses in unexpected ways. DC and other key employment centers in the region are also facing tougher competition from outer suburbs and exurbs as businesses looking to reduce costs—be it space or labor costs—are increasing opening in more distant locations. Stronger economic activity across the metropolitan area is desirable, but it is worth examining whether this is manifestation of growing economic activity or a signal of the increasing costs of doing business in the urban center. Workers from the entire metropolitan region commute to DC to work. This is a function of not just employment opportunities, but higher pay, stronger benefits, and better protections offered by the District’s business establishments. But DC’s private sector appears to be less attractive to workers who live west of the city. Most of District’s workers live in DC, Prince George’s County, and neighborhoods adjacent to DC in Virginia and Maryland. Fairfax County, on the other hand, has a much larger footprint in the region when it comes to where it draws talent from. The District may be paying a price
BUILDING A COMPETITIVE CITY
Chamber State of Business Report 2019 FINAL.indd 44
9/25/19 11:01 AM
for difficult commutes, especially for those who live in outer suburbs. The city also lacks the occupational diversity to support its own residents who don’t have professional credentials. Outside of the service sector (especially in hospitality) job opportunities for lower-skilled workers are rare. And when they are present, the District’s extensive professional licensing requirements can work as a barrier. Twelve percent of jobs in the District’s private sector are in occupations that require some type of licensing from a professional licensing board. Many of these jobs are middle-wage jobs that pay family supporting incomes, but these paths are closed to DC residents who do not have the resources to meet licensing requirements. The District has become an increasingly attractive place to live in recent years and has experienced strong population growth. But recently, the main contributor to population growth has shifted to natural increase (meaning the number of births outpaces the number of deaths) and international migration. The District has now joined the rest of the central counties of the metropolitan region experiencing domestic outmigration, as more people leave DC for elsewhere in the US than arrive here from other domestic locations. Even within the metropolitan area, when households outside of the District move, they rarely choose the District as their new home. This is a consequence of the high cost of living in the District, and especially the high costs of childcare, housing, and taxes on households. Not only is DC a particularly expensive place to live, but it offers the weakest paths to upward economic mobility for children who live in low-income households in the region. While children growing up in other expensive urban jurisdictions like Fairfax and Arlington experience significantly higher incomes later in life, children in DC actually experience lower future incomes when they are older. Education is one factor that can contribute to economic
mobility, and while the District’s public schools have seen rising enrollments in recent years, improvements among its public schools can be uneven. The high cost of living, lack of work opportunities for residents without college degrees, and underperforming neighborhood schools could be acting as push factors for lowand middle-income households that have been moving out of the city. While DC works to improve its own competitive advantages for businesses, workers, and residents, it also benefits from its neighbors’ strengths as well. A skilled labor force, a strong transportation network, or a robust housing market in any single jurisdiction supports the entire region, as talent, innovative ideas, and the spending power of residents are potentially available to businesses across all jurisdictions. The arrival of Amazon’s HQ2 in Northern Virginia will likely illustrate how economic activity in one part of the region will fuel growth in other areas. While Amazon’s second headquarters will be located in Arlington, a large portion of its 25,000 new workers are expected to turn to DC and other jurisdictions for places to live, shop, or seek services or entertainment. The District has taken important steps in increasing public investments and improving public services and safety nets. But as DC works to maintain and grow its present competitive advantages in the broader metropolitan region, it will also need to tackle the complicated issues that affect all parts of its economic landscape— businesses, workers, and residents. There is an urgent need for policies that could improve DC’s business climate, remove underlying barriers and ensure equitable economic growth, and create opportunities for upward economic mobility. Quality education for all, affordable housing, and a highly trained workforce for every business are key to building and maintaining a competitive city.
THE 2019 STATE OF BUSINESS REPORT
Chamber State of Business Report 2019 FINAL.indd 45
45
9/25/19 11:01 AM
BUILDING A COMPETITIVE CITY
The DC Chamber of Commerce (“DC Chamber”) is working to realize a vision of the District that includes continuing economic development throughout the City; a skilled and prepared workforce; affordable housing; and critical improvements in education.
ECONOMIC GROWTH AND PROSPERITY The DC Chamber will encourage the District to make it easier for businesses to start, grow, and stay in the District of Columbia. To this end, the DC Chamber will work with policymakers and elected officials to develop a suite of incentives to increase jobs in the city and employment opportunities for DC residents.
The DC Chamber will advocate for economic and regulatory competitiveness to support growth and retention of our start-up businesses; to create a positive, stable, and predictable business environment in the District; to enhance economic mobility and education for low-income District residents; and to increase economic opportunities for women and people of color.
The DC Chamber would like to see more companies that move into the region call the District of Columbia their new home. To this end, the DC Chamber will advocate for robust incentives and resources that would increase foreign direct investment and recruitment of new firms into the District, so that DC becomes a destination for large businesses and headquarters that are planning to relocate to the Washington metropolitan area.
The DC Chamber will also expand its advocacy efforts for using the District’s own resources—$7.7 billion generated in the District—to benefit primarily the city’s own residents, and across all eight wards of our beloved City.
The DC Chamber will advocate for policies that would help eliminate racial bias in banking and other lending operations, to help residents of color build wealth through homeownership and entrepreneurship.
In order to make DC a more competitive city and to maintain and grow its economic role in the metropolitan area, the DC Chamber will pursue the following actions:
JOBS AND WORKFORCE
46
photo: Ted Eytan
VI. AN AGENDA FOR THE DC CHAMBER OF COMMERCE
The DC Chamber will advocate for policies that ensure that DC residents are able to benefit
BUILDING A COMPETITIVE CITY
Chamber State of Business Report 2019 FINAL.indd 46
9/25/19 11:01 AM
photo: Ted Eytan
from the District’s strong job base. These include elimination of barriers to work such as excessive professional licensing, and increasing incentives in a significant manner for hiring District residents. The DC Chamber will advocate for policies that ensure that growing establishments do not relocate to other parts of the Washington metropolitan area. The DC Chamber supports the creation of workforce development programs that produce real opportunities for work. The DC Chamber will work to communicate the workforce needs of its members, while actively engaging them in participating in workforce solutions to support job creation in the District that benefits economic mobility and improves quality of life for District residents.
TAXES AND REGULATORY REGIME The DC Chamber will advocate for a tax regime that would provide a stable, predictable, and competitive tax environment for all types of businesses in the District of Columbia. The DC Chamber is calling for economic impact analyses that would elaborate on the impact of proposed policy on the District’s competitive standing, for all tax policy changes. The District has altered commercial tax rates and structure five times in the last two years and has adopted a commercial tax policy that penalizes rather than rewards commercial density. The DC Chamber will advocate for a more stable commercial property tax regime that protects small and mid-sized businesses and support the retention of middle-wage jobs.
THE 2019 STATE OF BUSINESS REPORT
Chamber State of Business Report 2019 FINAL.indd 47
47
9/25/19 11:01 AM
N
The DC Chamber will advocate for more streamlined processes for doing business in the District through the implementation of proposals outlined by the Business Regulatory Reform Task Force.
The DC Chamber will promote the type of housing opportunities that would encourage companies to expand in the District, and accommodate their employees looking to move here.
FISCAL POLICY
ENVIRONMENT
The DC Chamber will advocate for government budgets, programs, policies, and priorities that are part of an overall financial plan that stimulates growth, yields return on investment, and does not overburden any single business sector.
The DC Chamber will encourage energy policies that strengthen our local economy and reduce greenhouse gas emissions without harming businesses, as well as encourage policies that build capacity for alternative uses of energy.
EDUCATION The DC Chamber will advocate for education policies that will help each DC public school or public charter school achieve high school graduation rates of 80 percent or higher, and for DC students to be fully prepared for higher education and/or the job market after graduation. AFFORDABLE HOUSING
N
The DC Chamber will support efforts to provide access to capital to support more energy efficient products, and increase resources for training and workforce development in this high growth industry.
N
TRANSPORTATION AND INFRASTRUCTURE The DC Chamber will support efforts to increase DC’s infrastructure to accommodate electric vehicles, driverless cars, and other alternative fueling sources.
The DC Chamber will support zoning that increases allowable building densities supported by existing or future infrastructure.
N
The DC Chamber will support the District in incentivizing innovative housing designs that optimize quality and availability of affordable housing in the nation’s capital.
No contact@dcchamber.org | dcchamber.org Follow us on Twitter: @dcchamber
48
BUILDING A COMPETITIVE CITY
Chamber State of Business Report 2019 FINAL.indd 48
9/25/19 11:01 AM
WASHINGTON: OBVIOUSLY, DC No.
1
Best cities for women in tech SmartAsset, March 2019
No.
Cities in U.S. with best park systems
1
No.
The Trust for Public Land May 2019
2
Best educated cities in America No.
3
No.
4
No.
Greenest cities in America WalletHub, October 2019
Top ranked cities for tech talent
No.
CBRE, July 2019
No.
No.
5
Best cities for young professionals
5
6
No.
6
4
Top 20 high-tech cities PC Magazine, May 2019
Best cities in America Bloomberg, June 2019
Top cities for high-tech workers USA Today, March 2019
No.
U.S. News & World Report, January 2019
No.
CNBC, July 2018
Leading life sciences markets
Fittest cities in the U.S.
6
U.S. News & World Report, May 2019
7
Most walkable U.S. cities SmarterTravel, July 2019
CBRE, February 2019
No.
9
Best places to eat Food & Wine January 2019
Chamber State of Business Report 2019 FINAL.indd 49
9/25/19 11:01 AM
ENDNOTES
Hathaway, Ian (2018). “High-growth firms and cities in the US: An analysis of the Inc. 5000.” The Brookings Institution. Available at https://www.brookings.edu/ research/high-growth-firms-and-cities-in-the-us-ananalysis-of-the-inc-5000/.
2
Sayin Taylor, Yesim (2018). “How big of a deal is Amazon HQ2 for the DC Metro Region?” D.C. Policy Center. Available at https://www.dcpolicycenter.org/ publications/amazon-effect/.
3
Data from administrative records, compiled by the Bureau of Labor Statistics, Quarterly Census of Employment and Wages.
4
This analysis compares the average annual wage as reported by BLS for all employees eligible for unemployment insurance. It excludes temporary workers and contractors.
5
U.S. Census Bureau, American Community Survey, 2017.
6
Maciag, Mike (2017). “Migration to D.C. remains stable, but plummets for rest of region.” D.C. Policy Center. Available at https://www.dcpolicycenter.org/ publications/migration-to-d-c-remains-stable-butplummets-for-region/.
7
Stephen S. Fuller Institute (2019). “The Washington Region’s Population Increased 0.8 Percent in 2018; Net Domestic Out-Migration Continued.” Available at https://sfullerinstitute.gmu.edu/2019/04/23/ population-2018/.
8
Swaim, Stephen (2018). “From 2010 to 2017, net migration into DC was greater than that of 31 states.” District Measured. Available at https://districtmeasured.
9
50
com/2018/03/26/from-2010-to-2017-net-migrationinto-dc-was-greater-than-that-of-31-states/. Rabinowitz, Kate (2017). “Prince George’s County a Popular Home for Many Former D.C. Residents.” D.C. Policy Center. Available at https://www.dcpolicycenter. org/publications/dc-metro-region-migration-princegeorges-county-popular-destination/.
10
photo: Ted Eytan
Bureau of Economic Analysis, “Gross Domestic Product by Metropolitan Areas. Available at https:// www.bea.gov/system/files/2018-09/gdp_metro0918_0. pdf.
1
This analysis is based on a privately developed dataset called National Establishment Time Series of NETS. Interested readers can learn about how this dataset compares to official data on business activity developed by the U.S. Census, Bureau of Labor Statistics, and Bureau of Economic Analysis by reading the Federal Reserve Bank of Minneapolis working paper available at https://www.minneapolisfed.org/ institute/working-papers/an-assessment-of-thenational-establishment-time-series-database.
11
About 11,000 establishments moved across the borders of the Washington metropolitan area, sometimes to the Washington metropolitan area from other places, and sometimes to other places from the Washington metropolitan area.
12
13
Research forthcoming by the D.C. Policy Center.
Source: U.S. Census Bureau’s Longitudinal EmployerHousehold Dynamics program.
14
U.S. Census Bureau (2019). Business Formation Statistics. Available at https://www.census.gov/ programs-surveys/bfs.html.
15
Survival rates are calculated based on the age of a firm that closed in a certain jurisdiction regardless of where it was born. For example, a company established in 2000 in DC, moved to Fairfax, and then closed in 2015 would be captured in Fairfax County’s five- and 10-year survival rate calculations, not in DC’s.
16
17
Emrath, Paul (2016). “Government Regulation in the
BUILDING A COMPETITIVE CITY
Chamber State of Business Report 2019 FINAL.indd 50
9/25/19 11:01 AM
photo: Ted Eytan
Price of a New Home.” National Association of Home Builders. Available at http://www.nahbclassic.org/ generic. See, for example, Fisher, Peter S (2011, revised 2013). “Corporate Taxes and State Economic Growth” The Iowa Policy Project. Available at http://www. iowapolicyproject.org/2010docs/101201-IPP-corptaxes. pdf.
18
LaRose, Eric (2016). “How Much Do State Business Taxes Matter?” Econ Focus, Second Quarter 2016, The Federal Reserve Bank of Richmond. Available at https://www.richmondfed.org/publications/research/ econ_focus/2016/q2/feature1.
19
Bartik, Timothy J. (2017). “A New Panel Database on Business Incentives for Economic Development Offered by State and Local Governments in the United States.” Prepared for the Pew Charitable Trusts. Available at https://research.upjohn.org/reports/225
20
DC is certainly not the only jurisdiction that taxes commercial property differently from residential property, and at different rates depending on the value. See Lee, Nai Jia and William C. Wheaton
21
(2010). “Property Taxes under “Classification”: Why do Firms pay more?” The MIT Center for Real Estate working paper. Available at https://economics.mit.edu/ files/5886. Other jurisdictions in the region have implemented tax changes, too. Montgomery County saw a decrease in personal property tax rates from 1.9335 percent to 1.8535 percent, as well as a decrease in commercial property tax rates from 1.138 percent to 0.981 percent. Both Fairfax County and Alexandria County saw slight increases in property tax rates, from 1.06 percent to 1.083 percent, and 1.073 to 1.130 percent respectively as property tax rates are “calculated” each year to meet expenditure needs.
22
Recent examples include adding new tiers, increasing the rate with the Fiscal Year 2019 budget, reversing the increase in December 2018, and then undoing the reversal with the Fiscal Year 2020 budget.
23
American Express (2018), State of WomenOwned Business Report. Available at https://about. americanexpress.com/files/doc_library/file/2018-stateof-women-owned-businesses-report.pdf.
24
THE 2019 STATE OF BUSINESS REPORT
Chamber State of Business Report 2019 FINAL.indd 51
51
9/25/19 11:01 AM
photo: Aimee Custis
U.S Census Bureau. (2018) Annual Survey of Entrepreneurs, 2016. Available at https://www.census. gov/programs-surveys/ase.html.
25
26
NETS database.
Grant, Bruce Ormond (2018). “Reducing Barriers for Job Seekers.” D.C. Policy Center. Available at https:// www.dcpolicycenter.org/publications/reducing-barriersfor-job-seekers-in-d-c-and-the-metro-region/.
27
Ryan Nunn (2016), “Occupational Licensing and American Workers.” The Hamilton Project. Available at http://www.hamiltonproject.org/ papers/occupational_licensing_and_the_american_ worker?_ga=2.210153495.305698934.154939 45481974874714.1537810816.
28
Information from the 2017 Annual Report from the Occupational and Professional Licensing Administration provides data for 12 of the 18 boards under DCRA. DCRA (2018), Occupational and Professional Licensing Board and Commission, 2017 Annual Report. Available at https://www.dcopla.com/bpe/wp-content/uploads/ sites/17/2018/06/OPLBC-Annual-Report-2017-Final. pdf.
29
2018 Employee Benefits: The Evolution of Benefits. Society for Human Resource Management. https:// www.shrm.org/hr-today/trends-and-forecasting/ research-and-surveys/Documents/2018%20 Employee%20Benefits%20Report.pdf.
30
31
Ibid.
Kauffman Foundation, Survey of Entrepreneurs. Available at https://www.kauffman.org/-/media/
32
52
kauffman_org/entrepreneurship-landing-page/ kauffmann foundationnationalpolicysurveyof entrepreneursd22618.pdf. See, for example, Dillender, Marcus and Brad Hershbein (2018). “Paid Family Leave and Employer Skill Demand: Evidence from Job Postings.” W.E. Upjohn Institute for Employment Research working paper.
33
34
Economic Policy Institute, Family Budget Calculator.
Bovbjerg, Randall (2010). “Expanding Health Coverage in the District of Columbia: D.C.’s Shift from Providing Services to Subsidizing Individuals and Its Continuing Challenges in Promoting Health, 19992009.” Brookings Institution. Available at https://www. brookings.edu/research/expanding-health-coveragein-the-district-of-columbia-d-c-s-shift-from-providingservices-to-subsidizing-individuals-and-its-continuingchallenges-in-promoting-health-1999-2009/.
35
Coffin, Chelsea (2019). Forthcoming at the D.C. Policy Center.
36
Coffin, Chelsea (2018). “Landscape of Diversity in D.C. Public Schools.” D.C. Policy Center. Available at https://www.dcpolicycenter.org/publications/ landscape-of-diversity-in-dc-public-schools/.
37
Data from various sources compiled by the County Health Rankings & Roadmaps program, a collaboration between the Robert Wood Johnson Foundation and the University of Wisconsin Population Health Institute. Available at countyhealthrankings.org.
38
DC CHAMBER OF COMMERCE
Chamber State of Business Report 2019 FINAL.indd 52
9/25/19 11:02 AM
photo: Aimee Custis
Creating a brighter future. Creating a brighter future.
At Exelon, we believe that collaboration delivers better solutions. We volunteer our time and commit resources to support organizations that foster thriving communities. We are energized by these At Exelon, we believe thatexperiences collaborationand delivers bettereveryone solutions.succeed. We volunteer our inspired to help time and commit resources to support organizations that foster thriving Exelon is proud to partner with communities. We are energized by these experiences and DC Chamber of Commerce. inspired to help everyone succeed. Exelon is proud to partner with
www.exeloncorp.com DC Chamber of Commerce. www.exeloncorp.com
Š Corporation, Exelon Corporation, 2019 Š Exelon 2019
Chamber State of Business Report 2019 FINAL.indd 53
9/25/19 11:02 AM
Learn more about the DC Chamber of Commerce:
1133 21st Street NW, Suite M200, Washington, DC 20036 (202) 347-7201 dcchamber.org
Chamber State of Business Report 2019 FINAL.indd 54
9/25/19 11:02 AM