This work is licensed under a CC BY-NC-ND 4.0 International License. This license enables reusers to copy and distribute the material in any medium or format in unadapted form only, for noncommercial purposes only, and only if attribution is given to the creator.
Published by Science Gallery, Bengaluru, a not-for-profit public insitution, Bengaluru, 2026
All the photos used in this Glossary are attributed to respective Individuals and insitutions, unless stated otherwise.
For a digital version of this copy, please visit: https://bengaluru.sciencegallery.com
“Some things are just sitting there, minding their own business, waiting to be discovered.”
- John Boyne
Dear Explorer,
You move through your city every day, and yet most of it goes unseen. The road beneath your feet holds the logic of urban planning. The bridge you cross without a second glance is a feat of engineering. The market you pass through is a living network of supply chains, seasonal rhythms, and human negotiation. The air around you has the fingerprints of industry and green cover.
Sci560 - Science in the City was an exploration into the many forces that make Bengaluru the city it is today. The exhibition opened portals into the systems, sectors and secret rhythms of the city, leaving visitors with a newfound sense of awe and a slightly new pair of city-goggles to see Bengaluru differently.
In the same spirit, this handbook invites you to do a little urban adventuring in your own uru*. The activities are creative and observational, and while you can do them indoors, they’re best enjoyed outdoors where the city comes alive. Wander, wonder, and poke your nose into the unnoticed corners of your neighbourhood. Notice the parts that make up the whole of your uru, and the people who keep it running. And when you do, we hope you stumble upon the little things that were always there, waiting to be discovered. Share your discoveries with us by mailing them to: learning@bengaluru.sciencegallery.com
Warmly, Science Gallery Bengaluru.
* P.S. In Kannada, uru is a broad term for any human settlement, be it a village, town, or city, regardless of size or scale. In the same spirit, the activities in this handbook aren’t bound by location, you can try them in whichever uru you call home.
Sci560 - Science in the City was an exhibition by Science Gallery Bengaluru. You can explore the digital version of the exhibition at: https://sci560.scigalleryblr.org
This handbook works as a companion to the exhibition but is also complete on its own.
Sci560 website
MICROPOLIS
BIODIVERSI-TEE
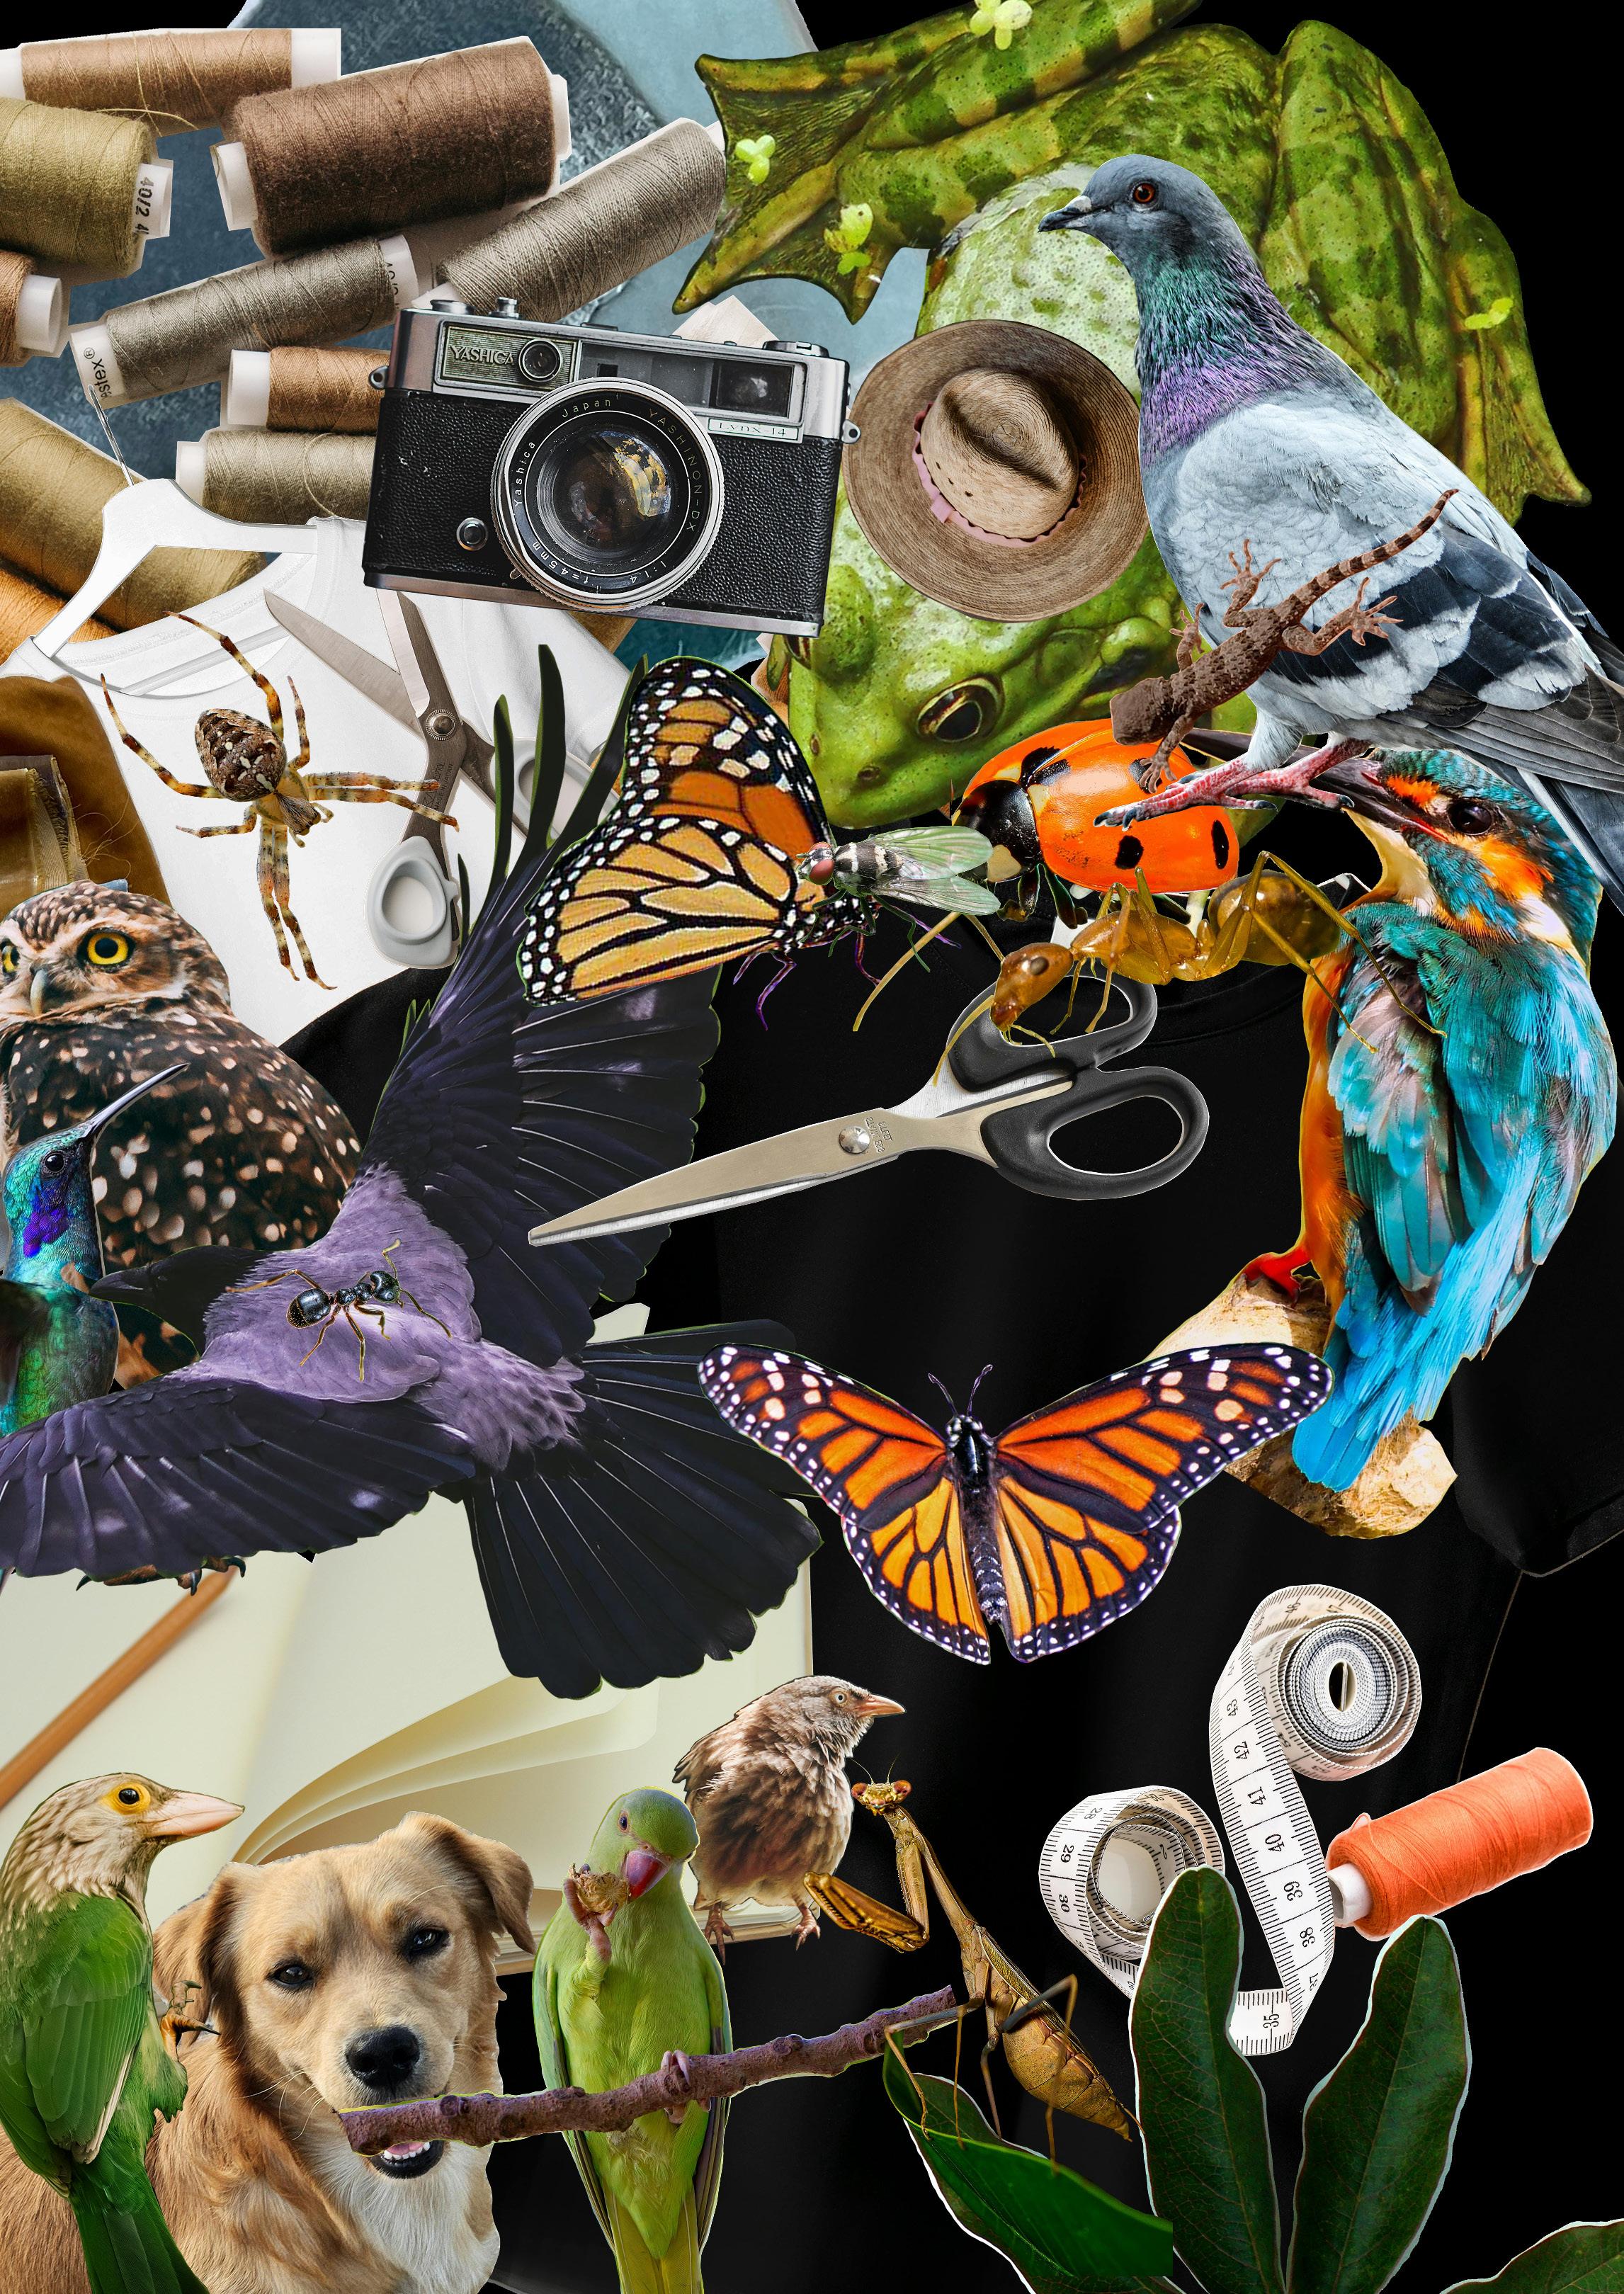
Who shares your home with you? Perhaps it’s a fly on the wall, ants marching in a line, or a moth fluttering near a lightbulb. Many of these creatures have coexisted with humans for centuries, cleverly adapting to our homes and urban landscapes.
Despite the loss of natural habitats and greenery often associated with urban growth, cities like Bengaluru boast an astonishing variety of life. Within its boundaries, you can find around 41 species of mammals, 17 species of reptiles, 52 species of amphibians, 1,707 species of insects, and 300 species of birds, including both native and migratory visitors.
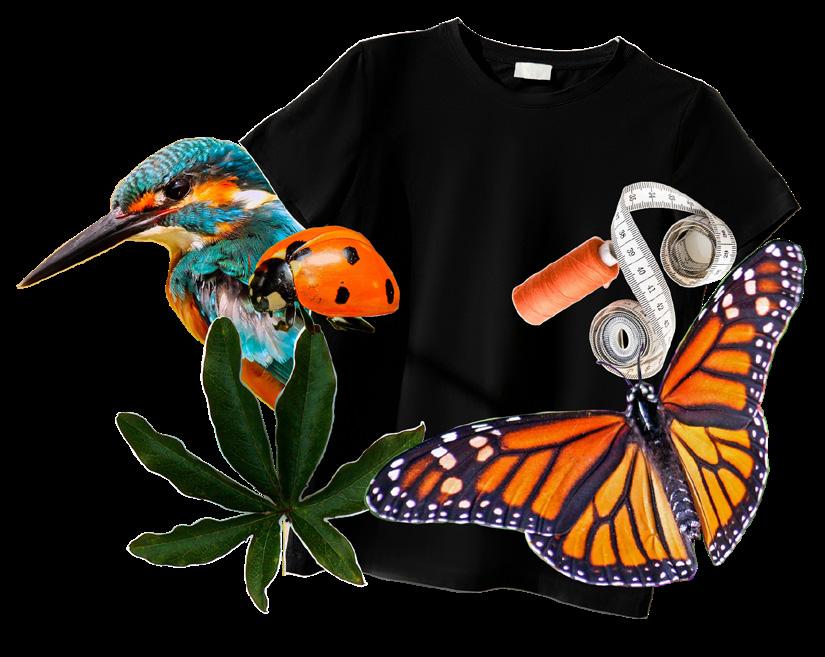
Now, it’s time to step into the shoes of a field biologist! Take a walk around your home, observe the life forms you encounter, and document your findings. By doing this, you will uncover the hidden connections you have with your local ecosystem. To celebrate your discoveries, create a wearable map of the biodiversity around you with your very own biodiversi-tee.
MATERIALS REQUIRED:
1. A t-shirt (or any garment you would like to reuse)
2. Scrap cloth in multiple colours (from old t-shirts, bedsheets, or sarees you would otherwise discard)
3. Coloured threads
4. Needle
5. Scissors
6. Calculator
7. Pen
8. Noteboook
9. Safety Pins
MAKE YOUR OWN BIODIVERSI-TEE:
Step 1: Observe and Record
• Take 15 minutes to walk around your house. From ants to humans, note down every creature you spot.
• Use a notebook to list each species and its features (size, colour, sound).
• Count how many individuals you see of each species. Repeat over two days if you can.
Step 2:
Grab your threads and needles!
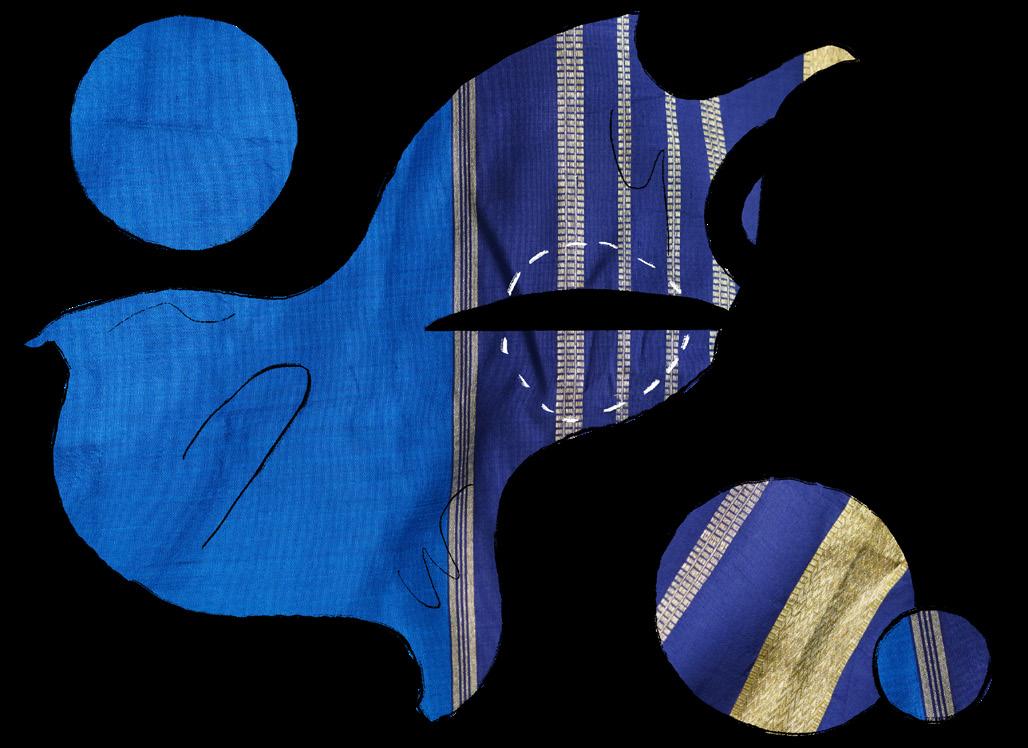
• For each species, cut a colourful circle from scrap cloth such that the size of the circle represents their population.
• The size of the circle = √(number of individuals). Example: 7 lizards --> √7 ≈ 2.6 cm in diameter.
• Pin the cut circles on your t-shirt with safety pins.
• Stitch the circles onto the t-shirt using a simple running stitch.
• Don’t forget to note down which species corresponds to which cutout!
• Remove the safety pin, and you now have an approximate visual representation of the biodiversity and relative abundance in your house.
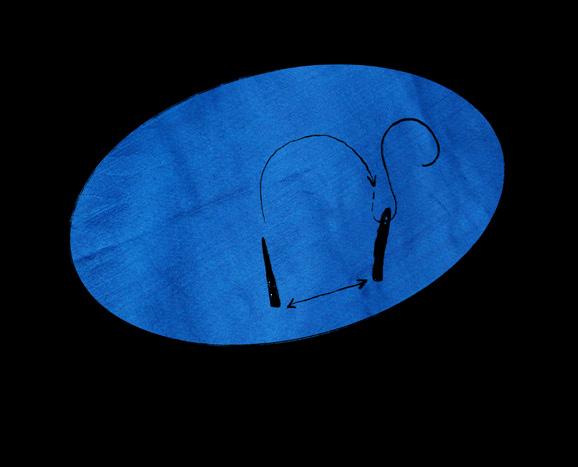
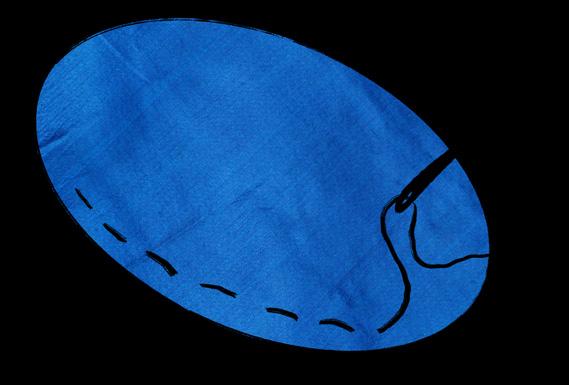
Step 4: To do a running stitch
• Thread the needle and knot the end.
• Bring the needle up from the underside of the fabric near the edge of the patch. Move forward the needle approx 3-5 mm and push the needle back down. Bring the needle back up another 3-5 mm ahead.
• Repeat the up-and-down motion around the patch.
Step 3: Represent Interactions
• Assign a thread colour to each type of interaction (e.g., blue = predator-prey, red = competition).
• Do a running stitch between the species that exhibit this interaction, like the lizard and fly.
• Represent other interaction types using the colours assigned to them and create the stitches.
• Once done, take a step back and admire how the species are connected in your home ecosystem.
3mm
REFLECT:
• Which species was most abundant? Which was rare?
• Which species seemed most dependent on humans? Which avoided humans?
• What surprised you the most about your home ecosystem?
• Compare your t-shirt ecosystem with a friend’s — are some species common across homes, and some unique?
• If humans disappeared from your house tomorrow, which species might thrive, and which might vanish?
How many are directly or indirectly connected to humans? Do you think these species survive in this ecosystem because of humans or in spite of them?
This ecosystem is not isolated. The moths fly in and out of your home. The ant colony might extend beyond the confines of your house. The humans go grocery shopping and bring food back. We are constantly interacting with the outside world, and so are our little housemates. So how do we get a sense of the ecology beyond our homes, say in our backyards, towns, countries or in the rest of the world? It’s a mighty task for a single field biologist!
TAKE IT FURTHER:
What if everyone dons the hat of a field biologist? Data collected by the public is very valuable in creating species databases that researchers can use. This effort, named citizen science, helps collect data over large areas rapidly, and engage communities, making research a collaborative effort.
• Observe the bird species in your local neighborhood, park or other green spaces and create a species record as we did in the activity. Click a picture of the birds as well, if you have access to a camera.
• eBird is an online platform created by Cornell University for birders to share their sightings and data. (Scan the QR code here to take a look!) Explore the platform and find the bird species reported by birders in your area. Do you spot any of these birds near you?
• Take a moment to imagine, what the view outside your window might have been twenty years ago. What sounds, sights, and even smells filled the space? How about a hundred years ago? A thousand?
• Now, imagine the future. What might you see outside your window twenty years from now? Which of the species you observe today are likely to persist through the challenges of the Anthropocene?
Anthropocene:
The period of time on Earth where human activities are a primary influence on the environment and climate.
eBird website
MICROPOLIS
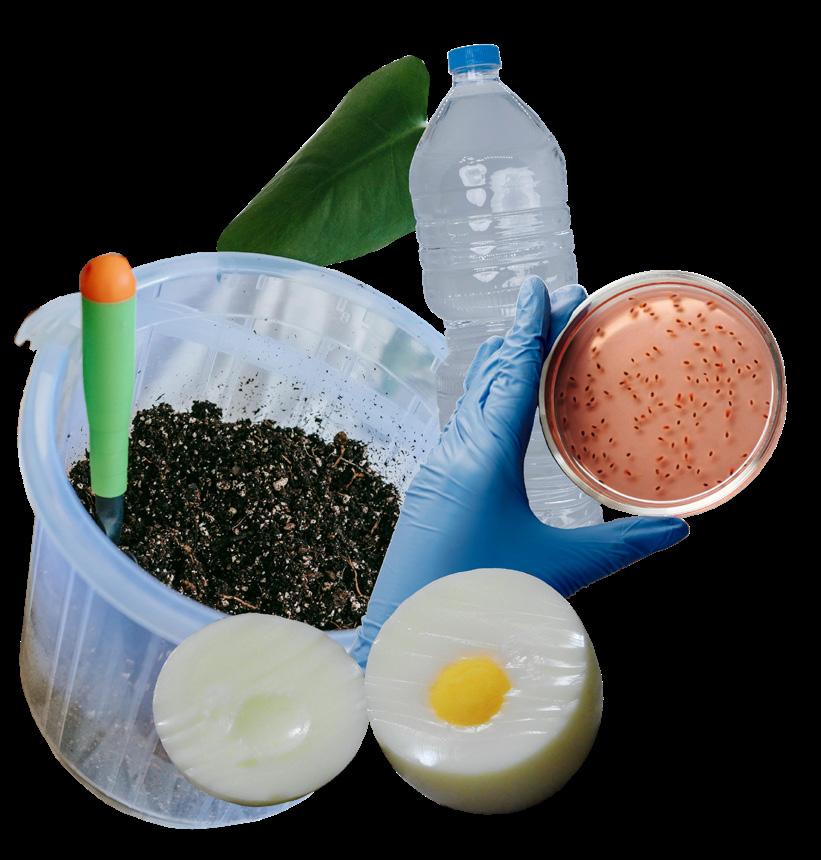
What’s the colour of mud? While brown might be the most common answer, mud can also be red, black, yellow, or grey. The colour of soil depends on its composition of minerals, organic matter, living organisms, gas, and water. Can we tweak these components to create multicoloured soil?
In the 1880s, a Ukrainian microbiologist Sergei Winogradsky came up with a fascinating way to do just that. He developed a technique to grow microbes in a column of soil by adding sources of sulfur and carbon. Over time, this column would produce beautiful mosaics of greens, purples, and pinks, thanks to the millions of different bacteria, fungi, and algae forming mini ecosystems within the soil. These microbes not only create beautiful colours but also play a crucial role in nutrient cycling underground.
When we think of ecosystems, it’s easy to overlook the soil, which is bustling with countless species of microorganisms. These tiny organisms represent some of the earliest forms of life on Earth, before multicellular creatures like us appeared. They help cycle essential elements such as nitrogen, carbon, and sulfur between the air, soil, and plants. And just like a busy city, there are many communities of organisms working together in harmony. However, various physical and chemical factors can change microbial profiles. For instance, detergent runoff can raise soil pH. Salt, sewage, pesticides, and fertilisers from human activities can seep into the soil, altering its composition. So what happens to the microbes then?
You can find out for yourself by creating your own Winogradsky column! Get your gumboots on and prepare to cultivate your own tiny microbial garden.
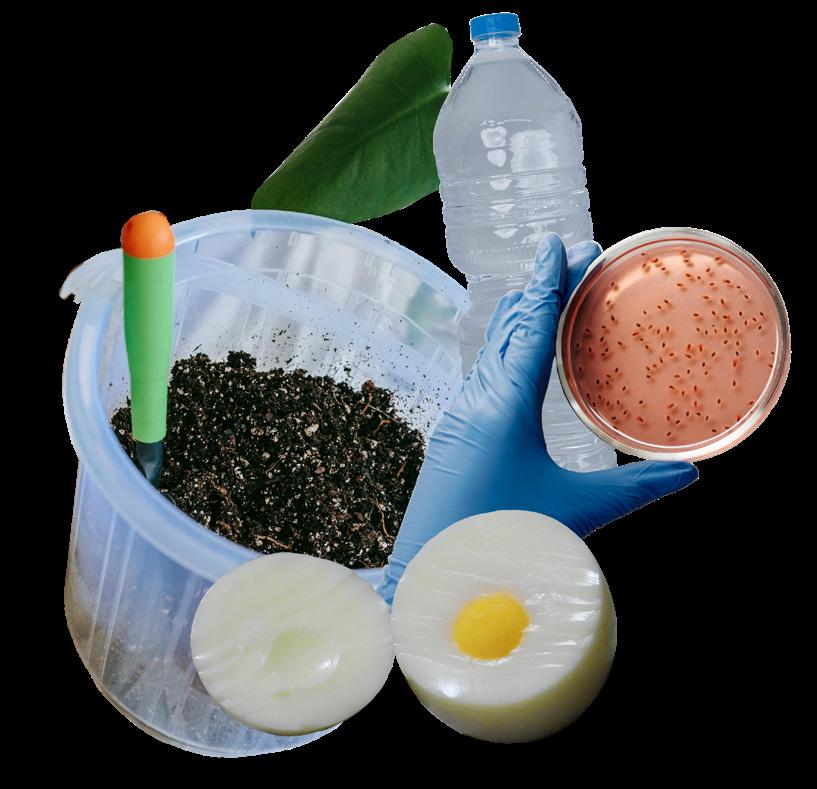
MATERIALS REQUIRED:
1. A clear plastic or glass jar (1 litre) - 3 or 4
2. Shovel
3. Bucket
4. Boiled eggs or Gypsum
5. Old newspapers
6. Plastic wrap
7. Rubber bands
8. Marker
9. Colour pencils or sketch pens
MAKE YOUR OWN WINOGRADSKY COLUMN:
Step 1: Collecting Mud
Visit a nearby water source, like a lake, pond, or riverbank, and look for a wet and muddy area. With the help of a guardian or teacher for safety, collect some mud from the bank.
Step 2: Setting Up Your Own Column
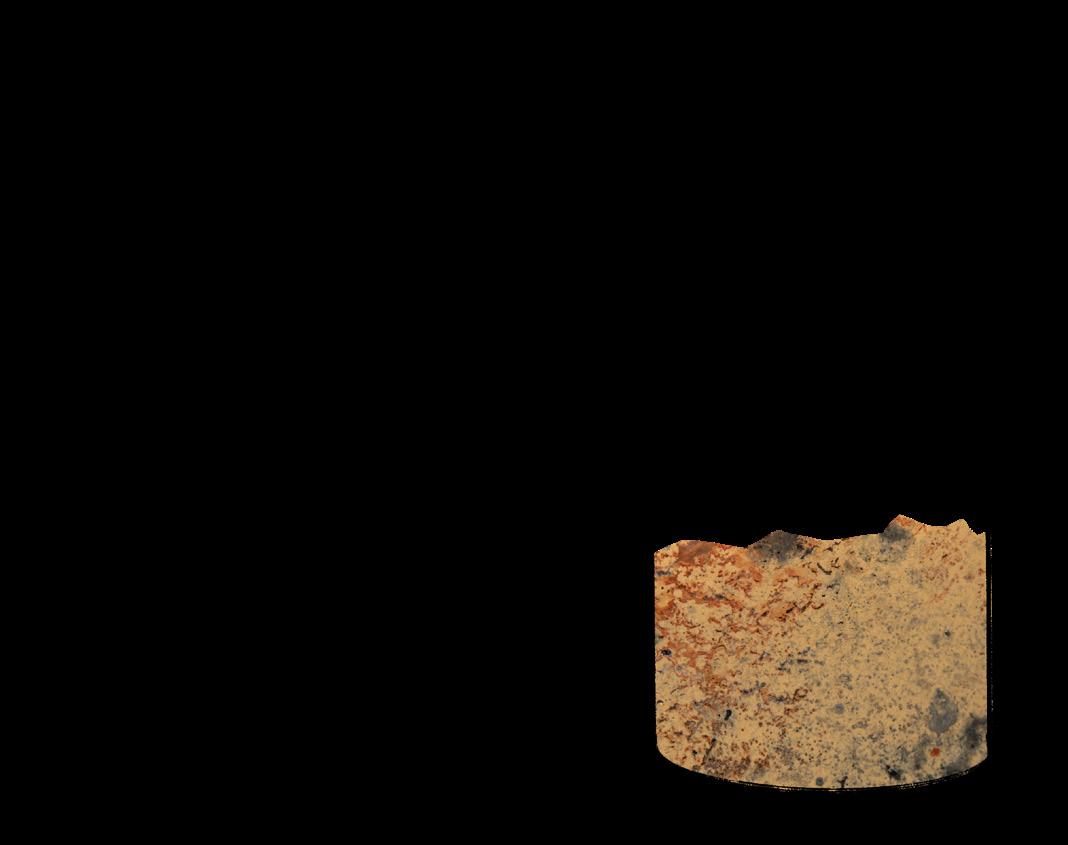
Once you are home, in a tall clear plastic container, add a layer of mud until a quarter of its height is filled. Make sure that you remove any sticks, rocks or unbroken clumps of soil in the mud.
Step 3: Adding Sulfur Source
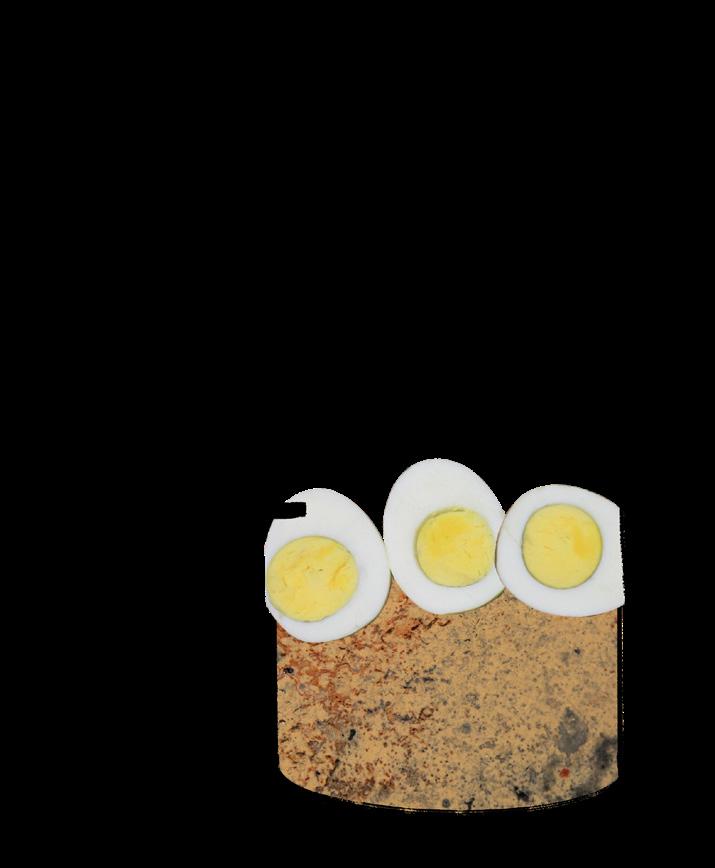
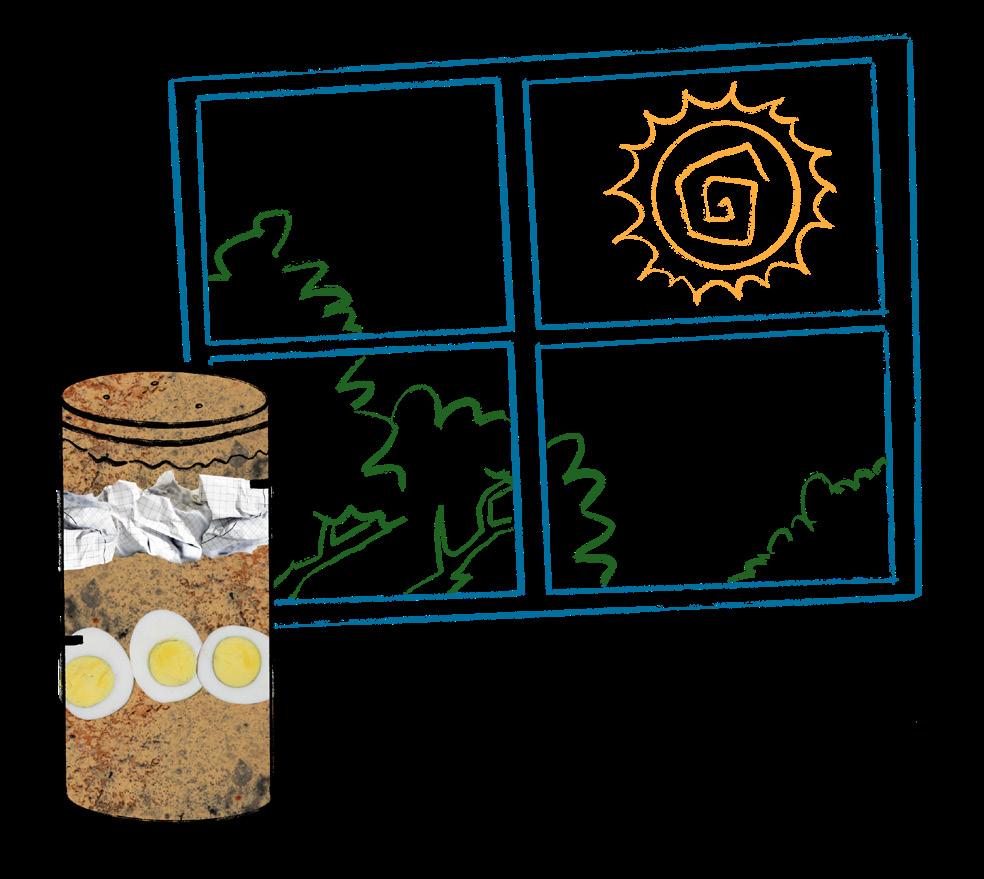
Add hard boiled eggs on top of this layer. This is a sulfur source for the microbes. Using a marker, create a mark on the container to note where the eggs were added. You can also use gypsum instead of eggs. Add another thick layer of mud on top of the eggs.
Step 4: Adding Carbon Source
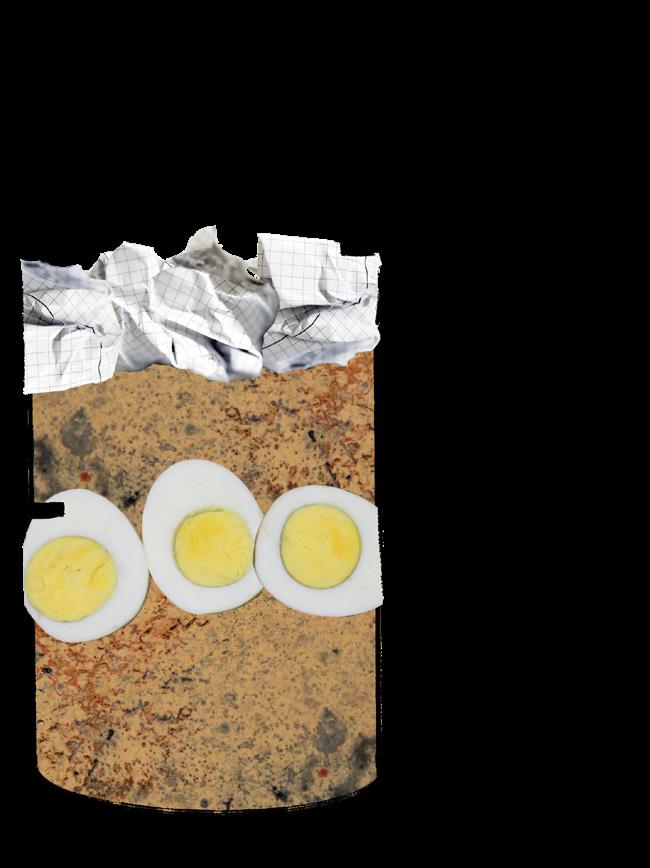
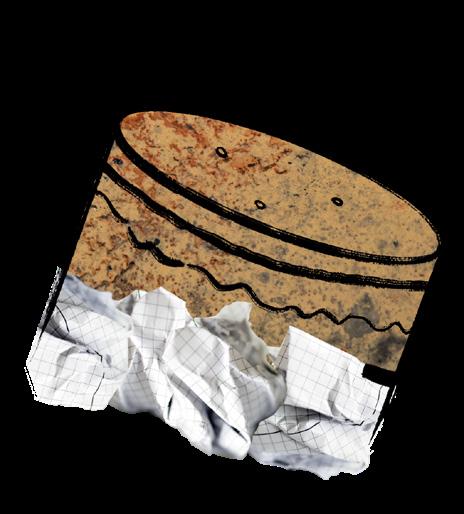
Add a layer of crumpled up newspapers. This will provide a carbon source for the microbes. Mark the level where newspapers were added as well. Pack in more mud until the container is full and cover it with plastic wrap. Secure the wrap with rubber bands or thick threads, and poke 2-3 holes in it to allow gases to escape.
Step 5: Observe Your Column
Place your container in a sunny spot and observe it weekly for about six weeks. Keep a notebook to record your observations.
Take special note of the colours around your markings. You should start seeing green colours in the soil within the first week or two. By the end of a month, you’ll notice red, orange, purple, and black pigments appearing.
Congratulations! You have created a self-sustaining soil microbe garden. This garden contains microbes that photosynthesise like plants and decomposers that break down matter, just like we do. Some of these microbes produce sulfide gas during their processes, while others convert this gas into sulfates, which help create more organic matter. Your microbe garden is a perfect example of a closed ecosystem!
Cleaning out
To clean out the containers, dump the mud in a compost or back in the muddy area you took it from. Wash your hands thoroughly with soap afterwards. If you have altered the mud’s chemical profile, consider dumping it only in the compost.
Comparing Changes in Soil:
Make three Winogradsky columns using the same type of soil.
Prepare the following solutions by mixing them with water:
- Solution 1: Water mixed with salt.
- Solution 2: Water mixed with vinegar.
- Solution 3: Water mixed with detergent.
Pour each solution into its respective column before sealing it with plastic wrap. These solutions will change the chemical profile of the soil, making it more saline, acidic, or basic.
Monitor these columns weekly and note down your observations.
REFLECT:
• Why do these colours form? As time goes on, the resource gradient that you created in the column encourages the growth of microbial colonies that produce pigments in the presence of sunlight. Resources are cycled between these colonies, creating a complex interdependent ecosystem. Can you guess which organisms contributed to the colours in your column?
• Think about the changes you observed in the soil when you altered its chemistry. How did the colours change? Can you think of the reasons for these changes? What happens to the soil when runoff from factories and farms alters its chemical profile?
• You can try out different variations of this column.
• You could use soil from different sources, such as your backyard, near a water source, and from a construction site.
• You could also create two columns: keep one exposed to sunlight and the other in the dark, such as a closet or a dark room, and observe how they differ.
• Don’t forget to compare your results, create hypotheses, and draw your own conclusions.
Observe the colours and textures created by the microbes in your column. Use the space here to reproduce their art with coloured pencils or sketch pens.
BEYOND THE BIN
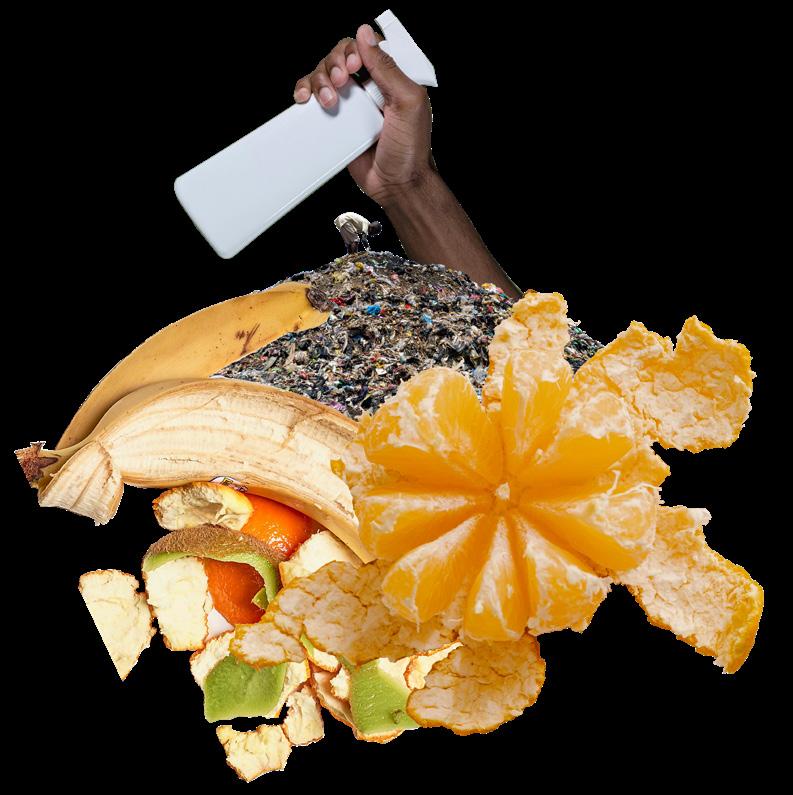
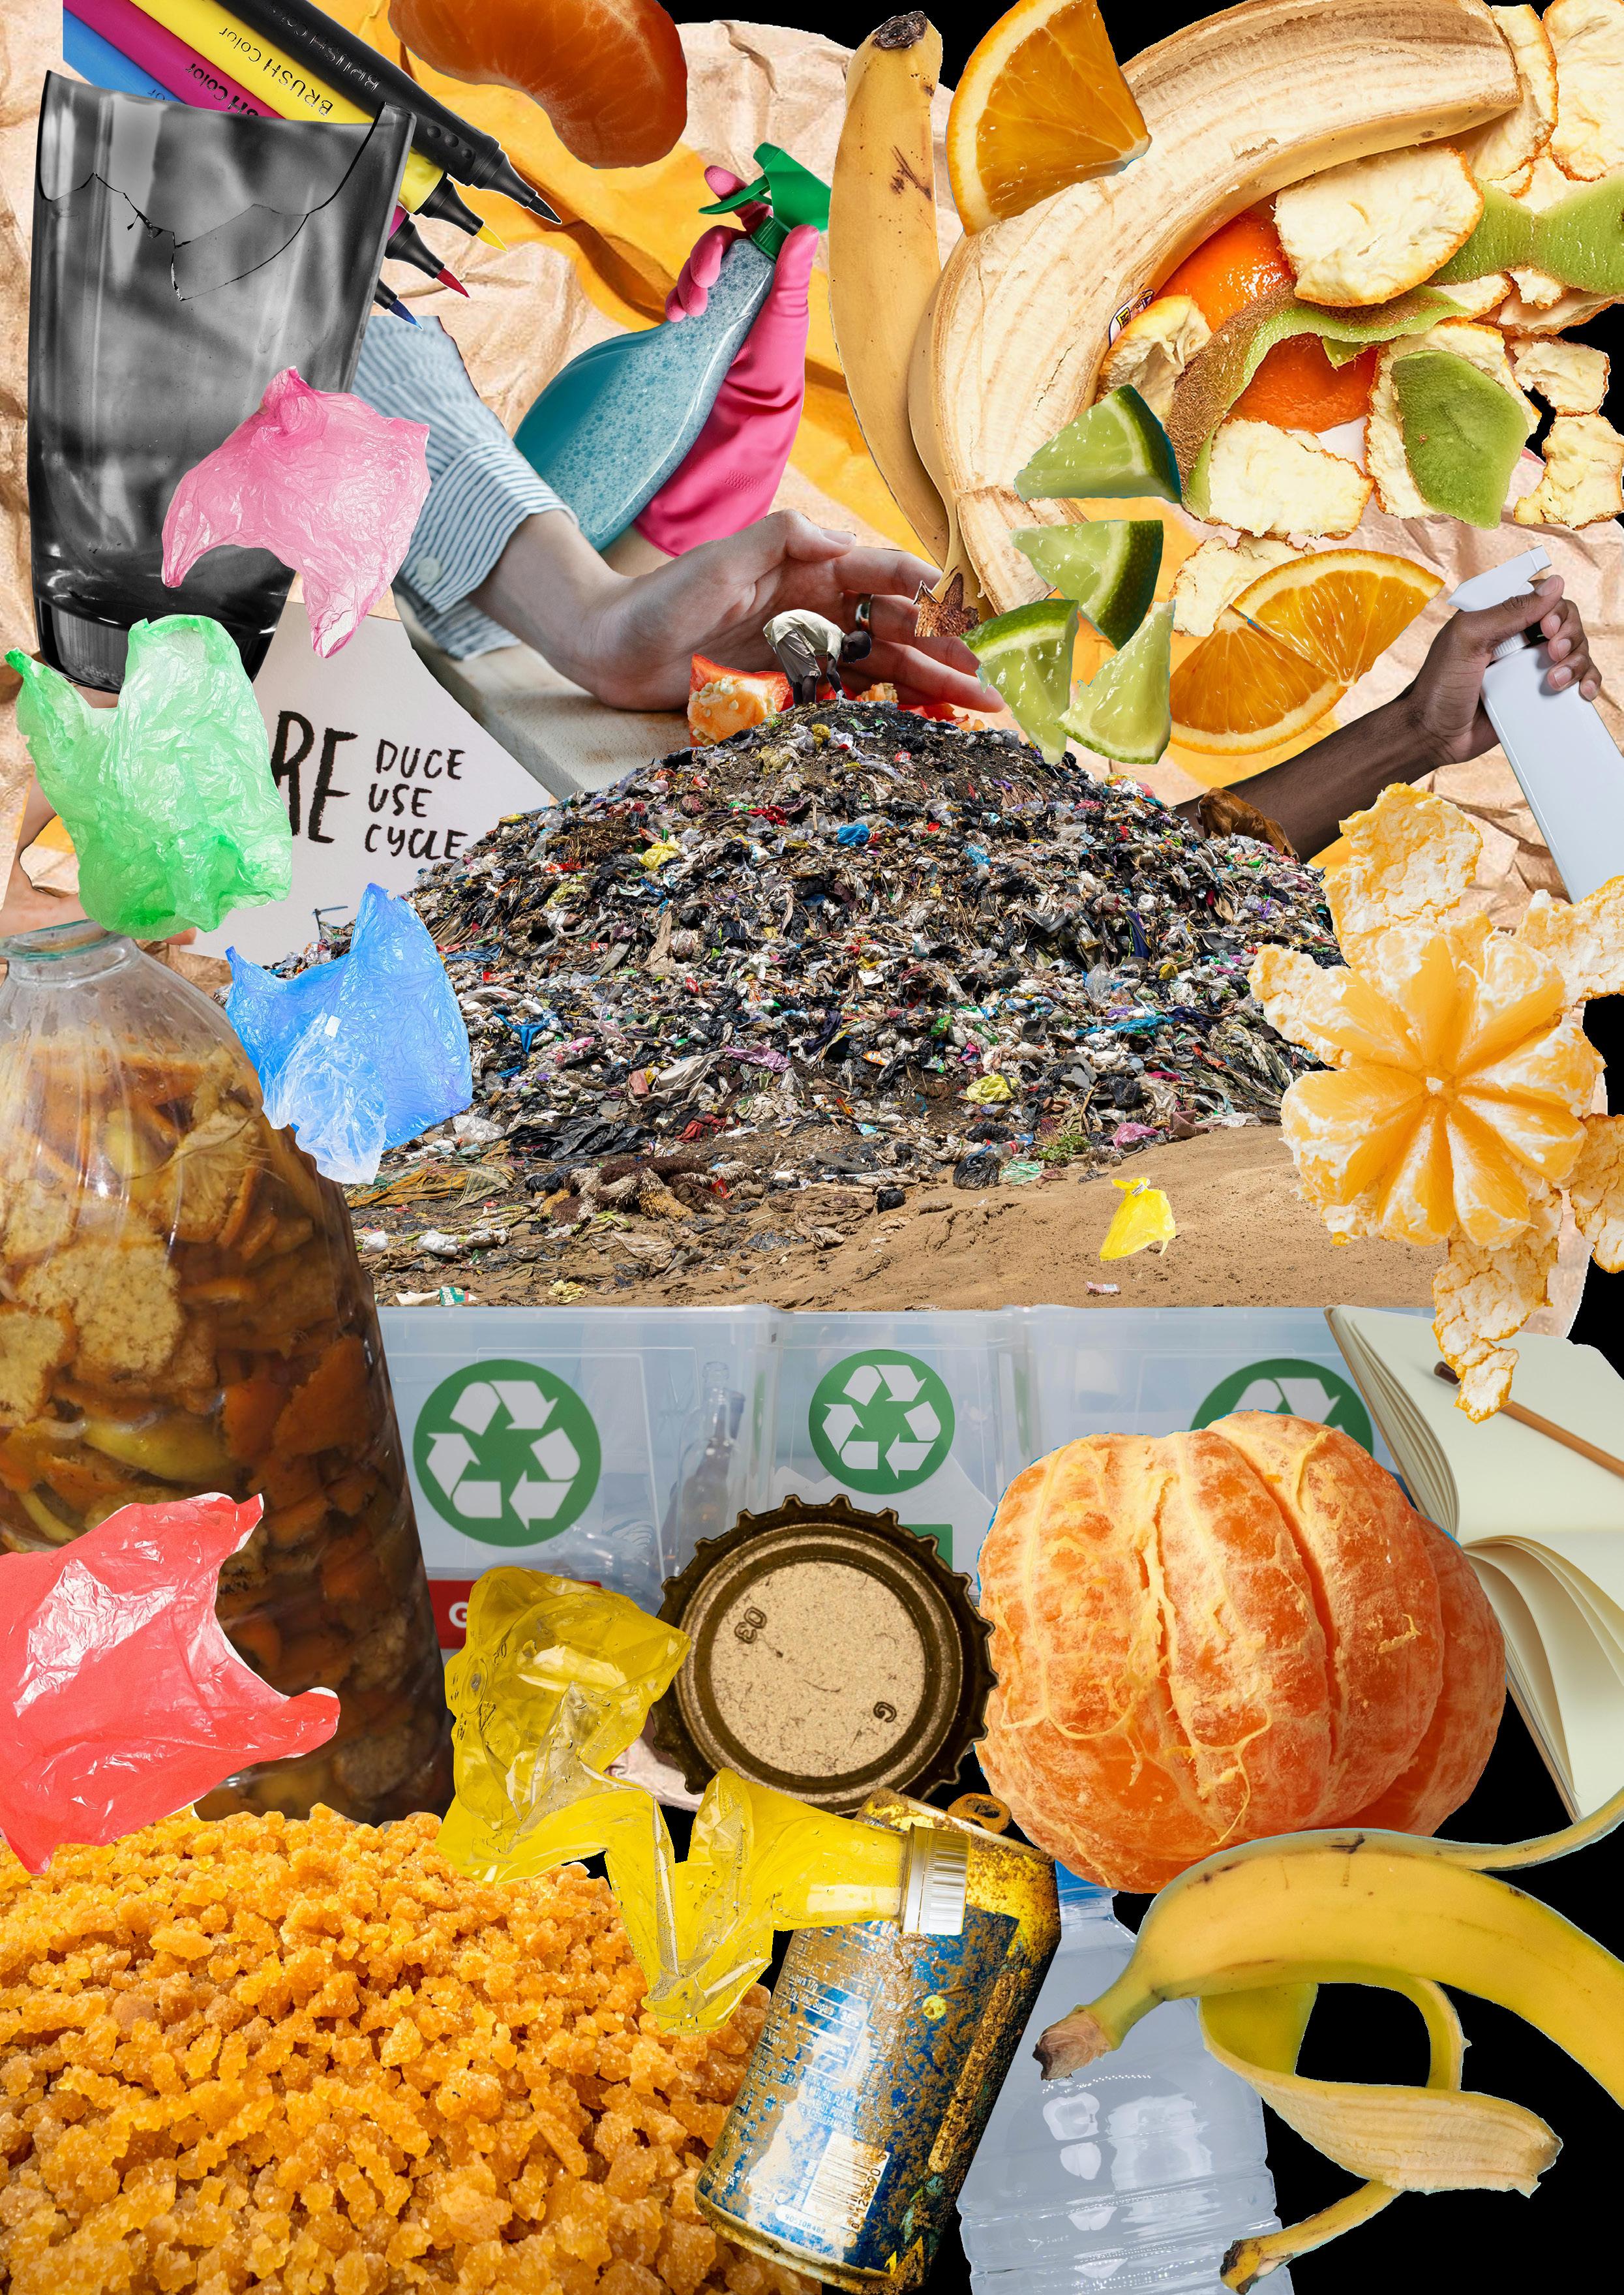
Waste. Trash. Garbage. Junk. Litter. These words all signal “unwanted” or “unusable,” but are they really? Candy Jernigan, an American multimedia artist, used meticulous methods to document trash and found objects, demonstrating that discards can reflect the society that produced them. If we rethink how we see what we throw away, these objects reveal a kind of hidden life. They’ve carried our meals, wrapped our gifts, and held our snacks. Even after we discard them, their journey continues.
Waste is an indelible mark we leave on the world, reflecting patterns of human production, consumption, and our relationship with the environment. Households, small businesses, and public service providers generate 2 billion metric tonnes of waste every year. This figure is projected to reach 3.8 billion tonnes by 2050.
Have you ever paused to wonder about the trash in your own home? What happens to it after it leaves your bin? What about waste from your neighbourhood, or your entire city? Where does it all end up? If trash could narrate its journey, what would its journal entry look like?
In India, household waste is categorised into wet waste, dry waste, sanitary waste, hazardous waste, and e-waste, each with its own journey. Some materials are reborn through recycling or reuse; others end up buried in landfills. Pick three items from different waste categories and trace their journeys. Observe what happens around you, speak to elders or people involved in waste management, or research online. Write, draw, stick, and scribble it all into a zine — a trash travel journal!
MATERIALS REQUIRED:
1. Paper or a small notebook
2. Colored pens, markers, crayons, or pencils
PART 1: MAKE YOUR OWN TRASH JOURNAL
What happens to the waste from your house? What about the waste from your locality (e.g: vegetable peels, used batteries, milk cartons)? Your entire settlement? Where does all this waste finally end up? If trash could narrate its journey, how would its journal entry look? Let’s make one!
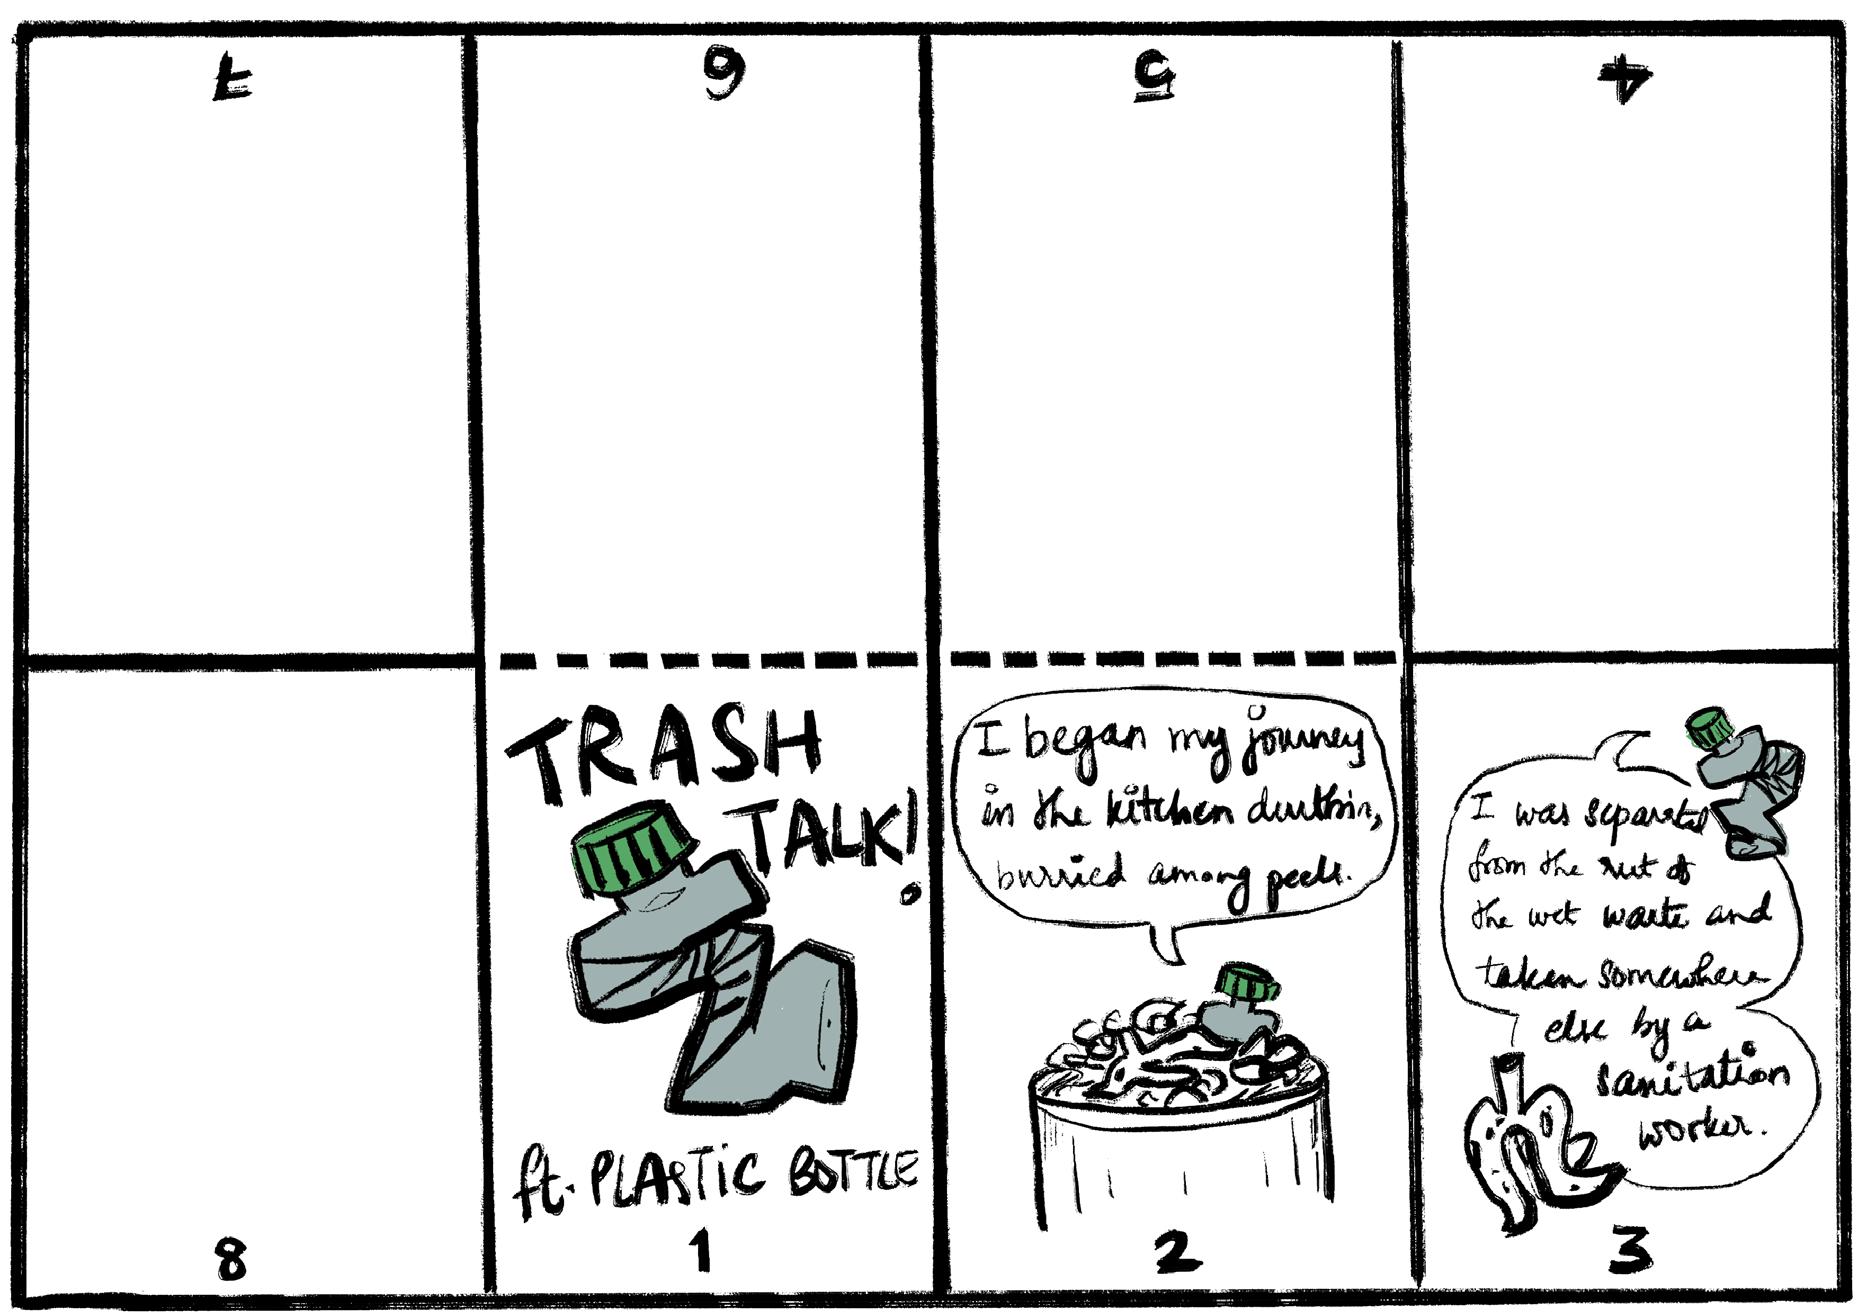
Pick three different items belonging to different categories of waste. Indian household waste is categorised into wet waste, dry waste, sanitary waste, hazardous waste and e-waste. Each of them has its own journey. Some are reborn by recycling or reusing, or end up in the abyss of landfills. Pick any three waste items that belong to different categories of waste to record their diverse journeys.
Observe, talk and research. Talk to elders and people associated with waste management. Observe how trash reaches the trash can, and map its journey.
Make a zine. Write, draw, stick and scribble it all in a zine and journal the trash journey! See this partially completed example below, you can start with completing it and then documenting the journey of another item!
How to make a zine
PART 2: MAKING A BIOENZYME
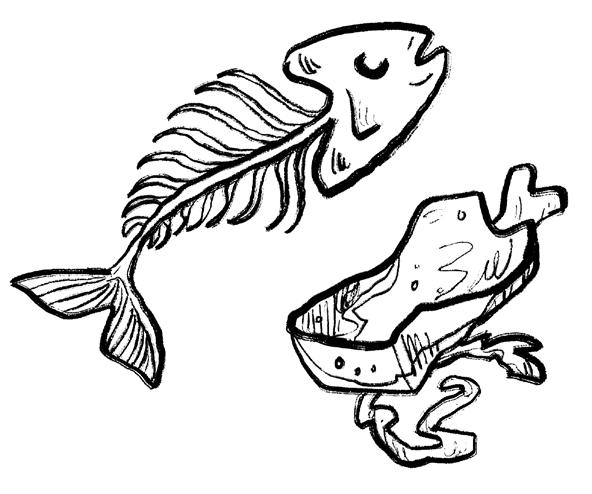
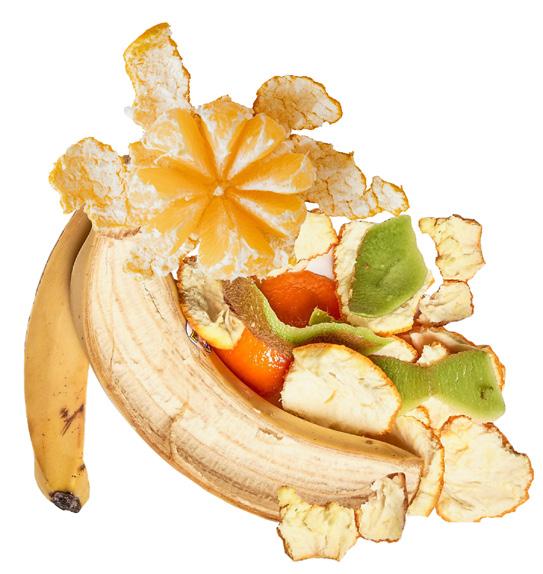
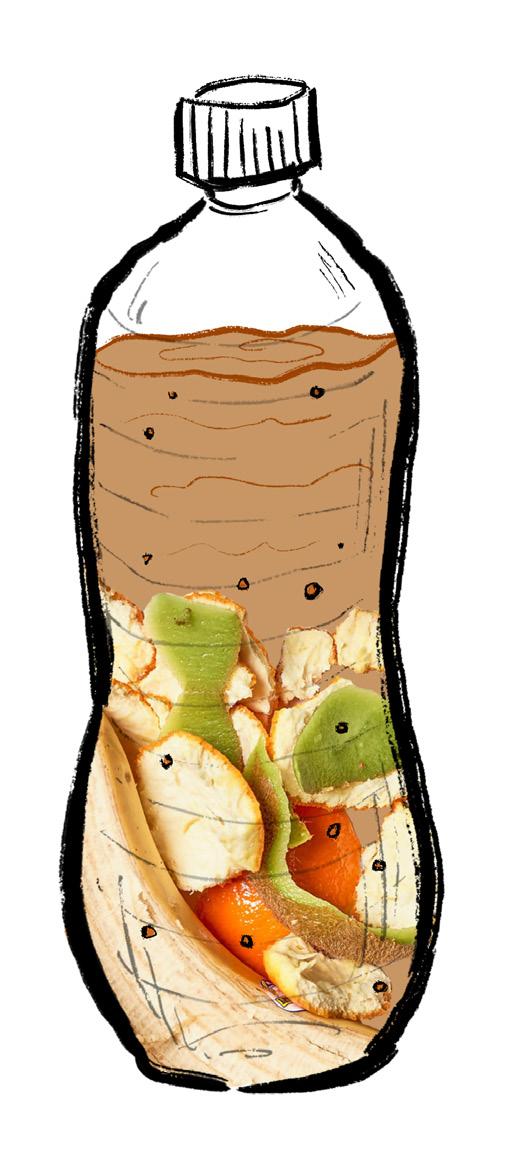
Step 1: Collect fruit or vegetable peels, or kitchen waste. Avoid meat, fish, and any cooked foods. Fresh fruit or vegetable scraps, particularly citrus peels, produce a fragrant bioenzyme.
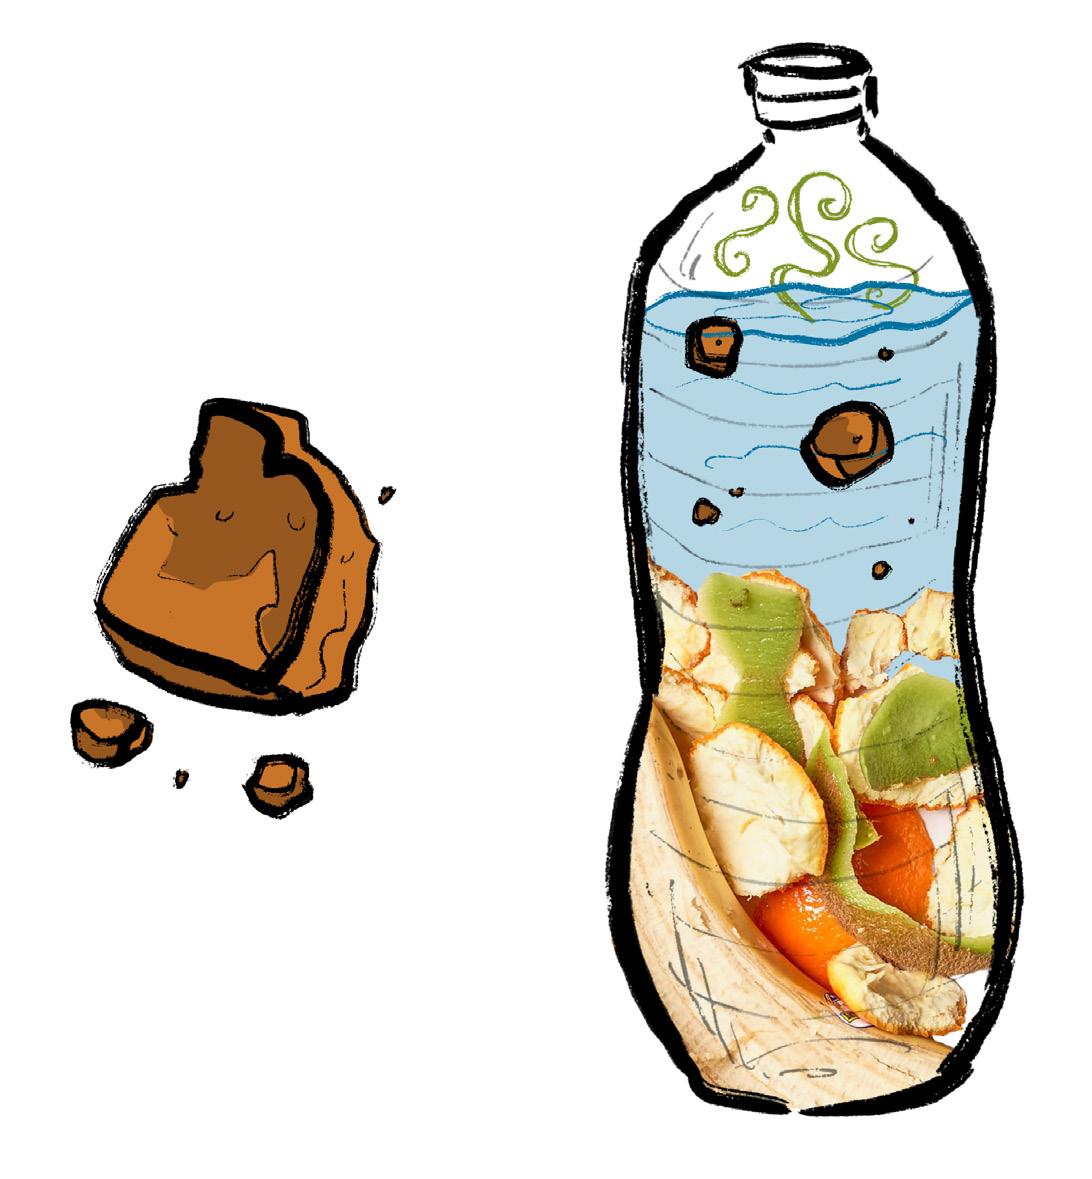
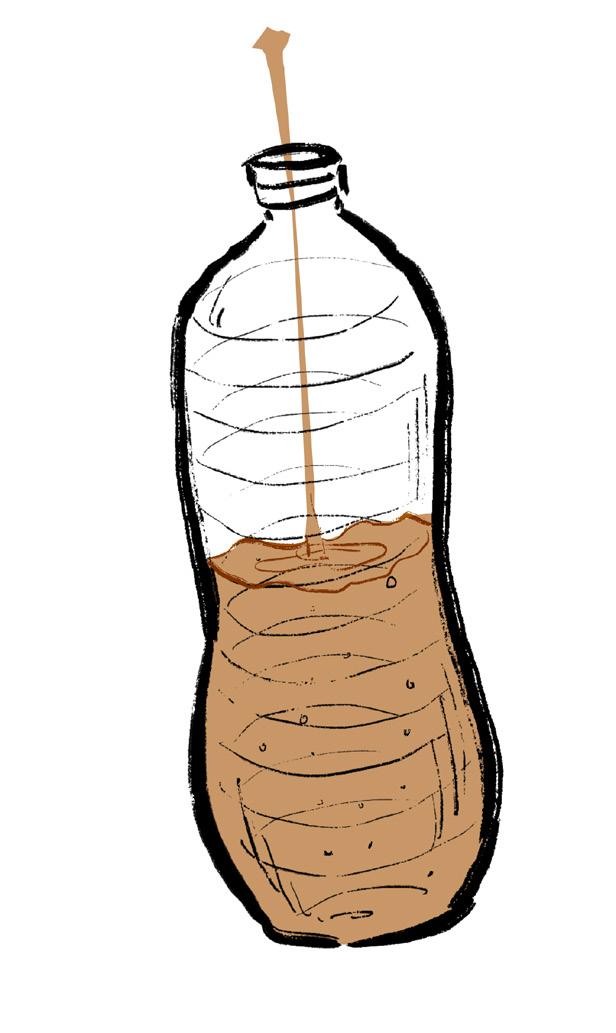
Step 2: Fill half the container with the kitchen waste and pour equal amounts of water.
Add about 50 grams of jaggery to a 2-litre bottle. Ensure that 20% of the container remains empty to allow for gas production during fermentation.
MATERIALS REQUIRED:
1. Fruit scraps/vegetable peels
2. Jaggery
3. Water
4. Airtight container/bottle
Step 3: Mix the solution properly, close the lid and store the solution in a dark corner.
Stir the solution daily for a month to prevent mould growth and ensure even fermentation. Then, let it sit undisturbed for an additional two months.
How does it work?
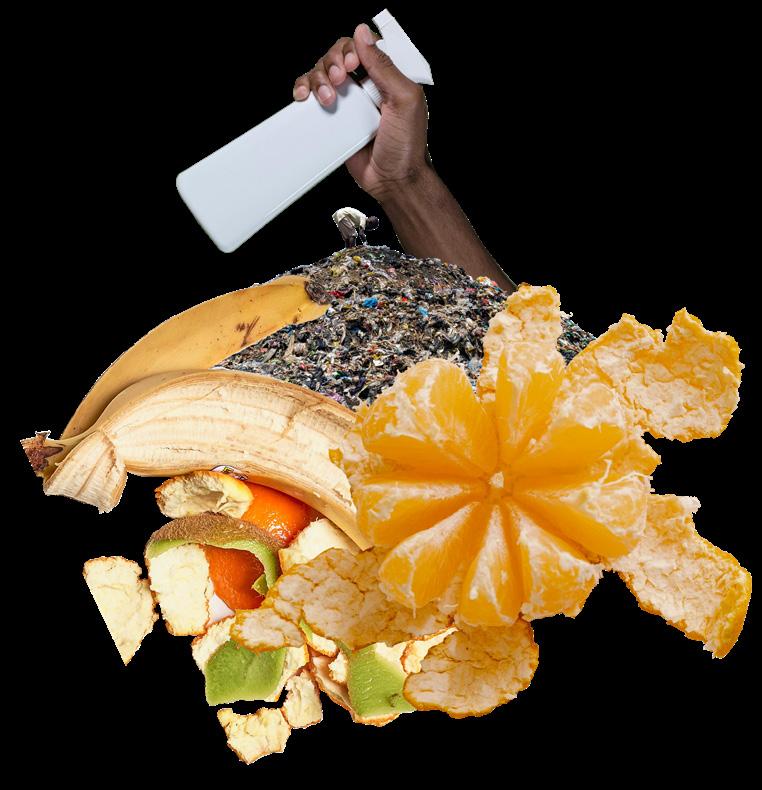
During the process of fermentation, the microbes naturally present in the solution feed on the organic materials, which are rich in sugars. The microbes further break down these complex organic molecules into simpler compounds. During this process, they produce enzymes. These enzymes are termed bioenzymes, are live enzymes that come from natural sources like microbes.
These bioenzymes catalyse the breakdown of organic compounds and make nutrients more accessible to plants. These bioenzymes can also catalyse different biochemical processes in the soil, aiding the growth of plants. These bioenzymes can break down organic matter, thus removing such dirt and stains from surfaces or even clothes. Also, a lot of organic acids are produced as a result of fermentation, and these can remove hard water stains, lime scales and debris from taps.
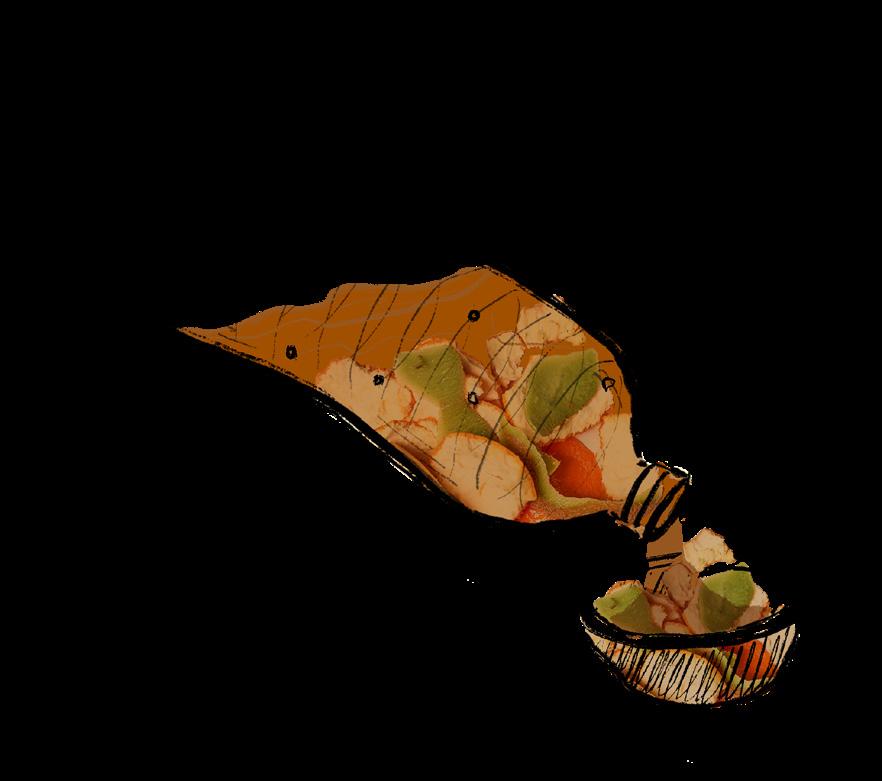
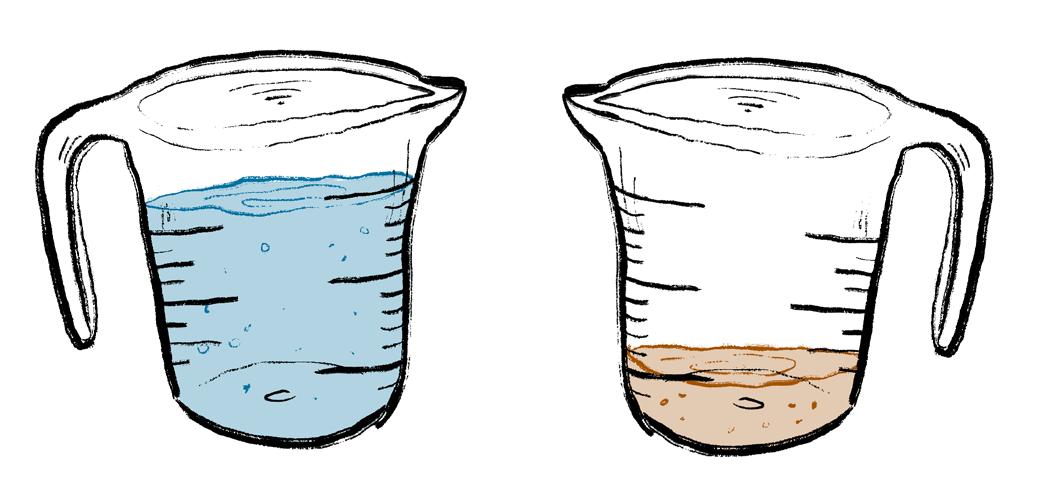
Step 4: After fermentation, strain the solution and dilute it with water in a 1:10 ratio (for instance, mix 100 ml of the solution with 900 ml of water).
Your bioenzyme is now ready to use as a fertiliser for your plants. Bioenzyme made exclusively from citrus peels can also be used for cleaning surfaces. When combined with soap nut liquid, it can be effective for cleaning dishes and laundry!
TAKE IT FURTHER:
• Did you notice any of the trash end up getting burned or dumped in an open space? How does the city manage the open dumping of trash?
• During your trash travel journal, how many women stakeholders did you come across? If possible, talk to them and listen to their experience in the sector and compare whether their male counterparts face all the issues they face. Do you observe any gendered aspects in the sector?
• The city of Kitakyushu in Japan stands out as an example of achieving waste reduction, with only 0.42 kg of municipal solid waste generated per person per day. Along with an all-round approach to waste management, Kitakyushu city implemented a ‘the more you throw, the more you pay’ initiative. Do you think there could be initiatives by your local governing body to help reduce the amount of waste produced?
ANATOMY OF A MARKET
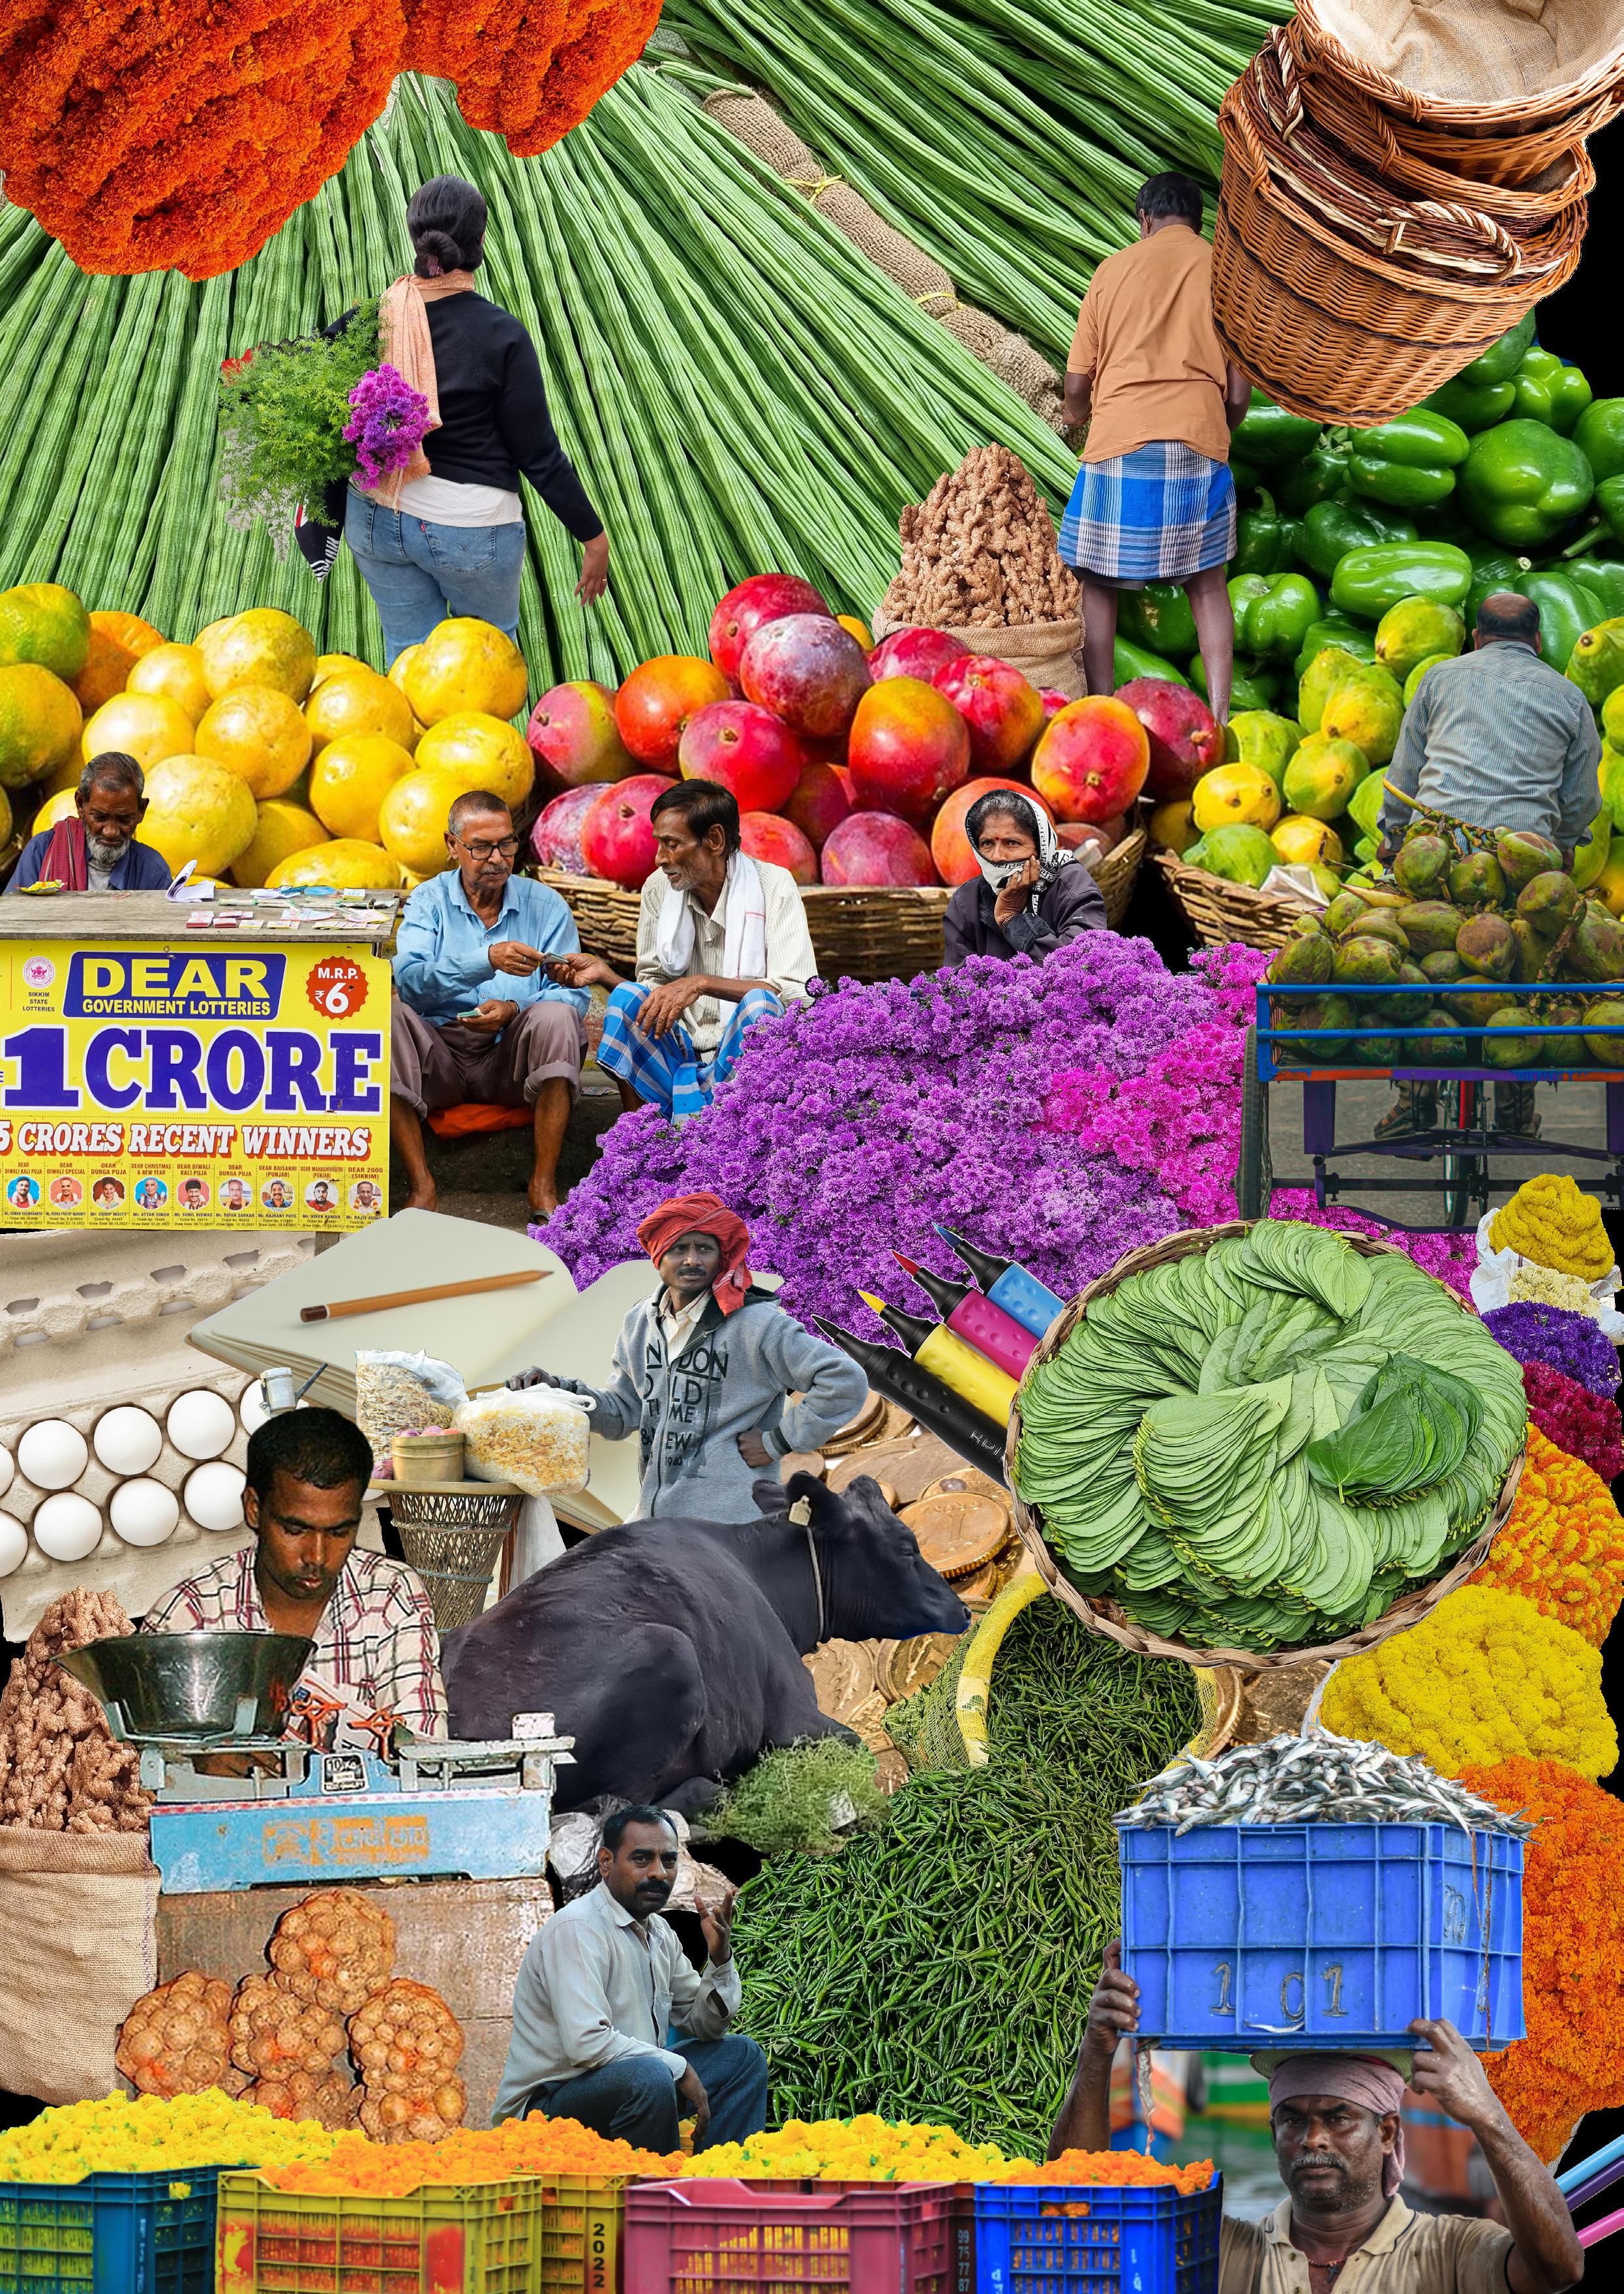
Have you ever walked through a local market? It’s often loud, crowded, and a bit chaotic, yet it all works. People weave through narrow paths, calling out prices, exchanging goods, and moving on. There is an invisible rhythm to it all. Hidden rules help buyers and sellers find what they need, often without saying much.
Markets have always been a place where people gather to trade goods, stories, ideas, and habits. Some markets evolve into settlements, while others grow alongside them, influencing how towns and cities develop. By observing a market closely, we start to notice patterns that shape it, like how vendors claim space or how trust builds between buyers and sellers. Observation helps us understand these dynamics. Like scientists, we learn by noticing, asking questions, and spotting connections. The more we observe, the clearer it becomes how a local market reflects larger aspects of human life.
In this activity, you will explore your local market to observe these patterns. Treat it as a living, breathing system: notice how people move, how goods are displayed, and how sounds and smells enhance the experience. Look for patterns, informal rules, and the small decisions that keep everything functioning. Use sketches, maps, overheard phrases, or textures you notice to document your observations and turn them into a zine.
MATERIALS REQUIRED:
1. A notebook or sketchpad (for the zine)
2. Pens, pencils, or any drawing/writing tools you like
3. A phone (for photos, voice notes, or mapping)
4. Optional: Coloured markers, tape, anything that helps you capture textures or moods
MAKE YOUR OWN MARKET WALK ZINE:
Think of the market as a living system, and yourself as both a participant and observer. Carry your zine booklet, move slowly, and document what you see, hear, smell, and sense.
Use the following five prompts to guide your observations. Each prompt can take up one page of your zine.
Prompt 1: Flow of People
People ebb and flow, just like rivers. Observe the rate at which people walk through different areas. Where does it slow down? Where does it rush? Why does this happen? Draw flow lines to represent this. Bunched lines = congestion. Spread lines = free space. Does this remind you of anything in the city/settlement context?
Prompt 2: Types of Activity
Are similar shops located together? Do fruits stick to one lane and electronics another?
Make a list of the different types of actions being performed in a section of the market. For example, are people arriving or leaving?
Prompt 3: Stacking and Display
Look closely at how goods are arranged. How do vendors display things to catch attention or save space?
Try drawing a few arrangements. Observe shapes - are they pyramids? Heaps? Grids? Where did the vendor learn how to do this? Can all vegetables/fruits be stacked like this?
Prompt 4: Soundscape and Smellscape
Close your eyes and take a couple of deep breaths. Pay attention to what sounds layer over each other? Where are they coming from, direction and distance. A vendor’s call, footsteps, honks, grinding machines? What about smells: fried snacks, fresh coriander, damp cloth, meats? Use abstract shapes or lines to represent these on your zine. What shape is a smell? What pattern is a sound? (look to The Shape of Sound activity on page 35)
Prompt 5: Bargaining
Listen in or gently ask: How do vendors set initial prices? What influences much they are willing to bargain? Write or draw one conversation. What signs did the vendor notice? What strategies did they use?
Tip: You don’t have to get everything perfect. This is your version of the market. Use colors, arrows, scribbles, labels, and questions.
TAKE IT FURTHER:
Before you close your zine, take a step back. Who is missing from the space you mapped? What kind of labour stays invisible in a bustling market? Where does the produce come from and where does it go when the day ends?
Or, take a step forward and imagine a market of the future! What does it smell like? How do people move through it? Who works there, and how? Use this last space in your zine to dream, draw, or write about what a street market might become or investigate what happens to the unsold produce at closing time.
TEXTURE TRAILS
Try running your fingers on the patterned outdoor tiles of your house or school, feel the bark of a tree, rough and grooved, or a painted handrail, smooth and cold. If you hadn’t seen them before, could you guess what they are?
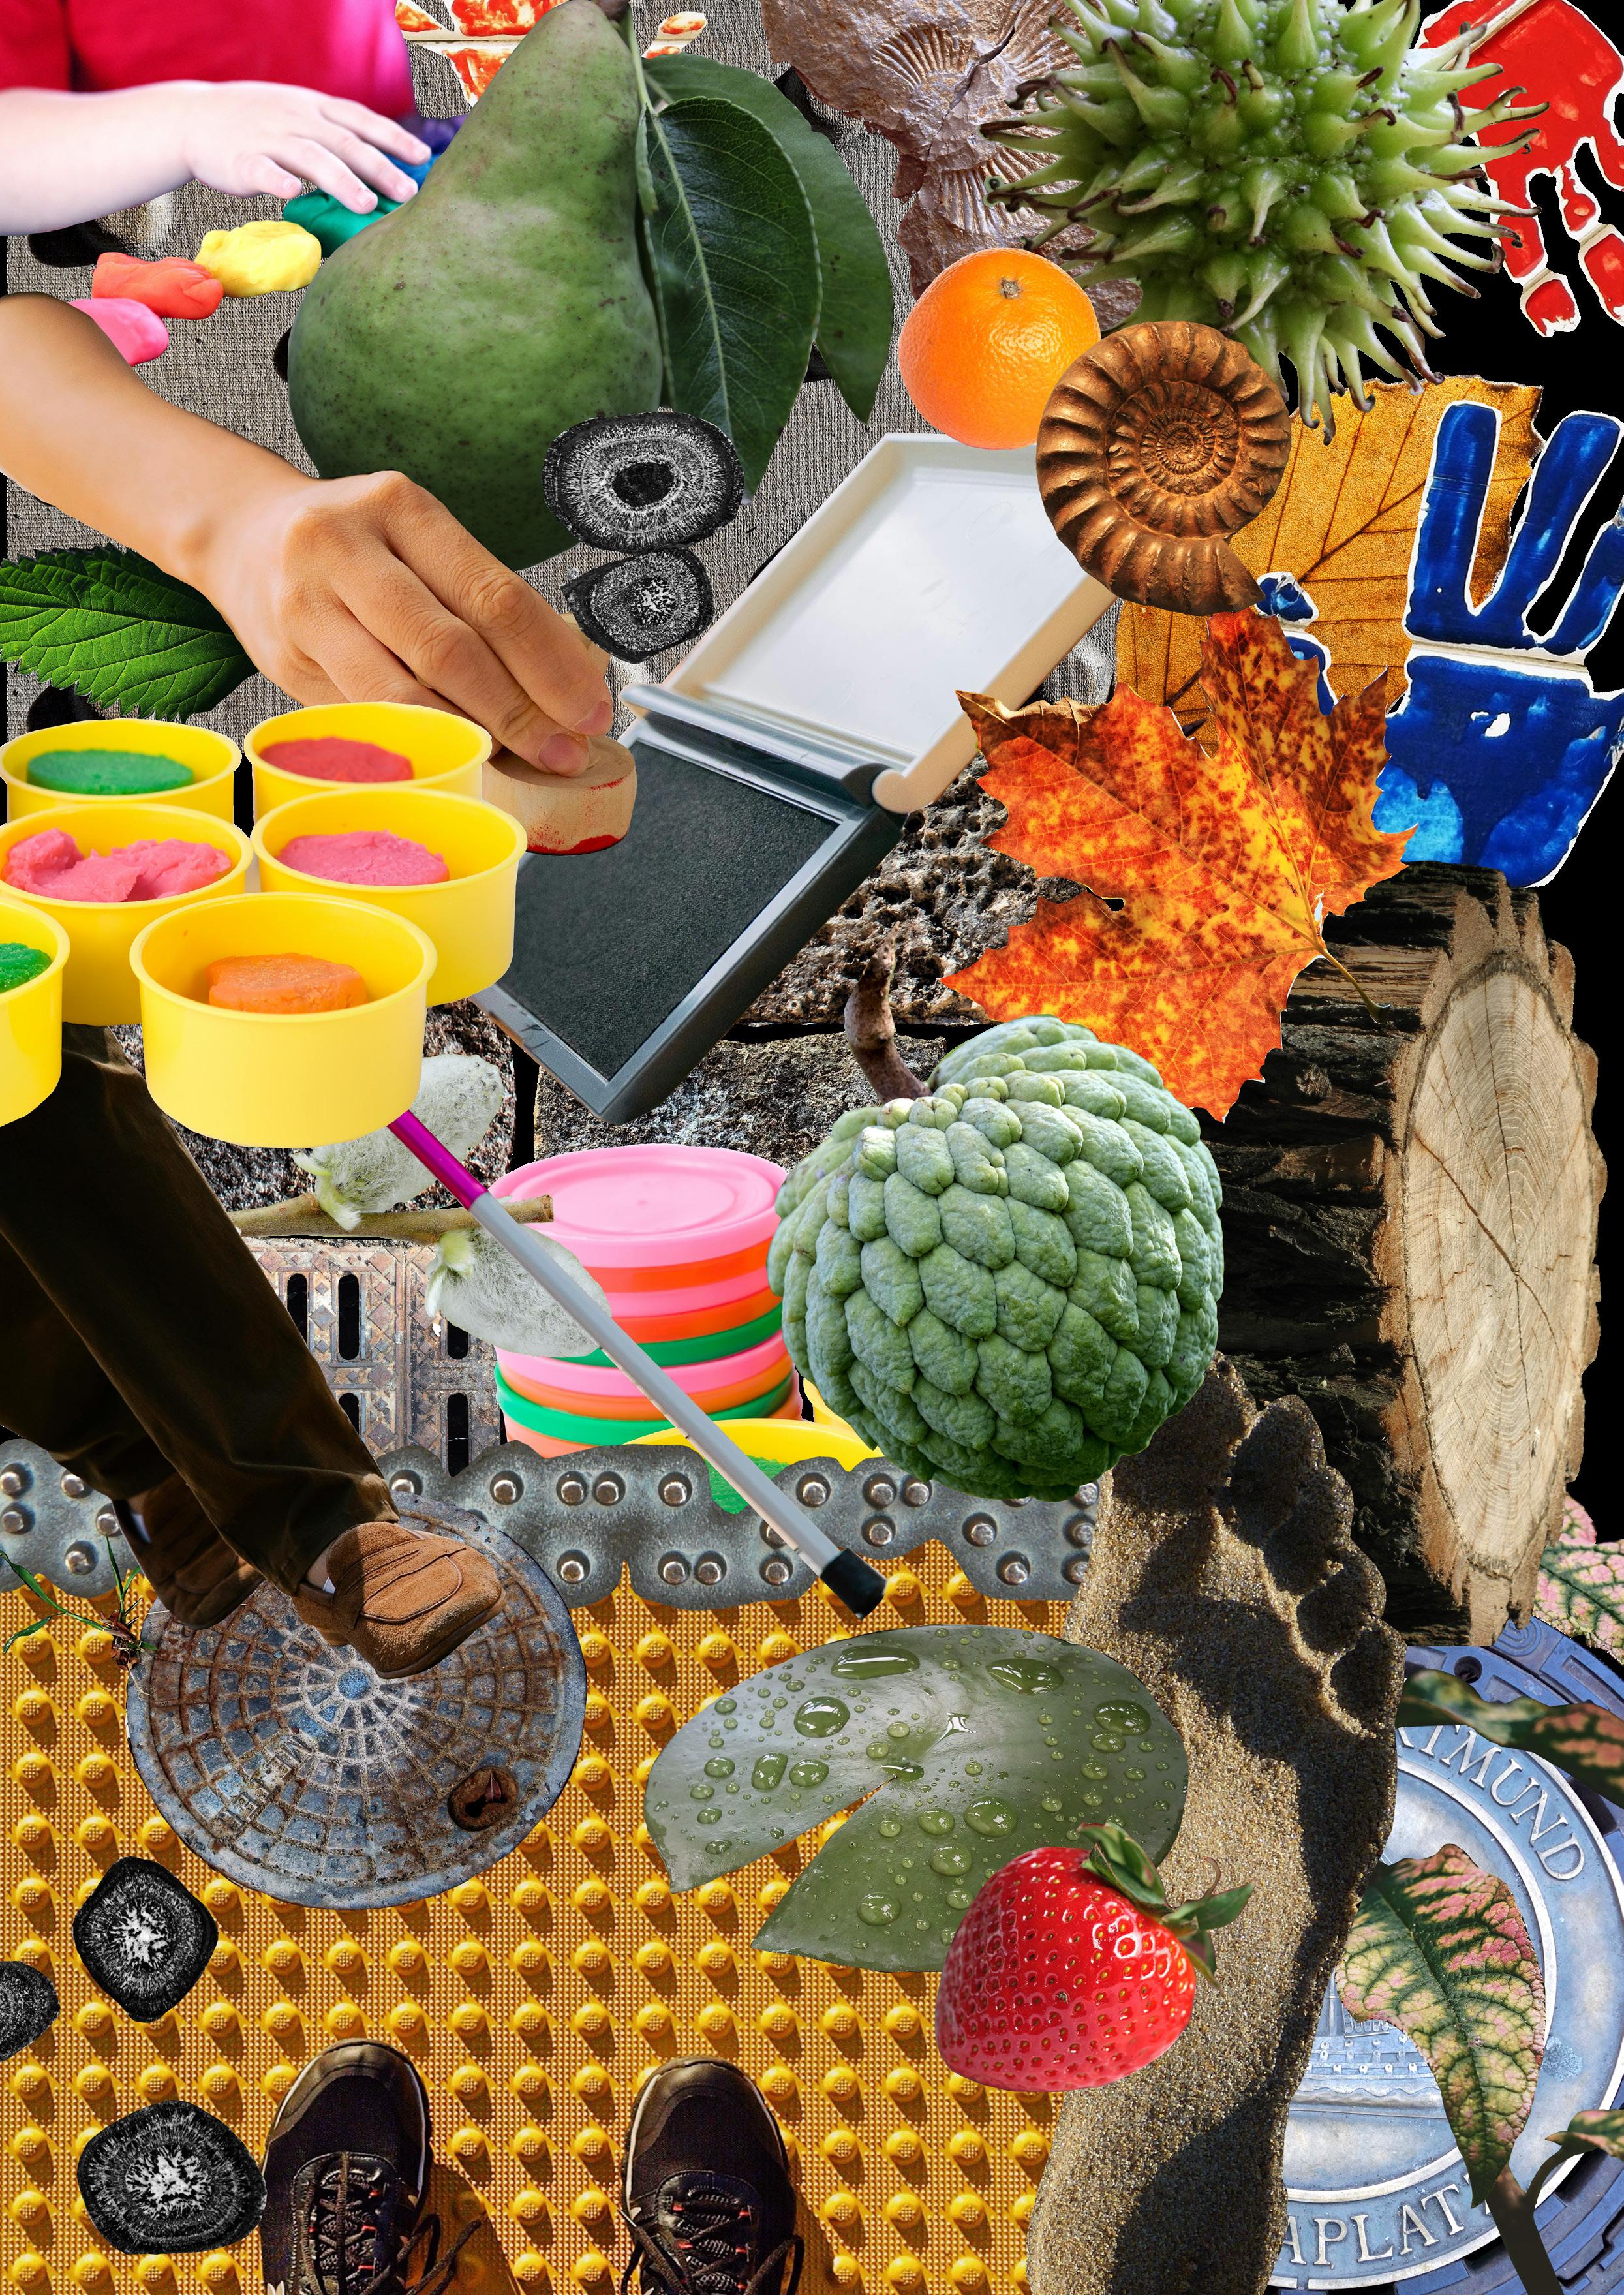
These textures speak to you through your hands. They offer grip, guide movement, protect, or simply comfort. In cities, texture is a powerful design element, especially in city planning. The bumps on sidewalks? That is tactile paving, helping visually impaired people navigate streets safely. Even manhole covers have raised details to prevent slipping in the rain. Roads are not completely smooth for a reason: variation improves safety, grip, and orientation.
Texture also plays a vital role in nature. A waxy leaf repels water. A fuzzy leaf traps moisture or deters insects. Texture helps plants survive and helps us feel connected to our environment.
But here’s the thing, your brain needs sensory variety too. Throughout the day, you rely on changes in light, temperature, sound, and texture to feel alert and calm. Natural environments give you this freely: pebbles, grass, and tree bark. But many schools, offices, and cities fall short, they feel flat and repetitive. Sensory-rich spaces aren’t just beautiful, they support mental well-being and accessibility.
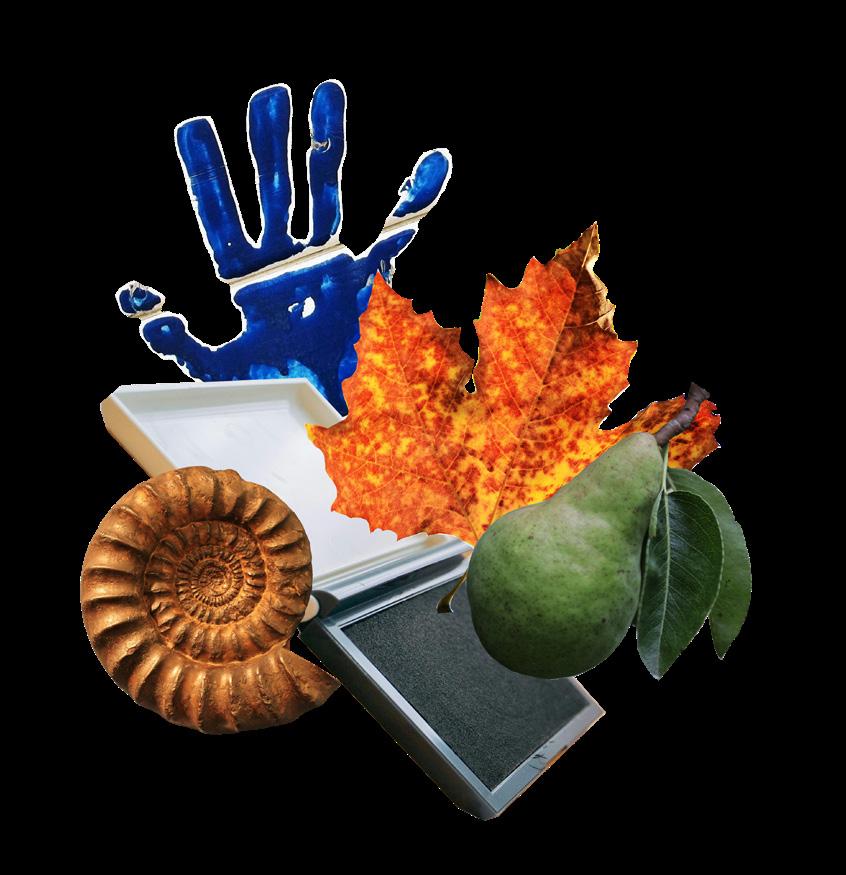
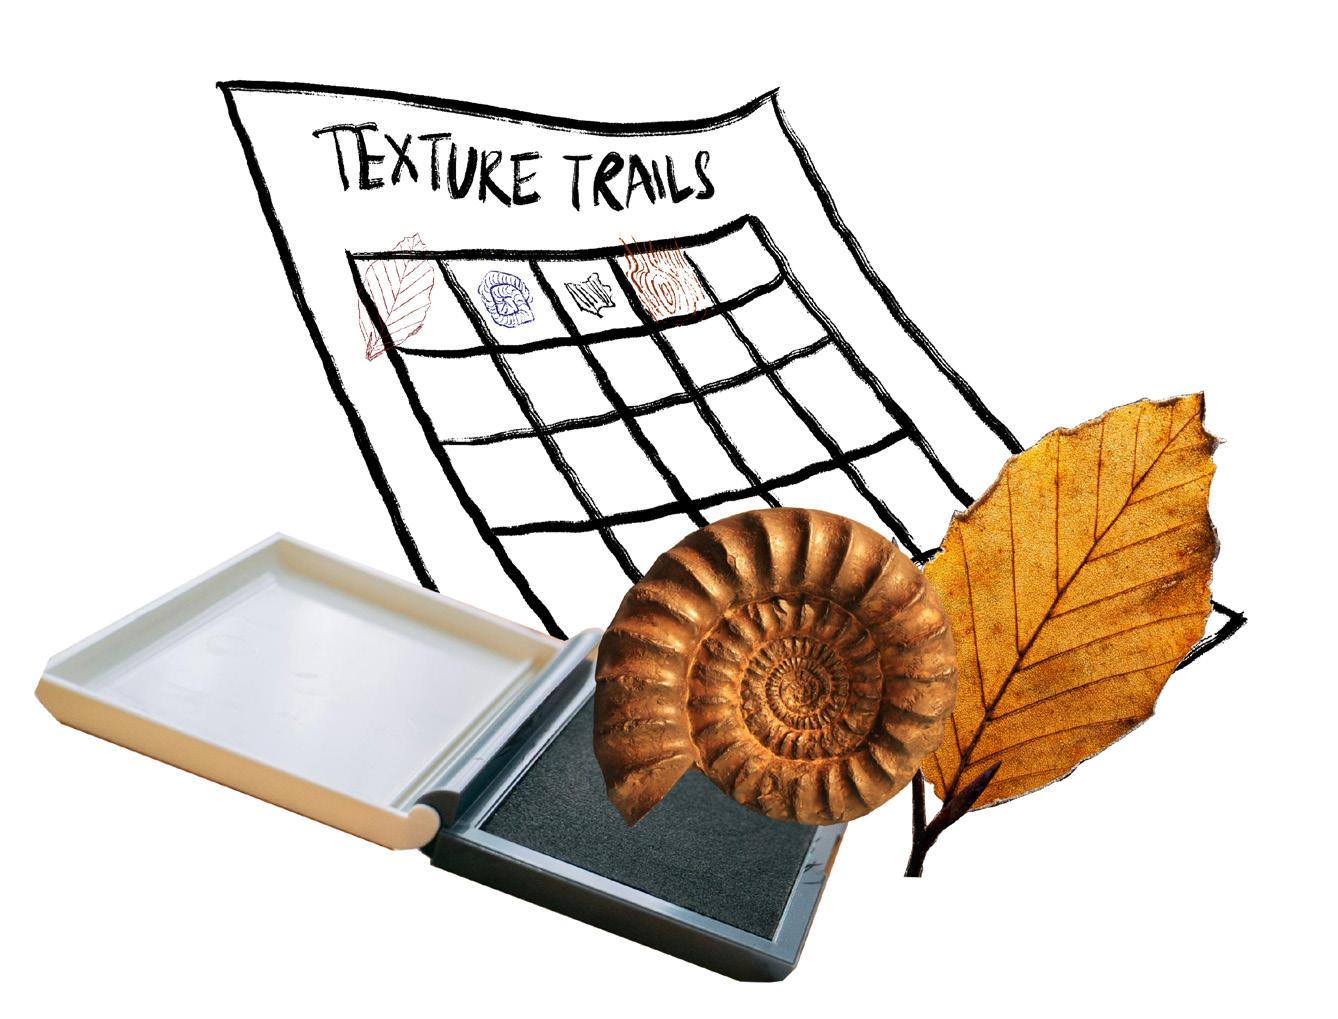
In this activity, you will tune in to the textures around you that are often overlooked and explore how they shape your daily experience. You will collect these impressions to build a playful, tactile bingo card that captures the characteristics of your surroundings.
MATERIALS REQUIRED:
1. Modelling clay or nondrying clay
2. Ink pad (any colour you like!)
3. Printout of a 5x5 Bingo grid provided on page 33
MAKE YOUR OWN TEXTURE BINGO:
Step 1: Choose Your Spot
Pick a location in your neighborhood that you’d like to explore—it could be a park, a street corner, a playground, or even the area around your building. Make sure to carry all your materials with you.
Step 2: Explore and Observe
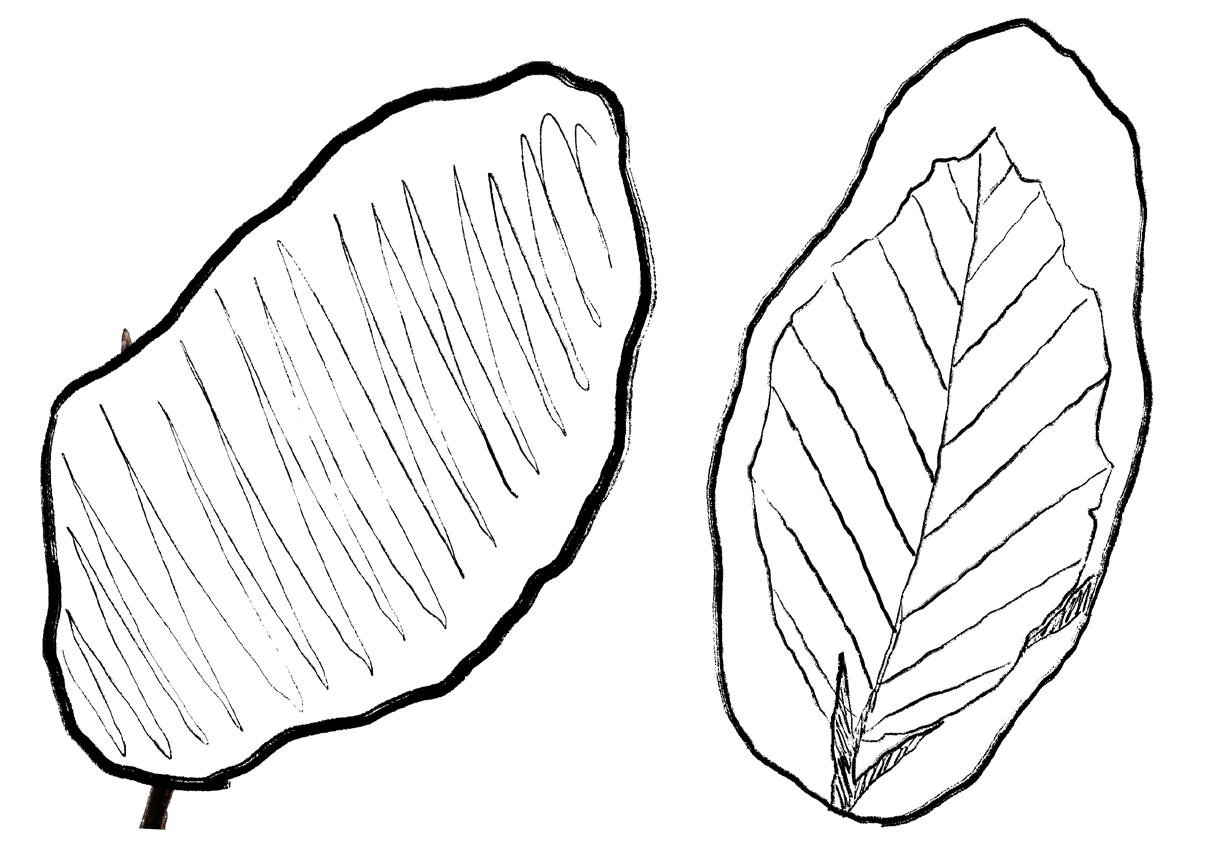
Walk around slowly and look for interesting textures in your surroundings. These could be the bark of a tree, the surface of a metal signpost, the pattern on a gate, cracks in a wall, or even the veins on a leaf. Let your fingers guide your curiosity!
Step 3: Make Texture Impressions:
When you find a texture that catches your eye, press a flattened piece of modelling clay firmly onto the surface so it picks up the texture as an impression.
Step 4: Ink and Stamp
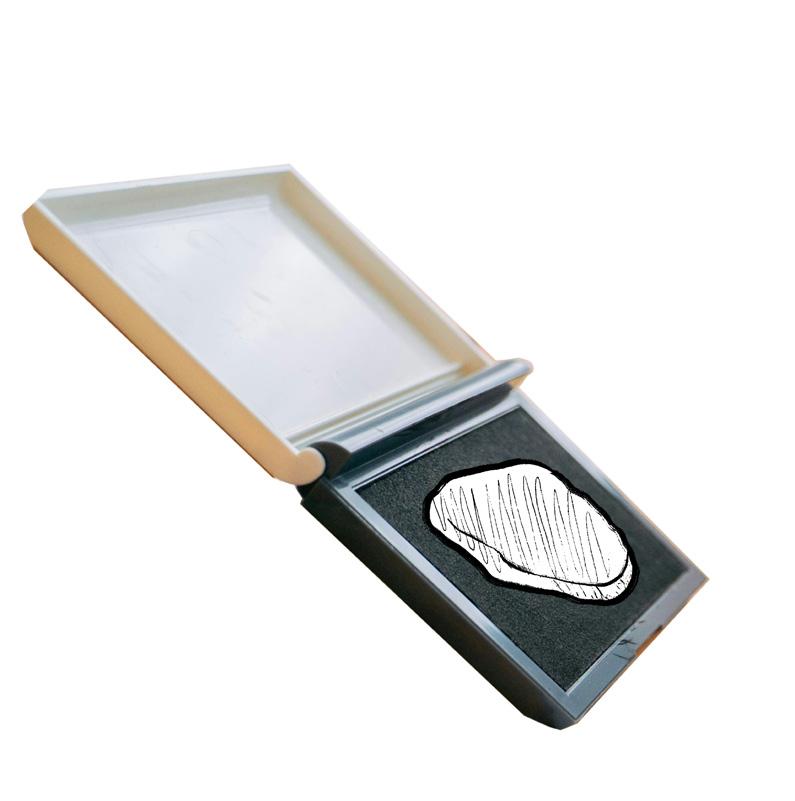
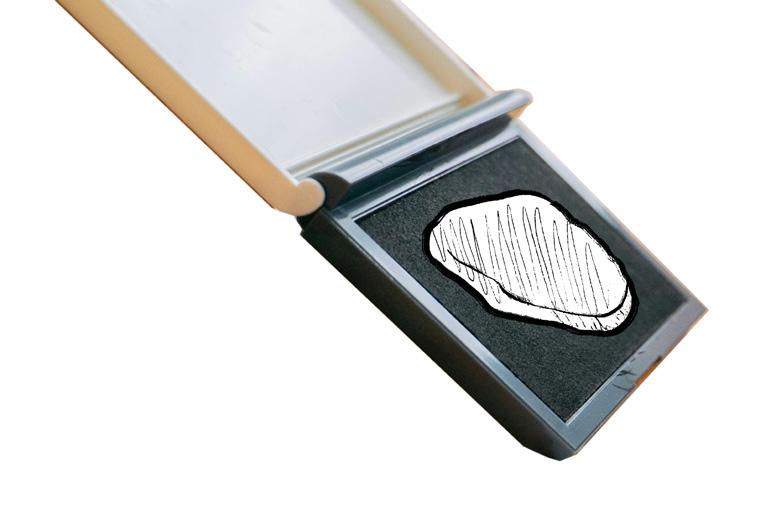
Gently press the textured side of the clay onto the ink pad to coat it with ink. Then, press the inked clay onto one square of your Bingo sheet. You’ve now recorded your first texture!
Step 5: Repeat and Fill Your Grid
Continue exploring and repeat the process until your entire 5x5 grid is filled with a unique collection of textures
Step 6:
Hand your completed sheet to a friend and challenge them to find the real-world objects and places that have the textures you’ve collected. If they can match five in a row (horizontally, vertically, or diagonally) they win BINGO!
(Tip: You can both create and exchange Bingo sheets for an extra challenge!)
REFLECT:
• Which texture surprised you the most? Have you noticed it before today?
• Was the texture natural or man-made? Can you guess why it formed that way or was designed like that? What purpose might it serve—perhaps grip, decoration, weather resistance, or something else?
TAKE IT FURTHER:
• If you were to create a map of the place you explored, what kinds of markers would you use? Could you use textures as symbols for different locations? Try sketching a rough map of your street or neighborhood and mark each area with the texture you found there. Label them with simple drawings or texture rubbings.
• Compare areas with mostly natural textures (like trees, stones, or leaves) and those with man-made textures (walls, pavements, fences). Where do you see more variety? Why might that be?
TEXTURE TRAILS
THE SHAPE OF SOUND
Which of these would you name Kiki, and which would you name Boba?
This little experiment taps into a fascinating psychological phenomenon where our brains naturally link sounds to shapes. Softer, rounder sounds like “Boba” tend to feel right with round, bubbly shapes, while sharper, harsher sounds like “Kiki” fit jagged, spiky shapes. It feels like the fluffly, cloud-like shape is Boba and the thundering clouds are Kiki. It is an interesting example of how our senses connect in surprising ways!
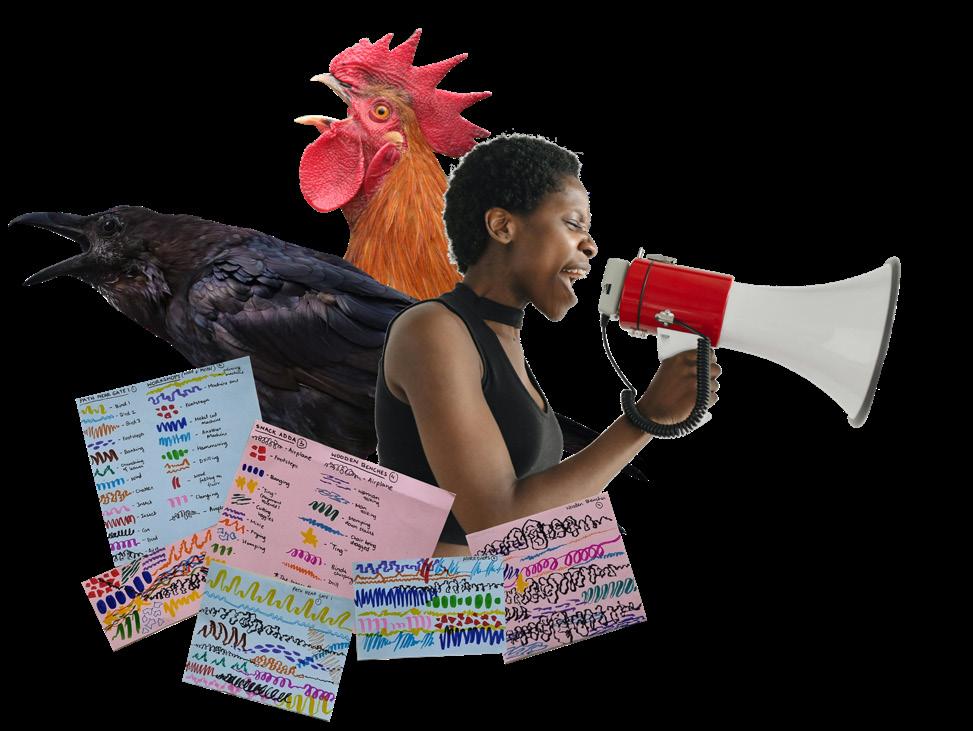
If you could see sound, what would it look like? We explore that question in two ways. One through how you feel and interpret sounds around you, and the other through how sound physically moves in the world.
First, we’ll tune in to our surroundings and draw what we hear: sharp chirps, distant engines, falling rain, translating sound into shape, colour, and feeling. Then we build a simple laser cymatics device to see sound as it vibrates through matter.
By combining both, this activity helps you pay deeper attention to the world around you, not just what you hear, but how it feels, how it behaves, and how it connects people and places
Cymatics: It is the study of sound waves and their visual representations.
MATERIALS REQUIRED:
1. Paper or a small notebook
2. Colored pens, markers, crayons, or pencils
OPTIONAL:
1. A timer or stopwatch
2. Headphones or a sound recorder (if you want to listen back later)
PART 1: DRAW WHAT YOU HEARMAKE YOUR OWN SOUNDSCAPE
Pick a spot. Could be your garden, school playground, your rooftop, a crowded market, or under a tree. Anywhere that sounds interesting. Or even annoyingly noisy, that works too!
Now pause. Just listen. Close your eyes for a minute. What are the loudest sounds? The softest? What direction are they coming from? How far? Which ones are hiding underneath?
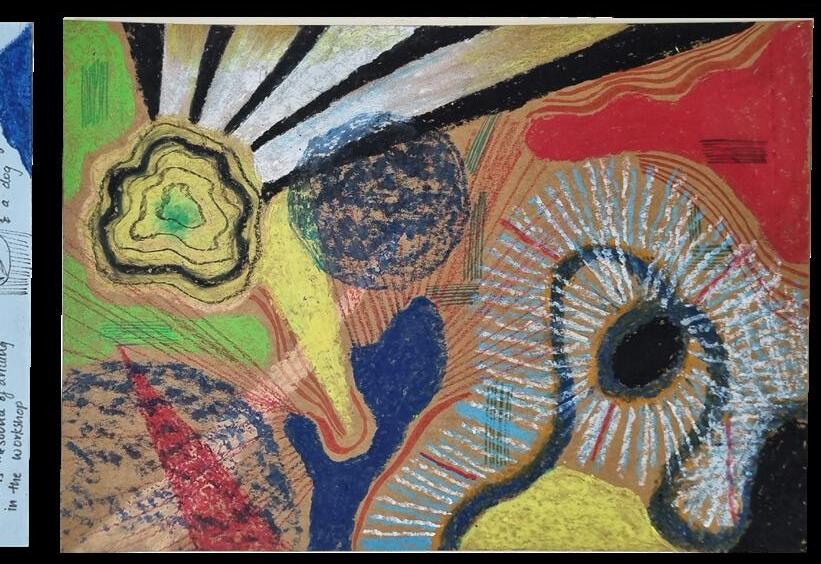
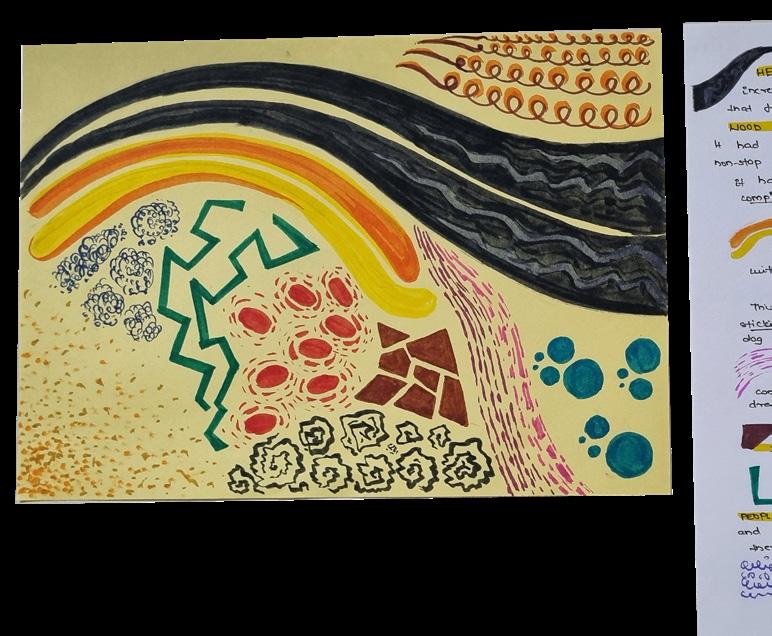
Grab your paper and doodle what you hear - Don’t draw the object, draw the sound.
• A crow’s caw might be a jagged zigzag.
• The wind in the trees could be a swirl of soft green loops.
• A bike bell? Maybe a neat little starburst.
You can invent your own code, like a secret language only you understand.
You could also choose to represent it in space. Maybe you can be the center and you can create a shape in the direction and distance you hear it in, again have fun with it.
Do a quick sound count: How many sounds came from natural things (like birds, wind, rain)?
How many were manmade (horns, engines, phones, announcements)?
No need to be exact, just trust your ears.
Check in with yourself: How did being in that place feel? Chill? Busy? Heavy? Light?
Can you spot any connection between the number of natural sounds vs manmade sounds and your mood? (This isn’t a test, there are no wrong answers. Only vibes.)
Let’s explore: Try the same thing in a different place. Maybe somewhere louder or quieter than the first. Repeat the drawing, the count, and check in on your feelings.
Then look at both soundscapes side by side. What’s different? What surprised you?
PART 2: MAKE SOUND VISIBLE –BUILD YOUR OWN CYMATICS DEVICE
Step 1: Cut a balloon in half and stretch it over one end of your container to make a tight “drum.” Secure it with tape or rubber bands.
MATERIALS REQUIRED:
1. 1 plastic container or cardboard tube (open both ends)
2. 1 balloon
3. 1 small mirror (about 1 cm²)
4. Glue or double-sided tape
5. A laser pointer
6. Rubber bands or strong tape
7. A sturdy base (like a ruler, stick, or paint stirrer)
8. A dark room or shaded space with a blank wall
Psst - a speaker works much better than your voice.
Experiment: Try loud vs. soft sounds, high vs. low pitches, different instruments, humming, screaming, singing your favourite song.
You can also experiment with other aspects of the device. For example: size of jar, tightness of balloon, placement of mirror etc. All these variations will produce different patterns.
Step 2: Stick a small mirror onto the center of the balloon’s surface using glue or tape.
Step 3: Attach your laser pointer on a stick or ruler.
Step 4: Make sure the laser shines at an angle on the mirror. The laser beam should reflect from the mirror onto a blank wall.
Step 5: Turn off the lights (or go to a dimly lit room).
Make a sound - talk, hum, sing, or play music into the tube.
Watch the laser dot dance! The vibrations from your voice or music move the balloon, the mirror moves, and the laser dot makes patterns.
REFLECT:
• Have you heard of synesthesia or onomatopoeia? Both connect our senses in different ways. Synesthesia is when one sense triggers another, like “seeing” colours when hearing music. Onomatopoeia uses words to imitate sounds, like buzz or bang. Metaphors can also connect different senses or ideas. Do your drawings represent or interpret the sounds you hear?
Think about music as something we can both hear and see. Dance, for example, visually expresses music through movement. Audio visualisers also turn sound into moving shapes and patterns. How do you think they work? Could a music video also be considered a form of audio visualisation? Why or why not?
• Let’s think about music as a collection of sounds. We’re constantly visually representing the music we create. Is dance not a visualisation of the music it is choreographed for? How do you think audio visualisers work? Do you think a music video could count as an audio visualisation?
• What do you think creates the patterns in your device? How do changes in volume or pitch affect the shapes that appear? Can you find the resonant frequency, the sound that makes the device vibrate the most strongly? Why does this happen?
For a tube closed at one end, the fundamental frequency can be found using:
Frequency = v / 4L
Where:
v = speed of sound
L = length of the tube or jar
Other resonant frequencies occur at multiples of the fundamental frequency, such as 2F, 3F, and 4F. Try playing both resonant and non-resonant frequencies through a speaker. What differences do you notice?
TAKE IT FURTHER:
Try reversing the activity. Start with a drawing; a mix of shapes, colours, and textures and assign sounds to what you see. Then predict what patterns those sounds would produce in your cymatics device. How accurate were your predictions? How do you think sound affects living things like plants, animals, and people? What would constant exposure to high levels of man-made sound do to a community or an ecosystem?
FOLD AND HOLD
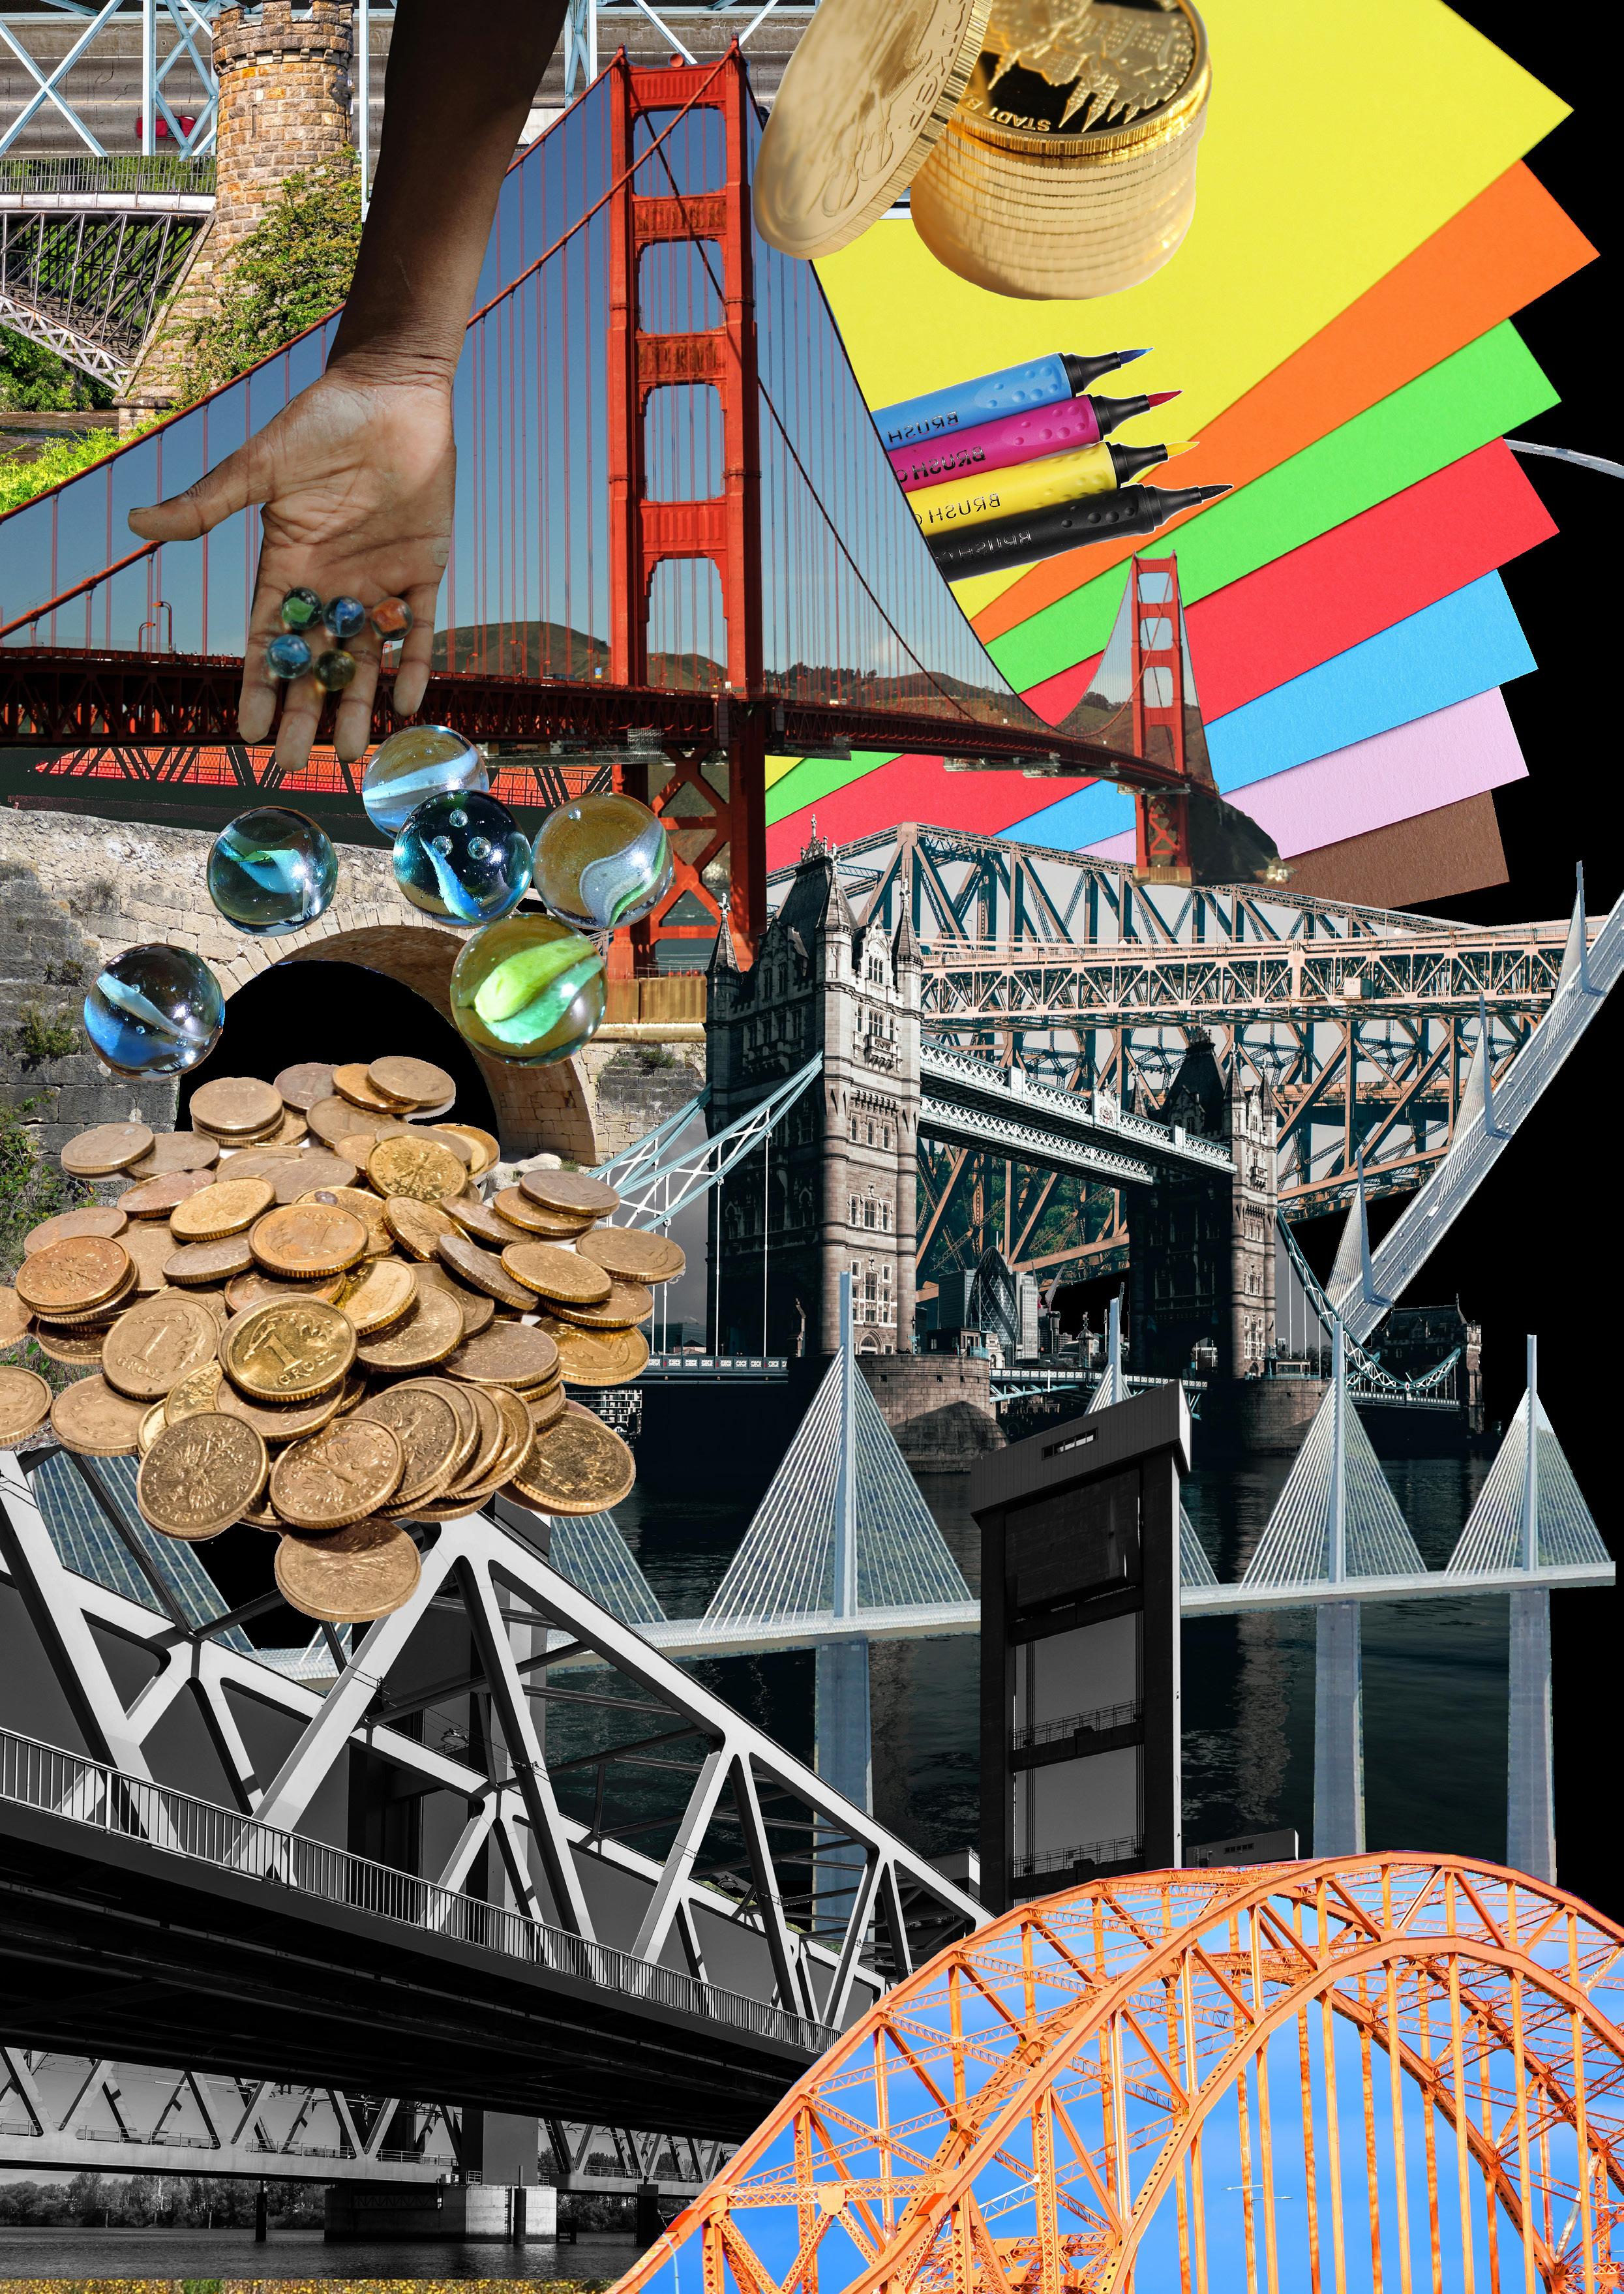
Why do we celebrate bridges? How do they become iconic symbols of a city? Consider the Howrah Bridge in Calcutta, the Golden Gate Bridge in San Francisco, and the Living Root Bridges of Meghalaya. These names are closely linked to the cities and regions they inhabit, often making them a must-visit for tourists. Whether they are simple stone arches or towering steel and concrete structures, bridges represent our ability to create functional designs that also inspire awe.
Are there any bridges in your hometown? What do they connect, and what do they carry? The structure of a bridge depends on the loads it must support. If it’s meant for pedestrians, a simple beam bridge may suffice. If it needs to accommodate both cars and trains, a suspension bridge like the Golden Gate Bridge would be more appropriate. For wide rivers, bridges with cable support, such as the Millau Viaduct in France, the tallest bridge in the world, would be necessary.
Take a moment to observe the shapes present in a bridge. The stability of a bridge is largely influenced by these shapes. Arches, like those in the Pont du Gard in France, are common structural elements. Many bridges incorporate triangular shapes, which are known to effectively redistribute load. Others feature beams supported by columns or are suspended by cables. Every structural component serves a specific purpose, and it is the responsibility of architects and engineers to select designs that offer stability, durability, and aesthetic value.
In this activity, you will create bridges using a material that may seem unlikely for engineering purposes: paper!
Design, engineer, and test your paper bridges to see how well they hold up under load.
MATERIALS REQUIRED:
1. A4 size paper sheets
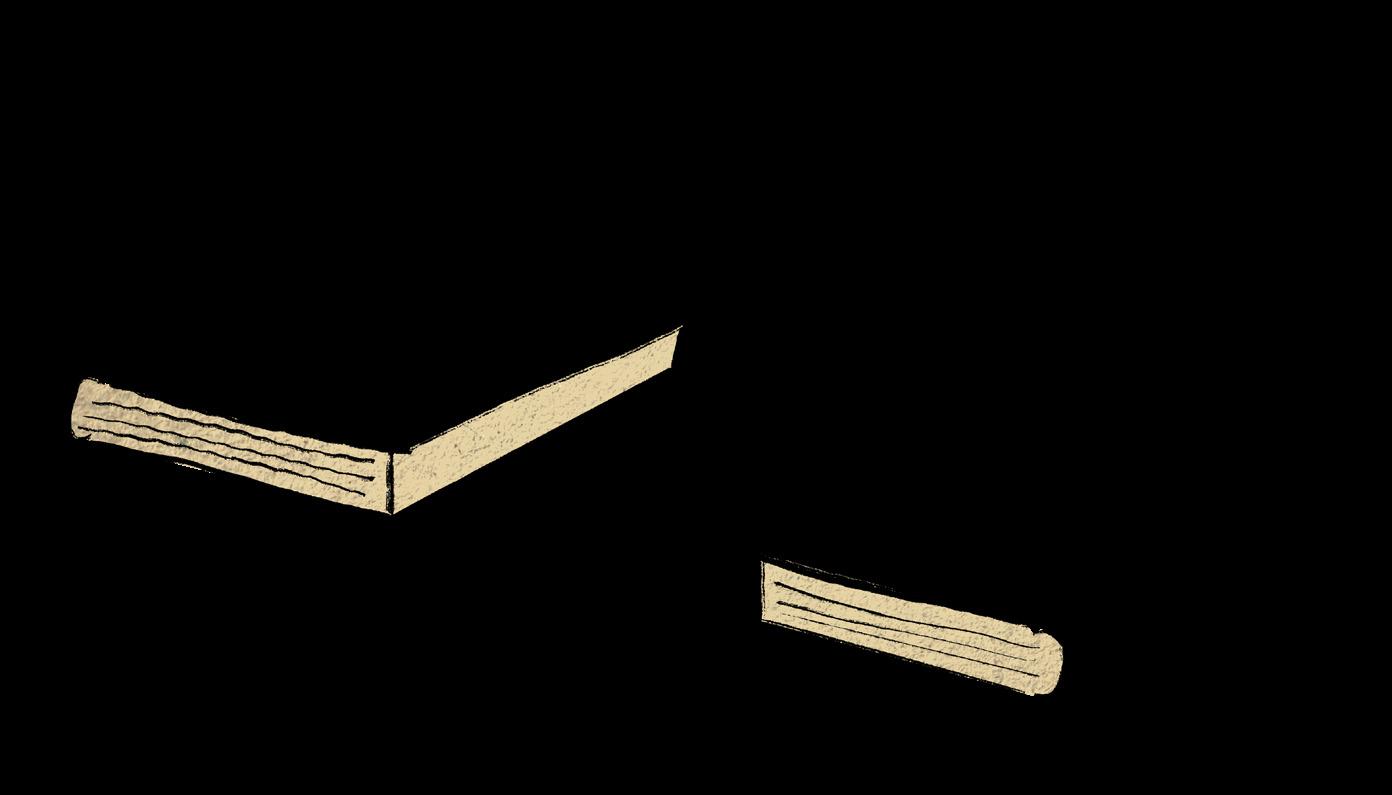
2. A couple of books of similar thickness
3. Small, consistent weights (e.g., coins, marbles, small pebbles)
4. Pencil/pen and paper for notes
5. Optional: Camera/ smartphone for documenting deformation of the bridge
MAKE YOUR OWN PAPER BRIDGES:
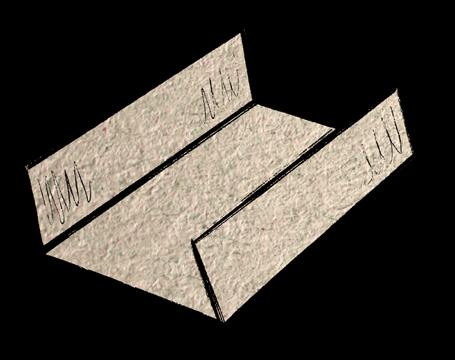
BOAT FOLD
PLEAT FOLDS CRUMPLED PAPER
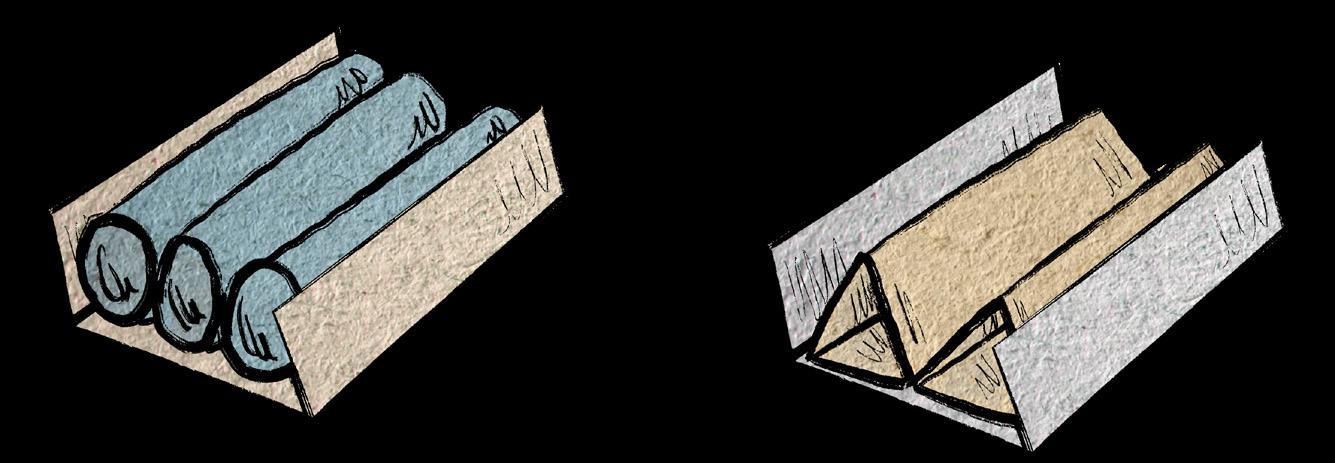
SIMPLE CYLINDER
PRISM FOLD
Step 3: Test each fold in order. Lay the folded paper across the distance so both ends rest on the books with at least half its length unsupported in the middle.
Step 4: Add weights one at a time to the centre of the bridge. Add them slowly and watch what happens after each one.
Step 5: Record the failure point. When the bridge deforms (bends, buckles, or collapses), note how many weights it held. Where did the deformation start? Was it at the centre, near the supports, or along the sides?
Step 6: Fill in your table below. Repeat for all five folds. Use the same coin as your unit of weight throughout. Coin type: _____________
Distance between books: _____________ cm
Paper weight used: _____________
Step 7: Build multi-element bridges. Make two or three copies of each fold (cylinder, prism, crumpled ball). Arrange them side by side across the distance between the books to create a wider bridge. Test how much weight each type of bridge holds.
Experiment with combinations. Try mixing different elements — a cylinder paired with pleats, or prisms next to crumpled paper. Which holds the most? Can you explain why?
REFLECT:
• Which fold held the most weight? Which failed first? Does the answer surprise you?
• Look at the type of deformation in each case. What structural weakness does each failure mode reveal?
• When you combined elements, did the total strength increase in a predictable way? Why or why not?
• Bridges can both connect and divide. While constructing bridges over rivers and valleys poses risks of ecological and environmental harm, they can also be designed to accommodate nature. For example, the NH44 highway in India includes nine underpasses within Pench National Park to ensure the safe passage of tigers and other animals. Think of a bridge in your hometown — what are its benefits and drawbacks?
• Humans are not the only bridge-builders. Army ants create bridges with their own bodies to help others cross. The roots of large trees can grow to create bridges, like the Living Root Bridges in Meghalaya. Can you think of other nature-inspired structures around you?
DATA DIALOGUES
“No place is a place until things that have happened are remembered in history, ballads, yarns, legends, or monuments.”
–
Wallace Stegner, “The Sense of Place,” 1983
Every place has a story—or many stories—to tell. Have you ever stopped to listen? Some stories are shared as epic ballads, while others are whispered as bedtime stories. Some flow through proverbs, riddles, or the steps of a wedding dance. They can even be stitched into local crafts or woven into the rhythms of work songs. We create stories to mark the passage of time, revisiting them through social practices, rituals and festive events. This is how the collective memory of a community lives on.
These stories are like hidden gems, and collecting and preserving them is essential to valuing the uniqueness of our local culture and identities. Why don’t we go on a treasure hunt for these gems in our own areas, record them, and preserve them? You might be imagining surveys and spreadsheets (yawn), but don’t worry! While we collect and organise information, we can do it in a more creative way.
What if we approached data differently? Giorgia Lupi and Stefanie Posavec, two talented information designers, saw data as a form of creative expression. Over the course of a year, they chose small everyday themes, like the animals they spotted, the drinks they enjoyed, or even the “sorrys” they said. They created handdrawn visualisations of their data on postcards and sent them to each other. What began as a way to get to know each other turned into a project about self-discovery and a fresh perspective of the world. It was slow, personal and meaningful.
So, let’s collect, record and visualise the cultural richness of our localities in a fun, retro way! Find your “datapal”. Agree on what to observe together and start exchanging your handmade data stories!
REQUIRED:
1. Postcards and stamps
2. Datapal’s address
3. Pen
4. Colour pencils/crayons/ sketches
MAKE YOUR OWN DATA POSTCARDS:
Step 1: Find a datapal
Get a partner on board to collect data with you. Your datapal can be someone from another city, state, or country and exchange mailing addresses.
Step 2: Pick a weekly theme
Here are some themes that you can explore -
1. Culture on the Wall - Street art, posters, murals.
2. Cultural Richness - Local GLAM (Galleries, Libraries, Archives and Museums) spaces.
3. Cultural Knowledge - Who around you learns or teaches an art form? Where? Why?
A good way to start is by asking, “What do I want to know and explore?”. You can discuss this with your datapal and choose one theme on a weekly basis.
Step 3: Start noticing
Imagine you chose to observe the different cultural forms you encounter in your everyday life. This is a theme with broader aspects, so what aspect will you notice and record? For that you can ask yourself further questions. This will bring clarity on what data you want to collect.
• What are the different types of cultural forms?
• What is the medium of delivery (performance, craft, mural)?
• What are the themes portrayed in these forms?
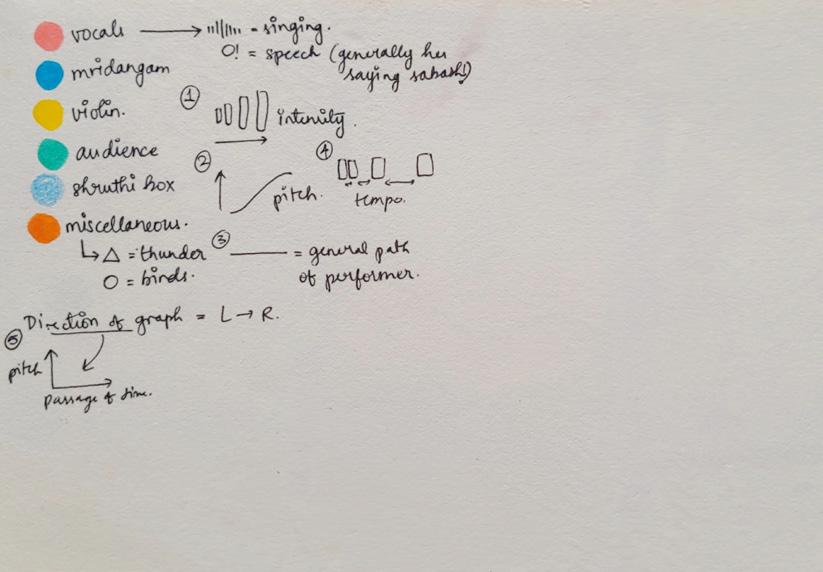
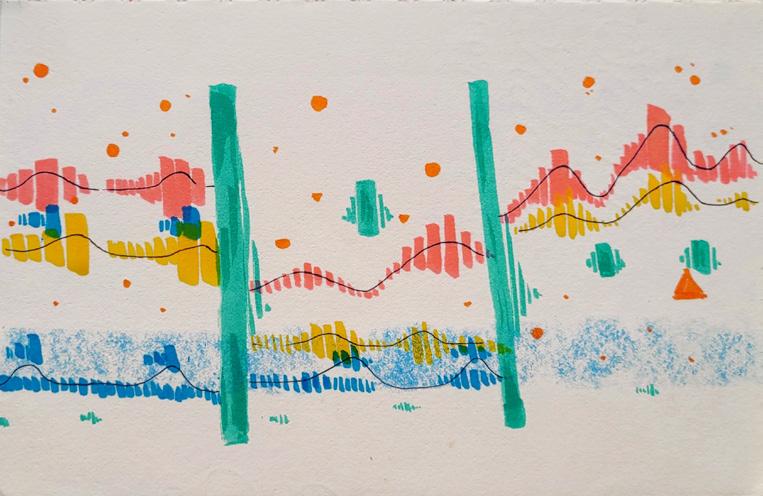
On the right is an example of a data visualisation done during a musical concert. Look at the different aspects of the performance that was noticed and noted. Go ahead and explore different avenues for collecting data!
Step 4: Log data in real time
Observe in real time and note down on a piece of paper or your mobile phone, as narratives or a table. Make sure that all your observations answer your sub-question. Observed something interesting other than answers to the usual questions? Write it down with a special ink pen or with an asterisk! Don’t leave out anything.
Step 5: “You and data” time
Sit with your data and tally your observations. Colour-code categories and sort the data in different ways. As you observe closely, look for trends and rarities. Highlight any patterns you discover!
Step 6: Data to stories
What story do you want to tell with your data? How do you envision this data telling your story? Use shapes like squares, triangles, or even unique designs to represent categories. Arrange these categories chronologically, rankwise or geographically.
Step 7: Time for the legend
Make a personal legend indicating the meaning of colour, shape and everything you visualised. These are your rules on how to read data. This legend can go on the back side of your postcard.
Finally, draw your data visualisation on the front of the postcard and post it! Encourage your datapal to try out this activity and send you a postcard as well!
TAKE IT FURTHER:
• The Million Wells for Bengaluru campaign is an initiative to build one million shallow wells to replenish the city’s water table. The project partnered with the Manu Vaddar community, who have been digging wells across India for over a thousand years. It also partnered with Art in Transit, a public art initiative, to create a large mural at Cubbon Park Metro station using mud from 65 recharge wells dug in the park itself. The mural tells the story of Bengaluru’s water. Are there heritage-based solutions in your area that address current challenges?
• We are living in the age of big data! Every time we scroll, click, stream, shop, or even walk with GPS on, we are generating data or leaving data traces. From cookies to instagram algorithms, the data generated is being collected as well. Where does it all go? Have you heard of “cloud storage”? Are they really “up there”? Explore where is data stored and managed, and at what cost (economic, environmental, social)?
REFLECT:
After this activity, has your relationship with data visualisation changed?
1. Is the data you collected truly neutral? Did your postcard communicate the data as it was, or did it tell only one version of the story?
2. How have your personal biases, like what you chose to notice, shaped your records?
3. How did your datapal respond to your data story? Did they read it the way you intended, or did they notice something different?
Note: Give data to the data! There is plenty of information available out there. Make connections and match the data. Be mindful of biases in data collection, including inclusions/exclusions and missing data. Also, situate your data in space and time; when and where did you collect it?
BIG TROUBLE IN LITTLE CITY
Cities have existed for thousands of years. The earliest communities formed when people began cultivating crops along fertile waterways such as the Nile, the Indus, and the Huang He. Over time, cities have risen and fallen due to the strains of war and disease. Some have completely disappeared, such as the ancient cities of Mesopotamia, while others, like Rome, have seen significant population declines. However, a few have continued to grow, eventually evolving into today’s megacities, like Tokyo.
The vast metropolises we now know are a relatively recent phenomenon. In the 1800s, only about 10% of the world’s population lived in urban areas. Today, more than half of the world’s population lives in cities, and this figure is projected to reach twothirds by 2050. What do you think has driven this migration?
Cities expand when people move in for better job opportunities or access to education. However, rapid urbanisation comes with challenges. Housing, infrastructure, healthcare, and sanitation need to develop at the pace of incoming migrants. For example, Bengaluru’s population exploded in the early 2000s, and the city has struggled to keep up ever since. This growth has put immense pressure on public services, shrunk green spaces, caused city-wide traffic jams, and led to a growing water crisis.
Life in cities can also be affected by global issues. Climate change is causing sea levels to rise, threatening coastal cities like Dhaka, Mumbai, and Shanghai. Additionally, cities worldwide are grappling with rising temperatures due to global warming.
Feeling overwhelmed by all this bad news? Studies indicate that stress levels and mental health issues are also higher among city-dwellers.
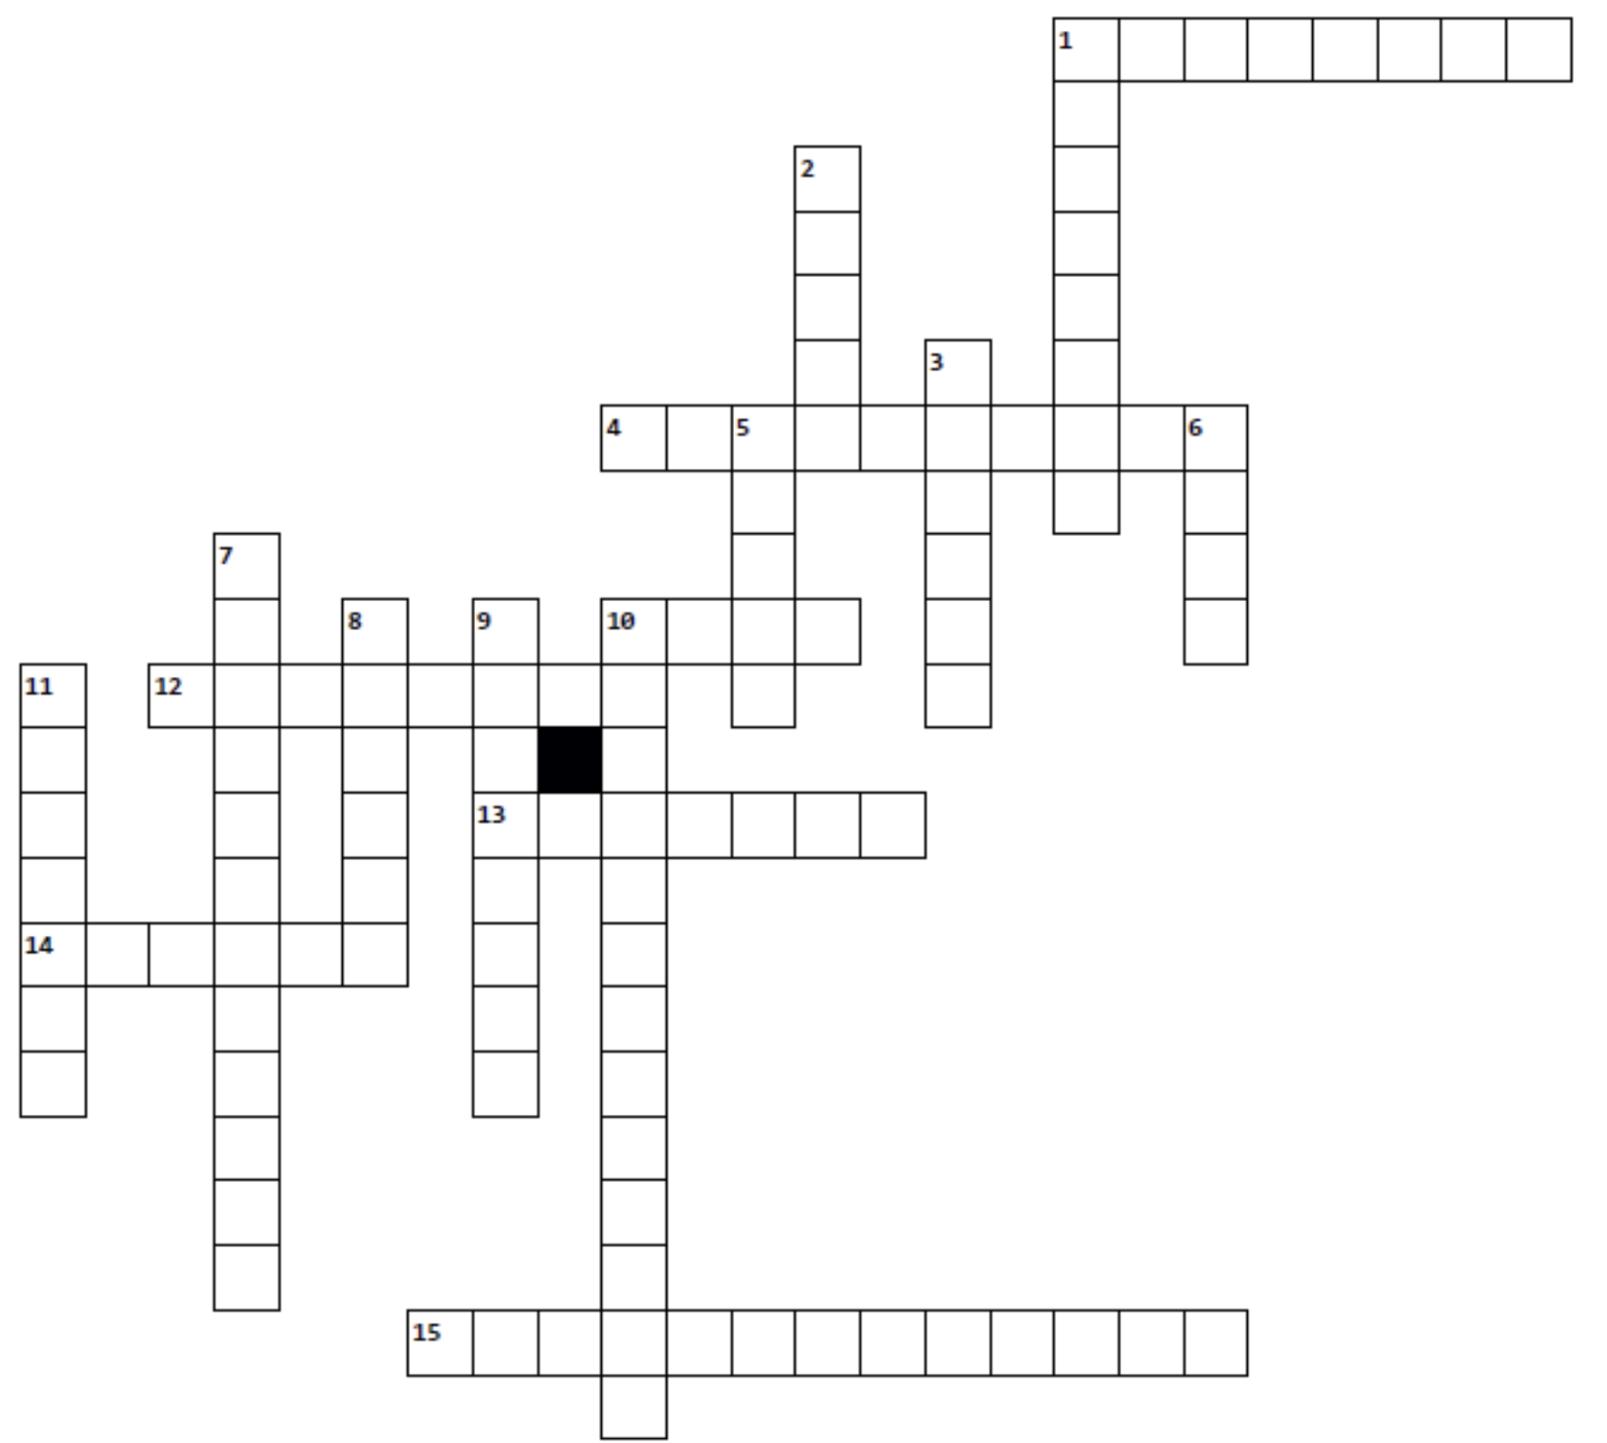
So, pause and take a deep breath. Feeling a bit better? Now let’s tackle a quick crossword and think about the challenges our cities face, one clue at a time.
In this crossword, fill in chains of letters to explore the myriad challenges a city faces.
1 Craters on the road (8)
2 What Batman fights to stop in Gotham City (5)
3 A group of puppies…or rubbish on the streets (6)
5 A not-so-silent killer (5)
6 City’s smoky foggy blanket (4)
9 Where your trash’s journey ends (8)
10 A vanishing act in forests (13)
11 What a buildup of vehicles creates (7)
1 When it’s lights out before bedtime (8)
4 Involuntary solitude (10)
10 It hangs in the air and in every breath. (4)
12 When the city is too hot to handle (8)
13 An extreme dry spell (7)
14 A city submerged (5)
15 Key factor in accessible housing (13)
7 Too many people, too little space (12)
8 Mental tension that wears you down (6)
REFLECT:
While solving the crossword, you might have noticed some problems that affect your city or hometown. Think about why these issues exist, and what policies have been enacted or can be enacted by your local authorities to solve them. Think about how you can get involved at an individual level as well.
Sustainability is a concept wherein a population’s present needs are addressed without compromising the future generations’ quality of life. This practice encourages government and municipal decision-makers to give equal consideration for the progression of both present and future generations as they plan new communities.
Are the policies and solutions you envisioned for your city’s problems sustainable in the long run?
DEAR _____,
Is the neighbourhood you see today the same as it was two years ago? Five years ago? Ten? While we can’t travel back in time, we can talk to those who have lived here longer, like our grandparents, neighbours and parents, to learn how much has changed.
Urbanisation has reshaped many parts of Karnataka. In Bengaluru, once called the “City of Lakes,” several lakes have disappeared, replaced by buildings and roads. Green spaces have given way to concrete, and traffic fills the once-quiet streets. People’s lives have been changing too, how they move, where they gather, how they celebrate, and how they connect with one another. Some changes bring comfort while others come with loss.
Humans are observers and storytellers. We understand the world by noticing changes, and we have an instinct to leave a mark, to be seen and remembered. From cave art to the Voyager Golden Record, we’ve always recorded our place in time.
By observing and reflecting on changes in our uru, we begin to understand its story. Its past, present, and future. In this activity, you will listen to those who have seen their neighbourhood change, reflect on what has shifted, and write a letter to your uru.
MATERIALS REQUIRED:
1. Pen
2. Print outs of interview sheet
3. Colour pencils/crayons/ sketchpens (optional)
4. Empty paper
5. Letter envelope
INSTRUCTIONS:
Step 1: Find someone who has lived in your neighbourhood longer than you, this could be a parent, grandparent, or neighbour.
Step 2: Print out the interview sheet or copy the questions in a notebook.
Step 3: Interview each person you chose and have a conversation about how the neighbourhood has changed over time.
Step 4: Take some time afterward to reflect on what you learnt and how it made you feel.
Tips as you interview people:
1. Listen with an open mind and follow their stories.
2. Jot down phrases or sketch little scenes as they speak.
3. If a question sparks more ideas, feel free to dive deeper!
Step 5: Write a letter to your uru. You can personify it and speak to it like a friend or simply share your memories, thoughts and hopes for its future.
Step 6: Place your letter in an envelope and write a date 20 years from now on it; when you will open and read it again.
TAKE IT FURTHER:
Visualise the change:
1. Draw your neighborhood as it looks today, using drawings or photos.
2. On a separate sheet, illustrate what it looked like in the past. Glue it on top, attaching only the top edge so it can lift like a flap.
3. Add a final layer showing how you imagine it in the future.
Ask your interviewees to write a letter to the future to include with your project.
REFERENCES
Baraniuk, Chris. 2017. “The Animals Thriving in the Anthropocene.” BBC Future, August 1, 2017
Read, Stuart. “Peppered Moth and Natural Selection.” Butterfly Conservation. Accessed August 8, 2025.
Padma, T.V. 2024. “Urban Expansion Drives Forest Loss in India’s Biodiversity Hotspots.” Mongabay India, September 2024.
Sridharan, Bhanu. n.d. "Biodiversity in Bengaluru: A Manual for Scientists Communicating with Journalists". Produced by Mongabay India and Citizen Matters; with support from Bengaluru Sustainability Forum. PDF. Accessed August 8, 2025.
Padma, T.V. 2024. “Urban Expansion Drives Forest Loss in India’s Biodiversity Hotspots.” Mongabay India, September 2024.
Kleon, Austin. 2020. “How to make a zine from a single sheet of paper” Youtube video, 1:58, Published March 4, 2020.
Barnosky, Anthony, and Mary Ellen Hannibal. 2024. “Despite Official Vote, the Evidence of the Anthropocene Is Clear.” Yale Environment 360, April 2, 2024.
Needleman, B. A. 2013. “What Are Soils?” Nature Education Knowledge 4 (3): 2.
EBSCO. 2024. “Winogradsky Column”. EBSCO Research Starters. Accessed August 3, 2025.
Smithsonian National Museum of Natural History. n.d. “Early Life on Earth – Animal Origins.” Smithsonian Institution.
Harvard Museum of Natural History. 2021. “Specimen Spotlight-Winogradsky”. Youtube video, 3:30. Published Feb 8, 2021.
Daza, B.X.D., Mendoza, A.J.D., Zambrano, J.J.Z., Aransiola, S.A., Maddela, N.R. 2024. “Effects of Soil Contaminants on Soil Microbiome.” In Soil Microbiome in Green Technology Sustainability. edited by S. A. Aransiola, H. I. Atta, and N. R. Maddela. Cham: Springer.
United Nations Environment Programme (UNEP). 2024. Global Waste Management Outlook 2024: Beyond an Age of Waste – Turning Rubbish into a Resource, Executive Summary.
Gómez-Sanabria, Adriana. 2024. “Transforming Waste into a Valuable Resource.” IIASA Blog, March 30, 2024. International Institute for Applied Systems Analysis. Accessed August 7, 2025.
Circularise. 2023. “R-Strategies for a Circular Economy.” Circularise Blogs, November 9, 2023 Accessed August 19, 2025.
Lakra, Parul, Sunil Kumar Saini, and Ankita Saini. 2022. “Synthesis, Physio-Chemical Analysis and Applications of Bio-Enzymes Based on Fruit and Vegetable Peels.” Journal of Emerging Technologies and Innovative Research (JETIR) 9
Rungta, Shivangi, Anupama Ojha, and Sarad Kumar Mishra. 2022. “Study of PhysicoChemical Property of Bioenzymes Produced from Organic Household Waste and Their Application in Daily Life.” Discovery 58 (315): 228–34.
Wikipedia Tactile paving
The Huntington Library, Art Museum, and Botanical Gardens. n.d. “Leaves.” The Huntington.
TEDx Talks.Stefan Behling.2016. “Architecture and the Science of the Senses ” Youtube video, 15:51. Published Jun 30, 2016.
Deborah Silver & Co. 2012. “Garden Designer’s Roundtable: Speaking of Texture.” Blog post, June 26, 2012. Deborah Silver & Co.
Labvanced. 2024. “The Bouba-Kiki Effect and Task: Insights on its Role in Research.” Labvanced Blog. November.
Stanford University. 2018. “Learning through Sound.” Stanford News, July 2, 2018. Updated.
Mabry, Nehemiah. 2020. “Every Bridge for Every Situation, Explained by an Engineer.” YouTube video, 24:09. Published Nov 18, 2020.
Murtezaoglu, Ilayda. 2025. “The Evolution of Arches: From Ancient Engineering to Modern Design.” Parametric Architecture, March 16, 2025. Accessed August 6, 2025.
Feniak, Hannah. 2024. “Triple Threat Design: Triangles Are Trending in AwardWinning Architecture.” Architizer Journal. Accessed August 6, 2025.
Li, Qi, Rui Qian, Junfeng Gao, and Jiacong Huang. 2022. “Environmental Impacts and Risks of Bridges and Tunnels across Lakes: An Overview.” Journal of Environmental Management 319.
Vaidyanathan, Gayathri. 2019. “India’s Tigers Seem to Be a Massive Success Story — Many Scientists Aren’t Sure.” Nature 574 (7780): 612–16.
Md. Abdul Fattah, Syed Riad Morshed, Gitisree Biswas, Md. Nazmul Haque, Saifullah Bin Ansar, Md. Mojammel Hoque, Fahmida Yeasmin Sami, Asma Amin Rimi. 2021. “Socioeconomic and environmental impacts of bridge construction: evidence from the Khan Jahan Ali Bridge, Khulna, Bangladesh.” International Journal of Social Economics; 48 (8): 1121–1138.
Kelly, Morgan. 2015. “Ants Build ‘Living’ Bridges with Their Bodies, Speak Volumes about Group Intelligence.” Princeton University News, November 30, 2015.
The Engineering Hub. 2022. “Structural Shapes Ranked and Reviewed – Which One Wins?” YouTube video, 14:13. May 21, 2022.
UNESCO. “Culture.” UNESCO. Accessed August 19, 2025.
Giorgia Lupi and Stefanie Posavec. 2016. Dear Data. New York: Princeton Architectural Press.
UNESCO World Heritage Centre. 2021. “Improving Water Availability and Sustainability by Reviving Traditional Water Systems in Bengaluru (India).” World Heritage Canopy: Heritage Solutions for Sustainable Futures, UNESCO World Heritage Centre, 2021. Accessed August 14, 2025.
Etter Elena. 2023. “Data Visualization: A Subjective Lens on Reality.” Nightingale, June 2, 2023. Accessed August 19, 2025.
National Geographic Society. 2025. “The History of Cities.” National Geographic Education. Last updated May 29, 2025.
World Population Review. 2025. “Bangalore Population 2025.” World Population Review.
NRDC. 2018. “Bangladesh: A Country Underwater, a Culture on the Move.” Edited by Jenny Shalant. Photographs by Frank Sedlar and Martin Szczepanski. NRDC. Accessed August 11, 2025.
Lu, Denise, and Christopher Flavelle. 2019. “Rising Sea Levels Pose Risk to Three Times More People Than Originally Thought, Research Shows.” The Independent, October 30, 2019.
Harvey, Lex. 2024. “The World’s Biggest Capital Cities Are Heating Up – and Asia Tops the Charts.” CNN, June 27, 2024.
Beil, Kurt, and Douglas Hanes. 2013. “The Influence of Urban Natural and Built Environments on Physiological and Psychological Measures of Stress—A Pilot Study.” International Journal of Environmental Research and Public Health 10 (4): 1250–1267.
Higgins, Joan. n.d. “Sustainable Urban Development.” Green City Times. Accessed August 10, 2025.
Hansell, A., Y. S. Cai, and J. Gulliver. 2017. “Environmental Impacts of Road Vehicles: Past, Present and Future.” In Environmental Impacts of Road Vehicles: Past, Present and Future, edited by R. M. Harrison and R. E. Hester, 107–32. Cambridge: The Royal Society of Chemistry.
Paliath, Shreehari. Indiaspend “Unplanned Urbanisation Has Affected Bengaluru’s Vegetation Cover And Water Bodies.” IndiaSpend Interviews, March 25, 2024.
The Writing Barn. 2023. “The Art of Observation.”
Wikipedia. “Voyager Golden Record.” Accessed [Last modified 10 September 2025].
Letters to the Future. 2021 “Gallery.”
Mahesh, Rohini. “Dear Bengaluru: A Love Letter to My City.” Medium, 2025.
Images from Pexels, Pixabay, and Sci560 Mediators.