TRENDS


SC Department of Employment and Workforce Labor Market Information Division Columbia, South Carolina 29202 july 2023 Issue South Carolina Data

2
South Carolina Substate Long-Term Employment Projections (2020-2030) By Ashlyn Chastain – Workforce Insights Analyst . . . . . . . . . . . . . . . . . . . . . . . . . . . . . . . . . 4 South Carolina’s Employment Situation (July 2023) . . . . . . . . . . . . . . . . . . . . . . . . . . . . . . . 8 Local Area Unemployment Statistics . . . . . . . . . . . . . . . . . . . . . . . . . . . . . . . . . . . . . . . . . . . . . 10 Current Employment Statistics — Seasonally Adjusted . . . . . . . . . . . . . . . . . . . . . . . . . . 16 Current Employment Statistics — Not Seasonally Adjusted . . . . . . . . . . . . . . . . . . . . . 18 Long-Run Trends 28 Technical Notes 30 Interested in receiving the latest issue of Trends in your inbox every month? Click here to subscribe to our Trends mailing list!
AT A GLANCE
NOTE FROM THE DIRECTOR
What metro area has seen the largest wage growth in the past year? Turn to page 20 …

On August 30, Gov Henry McMaster announced September as Workforce Development Month What does that mean for South Carolina? For one, there will be dozens of events all over the state connecting employers and jobseekers and equipping community organizations with the tools they need to better understand the local labor market The Career Coach will be rolling out for two weeks of SC@Work: Road Trips serving rural communities And on September 19, Williams-Brice Stadium will host the Workforce Development Symposium, hosted by the South Carolina Chamber of Commerce You’ll hear from Gov McMaster, Director Floyd, and many other esteemed panelists – and the LMI team, talking about how data can work for you and your business
This month, our featured article by Ashlyn Chastain is about our recently developed 2030 regional employment projections Earlier this summer, LMI staff produced these long-term projections by industry and occupation for each of the state’s twelve local workforce development areas We don’t have a crystal ball, of course; these are just our best guess, given overall economic trends and changes in labor market dynamics for certain types of firms and workers. Ashlyn’s piece provides some great insights, but if you want to dig into the raw data for yourself, you can find it on our LMI website here
If you’ve got questions about employment and workforce data, shoot us a line anytime at lmicustomerservice@ dew.sc.gov
 Bryan P Grady, Ph D Assistant Executive Director for Labor Market Information SC Department of Employment and Workforce

3
South Carolina Substate Long-Term Employment Projections (2020-2030
By Ashlyn Chastain – Workforce
Insights Analyst
The Labor Market Information Division (LMI) is responsible for crafting and publicly distributing ten-year employment projections Diverse stakeholders, including educational institutions, entrepreneurial ventures, economists, and business consultants, can make use of the projections to gain future-facing insights for specific industries or occupations. These forecasts can aid in the development of business proposals, workforce development strategies, new academic and training curriculum, and a host of other efforts that rely on a strong understanding of the coming labor market LMI, to generate these predictions, utilizes historical employment trends and rigorous statistical models to estimate the total employment within major industry classifications and occupational categories.
Two primary outputs of the analysis are the net change in jobs and percentage shifts for an industry and occupational group The former indicates whether job opportunities or employment levels are increasing or decreasing, while the latter provides insight into the pace of growth in industries and occupations over a decade
The state is divided into 12 Workforce Development Areas (WDAs), and each of these areas has unique characteristics that concentrate workers in one industry or job type These concentrations represent a complex interplay of geographic factors and economic conditions. For instance, the WDAs located along the coast tend to see significant growth in the Accommodation and Food Services industry Similarly, regions known for proactively increasing their housing capacity to meet rising demand, such as Greenville, are currently experiencing substantial growth in fields related to Administrative Support, Waste Management, and Remediation Services Additionally, when examining the entire state, South Carolina will continue to see pronounced growth in the Health Care and Social Assistance industry sector. This projection can be attributed to the sizable influx of migrants relocating to the south for retirement, driven by the cost-of-living differential and other favorable environmental factors
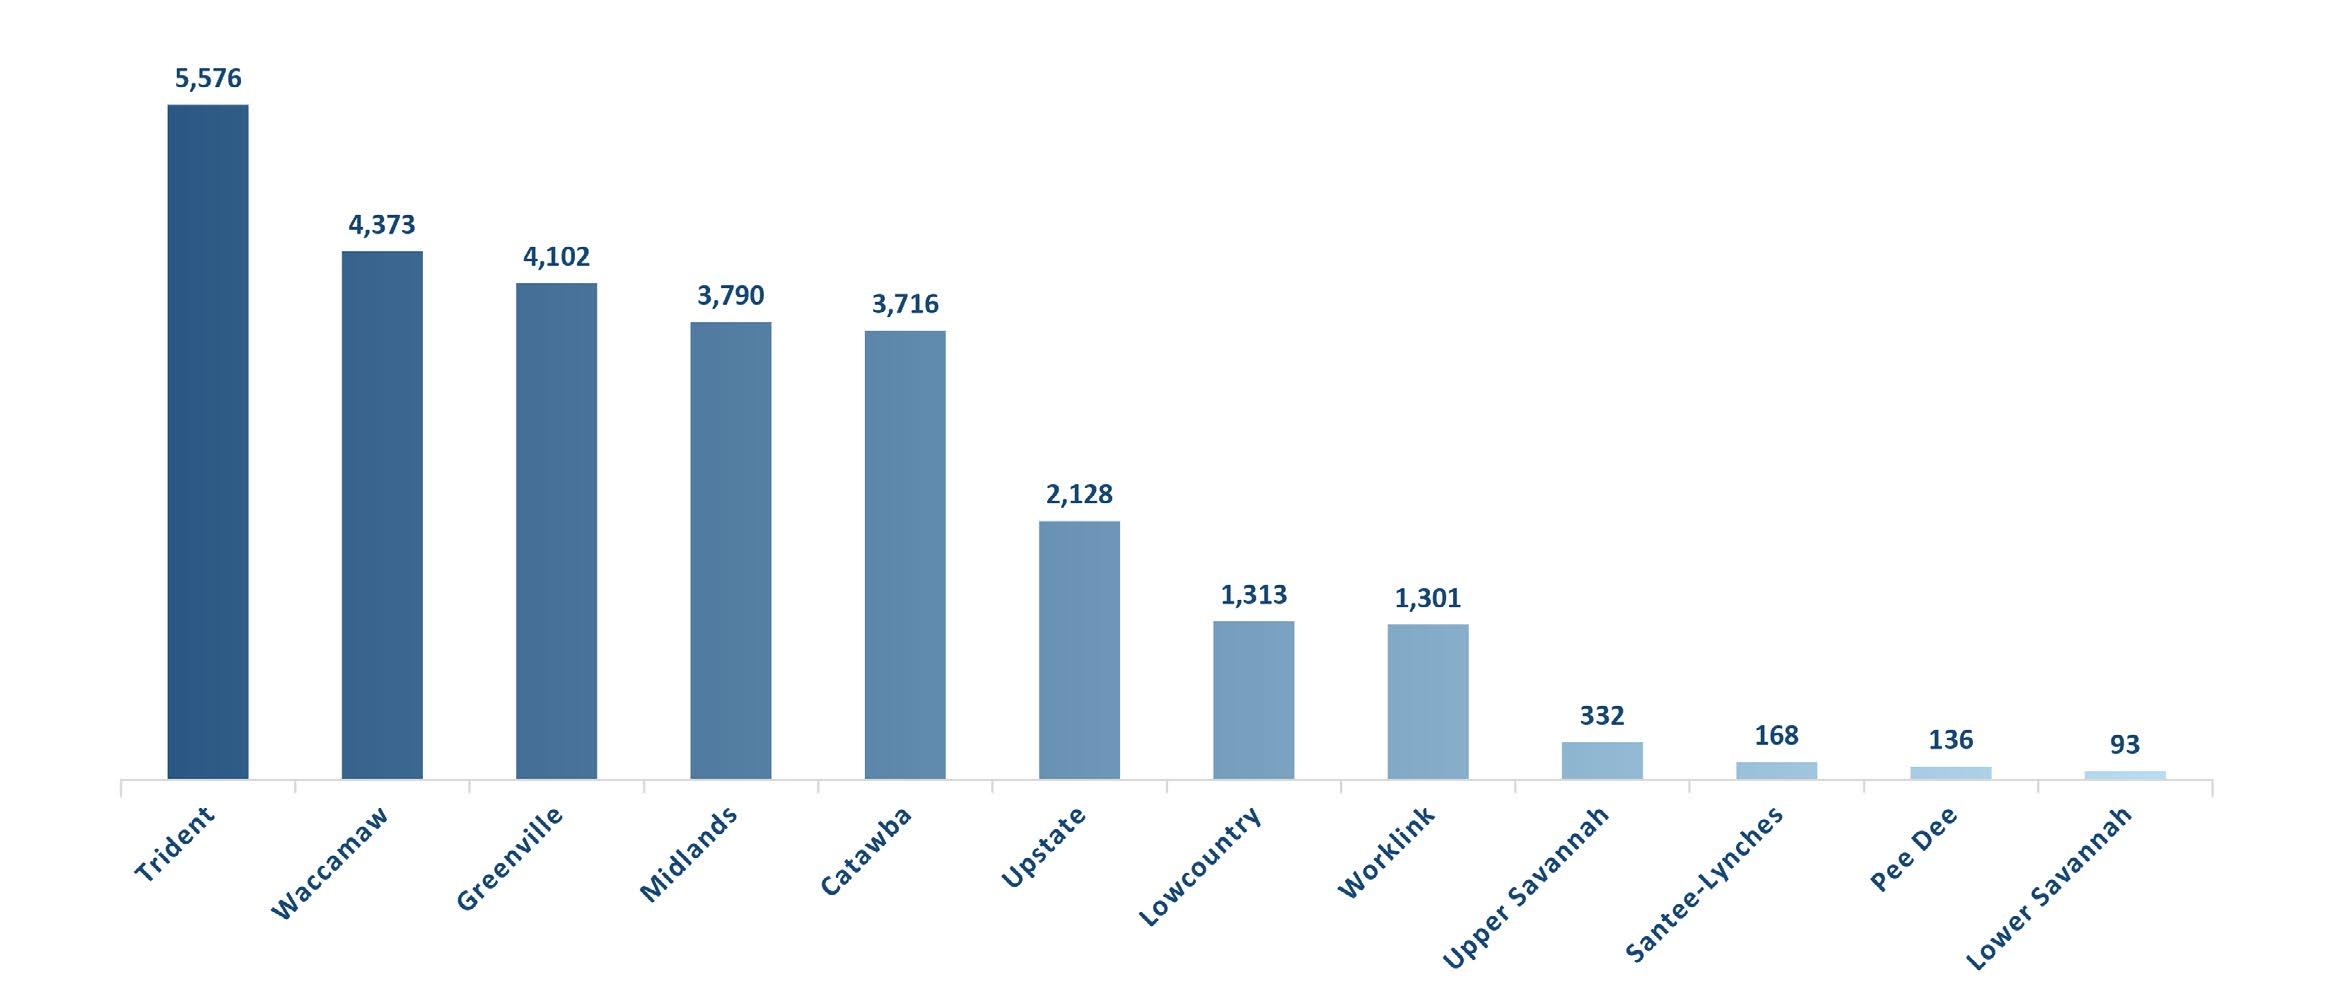
Among all the regions, the biggest gains are predicted for the Trident This region anticipates an increase of 5,576 jobs, translating to a surge of 20 6 percent Following closely, the Waccamaw region stands out with a projected addition of 4,373 jobs, an increase of 16 2 percent A display of projected annual employment changes across all WDAs is provided in Figure 1 .
4 SC Department of Employment and Workforce Labor Market Information Division Columbia, South Carolina 29202
FIGURE 1: PROJECTED ANNUAL EMPLOYMENT GAIN BY WDA (2020-2030)
TABLE 1
2 WORKFORCE DEVELOPMENT AREA
Presented in Table 1 is a tabulation of the annual growth rates across all WDAs for the period spanning from 2020 to 2030 Topping this list with an annual growth of 2 29 percent is the Catawba WDA, which covers the counties of York, Chester, and Lancaster . However, it is important to acknowledge that while Catawba demonstrates significant annual growth in percentage terms, it falls near the middle for the number of jobs added, as can be observed in the previous chart
The second highest annual growth rate belongs to the Waccamaw WDA, situated along the state's coastline and encompassing the counties of Georgetown, Horry, and Williamsburg
In Table 2 (below) shows the projected employment for the top industry (by jobs) within the state and for each region
dew.sc.gov scworkforceinfo.com 5
WORKFORCE DEVELOPMENT AREA ANNUAL GROWTH RATE Catawba 2 29% Waccamaw 2 28% Trident 1 41% Greenville 1 .34% Lowcountry 1 24% Upstate 1 .07% Midlands 0 98% Worklink 0 74% Upper Savannah 0 38% Santee-Lynches 0 24% Pee Dee 0 10% Lower Savannah 0 08%
INDUSTRY PROJECTED
South Carolina Health Care and Social Assistance 299,950 Catawba Manufacturing 21,403 Greenville Administrative Support and Waste Management and Remediation Services 45,223 Lowcountry Accommodation and Food Services 16,015 Lower Savannah Manufacturing 16,525 Midlands Health Care and Social Assistance 54,345 Pee Dee Health Care and Social Assistance 24,378 Santee-Lynches Health Care and Social Assistance 12,598 Trident Accommodation and Food Services 47,118 Upper Savannah Manufacturing 21,456 Upstate Manufacturing 45,396 Waccamaw Accommodation and Food Services 42,369 Worklink Manufacturing 27,017
TABLE
EMPLOYMENT
The fastest projected annual growth for industries is based on sectors (the 2-digit level of the North American Industry Classification System), but industry subsectors (the 3-digit level) and groups (the 4-digit level) can also be analyzed for comparison on our dashboards. Industry subsectors are particularly well-suited for stakeholders seeking a detailed examination of a specific industry, while sectors offer a broader perspective Going in the other direction, sectors can be aggregated into two even broader domains, classifying them as either Goods-Producing or Service-Providing
Table 3 brings into focus the sectors that are expected to experience the fastest growth in each WDA over the span of a decade The results reveal a significant positive shift in the Arts, Entertainment, and Recreation industry sector. This is evident from its achievement of the highest growth rate in five out of the twelve designated geographical areas; it also holds the top position statewide.

SC Department of Employment and Workforce Labor Market Information Division Columbia, South Carolina 29202
TABLE 3 WORKFORCE DEVELOPMENT AREA INDUSTRY GROWTH RATE South Carolina Arts, Entertainment, and Recreation 2.42% Catawba Administrative Support and Waste Management and Remediation Services 3 42% Greenville Arts, Entertainment, and Recreation 2 95% Lowcountry Information 2 62% Lower Savannah Arts, Entertainment, and Recreation 3 50% Midlands Health Care and Social Assistance 2 .21% Pee Dee Arts, Entertainment, and Recreation 2 16% Santee-Lynches Health Care and Social Assistance 2 46% Trident Accommodation and Food Services 2 62% Upper Savannah Manufacturing 6 58% Upstate Arts, Entertainment, and Recreation 2 .73% Waccamaw Administrative Support and Waste Management and Remediation Services 3 65% Worklink Arts, Entertainment, and Recreation 2 81%
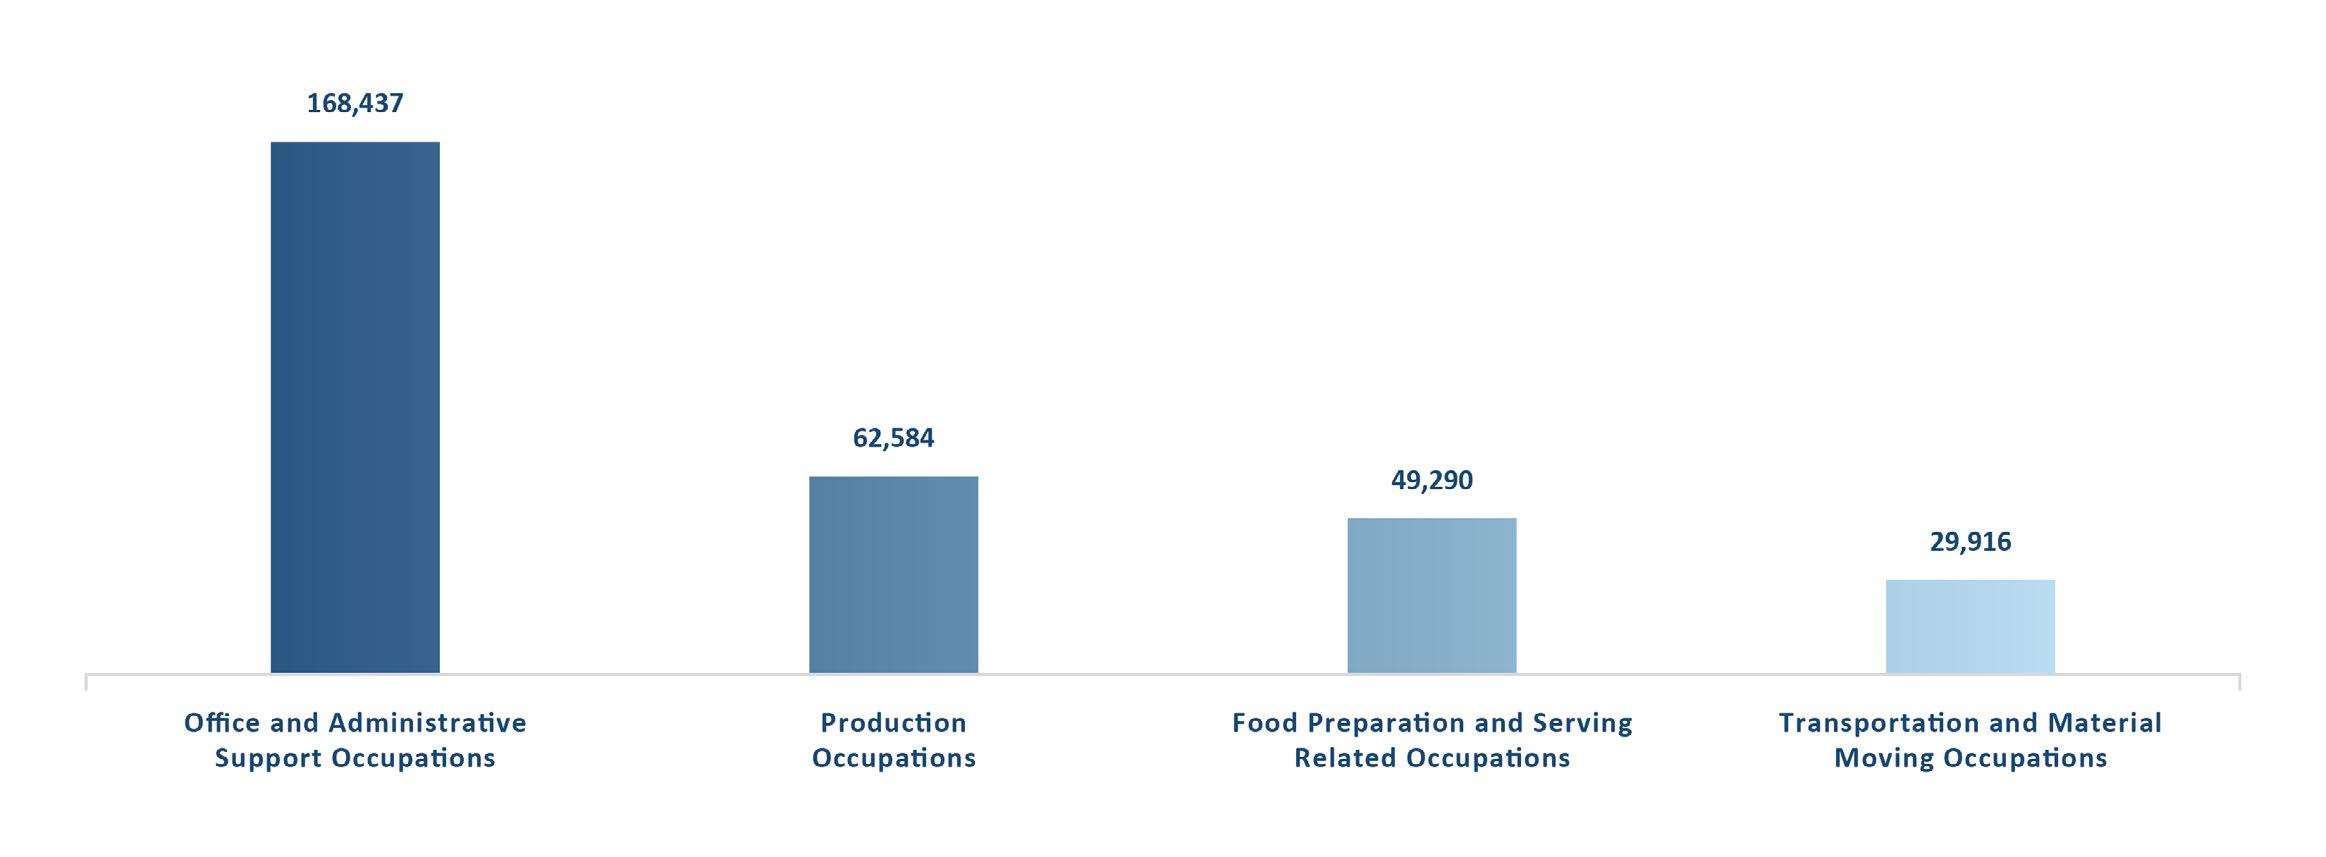
Figure 2, below, portrays the occupation groups that are projected to undergo the most significant job growth in each WDA. Interestingly, South Carolina as a whole, along with the Catawba, Greenville, Midlands, Santee-Lynches, and Trident regions, all share the same leading occupation group: Office and Administrative Support. This occupational category comprises roles including general office clerks, customer service representatives, bill and account collectors, postal service workers, and receptionists, among others.
There has been a substantial demand for these positions lately due to the shortage caused by the COVID-19 pandemic Notably, industries like Accommodation and Food Services, Administrative Support and Waste Management, Remediation services, and Arts, Entertainment, and Recreation have emerged as leaders in various regions within the state . This trend emphasizes the idea that service-oriented industries and occupations are poised for sustained growth in the future .
Elsewhere in the state, the Lowcountry and Waccamaw WDAs, which cover counties with a strong emphasis on tourism, showcase Food Preparation and Serving Related occupations as the leading contributors to employment growth In contrast, the Upper Savannah, Upstate, and Worklink regions, which constitute the Upstate Workforce Innovation and Opportunity Act domain, are experiencing their highest growth in Production Occupations. Lastly, the Lower Savannah and Pee Dee areas can expect a significant increase in employment in the field of Transportation and Material Moving occupations.
In summary, the long-term predictions highlight the impressive growth predicted for the economy and job market of South Carolina This expansion is anticipated to cover a wide range of industries and job fields. LMI believes the 2030 projection of 2,463,016 job positions, across all industries and occupations, puts into perspective the grand set of opportunities and challenges involved in building a workforce that can meet the demands of the state’s flourishing industries. Furthermore, short-term forecasts are set to be released in spring 2024, exclusively for the state. Readers can conveniently access the projections dashboards and find a more detailed explanation of this data in the dedicated "Employment Projections" section on LMI’s official website, SCWorkforceInfo.com

dew.sc.gov scworkforceinfo.com
FIGURE 2: TOP OCCUPATIONS ACROSS WDAS (2020-2030) (TOTAL EMPLOYMENT)
South Carolina’s Employment Situation (July 2023)
Household Survey1 (Local Area Unemployment Statistics)
EMPLOYMENT: The seasonally adjusted, monthly survey of households estimated the number of South Carolinians working increased to 2,370,882
• That is a significant increase of 13,381 people over the June 2023 estimate
• That is a significant increase of 70,503 people over the July 2022 estimate
UNEMPLOYMENT: The estimate of unemployed people increased to 77,098
• That is an increase of 997 people from June’s estimate and an increase of 119 from the July 2022 estimate
• The state’s seasonally adjusted unemployment rate was unchanged at 3 1 percent
• Nationally, the unemployment rate decreased from June’s rate of 3 6 percent to 3 5 percent, according to the Current Population Survey
LABOR FORCE: The state’s estimated labor force (people working plus unemployed people looking for work) increased to 2,447,980
• That is a significant increase of 14,378 people over the June estimate
• That is a significant increase of 70,622 individuals over the July 2022 estimate
Employer Survey2 (Current Employment Statistics)
NONAGRICULTURAL EMPLOYMENT BY INDUSTRY (SEASONALLY ADJUSTED 3 )
The monthly survey of businesses in South Carolina marked an estimated increase of 2,900 nonfarm payroll jobs over the month to a level of 2,306,300

• Industries reporting gains were Trade, Transportation, and Utilities (+2,200); Government (+2,200); Education and Health Services (+1,600); Manufacturing (+300); and Financial Activities (+100)
• Leisure and Hospitality (-2,000); Construction (-800); Professional and Business Services (-500); Other Services (-100); and Information (-100) industries declined .
From July 2022 to July 2023, South Carolina’s economy has picked up 52,900 seasonally adjusted, nonfarm jobs
• Industries making strong growth were Education and Health Services (+12,800); Leisure and Hospitality (+10,600); Trade, Transportation, and Utilities (+8,600); Government (+8,400); Financial Activities (+4,700); Professional and Business Services (+2,000); Other Services (+1,700); Information (+1,600); Construction (+1,500); and Manufacturing (+1,000)
8 SC Department of Employment and Workforce Labor Market Information Division Columbia, South Carolina 29202
NONAGRICULTURAL EMPLOYMENT BY INDUSTRY (NOT SEASONALLY ADJUSTED 4 )
Not seasonally adjusted, nonfarm payroll employment decreased by 9,100 from June 2023 to July 2023 for a total of 2,306,500
• Education and Health Services (+1,800); Trade, Transportation, and Utilities (+800); Manufacturing (+700); Financial Activities (+600); and Other Services (+400) industries increased over the month
• Government (-7,700); Professional and Business Services (-4,700); Information (-600); Construction (-200); Leisure and Hospitality (-100); and Mining and Logging (-100) industries marked declines
Since July 2022, not seasonally adjusted, nonfarm jobs were up 55,600 in South Carolina
• Industries making strong annual gains were Educational and Health Services (+14,700); Leisure and Hospitality (+14,300); Trade, Transportation, and Utilities (+9,100); Government (+7,900); Financial Activities (+4,600); Construction (+1,900); Other Services (+1,800); Information (+1,300); and Manufacturing (+1,000) .
• The Professional and Business Services industry marked a decline (-1,000) .
• The Mining and Logging industry showed no change

9 dew.sc.gov scworkforceinfo.com
4.5% 3.6% 6.2% 3.4% 7.2% 4.8% 3.4% 4.0% 2.9% 5.8% 4.8% 4.0% 4.8% 3.9% 3.0% 3.5% 4.9% 3.1% 4.0% 3.7% 3.3% 3.5% 3.8% 3.7% 4.3% 3.0% 3.6% 3.4% 3.4% 5.8% 3.5% 3.6% 3.3% 3.6% 4.2% 4.8% 3.3% 10 SC Department of Employment and Workforce Labor Market Information Division Columbia, South Carolina 29202
Local Area Unemployment Statistics
Unemployment Rate by County
LAUS EMPLOYMENT ESTIMATES (SEASONALLY ADJUSTED)
NOTE: Current month’s estimates are preliminary. All data are subject to revision. Population data are not seasonally adjusted.
3.1% 2.9% 4.0% 4.0% 5.4% 3.5% 3.6% 3.6% 5.5% 8.6% 5.8%
NON-INSTITUTIONAL POPULATION CIVILIAN LABOR FORCE TOTAL PERCENT OF POPULATION EMPLOYMENT UNEMPLOYMENT TOTAL PERCENT OF POPULATION TOTAL RATE (%) 4,300,537 2,447,980 56 9% 2,370,882 55 .1% 77,098 3 .1%
CIVILIAN
11 dew.sc.gov scworkforceinfo.com
STATE OF SOUTH CAROLINA LOCAL AREA UNEMPLOYMENT ESTIMATES BY COUNTY (NOT SEASONALLY ADJUSTED)
Current month's estimates are preliminary All data are subject to revision
Substate estimates are not seasonally adjusted and may diverge from state-level figures.
JULY 2023 JUNE 2023 JULY 2022 AREA LABOR FORCE EMPLOYMENT UNEMPLOYMENT LABOR FORCE EMPLOYMENT UNEMPLOYMENT LABOR FORCE EMPLOYMENT UNEMPLOYMENT LEVEL RATE (%) LEVEL RATE (%) LEVEL RATE (%) Abbeville County ↓ 9,417 8,993 424 4 5% 9,658 9,183 475 4 9% 9,198 8,807 391 4 3% Aiken County - 75,380 72,702 2,678 3 6% 74,837 72,159 2,678 3 6% 73,104 70,752 2,352 3 2% Allendale County ↑ 2,335 2,191 144 6 2% 2,349 2,205 144 6 1% 2,231 2,093 138 6 2% Anderson County ↑ 95,158 91,935 3,223 3 4% 94,868 91,752 3,116 3 3% 91,797 88,880 2,917 3 2% Bamberg County ↑ 4,616 4,284 332 7 2% 4,636 4,348 288 6 2% 4,411 4,148 263 6 0% Barnwell County ↑ 7,851 7,474 377 4 8% 7,843 7,471 372 4 7% 7,536 7,182 354 4 7% Beaufort County - 81,839 79,037 2,802 3 4% 80,385 77,684 2,701 3 4% 78,313 75,772 2,541 3 2% Berkeley County - 118,875 115,142 3,733 3 1% 117,647 113,958 3,689 3 1% 111,337 107,899 3,438 3 1% Calhoun County ↑ 6,656 6,393 263 4 0% 6,545 6,287 258 3 9% 6,420 6,185 235 3 7% Charleston County - 233,023 226,380 6,643 2 9% 230,509 223,933 6,576 2 9% 218,461 212,281 6,180 2 8% Cherokee County ↑ 23,021 21,691 1,330 5 8% 23,364 22,267 1,097 4 7% 23,240 22,223 1,017 4 4% Chester County ↑ 14,189 13,508 681 4 8% 14,095 13,431 664 4 7% 13,337 12,745 592 4 4% Chesterfield County - 21,951 21,064 887 4 0% 21,680 20,808 872 4 0% 21,346 20,597 749 3 5% Clarendon County - 11,953 11,383 570 4 8% 12,323 11,733 590 4 8% 11,426 10,939 487 4 3% Colleton County ↑ 16,748 16,102 646 3 9% 16,576 15,957 619 3 7% 15,947 15,377 570 3 6% Darlington County ↑ 31,487 30,231 1,256 4 0% 31,057 29,841 1,216 3 9% 29,826 28,677 1,149 3 9% Dillon County ↑ 13,139 12,430 709 5 4% 13,462 12,792 670 5 0% 12,445 11,853 592 4 8% Dorchester County - 86,188 83,604 2,584 3 0% 85,273 82,731 2,542 3 0% 80,741 78,357 2,384 3 0% Edgefield County ↓ 10,566 10,194 372 3 5% 10,480 10,096 384 3 7% 10,259 9,921 338 3 3% Fairfield County ↑ 9,548 9,080 468 4 9% 9,384 8,938 446 4 8% 9,221 8,785 436 4 7% Florence County - 69,659 67,187 2,472 3 5% 68,787 66,369 2,418 3 5% 65,984 63,713 2,271 3 4% Georgetown County ↑ 28,224 27,213 1,011 3 6% 27,837 26,855 982 3 5% 26,869 25,863 1,006 3 7% Greenville County ↓ 270,248 261,822 8,426 3 1% 269,847 261,346 8,501 3 2% 260,701 253,117 7,584 2 9% Greenwood County ↓ 29,489 28,312 1,177 4 0% 30,409 28,912 1,497 4 9% 28,865 27,738 1,127 3 9% Hampton County ↑ 8,087 7,790 297 3 7% 8,097 7,832 265 3 3% 7,711 7,448 263 3 4% Horry County ↓ 164,397 158,462 5,935 3 6% 163,574 157,568 6,006 3 7% 156,516 150,905 5,611 3 6% Jasper County ↑ 14,062 13,601 461 3 3% 13,784 13,351 433 3 1% 13,481 13,045 436 3 2% Kershaw County - 30,419 29,344 1,075 3 5% 29,949 28,888 1,061 3 5% 29,399 28,387 1,012 3 4% Lancaster County - 46,166 44,403 1,763 3 8% 45,894 44,154 1,740 3 8% 43,490 41,903 1,587 3 6% Laurens County ↓ 31,302 30,131 1,171 3 7% 31,220 30,049 1,171 3 8% 30,187 29,132 1,055 3 5% Lee County ↓ 6,664 6,379 285 4 3% 6,592 6,303 289 4 4% 6,474 6,167 307 4 7% Lexington County - 156,576 151,950 4,626 3 0% 154,239 149,652 4,587 3 0% 151,211 146,974 4,237 2 8% Marion County ↑ 13,024 12,311 713 5 5% 12,955 12,291 664 5 1% 12,658 12,028 630 5 0% Marlboro County ↑ 7,474 6,832 642 8 6% 7,563 6,935 628 8 3% 8,204 7,685 519 6 3% McCormick County ↓ 3,397 3,275 122 3 6% 3,466 3,319 147 4 2% 3,450 3,321 129 3 7% Newberry County - 19,614 18,947 667 3 4% 19,445 18,783 662 3 4% 19,070 18,510 560 2 9% Oconee County - 35,857 34,623 1,234 3 4% 36,443 35,220 1,223 3 4% 33,847 32,719 1,128 3 3% Orangeburg County ↑ 33,336 31,409 1,927 5 8% 33,549 31,780 1,769 5 3% 31,677 29,956 1,721 5 4% Pickens County - 60,303 58,197 2,106 3 5% 60,173 58,080 2,093 3 5% 58,222 56,259 1,963 3 4% Richland County - 204,228 196,902 7,326 3 6% 201,292 194,080 7,212 3 6% 197,303 190,437 6,866 3 5% Saluda County ↓ 8,754 8,464 290 3 3% 8,597 8,290 307 3 6% 8,437 8,197 240 2 8% Spartanburg County ↑ 161,099 155,348 5,751 3 6% 160,315 154,694 5,621 3 5% 153,713 148,434 5,279 3 4% Sumter County - 43,646 41,831 1,815 4 2% 43,135 41,339 1,796 4 2% 42,078 40,442 1,636 3 9% Union County ↓ 11,656 11,099 557 4 8% 11,616 11,049 567 4 9% 11,234 10,606 628 5 6% Williamsburg County ↑ 10,813 10,182 631 5 8% 10,746 10,171 575 5 4% 10,866 10,320 546 5 0% York County - 156,803 151,599 5,204 3 3% 155,912 150,811 5,101 3 3% 147,805 143,038 4,767 3 2%
↑ Unemployment Rate Up
↓ Unemployment Rate Down Unemployment Rate = 12 SC Department of Employment and Workforce Labor Market Information Division Columbia, South Carolina 29202
LOCAL AREA UNEMPLOYMENT ESTIMATES BY MUNICIPALITY (NOT SEASONALLY ADJUSTED)
Current month’s estimates are preliminary All data are subject to revision
Substate estimates are not seasonally adjusted and may diverge from state-level figures.
JULY 2023 JUNE 2023 JULY 2022 METROPOLITAN STATISTICAL AREA LABOR FORCE EMPLOYMENT UNEMPLOYMENT LABOR FORCE EMPLOYMENT UNEMPLOYMENT LABOR FORCE EMPLOYMENT UNEMPLOYMENT LEVEL RATE (%) LEVEL RATE (%) LEVEL RATE (%) Charleston-North Charleston - 438,086 425,126 12,960 3 0% 433,429 420,622 12,807 3 0% 410,539 398,537 12,002 2 9% Columbia - 416,181 402,133 14,048 3 4% 410,006 396,135 13,871 3 4% 401,991 388,965 13,026 3 2% Florence ↑ 101,146 97,418 3,728 3 7% 99,844 96,210 3,634 3 6% 95,810 92,390 3,420 3 6% GreenvilleAnderson-Mauldin - 457,011 442,085 14,926 3 3% 456,108 441,227 14,881 3 3% 440,907 427,388 13,519 3 1% Hilton Head IslandBluffton-Beaufort ↑ 95,901 92,638 3,263 3 4% 94,169 91,035 3,134 3 3% 91,794 88,817 2,977 3 2% Myrtle BeachConway-North Myrtle Beach ↓ 225,625 217,246 8,379 3 7% 224,564 215,997 8,567 3 8% 216,645 208,342 8,303 3 8% Spartanburg ↑ 172,755 166,447 6,308 3 7% 171,931 165,743 6,188 3 6% 164,947 159,040 5,907 3 6% Sumter - 43,646 41,831 1,815 4 2% 43,135 41,339 1,796 4 2% 42,078 40,442 1,636 3 9% Augusta-Richmond County, GA (SC portion) ↓ 85,946 82,896 3,050 3 5% 85,317 82,255 3,062 3 6% 83,363 80,673 2,690 3 2% Charlotte-Concord-Gastonia, NC (SC portion) - 217,158 209,510 7,648 3 5% 215,901 208,396 7,505 3 5% 204,632 197,686 6,946 3 4%
LOCAL AREA UNEMPLOYMENT ESTIMATES BY MSA (NOT SEASONALLY ADJUSTED)
JULY 2023 JUNE 2023 JULY 2022 CITIES AND TOWNS ABOVE 25,000 POPULATION LABOR FORCE EMPLOYMENT UNEMPLOYMENT LABOR FORCE EMPLOYMENT UNEMPLOYMENT LABOR FORCE EMPLOYMENT UNEMPLOYMENT LEVEL RATE (%) LEVEL RATE (%) LEVEL RATE (%) Aiken - 13,237 12,717 520 3 9% 13,139 12,622 517 3 9% 12,802 12,376 426 3 3% Anderson ↑ 12,052 11,550 502 4 2% 12,000 11,527 473 3 9% 11,602 11,167 435 3 7% Bluffton - 13,882 13,485 397 2 9% 13,649 13,255 394 2 9% 13,262 12,928 334 2 5% Charleston - 82,322 79,874 2,448 3 0% 81,487 79,013 2,474 3 0% 77,008 74,895 2,113 2 7% Columbia ↑ 59,349 56,813 2,536 4 3% 58,440 55,999 2,441 4 2% 57,288 54,949 2,339 4 1% Conway ↑ 11,269 10,703 566 5 0% 11,180 10,643 537 4 8% 10,713 10,193 520 4 9% Florence - 20,531 19,757 774 3 8% 20,280 19,516 764 3 8% 19,421 18,735 686 3 5% Fort Mill ↓ 14,053 13,667 386 2 7% 13,988 13,596 392 2 8% 13,278 12,895 383 2 9% Goose Creek ↑ 22,568 21,816 752 3 3% 22,307 21,592 715 3 2% 21,129 20,444 685 3 2% Greenville ↑ 38,709 37,489 1,220 3 2% 38,637 37,421 1,216 3 1% 37,291 36,243 1,048 2 8% Greer - 19,038 18,471 567 3 0% 19,007 18,428 579 3 0% 18,267 17,807 460 2 5% Hanahan ↓ 15,665 15,309 356 2 3% 15,521 15,152 369 2 4% 14,687 14,346 341 2 3% Hilton Head Island ↓ 18,295 17,780 515 2 8% 18,003 17,475 528 2 9% 17,471 17,045 426 2 4% Mauldin ↓ 14,328 13,910 418 2 9% 14,330 13,885 445 3 1% 13,799 13,447 352 2 6% Mount Pleasant ↓ 54,908 53,628 1,280 2 3% 54,362 53,049 1,313 2 4% 51,456 50,288 1,168 2 3% Myrtle Beach ↑ 17,005 16,450 555 3 3% 16,894 16,357 537 3 2% 16,193 15,665 528 3 3% North Charleston ↑ 61,576 59,575 2,001 3 2% 60,811 58,936 1,875 3 1% 57,808 55,858 1,950 3 4% Rock Hill ↑ 42,598 40,884 1,714 4 0% 42,305 40,671 1,634 3 9% 40,120 38,575 1,545 3 9% Spartanburg - 17,236 16,492 744 4 3% 17,157 16,423 734 4 3% 16,426 15,758 668 4 1% Summerville ↓ 27,677 26,834 843 3 0% 27,391 26,554 837 3 1% 25,903 25,150 753 2 9% Sumter ↓ 15,578 14,895 683 4 4% 15,413 14,720 693 4 5% 15,045 14,401 644 4 3%
13 dew.sc.gov scworkforceinfo.com
UNEMPLOYMENT MONTH25,000 50,000 75,000 100,000 125,000 150,000 175,000 200,000 225,000 250,000 275,000 300,000 UNEMPLOYMENT RATE (PERCENT) Monthly Unemployment Rate
January 2020 MONTH 0.0 2 0 4 0 6.0 8.0 10 0 12 0 14.0 14 SC Department of Employment and Workforce Labor Market Information Division Columbia, South Carolina 29202
Monthly Unemployment since January 2020
since
Monthly Labor Force Participation Rate since January 2020
Monthly Employment since January 2020
LABOR FORCE PARTICIPATION RATE (PERCENT) MONTH
54 5 55 0 55 5 56 0 56 5 57 0 57 5 58 0 EMPLOYMENT
MONTH 1,800,000 1,900,000 2,000,000 2,100,000 2,200,000 2,300,000 2,400,000 15 dew.sc.gov scworkforceinfo.com
CURRENT EMPLOYMENT STATISTICS
Seasonally Adjusted — Year-Over-Year Change
NOTE: Employment estimates have been rounded to the nearest hundred. Sum of detail may not equal totals due to rounding or the exclusion of certain industries from publication. All data are subject to revision.
+1.4% +2.4% +1.0% +0.8% +2.9% +3.7% +5.2% +1.9%
JULY 2023 JUNE 2023 TO JULY 2023 JULY 2022 TO JULY 2023 AREA JULY 2023 JUNE 2023 JULY 2022 # CHANGE % CHANGE # CHANGE % CHANGE Statewide 2,306,300 2,303,400 2,253,400 +2,900 +0.1% +52,900 +2.3% Charleston-North Charleston 417,000 416,100 396,400 +900 +0 2% +20,600 +5 2% Columbia 419,600 417,600 415,300 +2,000 +0 5% +4,300 +1 0% Florence 96,400 96,200 93,700 +200 +0 2% +2,700 +2 9% Greenville-Anderson-Mauldin 458,300 459,200 452,100 -900 -0 2% +6,200 +1 4% Hilton Head Island-Bluffton-Beaufort 86,900 86,900 85,300 0 0 0% +1,600 +1 9% Myrtle Beach-Conway-North Myrtle Beach 191,000 190,700 184,200 +300 +0 2% +6,800 +3 7% Spartanburg 171,800 171,300 167,700 +500 +0 3% +4,100 +2 4% Sumter 39,700 39,700 39,400 0 0 0% +300 +0 8%
NONFARM PAYROLL BY METROPOLITAN STATISTICAL AREA SEASONALLY ADJUSTED
16 SC Department of Employment and Workforce Labor Market Information Division Columbia, South Carolina 29202
NONFARM PAYROLL BY ECONOMIC SECTOR SEASONALLY ADJUSTED (IN THOUSANDS)
JULY 2023 JUNE 2023 TO JULY 2023 JULY 2022 TO JULY 2023 JULY 2023 JUNE 2023 JULY 2022 # CHANGE % CHANGE # CHANGE % CHANGE Total Nonfarm 2,306.3 2,303.4 2,253.4 +2.9 +0.1% +52.9 +2.3% Total Private 1,929 0 1,928 3 1,884 5 +0 7 0 0% +44 5 +2 4% Goods Producing 378 1 378 6 375 6 -0 5 -0 1% +2 5 +0 7% Mining, Logging and Construction 115 0 115 8 113 5 -0 8 -0 7% +1 5 +1 3% Mining and Logging 4 5 4 5 4 5 0 0 0 0% 0 0 0 0% Construction 110 5 111 3 109 0 -0 8 -0 7% +1 5 +1 4% Manufacturing 263 1 262 8 262 1 +0 3 +0 1% +1 0 +0 4% Durable Goods 158 8 159 1 157 4 -0 3 -0 2% +1 4 +0 9% Non-Durable Goods 104 3 103 7 104 7 +0 6 +0 6% -0 4 -0 4% Service-Providing 1,928 2 1,924 8 1,877 8 +3 4 +0 2% +50 4 +2 7% Private Service Providing 1,550 9 1,549 7 1,508 9 +1 2 +0 1% +42 0 +2 8% Trade, Transportation, and Utilities 442 9 440 7 434 3 +2 2 +0 5% +8 6 +2 0% Wholesale Trade 80 2 78 6 80 2 +1 6 +2 0% 0 0 0 0% Retail Trade 262 5 262 2 260 1 +0 3 +0 1% +2 4 +0 9% Transportation, Warehousing, and Utilities 100 2 99 9 94 0 +0 3 +0 3% +6 2 +6 6% Information 32 2 32 3 30 6 -0 1 -0 3% +1 6 +5 2% Financial Activities 122 7 122 6 118 0 +0 1 +0 1% +4 7 +4 0% Finance and Insurance 87 2 87 5 85 0 -0 3 -0 3% +2 2 +2 6% Real Estate and Rental and Leasing 35 5 35 1 33 0 +0 4 +1 1% +2 5 +7 6% Professional and Business Services 313 2 313 7 311 2 -0 5 -0 2% +2 0 +0 6% Professional, Scientific, and Technical Services 121 6 119 7 119 6 +1 9 +1 6% +2 0 +1 7% Management of Companies and Enterprises 25 9 25 7 25 3 +0 2 +0 8% +0 6 +2 4% Administrative and Support and Waste Management and Remediation Services 165 7 168 3 166 3 -2 6 -1 5% -0 6 -0 4% Education and Health Services 280 7 279 1 267 9 +1 6 +0 6% +12 8 +4 8% Educational Services 46 0 45 5 45 0 +0 5 +1 1% +1 0 +2 2% Health Care Services 234 7 233 6 222 9 +1 1 +0 5% +11 8 +5 3% Leisure and Hospitality 275 4 277 4 264 8 -2 0 -0 7% +10 6 +4 0% Arts, Entertainment, and Recreation 38 2 38 2 32 2 0 0 0 0% +6 0 +18 6% Accommodation and Food Services 237 2 239 2 232 6 -2 0 -0 8% +4 6 +2 0% Other Services 83 8 83 9 82 1 -0 1 -0 1% +1 7 +2 1% Government 377 3 375 1 368 9 +2 2 +0 6% +8 4 +2 3% Federal Government 37 0 36 9 35 2 +0 1 +0 3% +1 8 +5 1% State Government 109 2 109 2 107 3 0 0 0 0% +1 9 +1 8% Local Government 231 1 229 0 226 4 +2 1 +0 9% +4 7 +2 1% 17 dew.sc.gov scworkforceinfo.com
CURRENT EMPLOYMENT STATISTICS
Not Seasonally Adjusted — Year-Over-Year Change
NONFARM PAYROLL BY METROPOLITAN STATISTICAL AREA NOT SEASONALLY ADJUSTED
NOTE: Employment estimates have been rounded to the nearest hundred. Sum of detail may not equal totals due to rounding or the exclusion of certain industries from publication. All data are subject to revision.
+1.5% +3.1% +1.5% +1.5% +3.8% +3.2% +5.0% +2.4%
JULY 2023 JUNE 2023 TO JULY 2023 JULY 2022 TO JULY 2023 AREA JULY 2023 JUNE 2023 JULY 2022 # CHANGE % CHANGE # CHANGE % CHANGE Statewide 2,306,500 2,315,600 2,250,900 -9,100 -0.4% +55,600 +2.5% Charleston-North Charleston 418,700 419,300 398,700 -600 -0 1% +20,000 +5 0% Columbia 417,300 416,400 411,100 +900 +0 2% +6,200 +1 5% Florence 96,300 96,500 92,800 -200 -0 2% +3,500 +3 8% Greenville-Anderson-Mauldin 454,800 460,000 448,000 -5,200 -1 1% +6,800 +1 5% Hilton Head Island-Bluffton-Beaufort 89,200 88,900 87,100 +300 +0 3% +2,100 +2 4% Myrtle Beach-Conway-North Myrtle Beach 197,400 198,800 191,200 -1,400 -0 7% +6,200 +3 2% Spartanburg 170,200 171,600 165,100 -1,400 -0 8% +5,100 +3 .1% Sumter 39,700 39,800 39,100 -100 -0 3% +600 +1 5%
18 SC Department of Employment and Workforce Labor Market Information Division Columbia, South Carolina 29202
NONFARM PAYROLL BY ECONOMIC SECTOR NOT SEASONALLY ADJUSTED JULY 2023
JUNE 2023 TO JULY 2023 JULY 2022 TO JULY 2023 JULY 2023 JUNE 2023 JULY 2022 # CHANGE % CHANGE # CHANGE % CHANGE Total Nonfarm 2,306,500 2,315,600 2,250,900 -9,100 -0.4% +55,600 +2.5% Total Private 1,942,500 1,943,900 1,894,800 -1,400 -0 1% +47,700 +2 5% Goods Producing 380,100 379,700 377,200 +400 +0 1% +2,900 +0 8% Mining, Logging and Construction 116,300 116,600 114,400 -300 -0 3% +1,900 +1 7% Mining and Logging 4,500 4,600 4,500 -100 -2 2% 0 0 0% Construction 111,800 112,000 109,900 -200 -0 2% +1,900 +1 7% Construction of Buildings 26,700 27,500 27,000 -800 -2 9% -300 -1 1% Heavy and Civil Engineering Construction 17,600 17,800 17,000 -200 -1 1% +600 +3 5% Specialty Trade Contractors 67,500 66,700 65,900 +800 +1 2% +1,600 +2 4% Manufacturing 263,800 263,100 262,800 +700 +0 3% +1,000 +0 4% Durable Goods 159,700 159,300 158,200 +400 +0 3% +1,500 +0 9% Fabricated Metal Product Manufacturing 23,900 23,900 24,200 0 0 0% -300 -1 2% Transportation Equipment Manufacturing 51,500 51,400 49,700 +100 +0 2% +1,800 +3 6% Non-Durable Goods 104,100 103,800 104,600 +300 +0 3% -500 -0 5% Textile Mills 12,100 12,100 12,500 0 0 0% -400 -3 2% Plastics and Rubber Products Manufacturing 25,700 25,700 25,500 0 0 0% +200 +0 8% Service-Providing 1,926,400 1,935,900 1,873,700 -9,500 -0 5% +52,700 +2 8% Private Service Providing 1,562,400 1,564,200 1,517,600 -1,800 -0 1% +44,800 +3 0% Trade, Transportation, and Utilities 443,100 442,300 434,000 +800 +0 2% +9,100 +2 1% Wholesale Trade 81,200 79,500 80,600 +1,700 +2 1% +600 +0 7% Merchant Wholesalers, Durable Goods 43,200 42,400 43,200 +800 +1 9% 0 0 0% Merchant Wholesalers, Nondurable Goods 22,900 22,600 22,700 +300 +1 3% +200 +0 9% Retail Trade 262,900 263,500 260,500 -600 -0 2% +2,400 +0 9% Motor Vehicle and Parts Dealers 34,800 34,700 33,700 +100 +0 3% +1,100 +3 3% Food and Beverage Stores 53,700 54,000 52,000 -300 -0 6% +1,700 +3 3% Health and Personal Care Stores 15,800 16,200 15,800 -400 -2 5% 0 0 0% Clothing and Clothing Accessories Stores 18,100 18,000 17,800 +100 +0 6% +300 +1 7% General Merchandise Stores 61,700 61,000 59,500 +700 +1 1% +2,200 +3 7% Transportation, Warehousing, and Utilities 99,000 99,300 92,900 -300 -0 3% +6,100 +6 6% Utilities 11,700 11,800 11,000 -100 -0 8% +700 +6 4% Transportation and Warehousing 87,300 87,500 81,900 -200 -0 2% +5,400 +6 6% Information 32,300 32,900 31,000 -600 -1 8% +1,300 +4 2% Financial Activities 123,800 123,200 119,200 +600 +0 5% +4,600 +3 9% Finance and Insurance 87,300 87,300 85,000 0 0 0% +2,300 +2 7% Credit Intermediation and Related Activities including Monetary Authorities 38,400 38,500 38,300 -100 -0 3% +100 +0 3% Real Estate and Rental and Leasing 36,500 35,900 34,200 +600 +1 7% +2,300 +6 7% Professional and Business Services 308,100 312,800 309,100 -4,700 -1 5% -1,000 -0 3% Professional, Scientific, and Technical Services 121,700 119,500 119,900 +2,200 +1 8% +1,800 +1 5% Architectural, Engineering, and Related Services 23,600 22,800 22,100 +800 +3 5% +1,500 +6 8% Management of Companies and Enterprises 26,000 25,800 25,500 +200 +0 8% +500 +2 0% Administrative and Support and Waste Management and Remediation Services 160,400 167,500 163,700 -7,100 -4 2% -3,300 -2 0% Administrative and Support Services 148,100 155,200 151,700 -7,100 -4 6% -3,600 -2 4% Employment Services 64,500 70,300 70,100 -5,800 -8 3% -5,600 -8 0% Services to Buildings and Dwellings 37,800 39,300 37,800 -1,500 -3 8% 0 0 0% Education and Health Services 278,800 277,000 264,100 +1,800 +0 6% +14,700 +5 6% Educational Services 43,000 43,300 42,000 -300 -0 7% +1,000 +2 4% Health Care and Social Assistance 235,800 233,700 222,100 +2,100 +0 9% +13,700 +6 2% Ambulatory Health Care Services 112,300 111,400 107,800 +900 +0 8% +4,500 +4 2% Hospitals 39,500 39,200 37,100 +300 +0 8% +2,400 +6 5% Nursing and Residential Care Facilities 42,600 41,900 38,100 +700 +1 7% +4,500 +11 8% Leisure and Hospitality 291,900 292,000 277,600 -100 0 0% +14,300 +5 2% Arts, Entertainment, and Recreation 41,600 42,100 35,900 -500 -1 2% +5,700 +15 9% Amusement, Gambling, and Recreation Industries 30,600 31,000 28,300 -400 -1 3% +2,300 +8 1% Accommodation and Food Services 250,300 249,900 241,700 +400 +0 2% +8,600 +3 6% Accommodation 34,700 34,600 33,300 +100 +0 3% +1,400 +4 2% Food Services and Drinking Places 215,600 215,300 208,400 +300 +0 1% +7,200 +3 5% Other Services 84,400 84,000 82,600 +400 +0 5% +1,800 +2 2% Repair and Maintenance 23,800 23,900 22,900 -100 -0 4% +900 +3 9% Personal and Laundry Services 20,900 20,700 20,300 +200 +1 0% +600 +3 0% Government 364,000 371,700 356,100 -7,700 -2 1% +7,900 +2 2% Federal Government 37,100 36,700 35,300 +400 +1 1% +1,800 +5 1% State Government 103,300 104,400 102,500 -1,100 -1 1% +800 +0 8% State Government Educational Services 45,400 46,700 46,800 -1,300 -2 8% -1,400 -3 0% State Government Excluding Education 57,900 57,700 55,700 +200 +0 3% +2,200 +3 9% Local Government 223,600 230,600 218,300 -7,000 -3 0% +5,300 +2 4% Local Government Educational Services 101,700 109,100 100,300 -7,400 -6 8% +1,400 +1 4% Local Government excluding Educational Services 121,900 121,500 118,000 +400 +0 3% +3,900 +3 3% 19 dew.sc.gov scworkforceinfo.com
TOTAL PRIVATE NSA STATEWIDE HOURS AND EARNINGS BY MSA
AVERAGE WEEKLY EARNINGS (AWE)
AVERAGE HOURLY EARNINGS (AHE)
Current month’s estimates are preliminary. All data are subject to revision.
JUNE 2023 TO JULY 2023 JULY 2022 TO JULY 2023 AREA JULY 2023 JUNE 2023 JULY 2022 # CHANGE % CHANGE # CHANGE % CHANGE Charleston-North Charleston $1,083 58 $1,093 10 $1,073 72 -$9 52 -0 9% +$9 86 +0 9% Columbia $968 32 $955 82 $923 13 +$12 50 +1 3% +$45 19 +4 9% Florence $767 49 $765 60 $780 30 +$1 89 +0 2% -$12 81 -1 6% Greenville-Anderson-Mauldin $1,101 10 $1,092 66 $1,030 60 +$8 44 +0 8% +$70 50 +6 8% Hilton Head Island-Bluffton-Beaufort $818 46 $807 42 $803 83 +$11 04 +1 4% +$14 63 +1 8% Myrtle Beach-Conway-North Myrtle Beach $862 92 $835 09 $829 69 +$27 83 +3 3% +$33 23 +4 0% Spartanburg $928 11 $920 08 $959 05 +$8 03 +0 9% -$30 94 -3 2% Sumter $778 81 $773 60 $743 04 +$5 21 +0 7% +$35 77 +4 8%
JUNE 2023 TO JULY 2023 JULY 2022 TO JULY 2023 AREA JULY 2023 JUNE 2023 JULY 2022 # CHANGE % CHANGE # CHANGE % CHANGE Charleston-North Charleston 34 0 34 0 34 0 0 0 0 0% 0 0 0 0% Columbia 34 0 34 1 34 6 -0 1 -0 3% -0 6 -1 7% Florence 33 5 33 0 34 0 +0 5 +1 5% -0 5 -1 5% Greenville-Anderson-Mauldin 34 9 35 1 34 9 -0 2 -0 6% 0 0 0 0% Hilton Head Island-Bluffton-Beaufort 30 7 30 9 31 0 -0 2 -0 6% -0 3 -1 0% Myrtle Beach-Conway-North Myrtle Beach 33 1 32 8 33 7 +0 3 +0 9% -0 6 -1 8% Spartanburg 32 9 33 3 34 9 -0 4 -1 2% -2 0 -5 7% Sumter 32 6 32 6 32 0 0 0 0 0% +0 6 +1 9%
AVERAGE WEEKLY HOURS (AWH)
JUNE 2023 TO JULY 2023 JULY 2022 TO JULY 2023 AREA JULY 2023 JUNE 2023 JULY 2022 # CHANGE % CHANGE # CHANGE % CHANGE Charleston-North Charleston $31 87 $32 15 $31 58 -$0 28 -0 9% +$0 29 +0 9% Columbia $28 48 $28 03 $26 68 +$0 45 +1 6% +$1 80 +6 7% Florence $22 91 $23 20 $22 95 -$0 29 -1 3% -$0 04 -0 2% Greenville-Anderson-Mauldin $31 55 $31 13 $29 53 +$0 42 +1 3% +$2 02 +6 8% Hilton Head Island-Bluffton-Beaufort $26 66 $26 13 $25 93 +$0 53 +2 0% +$0 73 +2 8% Myrtle Beach-Conway-North Myrtle Beach $26 07 $25 46 $24 62 +$0 61 +2 4% +$1 45 +5 9% Spartanburg $28 21 $27 63 $27 48 +$0 58 +2 1% +$0 73 +2 7% Sumter $23 89 $23 73 $23 22 +$0 16 +0 7% +$0 67 +2 9%
20 SC Department of Employment and Workforce Labor Market Information Division Columbia, South Carolina 29202
NSA STATEWIDE HOURS AND EARNINGS BY INDUSTRY AVERAGE WEEKLY EARNINGS (AWE)
AVERAGE WEEKLY HOURS (AWH)
AVERAGE HOURLY EARNINGS (AHE)
JUNE 2023 TO JULY 2023 JULY 2022 TO JULY 2023 INDUSTRY TITLE JULY 2023 JUNE 2023 JULY 2022 # CHANGE % CHANGE # CHANGE % CHANGE Total Private $1,014.94 $1,005.68 $975.66 +$9.26 +0.9% +$39.28 +4.0% Goods Producing $1,289 20 $1,304 44 $1,285 61 -$15 24 -1 2% +$3 59 +0 3% Construction $1,216 80 $1,213 38 $1,255 93 +$3 42 +0 3% -$39 13 -3 1% Manufacturing $1,306 40 $1,329 24 $1,293 85 -$22 84 -1 7% +$12 55 +1 0% Private Service Providing $947 85 $934 80 $897 08 +$13 05 +1 4% +$50 77 +5 7% Trade, Transportation, and Utilities $853 81 $864 73 $835 98 -$10 92 -1 3% +$17 83 +2 1% Financial Activities $1,168 16 $1,134 67 $1,157 16 +$33 49 +3 0% +$11 00 +1 0% Professional and Business Services $1,277 33 $1,222 50 $1,219 96 +$54 83 +4 5% +$57 37 +4 7% Education and Health Services $1,035 51 $1,024 51 $1,000 98 +$11 00 +1 1% +$34 53 +3 4% Leisure and Hospitality $491 51 $480 08 $442 78 +$11 43 +2 4% +$48 73 +11 0% Other Services $989 18 $963 83 $810 12 +$25 35 +2 6% +$179 06 +22 1%
JUNE 2023 TO JULY 2023 JULY 2022 TO JULY 2023 INDUSTRY TITLE JULY 2023 JUNE 2023 JULY 2022 # CHANGE % CHANGE # CHANGE % CHANGE Total Private 34.3 34.3 34.5 0.0 0.0% -0.2 -0.6% Goods Producing 40 0 40 7 41 1 -0 7 -1 7% -1 1 -2 7% Construction 41 8 42 0 41 3 -0 2 -0 5% +0 5 +1 2% Manufacturing 39 6 40 6 40 7 -1 0 -2 5% -1 1 -2 7% Private Service Providing 32 9 32 8 32 8 +0 1 +0 3% +0 1 +0 3% Trade, Transportation, and Utilities 33 3 33 4 33 2 -0 1 -0 3% +0 1 +0 3% Financial Activities 36 7 37 3 37 4 -0 6 -1 6% -0 7 -1 9% Professional and Business Services 36 8 36 8 38 1 0 0 0 0% -1 3 -3 4% Education and Health Services 33 2 32 9 32 3 +0 3 +0 9% +0 9 +2 8% Leisure and Hospitality 26 2 25 7 26 0 +0 5 +1 9% +0 2 +0 8% Other Services 33 6 34 3 34 4 -0 7 -2 0% -0 8 -2 3%
JUNE 2023 TO JULY 2023 JULY 2022 TO JULY 2023 INDUSTRY TITLE JULY 2023 JUNE 2023 JULY 2022 # CHANGE % CHANGE # CHANGE % CHANGE Total Private $29.59 $29.32 $28.28 +$0.27 +0.9% +$1.31 +4.6% Goods Producing $32 23 $32 05 $31 28 +$0 18 +0 6% +$0 95 +3 0% Construction $29 11 $28 89 $30 41 +$0 22 +0 8% -$1 30 -4 3% Manufacturing $32 99 $32 74 $31 79 +$0 25 +0 8% +$1 20 +3 8% Private Service Providing $28 81 $28 50 $27 35 +$0 31 +1 1% +$1 46 +5 3% Trade, Transportation, and Utilities $25 64 $25 89 $25 18 -$0 25 -1 0% +$0 46 +1 8% Financial Activities $31 83 $30 42 $30 94 +$1 41 +4 6% +$0 89 +2 9% Professional and Business Services $34 71 $33 22 $32 02 +$1 49 +4 5% +$2 69 +8 4% Education and Health Services $31 19 $31 14 $30 99 +$0 05 +0 2% +$0 20 +0 6% Leisure and Hospitality $18 76 $18 68 $17 03 +$0 08 +0 4% +$1 73 +10 2% Other Services $29 44 $28 10 $23 55 +$1 34 +4 8% +$5 89 +25 0% 21 dew.sc.gov scworkforceinfo.com
NONFARM PAYROLL BY ECONOMIC SECTOR
CHARLESTON-NORTH CHARLESTON MSA
JULY 2023 (NOT SEASONALLY ADJUSTED)
Current month’s estimates are preliminary. All data are subject to revision.
JUNE 2023 TO JULY 2023 JULY 2022 TO JULY 2023 JULY 2023 JUNE 2023 JULY 2022 # CHANGE % CHANGE # CHANGE % CHANGE Total Nonfarm 418,700 419,300 398,700 -600 -0.1% +20,000 +5.0% Total Private 351,100 351,000 332,600 +100 0 0% +18,500 +5 6% Goods Producing 55,000 54,500 52,100 +500 +0 9% +2,900 +5 6% Service-Providing 363,700 364,800 346,600 -1,100 -0 3% +17,100 +4 9% Private Service Providing 296,100 296,500 280,500 -400 -0 1% +15,600 +5 6% Mining, Logging and Construction 23,000 23,000 21,900 0 0 .0% +1,100 +5 .0% Manufacturing 32,000 31,500 30,200 +500 +1 6% +1,800 +6 0% Trade, Transportation, and Utilities 75,600 75,800 73,600 -200 -0 3% +2,000 +2 7% Wholesale Trade 12,300 12,100 12,400 +200 +1 7% -100 -0 8% Retail Trade 42,600 43,000 42,600 -400 -0 9% 0 0 .0% General Merchandise Stores 8,200 8,300 7,800 -100 -1 2% +400 +5 1% Transportation, Warehousing, and Utilities 20,700 20,700 18,600 0 0 0% +2,100 +11 3% Information 9,400 9,400 8,600 0 0 0% +800 +9 3% Financial Activities 19,800 19,700 19,300 +100 +0 5% +500 +2 6% Professional and Business Services 68,600 69,400 63,600 -800 -1 2% +5,000 +7 9% Administrative and Support and Waste Management 29,300 30,700 28,100 -1,400 -4 6% +1,200 +4 3% Education and Health Services 48,900 48,500 45,700 +400 +0 8% +3,200 +7 0% Leisure and Hospitality 57,700 57,700 53,900 0 0 0% +3,800 +7 1% Accommodation and Food Services 50,600 50,900 47,300 -300 -0 6% +3,300 +7 0% Food Services and Drinking Places 41,800 42,200 38,700 -400 -0 9% +3,100 +8 0% Other Services 16,100 16,000 15,800 +100 +0 6% +300 +1 9% Government 67,600 68,300 66,100 -700 -1 0% +1,500 +2 3% Federal Government 11,700 11,700 11,500 0 0 0% +200 +1 7% State Government 27,900 27,900 26,900 0 0 0% +1,000 +3 7% Local Government 28,000 28,700 27,700 -700 -2 4% +300 +1 .1%
22 SC Department of Employment and Workforce Labor Market Information Division Columbia, South Carolina 29202
NONFARM PAYROLL BY ECONOMIC SECTOR COLUMBIA MSA
JULY 2023 (NOT SEASONALLY ADJUSTED)
Current month’s estimates are preliminary. All data are subject to revision.
JUNE 2023 TO JULY 2023 JULY 2022 TO JULY 2023 JULY 2023 JUNE 2023 JULY 2022 # CHANGE % CHANGE # CHANGE % CHANGE Total Nonfarm 417,300 416,400 411,100 +900 +0.2% +6,200 +1.5% Total Private 335,900 334,800 331,400 +1,100 +0 3% +4,500 +1 4% Goods Producing 49,400 49,400 49,100 0 0 0% +300 +0 6% Service-Providing 367,900 367,000 362,000 +900 +0 2% +5,900 +1 6% Private Service Providing 286,500 285,400 282,300 +1,100 +0 4% +4,200 +1 5% Mining, Logging and Construction 17,000 17,100 17,100 -100 -0 .6% -100 -0 .6% Manufacturing 32,400 32,300 32,000 +100 +0 3% +400 +1 3% Trade, Transportation, and Utilities 76,500 76,500 76,500 0 0 0% 0 0 0% Wholesale Trade 16,100 16,000 16,100 +100 +0 6% 0 0 0% Retail Trade 43,500 43,500 44,200 0 0 0% -700 -1 .6% Transportation, Warehousing, and Utilities 16,900 17,000 16,200 -100 -0 6% +700 +4 3% Information 5,500 5,500 5,100 0 0 0% +400 +7 8% Financial Activities 36,600 36,800 35,500 -200 -0 5% +1,100 +3 1% Credit Intermediation and Related Activities including Monetary Authorities - Central Bank 7,700 7,800 7,700 -100 -1 3% 0 0 0% Professional and Business Services 56,700 57,300 57,400 -600 -1 0% -700 -1 2% Administrative and Support and Waste Management 30,700 31,600 31,700 -900 -2 8% -1,000 -3 2% Education and Health Services 53,200 51,800 52,100 +1,400 +2 7% +1,100 +2 1% Leisure and Hospitality 40,200 39,800 38,700 +400 +1 0% +1,500 +3 9% Food Services and Drinking Places 33,300 33,100 32,000 +200 +0 6% +1,300 +4 1% Other Services 17,800 17,700 17,000 +100 +0 6% +800 +4 7% Government 81,400 81,600 79,700 -200 -0 2% +1,700 +2 1% Federal Government 11,500 11,400 11,000 +100 +0 .9% +500 +4 .5% State Government 34,500 34,700 33,800 -200 -0 6% +700 +2 1% Local Government 35,400 35,500 34,900 -100 -0 3% +500 +1 4%
23 dew.sc.gov scworkforceinfo.com
NONFARM PAYROLL BY ECONOMIC SECTOR
GREENVILLE-ANDERSON-MAULDIN MSA
JULY 2023 (NOT SEASONALLY ADJUSTED)
Current month’s estimates are preliminary. All data are subject to revision.
JUNE 2023 TO JULY 2023 JULY 2022 TO JULY 2023 JULY 2023 JUNE 2023 JULY 2022 # CHANGE % CHANGE # CHANGE % CHANGE Total Nonfarm 454,800 460,000 448,000 -5,200 -1.1% +6,800 +1.5% Total Private 396,400 399,800 389,100 -3,400 -0 9% +7,300 +1 9% Goods Producing 82,700 83,200 83,400 -500 -0 6% -700 -0 8% Service-Providing 372,100 376,800 364,600 -4,700 -1 2% +7,500 +2 1% Private Service Providing 313,700 316,600 305,700 -2,900 -0 9% +8,000 +2 6% Mining, Logging and Construction 22,200 22,500 21,500 -300 -1 3% +700 +3 3% Manufacturing 60,500 60,700 61,900 -200 -0 3% -1,400 -2 3% Trade, Transportation, and Utilities 84,700 84,300 81,800 +400 +0 5% +2,900 +3 5% Wholesale Trade 20,100 19,900 20,500 +200 +1 0% -400 -2 0% Retail Trade 49,100 48,900 46,800 +200 +0 4% +2,300 +4 9% Transportation, Warehousing, and Utilities 15,500 15,500 14,500 0 0 0% +1,000 +6 9% Information 7,700 7,700 7,100 0 0 0% +600 +8 5% Financial Activities 22,400 22,400 21,500 0 0 0% +900 +4 2% Professional and Business Services 74,000 76,300 76,100 -2,300 -3 0% -2,100 -2 8% Professional, Scientific, and Technical Services 27,600 27,200 27,200 +400 +1 5% +400 +1 5% Management of Companies and Enterprises 6,500 6,500 6,700 0 0 .0% -200 -3 .0% Administrative and Support and Waste Management 39,900 42,600 42,200 -2,700 -6 3% -2,300 -5 5% Education and Health Services 57,900 58,600 56,200 -700 -1 2% +1,700 +3 0% Educational Services 11,300 11,400 11,100 -100 -0 9% +200 +1 8% Health Care and Social Assistance 46,600 47,200 45,100 -600 -1 3% +1,500 +3 3% Leisure and Hospitality 51,100 51,400 47,600 -300 -0 6% +3,500 +7 4% Other Services 15,900 15,900 15,400 0 0 0% +500 +3 2% Government 58,400 60,200 58,900 -1,800 -3 0% -500 -0 8% Federal Government 3,100 3,100 3,000 0 0 0% +100 +3 3% State Government 11,800 11,900 13,000 -100 -0 8% -1,200 -9 2% Local Government 43,500 45,200 42,900 -1,700 -3 .8% +600 +1 4%
24 SC Department of Employment and Workforce Labor Market Information Division Columbia, South Carolina 29202
NONFARM PAYROLL BY ECONOMIC SECTOR
MYRTLE BEACH-CONWAY-NORTH MYRTLE BEACH MSA
JULY 2023 (NOT SEASONALLY ADJUSTED)
Current month’s estimates are preliminary. All data are subject to revision.
JUNE 2023 TO JULY 2023 JULY 2022 TO JULY 2023 JULY 2023 JUNE 2023 JULY 2022 # CHANGE % CHANGE # CHANGE % CHANGE Total Nonfarm 197,400 198,800 191,200 -1,400 -0.7% +6,200 +3.2% Total Private 173,800 173,900 168,600 -100 -0 1% +5,200 +3 1% Goods Producing 17,900 18,100 17,300 -200 -1 1% +600 +3 .5% Service-Providing 179,500 180,700 173,900 -1,200 -0 7% +5,600 +3 2% Private Service Providing 155,900 155,800 151,300 +100 +0 1% +4,600 +3 0% Mining, Logging and Construction 12,400 12,600 11,900 -200 -1 6% +500 +4 2% Manufacturing 5,500 5,500 5,400 0 0 0% +100 +1 9% Trade, Transportation, and Utilities 40,900 41,300 41,600 -400 -1 0% -700 -1 7% Wholesale Trade 3,700 3,600 3,700 +100 +2 8% 0 0 0% Retail Trade 31,800 32,300 32,800 -500 -1 5% -1,000 -3 0% Transportation, Warehousing, and Utilities 5,400 5,400 5,100 0 0 0% +300 +5 9% Information 3,000 3,000 3,100 0 0 0% -100 -3 2% Financial Activities 12,300 11,900 11,100 +400 +3 4% +1,200 +10 8% Professional and Business Services 18,800 19,000 18,700 -200 -1 1% +100 +0 5% Education and Health Services 22,200 22,000 20,500 +200 +0 9% +1,700 +8 3% Leisure and Hospitality 52,000 51,800 49,800 +200 +0 .4% +2,200 +4 4% Accommodation and Food Services 45,300 45,000 42,000 +300 +0 7% +3,300 +7 9% Food Services and Drinking Places 37,000 36,700 32,500 +300 +0 8% +4,500 +13 8% Other Services 6,700 6,800 6,500 -100 -1 5% +200 +3 1% Government 23,600 24,900 22,600 -1,300 -5 2% +1,000 +4 4% Federal Government 1,600 1,600 1,400 0 0 0% +200 +14 3% State Government 4,400 4,400 4,400 0 0 0% 0 0 0% Local Government 17,600 18,900 16,800 -1,300 -6 .9% +800 +4 .8%
25 dew.sc.gov scworkforceinfo.com
NONFARM PAYROLL BY ECONOMIC SECTOR SPARTANBURG MSA
JULY 2023 (NOT SEASONALLY ADJUSTED)
Current month’s estimates are preliminary. All data are subject to revision.
JUNE 2023 TO JULY 2023 JULY 2022 TO JULY 2023 JULY 2023 JUNE 2023 JULY 2022 # CHANGE % CHANGE # CHANGE % CHANGE Total Nonfarm 170,200 171,600 165,100 -1,400 -0.8% +5,100 +3.1% Total Private 143,100 143,200 139,700 -100 -0 1% +3,400 +2 4% Goods Producing 46,300 46,300 45,500 0 0 0% +800 +1 8% Service-Providing 123,900 125,300 119,600 -1,400 -1 1% +4,300 +3 6% Private Service Providing 96,800 96,900 94,200 -100 -0 1% +2,600 +2 8% Mining, Logging and Construction 7,800 7,700 7,600 +100 +1 3% +200 +2 6% Manufacturing 38,500 38,600 37,900 -100 -0 3% +600 +1 6% Durable Goods 26,700 26,700 26,100 0 0 0% +600 +2 3% Non-Durable Goods 11,800 11,900 11,800 -100 -0 8% 0 0 0% Transportation, Warehousing, and Utilities 37,400 37,200 36,500 +200 +0 5% +900 +2 5% Wholesale Trade 8,200 8,100 8,400 +100 +1 .2% -200 -2 4% Retail Trade 17,500 17,300 17,000 +200 +1 2% +500 +2 9% Transportation, Warehousing, and Utilities 11,700 11,800 11,100 -100 -0 8% +600 +5 4% Information 900 900 900 0 0 0% 0 0 0% Financial Activities 5,300 5,300 5,200 0 0 0% +100 +1 9% Professional and Business Services 17,100 17,100 17,100 0 0 0% 0 0 0% Education and Health Services 15,500 15,500 14,700 0 0 0% +800 +5 4% Leisure and Hospitality 15,000 15,200 14,400 -200 -1 3% +600 +4 2% Other Services 5,600 5,700 5,400 -100 -1 .8% +200 +3 7% Government 27,100 28,400 25,400 -1,300 -4 6% +1,700 +6 7% Federal Government 700 700 600 0 0 0% +100 +16 7% State Government 3,600 3,600 3,600 0 0 0% 0 0 0% Local Government 22,800 24,100 21,200 -1,300 -5 4% +1,600 +7 5%
26 SC Department of Employment and Workforce Labor Market Information Division Columbia, South Carolina 29202
NONFARM PAYROLL BY ECONOMIC SECTOR FLORENCE MSA
JULY 2023 (NOT SEASONALLY ADJUSTED)
JULY 2023 (NOT SEASONALLY ADJUSTED)
(NOT SEASONALLY ADJUSTED)
JUNE 2023 TO JULY 2023 JULY 2022 TO JULY 2023 JULY 2023 JUNE 2023 JULY 2022 # CHANGE % CHANGE # CHANGE % CHANGE Total Nonfarm 96,300 96,500 92,800 -200 -0.2% +3,500 +3.8% Total Private 79,000 78,800 76,600 +200 +0 3% +2,400 +3 1% Goods Producing 15,800 15,800 15,100 0 0 0% +700 +4 6% Service-Providing 80,500 80,700 77,700 -200 -0 2% +2,800 +3 6% Private Service Providing 63,200 63,000 61,500 +200 +0 3% +1,700 +2 8% Trade, Transportation, and Utilities 21,200 20,900 20,600 +300 +1 4% +600 +2 9% Government 17,300 17,700 16,200 -400 -2 3% +1,100 +6 8% Federal Government 700 700 700 0 0 0% 0 0 0% State Government 4,500 4,600 4,200 -100 -2 2% +300 +7 1% Local Government 12,100 12,400 11,300 -300 -2 4% +800 +7 1%
HILTON HEAD ISLAND-BLUFFTON-BEAUFORT MSA
JUNE 2023 TO JULY 2023 JULY 2022 TO JULY 2023 JULY 2023 JUNE 2023 JULY 2022 # CHANGE % CHANGE # CHANGE % CHANGE Total Nonfarm 89,200 88,900 87,100 +300 +0.3% +2,100 +2.4% Total Private 77,900 77,500 75,900 +400 +0 5% +2,000 +2 6% Goods Producing 8,000 7,900 7,800 +100 +1 3% +200 +2 6% Service-Providing 81,200 81,000 79,300 +200 +0 2% +1,900 +2 4% Private Service Providing 69,900 69,600 68,100 +300 +0 4% +1,800 +2 6% Government 11,300 11,400 11,200 -100 -0 9% +100 +0 9%
JULY 2023
JUNE 2023 TO JULY 2023 JULY 2022 TO JULY 2023 JULY 2023 JUNE 2023 JULY 2022 # CHANGE % CHANGE # CHANGE % CHANGE Total Nonfarm 39,700 39,800 39,100 -100 -0.3% +600 +1.5% Total Private 34,000 33,900 33,300 +100 +0 3% +700 +2 1% Goods Producing 10,000 10,100 9,700 -100 -1 0% +300 +3 1% Service-Providing 29,700 29,700 29,400 0 0 0% +300 +1 0% Private Service Providing 24,000 23,800 23,600 +200 +0 8% +400 +1 7% Manufacturing 7,300 7,300 7,200 0 0 0% +100 +1 4% Government 5,700 5,900 5,800 -200 -3 4% -100 -1 7% Federal Government 1,300 1,300 1,300 0 0 0% 0 0 0% State Government 1,200 1,200 1,200 0 0 0% 0 0 0% Local Government 3,200 3,400 3,300 -200 -5 9% -100 -3 0% 27 dew.sc.gov scworkforceinfo.com
SUMTER MSA
LONG-RUN TRENDS
ANNUAL LOCAL AREA UNEMPLOYMENT STATISTICS DATA 1976-2022
YEAR CIVILIAN NON-INSTITUTIONAL POPULATION LABOR FORCE PARTICIPATION RATE (PERCENT) EMPLOYMENT-POPULATION RATIO (PERCENT) LABOR FORCE EMPLOYMENT UNEMPLOYMENT UNEMPLOYMENT RATE (PERCENT) 1976 2,007,417 64 7% 60 2% 1,299,241 1,207,662 91,579 7 0% 1977 2,061,250 64 4% 60 0% 1,327,423 1,237,495 89,928 6 8% 1978 2,117,667 64 1% 60 5% 1,356,921 1,281,597 75,324 5 6% 1979 2,169,417 63 4% 60 2% 1,375,201 1,306,773 68,428 5 0% 1980 2,221,250 62 8% 58 6% 1,395,675 1,301,796 93,879 6 7% 1981 2,266,583 63 2% 58 0% 1,432,219 1,314,907 117,312 8 2% 1982 2,307,333 64 2% 57 3% 1,482,373 1,322,883 159,490 10 8% 1983 2,341,083 63 2% 56 9% 1,479,137 1,333,162 145,975 9 9% 1984 2,378,500 62 9% 58 5% 1,495,188 1,391,286 103,902 6 9% 1985 2,426,500 63 8% 59 5% 1,548,924 1,443,612 105,312 6 8% 1986 2,455,333 64 9% 60 7% 1,592,306 1,491,069 101,237 6 4% 1987 2,495,333 65 4% 61 8% 1,631,897 1,542,170 89,727 5 5% 1988 2,533,000 65 6% 62 5% 1,660,533 1,583,928 76,605 4 6% 1989 2,566,000 66 0% 62 9% 1,693,438 1,615,009 78,429 4 6% 1990 2,611,843 66 5% 63 3% 1,737,831 1,652,949 84,882 4 9% 1991 2,663,759 66 3% 62 3% 1,767,123 1,659,196 107,927 6 1% 1992 2,699,745 66 7% 62 2% 1,799,677 1,678,803 120,874 6 7% 1993 2,739,480 66 7% 61 8% 1,826,650 1,693,483 133,167 7 3% 1994 2,775,049 66 4% 62 3% 1,841,428 1,727,714 113,714 6 2% 1995 2,813,952 66 2% 62 8% 1,864,221 1,768,540 95,681 5 1% 1996 2,851,104 66 2% 62 4% 1,886,064 1,779,221 106,843 5 7% 1997 2,897,839 66 3% 63 3% 1,920,244 1,834,337 85,907 4 5% 1998 2,945,825 65 9% 63 5% 1,940,846 1,870,270 70,576 3 6% 1999 2,989,560 65 5% 62 8% 1,958,598 1,877,345 81,253 4 1% 2000 3,027,367 64 9% 62 5% 1,965,481 1,892,559 72,922 3 7% 2001 3,064,191 63 4% 60 0% 1,941,956 1,839,246 102,710 5 3% 2002 3,098,739 63 1% 59 0% 1,954,548 1,828,735 125,813 6 4% 2003 3,133,915 63 8% 59 2% 1,999,485 1,855,599 143,886 7 2% 2004 3,178,645 64 3% 59 5% 2,043,864 1,891,722 152,142 7 4% 2005 3,234,049 64 0% 59 4% 2,071,111 1,919,644 151,467 7 3% 2006 3,305,437 65 0% 60 5% 2,148,698 2,001,245 147,453 6 9% 2007 3,374,548 63 9% 60 0% 2,155,198 2,024,493 130,705 6 1% 2008 3,439,974 62 8% 58 2% 2,160,084 2,002,903 157,181 7 3% 2009 3,490,448 62 1% 55 0% 2,166,737 1,919,307 247,430 11 4% 2010 3,564,619 61 0% 54 1% 2,174,535 1,928,442 246,093 11 3% 2011 3,612,048 60 5% 54 2% 2,185,171 1,957,493 227,678 10 4% 2012 3,655,515 59 9% 54 5% 2,190,203 1,992,957 197,246 9 0% 2013 3,704,281 59 3% 54 9% 2,197,876 2,034,404 163,472 7 4% 2014 3,759,002 59 1% 55 4% 2,222,426 2,082,941 139,485 6 3% 2015 3,822,409 59 3% 55 8% 2,267,837 2,134,087 133,750 5 9% 2016 3,888,005 58 8% 55 9% 2,286,054 2,174,301 111,753 4 9% 2017 3,897,645 58 0% 55 6% 2,261,766 2,166,708 95,058 4 2% 2018 3,948,448 57 8% 55 9% 2,282,022 2,205,356 76,666 3 4% 2019 4,002,601 58 1% 56 5% 2,324,500 2,259,807 64,693 2 8% 2020 4,062,556 57 5% 54 0% 2,335,026 2,195,171 139,855 6 0% 2021 4,124,126 57 1% 54 8% 2,353,968 2,261,060 92,908 3 9% 2022 4,204,317 56 5% 54 7% 2,374,975 2,297,927 77,048 3 2% 28 SC Department of Employment and Workforce Labor Market Information Division Columbia, South Carolina 29202
ANNUAL CURRENT EMPLOYMENT STATISTICS NONFARM PAYROLL 1939-2022
YEAR EMPLOYMENT YEAR EMPLOYMENT YEAR EMPLOYMENT YEAR EMPLOYMENT 1939 310,100 1960 582,500 1981 1,196,500 2002 1,795,400 1940 328,600 1961 587,000 1982 1,162,300 2003 1,799,100 1941 387,500 1962 609,800 1983 1,189,000 2004 1,826,600 1942 416,500 1963 630,600 1984 1,262,500 2005 1,862,900 1943 428,500 1964 651,500 1985 1,296,200 2006 1,905,700 1944 408,600 1965 686,000 1986 1,338,000 2007 1,945,000 1945 396,000 1966 734,900 1987 1,392,200 2008 1,926,300 1946 411,600 1967 754,500 1988 1,449,000 2009 1,814,400 1947 436,200 1968 782,900 1989 1,499,700 2010 1,811,300 1948 456,400 1969 819,800 1990 1,527,600 2011 1,832,500 1949 443,100 1970 842,000 1991 1,497,300 2012 1,864,300 1950 461,400 1971 862,600 1992 1,511,800 2013 1,901,000 1951 505,800 1972 920,300 1993 1,553,000 2014 1,951,300 1952 544,300 1973 984,000 1994 1,592,000 2015 2,006,700 1953 543,900 1974 1,015,800 1995 1,636,300 2016 2,055,300 1954 519,700 1975 982,600 1996 1,669,400 2017 2,096,100 1955 533,000 1976 1,038,100 1997 1,718,800 2018 2,154,800 1956 542,900 1977 1,081,700 1998 1,779,800 2019 2,189,600 1957 545,000 1978 1,137,500 1999 1,826,300 2020 2,082,300 1958 545,900 1979 1,176,000 2000 1,854,000 2021 2,154,600 1959 566,900 1980 1,188,800 2001 1,814,800 2022 2,243,500 ANNUAL CURRENT EMPLOYMENT STATISTICS NONFARM PAYROLL 2007-2022 AVERAGE WEEKLY EARNINGS AVERAGE WEEKLY HOURS AVERAGE HOURLY EARNINGS 2007 $675 36 36 0 $18 76 2008 $669 28 35 6 $18 80 2009 $665 55 34 7 $19 18 2010 $692 17 34 8 $19 89 2011 $716 18 34 8 $20 58 2012 $705 16 35 1 $20 09 2013 $716 .15 34 .9 $20 52 2014 $726 23 34 5 $21 05 2015 $743 27 34 7 $21 42 2016 $762 80 34 5 $22 11 2017 $791 99 34 6 $22 89 2018 $829 36 34 6 $23 97 2019 $852 84 34 5 $24 72 2020 $888 31 34 1 $26 05 2021 $925 .41 34 3 $26 98 2022 $972 90 34 5 $28 20 29 dew.sc.gov scworkforceinfo.com
Technical Notes
1 . Household Survey: Nationally, there is a monthly Current Population Survey of about 60,000 households conducted by the Census Bureau for the Bureau of Labor Statistics (BLS) to determine employment status of the civilian population This information, along with other inputs, are used by DEW to operate the Local Area Unemployment Statistics program, which estimates the number of individuals employed and those not employed, but actively seeking employment for statewide and a variety of sub-state geographies
2 Employer Survey: BLS conducts a monthly Current Employment Statistics survey of about 44,000 employers which yields national estimates of nonagricultural wage and salary employment, hours, and earnings by industry This data is processed by DEW to generate comparable data for the state and its metropolitan statistical areas
3 . Seasonally Adjusted: Seasonal adjustment removes the effects of events that follow a regular pattern each year (i e tourist-related hiring and school closings in the summer) These adjustments make it easier to observe the cyclical and other nonseasonal movements in data over time
4 . Not Seasonally Adjusted: Effects of regular or seasonal patterns have not been removed from this data
CURRENT EMPLOYMENT STATISTICS (CES)
LOCAL AREA UNEMPLOYMENT STATISTICS (LAUS)
Counts Jobs
Counts People
Utilizes an Establishment Survey
Reference week is the Pay Period that includes the 12th of the month
A job held by a person on unpaid leave during the reference week is not counted since they are not receiving pay
Does not count selfemployed workers
Does not include agricultural workers
The Current Population Survey (CPS), which is a Household Survey, is used to calculate LAUS
Reference week is the Calendar Week that includes the 12th of the month
A person on unpaid leave is counted as employed because they will return to their job
Does count self-employed workers
Includes both agricultural and non-agricultural workers
Does not count unpaid family workers
Counts unpaid family workers if they worked at least 15 unpaid hours for a family business or family farm during the reference week
Workers on strike during the entire reference period are not counted
Workers on strike during the reference week are counted as employed in LAUS
Data is published by Industry Data is published by County
30 SC Department of Employment and Workforce Labor Market Information Division Columbia, South Carolina 29202
Do you need some help finding the data you need? Have a great idea for a research project you’d like to discuss with someone? We love to collaborate!
32 SC Department of Employment and Workforce Labor Market Information Division Columbia, South Carolina 29202 Find more information at scworkforceinfo.com
DATA TRENDS is prepared by the LMI Division of the S C Department of Employment and Workforce with funding provided by the US Department of Labor Featured data is prepared in conjunction with the Bureau of Labor Statistics and current month estimates are always preliminary, with all previous data subject to revision Interested in staying up to date with Trends as it’s released? Subscribe by clicking here!
