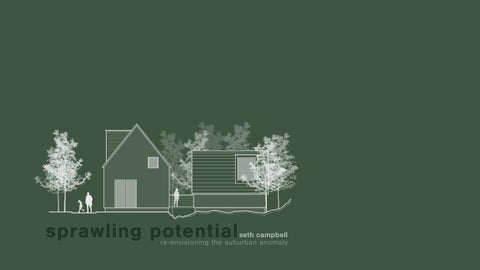
sprawling potential
seth campbell re-envisioning the suburban anomaly
Campbell
Architectural Design Studio 7
1
Exercise Two Suburban Critique Unplanned Vacations Proposal
Exercise Three
sprawling potential
seth campbell re-envisioning the suburban anomaly
Commercial Business Critique Small Business Analysis Unit, Group, System Proposal
Master Thesis Proposal Happy Valley Neighborhood Project Brief
Exercise 2: Suburban Critique
Figure 1: Missing Middle Diagram
Critique: Missing Middle Housing The household and cultural demographics of the United States have shifted dramatically, nearly 30% of all households are now single-person.5 By 2035, 1 in 5 Americans will be over the age of 65 and households without children will make up 84% of households by 2025. Further, Baby boomers and millennial are increasingly saying no to the suburbs and choosing a walk able urban lifestyle.6 Prior to the Great Recession, the ratio of new population to home construction was about 2:1, meaning two people were added to the population for every new home built. That ratio increased to 5:1 after home construction dropped more than 50% after 2007. The US hit the lowest point for home construction in the past two decades in 2011, with 483,000 homes built that year. After hitting bottom, the pace of home construction increased each year through 2020. The decrease puts housing construction the closest it’s been to population growth in the past 20 years.7 Are single family homes the best option for building to meet population demand?
Figure 1.1: Middle Housing Sizes Diagram 5 US Census Bureau, “Housing Data,” Census.gov, November 22, 2021, https://www.census.gov/topics/housing.html. 6 Daniel G. Parolek, Missing Middle Housing: Thinking Big and Building Small to Respond to Today’s Housing Crisis (Washington, DC: Island Press, 2020). 7 US Census Bureau, “Population Growth,” USAFacts (USAFacts, July 13, 2021), https://usafacts.org/articles/population- growth-has-outpaced-home-construction-for-20-years/. Figure 1 Daniel G. Parolek, Page 12 Figure 1.1 Daniel G. Parolek, Page 9 Figure 1.2 Photo by Blake Wheeler
Figure 1.2: Current Single Family Housing Model
Campbell
Architectural Design Studio 7
3
Exercise 2: Suburban Critique
Figure 1: Missing Middle Diagram
Critique: Missing Middle Housing On the other side of Figure 1.3, there is the mid rise and high rise option for most individuals that live in denser areas. However, these units are often rented and not as friendly for larger families. They are only built towards city centers and urban areas which restrict living opportunities for most people. High rises are also not depicted in a like able sense. They strip people away from the street, separate individuals from the human scale, they reduce encounters and opportunities to meet people. High rises tend to attract gentrification and inequality. According to Suzanne H. Crowhurst Lennard, co-founder and director of the Making Cities Livable International Council, “the construction industry is a powerful engine for fueling economic development. Tall buildings offer increased profits for developers. However, the higher a building rises, the more expensive is the construction. Thus, the tallest buildings tend to be luxury units, often for global investors. Tall buildings inflate the price of adjacent land, thus making the protection of historic buildings and affordable housing less achievable. In this way, they increase inequality.”8 Figure 1.1: Middle Housing Sizes Diagram 8 Bloomingrock, “7 Reasons Why High-Rises Kill Livability,” Smart Cities Dive, accessed December 1, 2021, https://www. smartcitiesdive.com/ex/ sustainablecitiescollective/7-reasons-why-high-rises-killlivability/561536/. Figure 1 Daniel G. Parolek, Page 12 Figure 1.1 Daniel G. Parolek, Page 9 Figure 1.3 Rendering by Micheal Green Architecture
Figure 1.3: Envisioned Residential High Rise
Campbell
Architectural Design Studio 7
4
Exercise 2: Unplanned Vacations Proposal
Figure 2: Housing Sizes Diagram
Exercise Two: Unplanned Vacations The suburban houses are simply designed for the single family households. The United States have millions of families but it only makes up 29% of all households in America. Single parent households make up 12%, other family members and roommates make up 21%, adults above 18 living with their parents make up 17%, and people living alone make up 10%.9 The typical 2,500 sqf house is too big and sometimes too small for many families. It is clear that the American Demographic is not completely fitting the single family dominant model anymore and is also not cheering on high rise development as the answer. There seems to be a missing middle model that is the answer. Duplexes, Courtyard Apartments, Townhouses, and Lowrise Mixed Use buildings are all viable options for people to easily obtain an affordable place to live. The goal of these homes to create a sustainable, affordable, attainable, and comfortable place to live for all kinds of household types in the United States. So the question becomes, can there be a suburban block that is designed to create the opportunities for any household type to efficiently fit into a house? Can the household size vary in the block? Can lawn size and design vary? Garage space vary? By designing a varying styles of housing types, home buyers will have a better stay at a home and fit better in their community. 9 US Census Bureau, “Population Growth,” USAFacts (USAFacts, July 13, 2021), https://usafacts.org/articles/population- growth-has-outpaced-home-construction-for-20-years/. Figure 2 Housing Sizes Diagram drawn by Author Figure 2.1 Master Plan drawn by Author
Figure 2.1: Current Suburban Model & Envisisioned Neighborhood Design
Campbell
Architectural Design Studio 7
5
Exercise 2: Unplanned Vacations Proposal
Figure 2: Housing Sizes Diagram
Exercise Two: Unplanned Vacations The first step is to redesign the block. The diagrams to the right illustrate the three design moves that changed to module. First rotating the parcel orientation allows for a more dense block. Second, using varying houses to shape space with the gable roofs. The third move involves shrinking some parcels to create secondary pathways that move in between properties. This encourages interior circulation and the ability to use the alley way as a front entrance for some homes. One of the goals for the re-envisioned master plan was to allow for flexibility when it comes to household sizes, lawn sizes, garage sizes but also public spaces. In the plan above there is a park on the north side. This is not the only option for the blocks. There can be a block filled with just houses, larger housing complexes like duplexes, quadplexes, or mix use buildings. The goal is to fit multiple blocks together and each block houses amenities for the surrounding households. A small school complex and fit into the area, or a small business center. In order for this to be completed zoning laws will have to be adjusted and have the ability to change in the future.
Figure 2.2 Parcel Reorganization Diagram drawn by Author Figure 2.3 Interior Circulation Diagram drawn by Author Figure 2.4 Gable Roof Massing Diagram drawn by Author
Figure 2.2: Parcel Reorganization Diagram
Campbell
Architectural Design Studio 7
6
Exercise 2: Unplanned Vacations Proposal
Figure 2: Housing Sizes Diagram
Exercise Two: Unplanned Vacations The first step is to redesign the block. The diagrams to the right illustrate the three design moves that changed to module. First rotating the parcel orientation allows for a more dense block. Second, using varying houses to shape space with the gable roofs. The third move involves shrinking some parcels to create secondary pathways that move in between properties. This encourages interior circulation and the ability to use the alley way as a front entrance for some homes. One of the goals for the re-envisioned master plan was to allow for flexibility when it comes to household sizes, lawn sizes, garage sizes but also public spaces. In the plan above there is a park on the north side. This is not the only option for the blocks. There can be a block filled with just houses, larger housing complexes like duplexes, quadplexes, or mix use buildings. The goal is to fit multiple blocks together and each block houses amenities for the surrounding households. A small school complex and fit into the area, or a small business center. In order for this to be completed zoning laws will have to be adjusted and have the ability to change in the future.
Figure 2.2 Parcel Reorganization Diagram drawn by Author Figure 2.3 Interior Circulation Diagram drawn by Author Figure 2.4 Gable Roof Massing Diagram drawn by Author
Figure 2.3: Interior Circulation Diagram
Campbell
Architectural Design Studio 7
7
Exercise 2: Unplanned Vacations Proposal
Figure 2: Housing Sizes Diagram
Exercise Two: Unplanned Vacations The first step is to redesign the block. The diagrams to the right illustrate the three design moves that changed to module. First rotating the parcel orientation allows for a more dense block. Second, using varying houses to shape space with the gable roofs. The third move involves shrinking some parcels to create secondary pathways that move in between properties. This encourages interior circulation and the ability to use the alley way as a front entrance for some homes. One of the goals for the re-envisioned master plan was to allow for flexibility when it comes to household sizes, lawn sizes, garage sizes but also public spaces. In the plan above there is a park on the north side. This is not the only option for the blocks. There can be a block filled with just houses, larger housing complexes like duplexes, quadplexes, or mix use buildings. The goal is to fit multiple blocks together and each block houses amenities for the surrounding households. A small school complex and fit into the area, or a small business center. In order for this to be completed zoning laws will have to be adjusted and have the ability to change in the future.
Figure 2.2 Parcel Reorganization Diagram drawn by Author Figure 2.3 Interior Circulation Diagram drawn by Author Figure 2.4 Gable Roof Massing Diagram drawn by Author
Figure 2.4: Gable Roof Massing Diagram
Campbell
Architectural Design Studio 7
8
Exercise 2: Unplanned Vacations Proposal
Figure 2: Housing Sizes Diagram
Exercise Two: Unplanned Vacations The first step is to redesign the block. The diagrams to the right illustrate the three design moves that changed to module. First rotating the parcel orientation allows for a more dense block. Second, using varying houses to shape space with the gable roofs. The third move involves shrinking some parcels to create secondary pathways that move in between properties. This encourages interior circulation and the ability to use the alley way as a front entrance for some homes. One of the goals for the re-envisioned master plan was to allow for flexibility when it comes to household sizes, lawn sizes, garage sizes but also public spaces. In the plan above there is a park on the north side. This is not the only option for the blocks. There can be a block filled with just houses, larger housing complexes like duplexes, quadplexes, or mix use buildings. The goal is to fit multiple blocks together and each block houses amenities for the surrounding households. A small school complex and fit into the area, or a small business center. In order for this to be completed zoning laws will have to be adjusted and have the ability to change in the future.
Figure 2.1 Master Plan drawn by Author
Figure 2.1: Current Suburban Model & Envisisioned Neighborhood Design
Campbell
Architectural Design Studio 7
9
Exercise 2: Unplanned Vacations Proposal
Figure 2: Housing Sizes Diagram
Exercise Two: Unplanned Vacations Entrances can be open and public, giving the owners benefit for when they host their neighbors for dinner. Entrances can also be tucked away in between masses that creates a more intimate entrance. Side yards and back yards can be shaped the same way. Lawns can stretch between public sidewalks, encouraging play and friendship. Housing masses can fabricate an intimate back courtyard between the home and ADU. The goal is to create a unique and never ending list of block variations. Suburban blocks will have all the same parts but not one will look exactly the same. The re-envisioned suburban block needs to look like the real American household demographics. The design is considering the single family household but also giving opportunity to multi generational families, roommate households, those who live along, couples with no children, and elderly individuals or couples above the age of 65. The home is such a big part of individuals lives so it is crucial to create a welcoming and comfortable community for people to live, work, and play.
Figure 2.5: Neighborhood Section A
Figure 2.6: Neighborhood Section 2 Figure 2.5: Neighborhood Section A drawn by Author Figure 2.6: Neighborhood Section B drawn by Author
Campbell
Architectural Design Studio 7
10
Exercise 2: Unplanned Vacations Proposal
Figure 2: Housing Sizes Diagram
Exercise Two: Unplanned Vacations Entrances can be open and public, giving the owners benefit for when they host their neighbors for dinner. Entrances can also be tucked away in between masses that creates a more intimate entrance. Side yards and back yards can be shaped the same way. Lawns can stretch between public sidewalks, encouraging play and friendship. Housing masses can fabricate an intimate back courtyard between the home and ADU. The goal is to create a unique and never ending list of block variations. Suburban blocks will have all the same parts but not one will look exactly the same. The re-envisioned suburban block needs to look like the real American household demographics. The design is considering the single family household but also giving opportunity to multi generational families, roommate households, those who live along, couples with no children, and elderly individuals or couples above the age of 65. The home is such a big part of individuals lives so it is crucial to create a welcoming and comfortable community for people to live, work, and play.
Figure 2.7 Envisioned Neighborhood View drawn by the Author
Figure 2.7: Envisioned Neighborhood View
Campbell
Architectural Design Studio 7
11
Exercise 3: Small Business Critique
Figure 3: Varying Small Business Sizes Diagram
Exercise Three: Small Business Critique The low success rate is the first critic. The U.S. Census Bureau’s Business Dynamics Statistics reveal that over the last 25 years, an average of one in every 12 employer firms closes down every year.10 The number of startups is slightly more than the number of closures each year. For example, in 2015, the number of startups launched were 414,000. Business closures in that year totaled 396,000.11 The most common reason for business closure is “low sales/low cash flow”. It’s important to understand that a change in market demand could cause a drop in sales. Customers may no longer need the product that is being sold or the services that are provided. This will lead to flagging sales and cash flow issues. Its customer service record may be poor. If sales decline for an extended period, the company may start running short of cash. Ultimately, it may not have the funds to buy inventory or pay its creditors. This could lead to the company closing down. Secondly, The upstream of a big-box store creates very few jobs for the local economy and the downstream ripple effects are terrible because retail jobs are overwhelmingly part-time and poverty-wage, with no health care. That means most retail workers have very small disposable incomes: after paying for bare necessities, they have little left with which to stimulate the local economy.
10 U.S Census Bureau, “Business and Economy,” Census.gov, November 24, 2021, https://www.census.gov/topics/business-economy. html. 11 Schaefer, “Why Small Businesses Fail,” ZenBusiness Inc., October 8, 2021, https://www.zenbusinescom/blog/why-small-businesses-fail/ Figure 3: Varying Small Business Diagram drawn by Author Figure 3.1: Business Power Struggle Diagram drawn by Author
Figure 3.1: Business Power Struggle Diagram
Campbell
Architectural Design Studio 7
12
Exercise 3: Small Business Critique
Figure 3: Varying Small Business Sizes Diagram
Exercise Three: Small Business Critique The average American is traveling 26 minutes to their job. The longest commute time since the Census started tracking it in 1980, up 20 percent. Commutes longer than 45 minutes are up 12 percent in that time span, and 90 minute one-way commutes are 64 percent more common than in 1990. The longer your commute, the less time you have for family, friends, exercise and nutrition—and it’s awful for your mental state. A study of more than 34,000 U.S. workers found that people with long commutes are 33 percent more likely to suffer from depression; 12 percent more likely to report work-related stress; 21 percent more likely to be obese; and 46 percent get less than seven hours of sleep each night. Interestingly, 37 percent of people with sizable commutes are more likely to have financial worries—and gas and transit prices are likely to play a big role.13 Could lowering the commute time to work help small business owners save money? Would it benefit small business owners with things other than their finances?
Figure 3.2: Travel Times Diagram
13 US Census US Census Bureau, “Census Bureau Estimates Show Average One-Way Travel Time to Work Rises to All-Time High,” Census. gov, October 8, 2021, https://www.census.gov/newsroom/press-releases/2021/one-way-travel-time-to-work-rises.html. Figure 3: Varying Small Business Diagram drawn by Author Figure 3.2: Travel Times Diagram drawn by Author
Campbell
Architectural Design Studio 7
13
Exercise 3: Small Business Analysis
Figure 3: Varying Small Business Sizes Diagram
Exercise Three: Small Business Analysis The low success rate is the first critic. The U.S. Census Bureau’s Business Dynamics Statistics reveal that over the last 25 years, an average of one in every 12 employer firms closes down every year.10 The number of startups is slightly more than the number of closures each year. For example, in 2015, the number of startups launched were 414,000. Business closures in that year totaled 396,000.11 The most common reason for business closure is “low sales/low cash flow”. It’s important to understand that a change in market demand could cause a drop in sales. Customers may no longer need the product that is being sold or the services that are provided. This will lead to flagging sales and cash flow issues. Its customer service record may be poor. If sales decline for an extended period, the company may start running short of cash. Ultimately, it may not have the funds to buy inventory or pay its creditors. This could lead to the company closing down. Secondly, The upstream of a big-box store creates very few jobs for the local economy and the downstream ripple effects are terrible because retail jobs are overwhelmingly part-time and poverty-wage, with no health care. That means most retail workers have very small disposable incomes: after paying for bare necessities, they have little left with which to stimulate the local economy.
10 U.S Census Bureau, “Business and Economy,” Census.gov, November 24, 2021, https://www. census.gov/topics/business-economy.html. 11 Schaefer, “Why Small Businesses Fail,” ZenBusiness Inc., October 8, 2021, https://www. zenbusinescom/blog/why-small-businesses-fail/ Figure 3: Varying Small Business Diagram drawn by Author Figure 3.3: Current Business/Living Model Diagram drawn by Author
Figure 3.3: Current Business/Living Model
Campbell
Architectural Design Studio 7
14
Exercise 3: Small Business Analysis
Figure 3: Varying Small Business Sizes Diagram
Exercise Three: Small Business Analysis To many, a small business is simply based on the number of employees at an individual business location rather than the total number of employees of a company that may own those businesses. According to the Census Bureau 2018 County Business Patterns survey, more than half (54%) of all employer businesses in 2018 had fewer than five employees but they s only accounted for 5.5% of total employment in all industries.
Should There Be More Levels to Small Business? It should be quick to note that the definition small business is considerably larger than the idea most people have. Small businesses to the public are closely tied to local businesses and companies that have fewer than 15 employees. The question becomes, should there be a more categories of small businesses? Micro businesses? Non employer? Start up? Established small businesses? The diagram above shows the varying degree of small business. From left to right, a single employer wood shop business, a local farmer who sells their product in a small shop, and finally a local coffee shop that employs 5 people. There are different needs and desires for different sizes of small businesses and it should be designed in the archetype to better lay a successful foundation for these businesses. 15 U.S Census Bureau, “Small Business Data,” Census.gov, October 8, 2021, https://www.census.gov/library/stories/2021/01/what-is-asmall-business.html. 16 IRS, “Sole Proprietorships,” Internal Revenue Service, accessed December 1, 2021, https://www.irs.gov/businesses/small-businessesself-employed/sole-proprietorships. Figure 3: Varying Small Business Diagram drawn by Author
Figure 3 Varying Small Business Sizes Diagram
Campbell
Architectural Design Studio 7
15
Exercise 3: Small Business Analysis
Figure 3: Varying Small Business Sizes Diagram
Exercise Three: Small Business Analysis The first business model seen in the commercial field is when clients and customers enter the business for a service or product. These are typically retail stores and office spaces. A typical space for a small store is 1000 sqf, (though it could even be smaller.) A traditional practical length is 50’ deep and 20’ wide. Office spaces need common areas around 80 - 100 sqf, conference rooms 25 - 30 sqf per person, offices around 90 - 150 sqf, and open work stations around 60 - 110 sqf per person.17 The second business model seen is where a business uses its work space as a shop, fabrication lab, studio, etc. and travels to clients or businesses for their field of work. Studio sizes can vary but a standard 120 - 150 sqf studio is a good starting size. For shop and fabrication labs a two car garage (22ft x 22ft) or 484 sqf is a good starting size. A standard auto shop is 24ft x 30ft or 720 sqf and a medium size auto shop is 30ft x 40ft or 1,200 sqf.18
Figure 3.4: In Person Customer/Client & Travel to Customer/Client Business Models
17 Rahman, Fasi Ur “Standard Size of Rooms in Building and Their Locations,” The Constructor, June 2, 2021, https://theconstructor.org/ building/size-room-location-building/13269/. 18 Ibid Rahman, “Standard Size of Rooms in Buildings and Their Locations” Figure 3: Varying Small Business Diagram drawn by Author Figure 3.4: In Person and Travel to Customer Diagram drawn by Author
Campbell
Architectural Design Studio 7
16
Exercise 3: Unit, Group, System Proposal
Figure 3: Varying Small Business Sizes Diagram
Exercise Three: Small Business ABU Archetype
After the critique and analysis it was evident that the neighborhood model discussed in exercise two and small business models could both benefit from each other. The ADU archetype was created in the previous exercise two and could be furthered into an ABU archetype or an Accessible Business Unit. There is potential for varying sizes from a single unit to multiple units creating a small business center in the core of the neighborhood. This means that the varying sizes of small businesses would relate to varying sizes of ABU’s. A start up or micro business would relate better to a detached ABU, whereas an established small business coffee shop could be housed in a grouped ABU unit and a few employees could rent some of the units above. The goal for these ABU’s was to fit into both of the critiques made in this book, the Missing Middle Critique and the Small Business Critique. They would create a more affordable space for small business owners to live and work.
Figure 3.5 Re-envisioned Small Business Model
Figure 3: Varying Small Business Diagram drawn by Author Figure 3.5: Re-envisioned Small Business Model
Campbell
Architectural Design Studio 7
17
Exercise 3: Unit, Group, System Proposal
Figure 3: Varying Small Business Sizes Diagram
Exercise Three: Small Business ABU Archetype
After the critique and analysis it was evident that the neighborhood model discussed in exercise two and small business models could both benefit from each other. The ADU archetype was created in the previous exercise two and could be furthered into an ABU archetype or an Accessible Business Unit. There is potential for varying sizes from a single unit to multiple units creating a small business center in the core of the neighborhood. This means that the varying sizes of small businesses would relate to varying sizes of ABU’s. A start up or micro business would relate better to a detached ABU, whereas an established small business coffee shop could be housed in a grouped ABU unit and a few employees could rent some of the units above. The goal for these ABU’s was to fit into both of the critiques made in this book, the Missing Middle Critique and the Small Business Critique. They would create a more affordable space for small business owners to live and work.
Figure 3 Varying Small Business Sizes Diagram Micro Business Top Small Business Middle Established Small Business Bottom
Figure 3.6: Proposed ABU Archetypes Detached ABU Top Stacked ABU Middle Grouped ABU Bottom
Figure 3: Varying Small Business Diagram drawn by Author Figure 3.6: Proposed ABU Archetypes Diagram drawn by Author
Campbell
Architectural Design Studio 7
18
Exercise 3: Unit, Group, System Proposal
Figure 3: Varying Small Business Sizes Diagram
Exercise Three: Small Business ABU Archetype
Stacked ABU
After the critique and analysis it was evident that the neighborhood model discussed in exercise two and small business models could both benefit from each other. The ADU archetype was created in the previous exercise two and could be furthered into an ABU archetype or an Accessible Business Unit. There is potential for varying sizes from a single unit to multiple units creating a small business center in the core of the neighborhood. This means that the varying sizes of small businesses would relate to varying sizes of ABU’s. A start up or micro business would relate better to a detached ABU, whereas an established small business coffee shop could be housed in a grouped ABU unit and a few employees could rent some of the units above. The goal for these ABU’s was to fit into both of the critiques made in this book, the Missing Middle Critique and the Small Business Critique. They would create a more affordable space for small business owners to live and work.
Detached ABU
Grouped ABU
Figure 3.7: Revised Neighborhood Master Plan
Figure 3: Varying Small Business Diagram drawn by Author Figure 3.7: Revised Master Plan drawn by Author
Campbell
Architectural Design Studio 7
19
Exercise 3: Unit, Group, System Proposal
Exercise Three: Schematic Detached ABU The smallest category of small businesses is a non employer, start up, or what is considered a micro business. These businesses are typically a Sole Proprietorship who works for themselves. There are a vast amount of jobs and services found in this field. Industrial shop and fabrication is one of the options where an individual builds and fixes machinery, cars, or houses. This individual uses a shop like space for their work. Realtors, insurance agents, massage therapist, physical therapists all bring their clients into their place of work and would need an office space as well as a communal meeting room. The detached ABU is a good opportunity for individuals to live and work on the same property as they get their businesses off the ground. Studio sizes can vary but a standard 120 - 150 sqf studio is a good starting size. For shop and fabrication labs a two car garage (22ft x 22ft) or 484 sqf is a good starting size. A standard auto shop is 24ft x 30ft or 720 sqf and a medium size auto shop is 30ft x 40ft or 1,200 sqf. Office spaces need common areas around 80 - 100 sqf, conference rooms 25 - 30 sqf per person, offices around 90 - 150 sqf, and open work stations around 60 - 110 sqf per person.22 The goal for this detached ABU is to provide housing and a place to work while an individual gets their business off the ground. If the person would like to grow their business there are several options to add onto the existing ABU or potentially sell and move into the small business center located in the neighborhood. 22 Rahman, Fasi Ur “Standard Size of Rooms in Building and Their Locations,” The Constructor, June 2, 2021, https://theconstructor.org/ building/size-room-location-building/13269/. Figure 3: Varying Small Business Diagram drawn by Author Figure 3.6: Proposed ABU Archetypes Diagram drawn by Author Figure 3.8: Schematic Detached ABU Section drawn by Author
Figure 3.6: Proposed ABU Archetypes Detached ABU
Figure 3.8 Schematic Detached ABU Section
Campbell
Architectural Design Studio 7
20
Exercise 3: Unit, Group, System Proposal
Exercise Three: Schematic Stacked ABU The Stacked ABU model is simply the connecting archetype between the Detached ABU and the Grouped ABU. This is a space for individuals, families, businesses owners to have live/work space in the same building (seen in the Detached ABU) or have a work space below and rent out the top floors to employees or individuals (seen in the Grouped ABU). A good metaphor for the Stacked ABU is that of a sapling beginning to grow. It is no longer a seed and beginning to have a growth but it is not yet a developed plant. A Stacked ABU allows businesses to grow and develop. For example, a small business owner that owns a realtor company could own the first floor office space and live in the loft above it. Over time this individual might meet a significant other and want to have kids and move out of the top floor. They can still work in the bottom unit and then rent out the top floor to another individual. These ABU’s have the option to be located on their own parcel or there could be multiple buildings on the same one. The distinguishing factor between this and the Grouped ABU is the size of the working spaces below. This ABU’s are for small businesses with 1-5 employees. Office spaces need common areas around 80 - 100 sqf, conference rooms 25 - 30 sqf per person, offices around 90 - 150 sqf, and open work stations around 60 - 110 sqf per person.23 These working spaces would also be geared more towards retail and office spaces.
Figure 3.6: Proposed ABU Archetypes Detached ABU
23 Rahman, Fasi Ur “Standard Size of Rooms in Building and Their Locations,” The Constructor, June 2, 2021, https://theconstructor.org/building/size-room-location-building/13269/.Figure 3: Varying Small Business Diagram drawn by Author Figure 3.6: Proposed ABU Archetypes Diagram drawn by Author Figure 3.8: Schematic Stacked ABU Section drawn by Author
Figure 3.9 Schematic Stacked ABU Section
Campbell
Architectural Design Studio 7
21
Exercise 3: Unit, Group, System Proposal
Exercise Three: Schematic Group ABU The final ABU archetype that is going to be designed in the spring is a Grouped ABU or a small business center. The main critique in exercise 3 was that there is too large of a power struggle for small businesses in the commercialized suburbs. Big box stores rule over local companies by being located adjacently to them. Downtowns have done a good job at trying to keep chain stores and big box stores of out their spaces. This is inherently the same idea except on a smaller scale and inside of a neighborhood. These structures are 2-4 stories tall and cannot exceed 75ft in width and 100ft in length, as stated in the Missing Middle critique. These buildings would need to blend in the neighborhood fabric and would aesthetically fit the idea of a community rather than a strip mall. The bottom floors would be businesses spaces like small coffee shops, markets, offices, and small medical facilities. The goal for the Grouped ABU/Small Business Center is to stretch the boundaries of the current neighborhood model and design a Middle Housing option that is more affordable and attainable while also giving small businesses the opportunity to have a small economic center in the middle of a neighborhood. The newly urban designed block will create a more walkable environment that will encourage people to walk to these business center and meet their neighbors.
Figure 3.6: Proposed ABU Archetypes Detached ABU
Figure 3: Varying Small Business Diagram drawn by Author Figure 3.6: Proposed ABU Archetypes Diagram drawn by Author Figure 3.8: Schematic Grouped ABU Section drawn by Author
Figure 3.10 Schematic Grouped ABU Section
Campbell
Architectural Design Studio 7
22
Spring Master Thesis Proposal: Rather than conforming to societies monotonous suburbs and single family zoning, the curiosity of how urban design can reshape suburbs enters the equation. What if strict zoning laws relax and single family homes are mixed in with duplexes, quadplexes, and even small mix uses buildings. What if suburbs are designed to be pedestrian and bike dominant rather than car dominant. What if residential neighbohoods and business center coexist rather than situating themselves adjacently and primarily car accessible. What if small businesses can house themselves in neighborhoods, creating a more intimate client and customer base.
Re-envisionging Happy Valley’s Suburban Development
Campbell Campbell
ArchitecturalDesign DesignStudio Studio77 Architectural
23 23
Master Thesis Proposal: Re-envisioning Happy Valley’s Suburban Development
Site: Happy Valley, Oregon The site located for this project is located in a suburb right outside Portland Oregon. This area of the United States has seen a large influx because it the growing economy, job opportunities, and general likeness of the area. Portland grows at a rate of 0..59% annually and its population has increased 13.49% since the last census in 2010.19 Happy Valley is no longer the farming trade post is once was. A growing single family dominant suburb with groupings of strip malls lends to the typical car dominant suburb. The neighborhoods are lined with expensive single family houses and smaller lawns. There is great opportunity to try and bring a new idea for a suburban block because of the already developing area. The Scouter’s Mountain Development is located at the top of the ridge while the Rock Creek Development is at the base of the ridge next to commercial development and west of a large neighborhood. These two sites are potential areas to design a new suburb block with ABUs and ADUs. There are newly developed roads and pathways in these neighborhoods to connect the sites back to existing roads ways. In the spring there will be a more in depth analysis of the sites in the spring.
Happy Valley
Figure 4 Context Map
Figure 4.1 Current Suburban Commercial Model Figure 4.2 Current Suburban Residential Model
19 U.S Census Bureau, “Portland, Oregon Population 2021,” Portland, Oregon Population 2021 (Demographics, Maps, Graphs), accessed December 2, 2021, https://worldpopulationreview.com/us-cities/portland-or-population. Figure 4 Context Map drawn by Author over Map Box Studio Figure 4.1 Photo By Matsuo Bashō, “Happy Valley City Park,” Mapcarta, accessed December 7, 2021, https://mapcarta.com/23806108. Figure 4.1 Photo by Matsuo Bashō, “Happy Valley City Park,” Mapcarta, accessed December 7, 2021, https://mapcarta.com/23806108.
Campbell
Architectural Design Studio 7
24
Master Thesis Proposal: Re-envisioning Happy Valley’s Suburban Development
Site: Happy Valley, Oregon
Scope of Work: In the spring the task will be to chose one of the potential sites in Happy Valley and analyze how many units (du/ per acre) could potentially be on the site.
The site located for this project is located in a suburb right outside Portland Oregon. This area of the United States has seen a large influx because it the growing economy, job opportunities, and general likeness of the area. Portland grows at a rate of 0..59% annually and its population has increased 13.49% since the last census in 2010.19
Next design an urban fabric that relates back to the site conditions and the critiques made in Exercise 2. Then, design varying housing sizes, including ADU’s and ABU’s that better fit the American Demographics.
Happy Valley is no longer the farming trade post is once was. A growing single family dominant suburb with groupings of strip malls lends to the typical car dominant suburb. The neighborhoods are lined with expensive single family houses and smaller lawns. There is great opportunity to try and bring a new idea for a suburban block because of the already developing area.
Finally, design the three ABU Archetypes to fit into the neighborhood as seen in Exercise 3.
Schedule
Scouter’s Mountain Development
The Scouter’s Mountain Development (left) is located at the top of the ridge while the Rock Creek Development is at the base of the ridge next to commercial development and west of a large neighborhood. These two sites are potential areas to design a new suburb block with ABUs and ADUs. There are newly developed roads and pathways in these neighborhoods to connect the sites back to existing roads ways. In the spring there will be a more in depth analysis of the sites in the spring.
Rock Creek Development
⌂ 2 Weeks: Site Analysis and Further Research ⌂ 7 Weeks: Neighborhood Design ⌂ 7 Weeks: Accessible Business Unit Designs ⌂ 2 Weeks: Finalizing Designs and Conclusions
Figure 4.4 Site Map 19 U.S Census Bureau, “Portland, Oregon Population 2021,” Portland, Oregon Population 2021 (Demographics, Maps, Graphs), accessed December 2, 2021, https://worldpopulationreview.com/us-cities/portland-or-population. Figure 4.1 Site Map drawn by Author over Map Box Studio
Campbell
Architectural Design Studio 7
25