



2025 Research Findings








Founded in 1928, the Santa Barbara Foundation actively connects donors, nonprofits, government, businesses and the people of Santa Barbara County to take on the most challenging needs facing our region’s communities. Recognizing that its work depends on the strength of the social sector, the Foundation is committed to the health and vitality of local nonprofits. Knowing that together we can do more, the Foundation mobilizes charitable giving and connects their expertise to that of donors, nonprofits, and residents to create meaningful impact on the communities of our county. To learn more, please visit SBFoundation.org.
Stacie Furia, PhD, Senior Director of Evaluation and Learning
Anne Whatley, MSc, Director of the Collaboration for Social Impact
DataLake Nonprofit Research helps organizations understand and serve their communities. Nonprofits and philanthropies depend on research to make big decisions.
Jon Durnford, MBA, Principal
The Center for Evaluation and Assessment (CEA) at the University of California, Santa Barbara (UCSB) is a center that specializes in enhancing social programs through evaluation and research. The CEA’s work spans across various fields, such as education, health, and social services. The CEA aims to provide practical and effective insights that support the continuous development of programs and policies.
Natalie D. Jones, PhD, Associate Director CEA
Tarek Azzam, PhD, Director CEA
Piper T. Grandjean Targos, MA, Consultant
Tate Universe, Student Assistant
Caitlin Ng, Graduate Student Assistant
The Center for Evaluation & Assessment at UCSB and the Santa Barbara Foundation would like to acknowledge the Santa Barbara County nonprofit organization leaders and workforce members that took the time to participate in the survey and share valuable insights on the state of their work.
Thanks also to the Towbes Foundation for their generous support of this research and their commitment to strengthening the nonprofit sector, which made this work possible.
Icons are used throughout this report to distinguish between data sources. Leader data is represented in orange and green, while workforce data is represented in blue.


Building on the inaugural study, this third edition provides a comprehensive, data-driven analysis of Santa Barbara County’s nonprofit landscape, with particular attention to changes in federal funding and policy as the sector moves beyond pandemic-era recovery. Set against inflationary pressures and sustained service demands, these findings offer an empirical reference for funders, practitioners, and government agencies, while contributing to the longitudinal study of the local nonprofit industry.
Broaden regional awareness: Foster a deeper understanding among donors, funders, public officials, and practitioners regarding the strengths and evolving variables within the nonprofit sector.
Inform organizational strategy: Provide findings that can be incorporated into strategies to help organizations refine their leadership and management practices.
Report flow
This report, developed by the Center for Evaluation & Assessment (CEA) at UCSB, synthesizes longitudinal data from multiple sources to provide a holistic overview of Santa Barbara County’s nonprofit sector. In this edition, data from the nonprofit workforce is integrated alongside leadership perspectives throughout the analysis. While the report structure is informed by primary survey themes, the data is organized to align with the specific informational needs of the county. This includes the incorporation of IRS filings within the financial analysis and California Employment Development Department (EDD) data. The report begins with an overview of the participating leaders and workforce members, followed by an assessment of the sector’s scale and composition, before providing detailed observations on specific sector topics.
Support resource alignment: Offer data to assist in targeted efforts aimed at encouraging continued investment in the nonprofit sector.
Identify research priorities: Analyze the data to pinpoint key areas that may benefit from further investigation or longitudinal study.
At the end of this report readers can find recommendations and commentary from the Santa Barbara Foundation.
The Foundation looks forward to further conversations on the topic areas covered here and others, which stakeholders would want to see in the future as part of a regular assessment of the State of the Nonprofit Sector.
The report uses various sources of data, including:
1) financial data on tax-exempt nonprofits from the IRS Tax Form 990, as well as employment data from the California Employment Development Department that has been compiled and analyzed by DataLake LLC;
2) a survey for nonprofit leaders that was originally created by The Nonprofit Institute (NPI) at the University of San Diego and modified, analyzed, and administered by the Center for Evaluation & Assessment (CEA) at the University of California Santa Barbara (UCSB) in partnership with the Santa Barbara Foundation; and
3) a survey for nonprofit workforce professionals that was designed, facilitated, and analyzed by the Center for Evaluation & Assessment (CEA).
IRS Business Master File (BMF) of exempt organizations, circa 2023.
This data source was used to analyze data on the number of public charities and private foundations, classified by subsector based on groupings of National Taxonomy of Exempt Entities (NTEE).
Labor Market Information Division, California Economic Development Department (2024)
This data source was used to summarize nonprofit employment and wages.
IRS Form 990 and 990-EZ public charity returns, circa 2019-2023 (IRS e-File and GuideStar digitized datasets)
This data source was used to analyze trends in nonprofit financials, including the sector’s revenues, assets, and expenses.
This survey of 105 nonprofit leaders collected information on nonprofits’ demand for services, financial outlook, organizational capacity, and sector trends. The survey was administered online between April and June 2025 and is a convenience sample of Santa Barbara County’s nonprofit sector. Demographic on participating nonprofits is provided on pages 9, 10, and 95.
County
To capture diverse perspectives, a survey of 92 nonprofit workforce members collected information on nonprofits’ employment, personal challenges, and organizational capacity. The survey was administered online between May and July 2025 and is a convenience sample of Santa Barbara County’s nonprofit workforce sector. Demographic on participating nonprofits is provided on pages 12 and 94.
Data notes
Percentages in this report may not always total 100% due to rounding.
Data in tables may not equal totals due to individual information withheld in 990/EDD data due to privacy concerns.
As majority of nonprofits are relatively small, unless otherwise noted, data presented from IRS 990 does not include higher education, hospitals, and Direct Relief, as these organizations represent more than half of total revenue and expenses in Santa Barbara County’s nonprofit sector.
The data analysis involved both quantitative and qualitative methods. The analysis also included cross-referencing the quantitative and qualitative data to look for patterns across responses.
The quantitative analysis involved both descriptive (e.g., frequencies, percentages, means, etc.) and comparative statistics (e.g., crosstabs, chi-square, etc.). The data were cleaned to eliminate missing data or questions answered outside the realm of possible responses. The results were arranged into tables and visualizations to facilitate a clear representation of the data.
The qualitative analysis followed a rigorous, multistage human-AI collaborative process characterized by an open coding approach to identify patterns and themes directly from the raw data. The process comprised seven primary stages: data cleaning, an initial human review for contextual grounding, and a manual identification of emergent themes.
Following this, CoLoop (an AI-based qualitative analysis tool) was utilized for initial automated analysis to organize broad structural categories, while Google Gemini facilitated a secondary, more granular analysis. This secondary phase included an emergent coding review, thematic synthesis to consolidate overlapping categories, and the strategic identification of exemplar quotations.
Because qualitative data are fluid, themes were not mutually exclusive; coded segments were often represented across multiple categories to capture the complexity of the responses. The qualitative figures in this report display the most frequently cited themes. Visual size is used to represent the relative frequency of mention, to reflect the qualitative character of the data. The n reported for each question reflects all respondents who answered it, regardless of whether their response is represented in the figures.
To ensure the highest level of rigor, quotations were edited and amended for grammar and clarity, followed by a final human verification phase. This step involved cross-referencing every AI-selected quote against the original raw transcripts to confirm accuracy, context, and authenticity. By maintaining this human-led audit trail, the research team ensured that the final narrative remained strictly rooted in the participants’ actual voices, mitigating the risk of AI-generated misattributions.
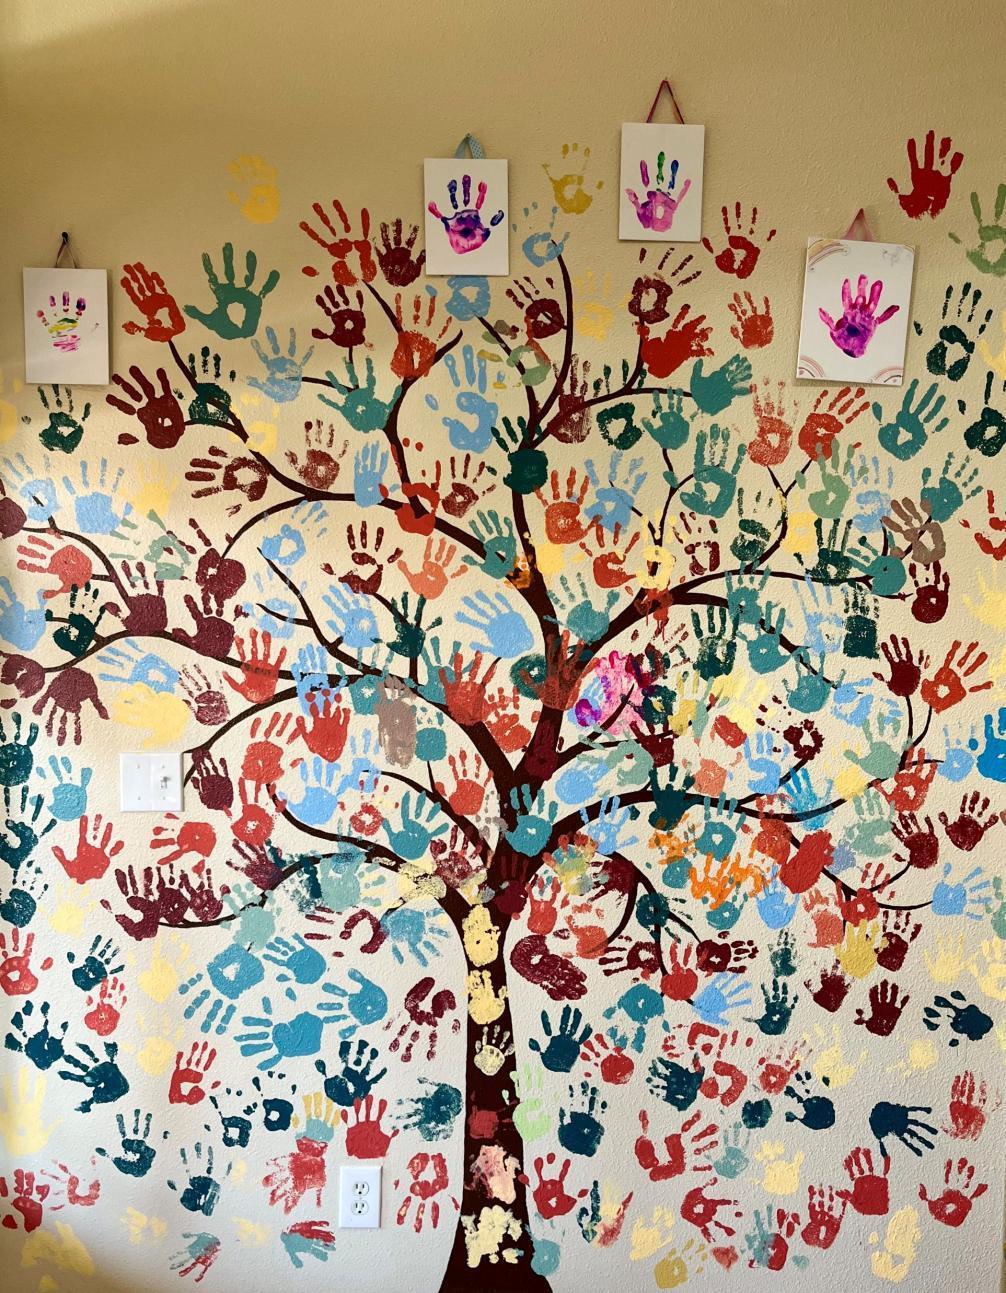
105 Santa Barbara County nonprofit leaders provided information on their organizations’ workforce, demand for services, financial outlook, organizational capacity, and sector trends.
An online survey was conducted to gather data from the nonprofit sector in Santa Barbara County using a convenience sample of organizations. Compared directly to countywide nonprofit data based on IRS data, the sample is not fully representative. It overrepresents human services organizations and underrepresents religious organizations, and it underrepresents smaller organizations (with budgets under $250,000) while overrepresenting larger organizations (with budgets over $10 million). Despite these differences, the sample generally reflects the geographic distribution of nonprofit headquarters across the county, although organizations in the midcounty region are underrepresented.
Participating organizations by sector (n=105)
Participating organization’s headquarters *
SurveyrespondentsreportingHQ(n=75)
SBCountynonprofits (n=885)
* Note:Headquarterslocationwasreportedby75ofthe105respondents.
To gain insights into the distribution of nonprofit services across Santa Barbara County, surveyed leaders were asked about the physical locations where their organizations offer services.
The resulting heat map provides a visual representation of the regions served by the participating nonprofit organizations, with the color red indicating the highest percentage of organizations providing services in a particular location.
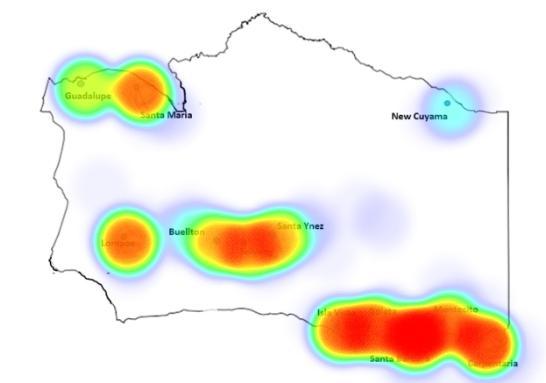
Percent of surveyed organizations that provide services by location (n=105)
Santa Barbara
Goleta
Carpinteria
Lompoc
Montecito
Santa Maria
Isla Vista
Solvang
Santa Ynez
Buellton
Guadalupe
As shown in the heat map and histogram, Santa Barbara (71%) and Goleta (55%) are the physical locations where the organizations in our sample provide services most frequently, while Cuyama Valley (10%) is the least serviced location in our sample.
92 Santa Barbara County nonprofit workforce members provided information on their perspectives on various aspects of their lives working in nonprofits throughout Santa Barabara County.
An online survey was conducted to gather data from the nonprofit sector in Santa Barbara County. The survey used a convenience sample of nonprofit workforce members in the county. As shown in the graph below, Santa Barbara (79%) and Goleta (46%) are the physical locations where the workforce participants’ organizations in our sample provide services most frequently, while Buellton (20%) is the least serviced location.
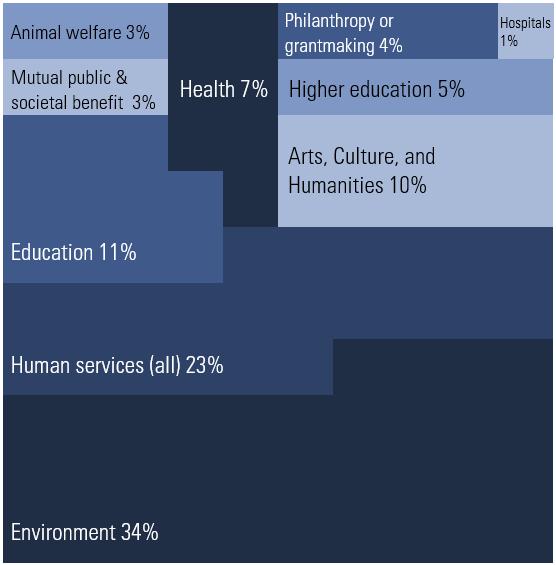
The nonprofit sector is a cornerstone of the Santa Barbara County community, delivering essential services and support to local residents. This diverse landscape includes organizations dedicated to various causes, including health, education, social services, the environment, and the arts ranging from small-scale grassroots initiatives to large, established institutions. This section offers an overview of registered nonprofits by subsector, compares Santa Barbara County’s nonprofit landscape to peer counties, and analyzes the sector’s overall growth.
Based on data from the IRS in 2025, the nonprofit sector in Santa Barbara County is comprised of 2,137 registered nonprofits and 286 private foundations, along with 292 501(c) tax-exempt organizations in the county that do not fall under the classification of nonprofit or private foundation.
Santa Barbara County domestic 501(c) tax-exempt organizations, June 2025
Tax-exempt Organizations Count
501(c)(3) Private Foundations Other 501(c) Organizations Total 501(c) Organizations
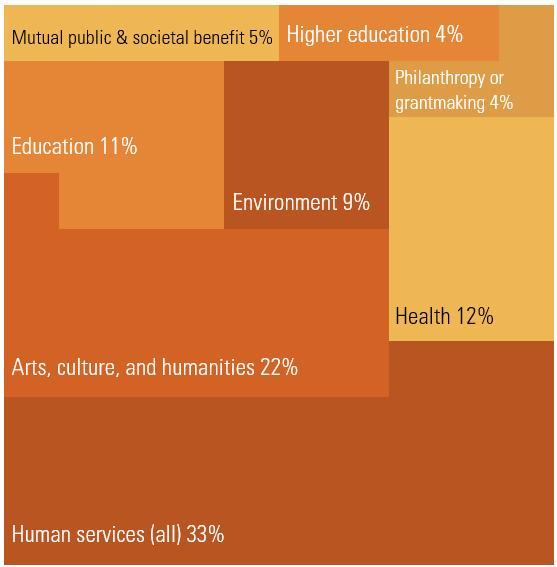
This report focuses on 501(c)(3)nonprofits operating in Santa Barbara County. Of the 2,137 501 (c)(3)nonprofits in Santa Barbara County, the majority fall under the categories of human services (25%) and religion (19%). Other significant categories include education (14%), public and societal benefit (12%), and arts, culture, and humanities (13%). The remaining categories each account for less than 7% of the total number of nonprofits.
Although 2,137 nonprofits are registered in Santa Barbara County, a smaller subset is actively operating, as indicated by IRS filings, with 885 organizations submitting Form 990/990-EZ returns and 665 reporting paid employees.
Note. Throughout the rest of the report, Mutual
Santa Barbara County registered 501(c)(3) ACTIVE nonprofits, June 2025
When compared to select California counties for the period of 2024 to 2025, Santa Barbara County’s growth rate is higher than two comparable counties (although lower than Monterey County) and slightly lower than that of California and the United States. Overall, the sector has seen an overall increase of 4% from 2020 to 2025.
In terms of number of organizations, Santa Barbara County saw a slight increase of 1.86% in the number of registered 501(c)(3) nonprofits from 2024 to 2025. Overall, the data suggests that the number of tax-exempt organizations, specifically 501(c)(3) nonprofits, is growing in Santa Barbara County, albeit at a slightly slower rate compared to previous years and some areas in California and the United States.
United States
Santa Barbara County
Exploring variations in nonprofit levels by subsector, from 2024 to 2025, many subsectors saw an increase in the number of registered nonprofits, with higher education, environment, and hospitals being the only exceptions, as these subsectors saw no changes. Overall, these data show that the nonprofit sector in Santa Barbara County is diverse and dynamic, with different subsectors experiencing varying rates of growth.
The nonprofit sector remains a major employer within Santa Barbara County, representing a significant and growing portion of the local workforce. This section explores the diverse roles that sustain the sector from administrative leadership to frontline service providers. New to this year’s analysis is a dedicated survey of both leaders and staff members. This data offers a deeper look into the workplace experience, specifically addressing professional advancement, projected tenure, and the factors that motivate employees to stay or depart. We also examine the prevalence of burnout, current work arrangements, and the alignment between organizational benefits and the day-to-day challenges faced by the workforce.

Nonprofits accounted for 8.5% of total employment in Santa Barbara County in 2024, with 17,970 people employed in the nonprofit sector.
The nonprofit sector in Santa Barbara County also saw growth in the number of nonprofits with paid employees, with an average of 665 organizations, a 2.6% increase from the previous year. Additionally, there was an increase in the total employment by 7.5%, employing more people than the previous year, and a 11.9% increase in total annual wages. In total, from 2019 to 2024, the county has seen a 14.7% increase in average number of nonprofits with employees, 21% increase in the average total employment, and an increase of 52% in total annual wages.
Overall employment in Santa Barbara County saw dramatic variability from 2019 to 2020, with an intense decrease from 214,500 in 2019 to 200,200 in 2020. Since 2020, there has been a gradual increase in county employees to 211,100 in 2024. In contrast, nonprofit employment in the county did not experience a decline during the COVID-19 period, increasing steadily from 14,850 in 2019 to 17,970 in 2024.
Total SB County 501(c)(3) employment
While total employment decreased slightly by 1.45% from 2019 to 2024, total 501(c)(3) employment increased 21%.
The county’s unemployment rate has varied, with an increase in unemployment rates from 3.7% in 2019 to 8.2% in 2020, followed by a decrease to 3.6% in 2022. However, this decrease has shifted to a slight increase in unemployment rates from 2022 to 2024 (rising from 3.6% to 4.5%). As presented in the chart above, the percentage of employment in Santa Barbara County accounted for by nonprofits has seen an incremental steady increase from 6.9% in 2019 to 8.5% in 2024.
Total unemployment rates have fluctuated seeing an increase between 2019 to 2020, a decrease from 2020 to 2022, followed by a slight steady increase between 2022 to 2024, while SBC 501(c)(3) employment increased steadily during this same period.
Looking at nonprofit employment by organization size shows that most nonprofits (57%) had fewer than 10 paid employees in the current findings, a decrease from 63% in the 2022/2023 report, while the share of mid-sized organizations (10–99 employees) increased from 33% to 38% and larger organizations (100+ employees) rose slightly from 4% to 5%.
Looking at employment by subsector, human services remained the largest across all measures, while health (excluding hospitals) continued to account for a substantial share of nonprofits and employment; overall, subsector distributions remained relatively stable from the 2022/2023 report to the current findings, with the most notable changes being growth in total wages and the number of nonprofits.
Nonprofit employment by organization size, 2024 CA EDD (n=665)
Responses from the current sample of nonprofit leaders provided additional insights and predictions for nonprofit sector employment in Santa Barbara County.
The survey results indicate that 85% (n=88) of nonprofit leaders had paid employees (excluding independent contractors). Unlike the data reported by the California (CA) Employment Development Department (EDD), the organizations in our current sample were diverse in terms of the number of paid employees as (17%) had less than 10 paid employees and (16%) had 100 employees or more.
Number of paid employees at participating nonprofits (n=89)
Prediction of staff size in the next 12 months (n=89)
The survey findings also revealed that Santa Barbara County nonprofit leaders are anticipating some growth in the sector, with 42% (n=37) of respondents predicting an increase in staff size within the next 12 months. This reflects a shift from 2022/2023 report, when 58% of leaders anticipated growth, 40% expected staffing levels to remain the same, and only 2% anticipated a decrease
Of the Santa Barbara County nonprofit leaders surveyed, 85% (n=74) reported hiring new staff in the last 12 months, while 76% (n=67) reported staff turnover and 51% (n=45) currently have job vacancies. Compared to the 2022/2023 report, when hiring (81%) and staff turnover (73%) were lower, while the share of organizations reporting vacancies was higher (56%).
85% hired new staff in the last 12 months
76% have had staff leave their organization
51% of organizations currently have a vacancy
Of the leaders who reported having a job vacancy, 96% reported that it negatively affected their ability to deliver services to varying degrees. This is a slight departure from the 2022/2023 report, where 100% of leaders reported that it negatively affected their service delivery. While the overall impact remains high, the intensity has observed a decrease; currently, 31% of organizations report that vacancies affect service quality to a “great” or “very great” extent, compared to 45% in the previous report. Survey findings suggest that the current job vacancies are more closely linked to hiring challenges than to retention issues, a trend that remains consistent across both study periods.
70% (n=62) of leaders reported difficulty hiring qualified employees, while 24% (n=21) identified challenges with staff retention. This represents a decrease from the previous report (in 2022/2023), where 77% (n=88) of leaders noted hiring difficulties and 40% (n=57) cited retention issues. Across both study periods, the data consistently suggests that hiring qualified employees presents more persistent challenges for the sector than retaining current staff.
Extremely easy
Somewhat easy
Neither easy nor difficult
Somewhat difficult
Extremely difficult
When asked, “What, if any, has the impact of workforce vacancies been on your organization?” workforce members shared a clear picture of increased workload, stress, and burnout. Many described being stretched thin by additional duties, which often impacted work-life balance and lowered morale. Beyond these personal tolls, responses highlighted how recruitment and retention hurdles often tied to uncompetitive wages have limited organizational capacity to deliver services or launch new projects. In some cases, long-term vacancies in key leadership roles have also created a sense of instability. Notably, a portion of respondents reported little to no impact or found the question inapplicable to their current situation.
(n=62)
Increased Workload, Stress, & Burnout
No/Low Impact, Not Applicable, or Mitigation
Vacancies force remaining staff to take on extra duties, leading to overwork, burnout, and negative impacts on personal well-being.
Some respondents reported no direct impact, felt the question was not applicable, or used strategies like contractors to manage the gap.
“Vacancies, especially prolonged ones, mean that someone else has to pick up the slack. This often means that whoever does that is adding more work to their load than is sustainable.”
“In my department it has not been an issue.”
Difficulty in Recruitment & Retention
Reduced Organizational Capacity & Service Delivery
Organizations struggle to keep or attract staff due to uncompetitive wages, high turnover, and the need for specialized skills.
Staffing shortages limit the scope of work, resulting in postponed projects, extended deadlines, and difficulty providing essential services.
“Staff retention and turnover has been extremely tough on us. Many staff have left for higher pay rates at County or for-profit entities that pay higher.”
“We are often unable to fill necessary roles in the event of unexpected absence.”
Leadership & Organizational Instability
Size reflects frequency of responses
Vacancies in director or leadership roles create uncertainty and unease regarding the organization’s future direction.
“We have a leadership vacancy which leaves staff and volunteers feeling a bit uneasy not knowing who will replace our beloved leader who has left and if other organizations changes will be coming.”
Workforce members reported that they felt highly supported in their current roles, with 79% of respondents agreeing or strongly agreeing that they have the backing of the organization.
When asked about how much longer they plan to stay in their roles, the majority indicated a short- to mid-term outlook. Specifically, 59% of the workforce plans to remain in their current position for three years or less, with the largest single group (45%) eyeing a 1 to 3-year window. In contrast, only 11% of members currently envision staying in their role for over a decade.
When asked what would motivate them to leave their current positions, workforce members identified compensation and financial need as the dominant factors, cited by nearly half of all respondents. This included specific pressures such as low pay, a lack of benefits, and wages that failed to keep pace with the high cost of living. Beyond financial concerns, the data highlighted organizational and management issues: including poor leadership, toxic culture, and unstable priorities alongside a desire for career growth and advancement. While smaller groups pointed to current job dissatisfaction, retirement, or external opportunities, the findings showed that potential departures were primarily driven by uncompetitive pay and concerns regarding the effectiveness of organizations’ leadership and structure.
Need to advance or new opportunities
“If there was an opportunity to advance my role or earn a better salary.”
Age/health or personal life changes
“Deterioration of work culture, changes in family needs/demands...”
Poor or changing leadership, toxic culture, unstable funding/priorities
“The lack of teamwork, collaboration across departments, lack of respect, and dictatorship from top down.”
Size reflects frequency of responses
Low pay, lack of benefits, high cost of living
“If I stopped getting raises or got them too slowly, or if my rent rises faster than my pay does. I am passionate about my work but cannot sacrifice my finances for this job.”
“I no longer feel valued or appreciated at my organization so I am considering looking for work elsewhere.”
“It would take an incredible opportunity - large increase in pay for well respected and known organization.”
“This is one of the best work environments and rewarding positions I have held over my lifetime.”
When asked about other employment issues they are facing, leaders provided feedback that centered on three primary themes:
Housing & Cost of Living Crisis
The overwhelming impact of Santa Barbara’s housing market and general living expenses on staff stability.
“Affordable housing impacts ability to recruit and retain staff.”
Compensation & Benefits Inadequacy
Concerns regarding the inability to provide competitive salaries, health insurance, or merit-based increases.
“We would love to have more information about how to begin to offer health benefits...”
Funding & Financial Sustainability
Issues with restrictive grants, donor competition, and the administrative burden of reporting.
“Many of the nonprofit are going after the same funding….”
When asked about the biggest challenges they face in their current role, workforce members responded that workload, capacity, and burnout are the primary pain points. These challenges are often linked to resource scarcity, such as funding and grant dependency, as well as issues regarding management, leadership, and governance. Additional data shows concerns regarding organizational culture and communication, alongside a need for better professional development and alignment between roles and skills.
Workload, Capacity & Burnout
Funding, Resources & Scarcity
High volume of tasks, lack of time for strategy, and the physical/emotional toll of “doing the work of two people.”
“Burnout due to doing probably 75% of the work in an all-volunteer organization…”
Structural financial challenges, including grant dependency, the “constant grind” of fundraising, and budget uncertainty.
Management, Leadership & Governance
Issues with supervisor experience, lack of clear guidance from the Board, and feeling unsupported in decision-making.
“I think the constant grind of fundraising is always a challenge…”
Culture, Change & Communication Professional Development & Role Fit
Resistance to change (especially from long-tenured staff), internal silos, and poor interdepartmental communication.
“Lack of board governance and support.”
Misalignment between skills and duties, lack of training for new tech/systems, and unclear paths for growth.
“Challenging to implement and direct change when people who have been around for a long time are stuck in their ways.”
“We are largely grant-funded, and that limits the time and development opportunities that I’d need to build additional skills that could further my career.”
Among the leaders who reported significant hiring hurdles, the greatest difficulties were concentrated at the entry- and mid-level tiers. At the entry level, recruitment was most challenging for program and direct services roles. As positions moved into the mid-level, the difficulty shifted toward roles requiring licensing or special certifications. While senior-level hiring was slightly less frequent, leaders identified fundraising and development as the most difficult area to staff at that executive tier. These challenges largely mirror those from the 2022/2023 report, though the pressure shifted at the mid-level from direct services staff toward those requiring specialized certifications.
Program/direct services
Licensed or specially certified staff
Admin operations
Fundraising/development
Marketing/communications
Finance accounting
Human resources
Data/evaluation
Technology
When asked to select all factors impacting their ability to recruit new staff, leaders frequently identified a consistent set of hurdles. Providing competitive salaries, the difficulty for potential employees to secure local housing, and the challenge of offering competitive benefits emerged as the most common obstacles. Additionally, recruitment efforts were affected by the need for specialized skill sets and the specific constraints of seasonal or part-time work. These findings closely align with the 2022/2023 report, as the relative ranking of these primary factors has remained unchanged year-over-year.
Factors
Competitive salary
Ability to secure local housing
Competitive benefits package
Policies related to remote/hybrid work
Applicant needs to pay off student debt
Similarly, nonprofit leaders who identified challenges in retaining qualified staff noted that the primary difficulties were concentrated at the entry- and mid-level tiers. Retention was most frequently highlighted in roles involving licensing or special certifications, direct program services, and administrative operations. These results are similar to the 2022/2023 report, with licensed staff and program/direct services positions remaining the top two areas of concern, though their relative order shifted slightly this year. At the senior level, fundraising positions continued to be the most common area where retention challenges occurred.
Marketing/communications
Human resources
Leaders who reported difficulties in staff retention were also asked about the factors impacting their organization’s ability to retain employees. Most often, leaders cited challenges such as the high cost of living, the ability to offer competitive salaries, and preventing employee burnout as significant factors affecting retention. This year’s results strongly resemble the 2022/2023 report, with one notable difference: in the previous report, 20% of leaders identified an employee’s ability to secure adequate childcare as a significant issue, whereas only 5% of respondents reported it as a factor this year.
Cost of living
Inability to pay competitive salaries
Employee burnout
Inability to offer competitive benefits
Policies related to remote/hybrid work
Employees’ inability to secure adequate childcare
Other
“Interestingly, it’s not a lack of resources that limits wages, but a reluctance to appear as though they’re paying ‘too much.’ Decisions rely on national benchmarks that fail to reflect the TRUE cost of living in Santa Barbara. Though they have the means to offer wages that align with local housing costs, they choose not to lead by example. Instead, by aiming to remain near the median, they reinforce low wages and perpetuate the affordability crisis-missing a critical opportunity to model what it means to truly support employees.” - Nonprofit Leader
Burnout remains a prominent hurdle for leaders striving to retain qualified staff. When asked to select all the ways burnout manifests in their organizations, the majority of leaders pointed to staffing shortages that leave teams stretched too thin, alongside mental health challenges and dissatisfaction with work-life balance. While 21% of leaders felt employee burnout did not apply to their organization, those who provided “other” write-in responses often used the opportunity to highlight the underlying drivers of burnout. These findings closely mirror the trends captured in the 2022/2023 report.
Staffing shortages leaving employees stretched too thin
Mental health challenges
Dissatisfaction with work-life balance
Physical health challenges
Not applicable for our organization
Employees feeling underappreciated
Lack of motivation
When workforce members were asked how burnout manifests within their organizations, their responses differ in important ways from those of leaders. Most notably, 65% of staff pointed to staffing shortages that leave employees stretched too thin, compared to 52% of leaders, while 46% of workforce members cited feeling underappreciated, more than double the 20% of leaders who identified this as a concern. While 21% of leaders felt burnout did not apply to their organization, only 11% of workforce members said the same.
Many who provided “other” write-in responses used the opportunity to highlight the underlying drivers and pressures leading to exhaustion. It is important to note that these findings represent distinct groups from separate surveys and do not necessarily reflect a one-to-one comparison within the same organizations.
Staffing shortages leaving employees stretched too thin
Employees feeling underappreciated
Mental health challenges
Dissatisfaction with work-life balance
Lack of motivation
Physical health challenges
Other
Not applicable for our organization
“In the past, burnout was a major threat to our organization, but current leadership has stepped up to address staff health and wellness. Our turnover rate has significantly decreased and burnout does not appear to affect us as much. We have very generous PTO benefits and are strongly encouraged to use it.” – Nonprofit Workforce Member
When looking at the actions taken to retain staff, current data shows that competitive pay remains the most utilized strategy, with 85% of leaders reporting wage increases compared to 83% in the previous period. Other retention efforts show different levels of activity between the two reports; reported actions for increased benefits shifted from 55% to 46%, while the percentage of leaders reporting a recent increase in remote work flexibility moved from 68% in the previous report to 40% in the current findings. Across both periods, wage increases continue to be the most frequent action leaders report taking to support employee retention.
(ns=67→88) Yes Not yet, but expected in next 12 months
Increased wages
Increased flexibility in remote work
Increased benefits
Out of 84 leaders who provided information on remote work arrangements, the majority (86%) reported that at least some portion of their workforce works partially remote. Conversely, 13% of leaders stated that none of their workforce works even partially remote. While 17% of leaders reported that their entire workforce (100%) works at least partially remote, this is a significant decline from the previous report, where 31% of leaders reported that their full staff had partial remote arrangements.
Building on the insights provided by leaders, workforce members were asked about their own work arrangements. Findings show a slight lean toward hybrid and remote working, with 58% of the workforce operating outside of a traditional office at least part of the time. For those who are hybrid or in-person, the majority (68%) live in close proximity to their workplace and travel less than 10 miles to get to work.
Work arrangement (n=72)
Note: These findings may
hybrid, the average time working remotely is 44%
distance for hybrid and in-person (n=66)
Workforce members were asked to identify the benefits offered by their organization and rate their satisfaction with these arrangements. While foundational benefits like paid holidays (83%) and paid time off (82%) are common, supplemental support such as wellness opportunities (38%) and paid parental leave (37%) are less frequently reported. Overall, sentiment remains positive, with 68% of the workforce reporting they are satisfied or very satisfied with their total compensation and benefits.
Compensation and benefits (n=71)
Paid holidays
Paid time off
Health
Professional development/education
Retirement match
Dental
Remote work options
Flexible schedule
Life insurance
Eye care
Short-/long-term disability
Wellness opportunities
Health saving/spending account
Paid parental/family leave
Other
A direct comparison of the benefits provided, as reported by workforce members and leaders, shows that both groups identify the same core support, primarily paid holidays, vacation, and health insurance, as the most common offering. While the numbers reported for these benefits differ between the two groups, both agree on which types of support are most frequently available.
Paid holidays
development/education
match
Eye care
Remote work options
Flexible schedule
Life insurance
Short-/long-term disability
Paid parental/family leave
Wellness opportunities
Health saving/spending account
Other
To understand how support is distributed, leaders were asked to define the criteria staff must meet to qualify for benefits. While offerings vary, access is generally governed by three main factors:
Minimum Hours Required
Full benefits typically require a 30-hour work week, though some organizations offer prorated support starting at 20 hours.
Most staff face a 30-, 60-, or 90-day probationary period before activation, while retirement matches often require a full year of service.
Eligibility is often restricted to “Full-time/ Regular” or “Salaried” staff, which frequently excludes part-time and seasonal workers.
Santa Barbara County’s nonprofit sector relies on the strategic guidance of board members and the diverse skills of dedicated volunteers. This section provides an overview of volunteer engagement across different sub-sectors and budget sizes, highlighting the essential roles these individuals play in organizational success. In addition to analyzing total volunteer numbers, the report examines current trends in recruitment, and the specific challenges organizations face in maintaining their volunteer workforce.
Number of volunteers engaged by surveyed organizations (n=91)
# of volunteers
Survey results indicate that volunteer engagement is a standard practice across the sector, with 88% of participating leaders reporting that they utilize volunteers outside of their board members. While 85% (n=88) of organizations in this year's sample have paid employees, this reflects a survey sample that skews toward larger, more active organizations. By contrast, IRS Form 990 and EDD data suggest a different picture across the broader nonprofit landscape, where only 30% of nonprofits report having paid employees.
The scale of engagement shows a notable upward shift in larger volunteer cohorts this year, with 41% of respondents reporting 61 or more volunteers compared to 24% in the previous report. Meanwhile, 19% of organizations specifically engage 100 or more volunteers, and 21% operate with 10 or fewer, remaining relatively stable compared to the 26% seen in previous years.
Highlighting the critical role of the volunteer workforce in Santa Barbara County, 41% of surveyed nonprofit leaders identified volunteers as “absolutely essential” to delivering their organization’s mission. While this reliance is sector-wide, these findings remain nearly identical to the previous report (2023/2023), with volunteers continuing to perform a wide range of roles including direct services, fundraising, and administrative support.
important Of little importance Moderately important Absolutely essential Importance of volunteers in delivering mission (n=92)

Program support/facilitation

Direct service delivery/client-facing
Event support/fundraising
Outreach/community engagement
Specialized/professional services
Board governance/leadership
Maintenance/operations
Administrative/clerical support
On average, leaders estimated that 55% of their organization’s volunteers engage in long-term volunteering (volunteering regularly) while 45% engage in short-term volunteering (once or for special events).
While nonprofit leaders continue to emphasize the critical role of the volunteer workforce, 37% reported difficulties in recruiting the necessary volunteers to fulfill their organization’s mission. This reflects a trend consistent with the 2022/2023 report, where 40% reported similar recruitment challenges.
Among the 24 leaders who identified volunteer recruitment difficulties, the majority indicated that these shortages adversely affected the quality of services provided by their organization to some extent. This represents a shift from the previous report (2022/2023), in which only 16% of respondents reported little to no impact on service delivery, compared to 29% of leaders who reported the same this year.
Between 2019 and 2023, the total number of nonprofits and board members increased. During this same time, the number of volunteers decreased notably from 2019 to 2023, though there was a slight rebound since the more substantial drop during the early stages of the COVID-19 pandemic. The total number of nonprofits held steady at 501 between 2019 and 2020 before increasing to 545 by 2023. Board members fell from 5,156 in 2019 to 3,714 in 2020 before recovering to 5,315 by 2023, a 3% increase overall. Similarly, volunteers dropped during the pandemic before rebounding, growing by 7,451 between 2020 and 2023, representing a 26% increase since the pandemic low. This is still 33% below the volunteer count in 2019.
The total number of nonprofits increased from 2020 to 2023 by 8.8%, the number of board members increased by 3%, and volunteers increased by 26%.
Note. Excludes Direct Relief, hospitals, and higher education institutions, and reflects only 501(c)(3) public charities with complete board member disclosures on IRS Form 990 (fiscal years ending circa 2023).
The impact of the increase in the number of board members and volunteers was not consistent across all subsectors, with some subsectors experiencing more significant increases than others. Environment and health nonprofits had the most significant increase in board members, with a 156% and 75% increase, respectively. In contrast, education and public and societal benefit subsectors experienced decreases in total volunteers, with a 36% and 19% percentage decrease, respectively.
The change in the number of board members and volunteers was not consistent across all organizational budget sizes. Organizations with budgets between $10–20 million experienced the largest increases in both board members and volunteers, while mid-sized organizations generally saw moderate growth; in contrast, smaller organizations with budgets under $250,000 experienced declines or minimal growth in volunteers, with the sharpest decrease among those with budgets of $50,000 or less.
Nonprofit leaders provided a detailed look into the hurdles of building volunteer teams, describing a landscape where recruitment encounters challenges due to scheduling and financial needs. These obstacles primarily coalesced around time, availability, and commitment, as organizations struggle to find individuals for long-term roles or weekday shifts.
Lack of ability to attract volunteers, communication issues
“Recruiting people outside of our immediate sphere of known contacts.”
Recruitment,
Changing mindsets postpandemic, request for pay, lack of motivation
“We cannot pay or offer folks stipends for their time…”
Challenges also involve recruitment, marketing, and outreach, where many nonprofits lack formal strategies to publicize opportunities beyond their immediate networks. Furthermore, internal capacity and support constraints make it difficult to effectively coordinate and manage volunteers, while shifting motivations and skill mismatches reflect a trend where potential volunteers have competing priorities or increasingly seek compensation for their labor. Size
Shifting Volunteer Motivations
Volunteer availability, long-term commitment, competing priorities
“We are open during business hours, which makes it hard for working adults and students.”
Lack of experienced staff, problems with coordination, engagement, and infrastructure
“Recruiting is not that difficult. Making sure they are trained, supported, etc. has been difficult…”
Finding the right qualified persons, limited ability or willingness, and certifications
“Skill sets not applicable to organizations needs.”
DEIA is central to the mission of many nonprofit organizations in Santa Barbara County. This section features insights from both leadership and workforce members regarding pressing DEIA needs and the specific challenges encountered in regional practice. The report highlights the evolving strategies organizations are implementing to foster equity, from diversifying leadership to refining program delivery through community input. Additionally, this analysis examines the current demographic representation within boards and executive roles, highlighting the sector’s ongoing efforts to align its internal structures with the communities it serves.
The figure below displays a comparison between leader responses and the demographics of Santa Barbara County residents obtained from the 2020 Census. Data presented in the figure shows that white individuals hold a higher percentage of leadership positions than their representation in the Santa Barbara County (SBC) population, while Hispanic/Latino/a/e/x individuals are most notably underrepresented in comparison.
Native
Native Hawaiian/Pacific Islander
Two or more races
(n=95)
Leaders were asked to provide further demographic information about their CEO/Executive Director and Board Chair.
The results showed that a larger percentage of individuals identifying as a woman held CEO/Executive Director positions (51%), while Board Chair positions were more equally held by individuals identifying as a man or a woman (47%).
They identify as gender non-binary
I prefer not to disclose or I do not know They have another gender identity
Note: Information regarding other demographic identities of CEOs and Board Chairs is not presented due to a low response rate
Workforce members provided a candid look at the most pressing DEIA needs, revealing a landscape where organizations often struggle to turn good intentions into tangible action. These concerns primarily center on inclusion, culture, and organizational commitment, highlighting internal barriers like non-inclusive environments and a lack of true accessibility. A recurring theme is the lack of diversity in leadership, with respondents noting that top management rarely mirrors the communities they serve a gap that extends to the urgent need for bilingual and bicultural Staff. Finally, systemic issues regarding compensation and pay equity remain a critical barrier, as low salaries and a high cost of living effectively exclude low-income demographics and perpetuate classism within the sector.
)(n=55)
Inclusion, Culture, and Organizational Commitment
Lack of Diversity in Leadership & Workforce Language and Community Access Compensation, Pay Equity, and Systemic Barriers
Internal issues related to noninclusive workplace culture, and addressing barriers such as HR support or accessibility.
Concerns over the demographic representation across all levels, and the need for more diverse staff and volunteers.
Need for linguistic accessibility and hiring staff who reflect specific non-English speaking or under-engaged community populations.
Challenges related to salary, pay equity, and a call to address classism and poverty as DEIA issues.
Organizational Affirmation and Strategic Focus
The organization is already addressing DEIA, with strategic planning, existing programs, or strong organizational commitment.
“DEIA does not seem to be a priority and much of what is said and done is performative. I think we need our leadership to be more diverse for sure.”
“The two co-founders are both white and have a lot of wealth, I think sometimes that distorts their knowledge of the reality most of the staff face.”
“I think the biggest thing we’re always trying to do is to hire people that mirror the communities we’re serving.”
“Education about how classism and poverty are aspects of DEI - these are rarely mentioned or addressed alongside trendier topics like sexuality, race, gender.”
“We are in the stage of finalizing a strategic plan. We’ve been intentional in including a DEAI lens in all we do, so it is part of our DNA.”
Size reflects frequency of responses
Nonprofit leaders provided a window into how their organizations are currently moving from DEIA commitments to concrete practices. The most established efforts reported this year center on diversifying board membership (77%) and adopting equity-oriented program delivery (68%). While these findings reflect distinct data points from our previous 2022/2023 report, the results suggest an ongoing trend toward prioritizing both board diversity and the specialized training needed to sustain it. Notably, specialized DEIA training, which saw the lowest engagement in both samples, is seeing a surge in momentum: 83% of organizations now report either having this training in place or planning for it in the coming year, a marked increase from the 61% reported in the previous study.
Yes Not yet, plan to next year
Implemented practices to increase the diversity of board members
Integrated an equity-oriented approach into program delivery
Implemented practices to increase the diversity of job candidates
Sought community input to better understand needs
Provided specialized training for staff on DEIA
Provided specialized training for board members on DEIA
Nonprofit leaders shared their perspectives on their organizations’ internal climate for DEIA work, specifically weighing their satisfaction with their organization’s willingness to discuss these issues against their actual ability to implement practices. The current findings suggest a high level of comfort with dialogue, as 85% of leaders reported being completely or very satisfied with their organization’s openness to DEIA conversations; however, satisfaction with the ability to implement these practices remains lower at 65%. While these findings represent separate snapshots in time, comparing them to the 2022/2023 report reveals a notable upward trend in both areas: satisfaction with the willingness to discuss increased from 74% (in 2022/2023) to 85%, while the ability to implement rose from 52% (in 2022/2023) to 65%. This suggests that while an “implementation gap” persists, organizations are reporting greater satisfaction in their capacity to move beyond conversation and into action.
Satisfaction with nonprofit’s willingness to discuss and ability to implement practices that increase DEIA (ns=103→104)
Willingness to discuss Ability to implement practices
Completely satisfied
Very satisfied
Somewhat satisfied
Slightly satisfied
Not at all satisfied
When looking at how nonprofit leaders compare to the broader workforce, a gap appears in how each group experiences their organization’s commitment to DEIA. While these findings represent distinct groups from separate surveys and do not necessarily reflect a one-to-one comparison within the same organizations the data suggests that leaders generally feel more positive about the internal climate than those in non-leadership positions.
For instance, 85% of leaders reported being “completely” or “very” satisfied with their organization’s willingness to discuss DEIA, compared to 63% of the workforce respondents. This difference continues regarding the ability to implement actual practices. While 65% of leaders expressed high satisfaction with their organization’s capacity to execute DEIA initiatives, only 41% of the workforce shared that sentiment. Additionally, 30% of the workforce respondents reported they are only “slightly” or “not at all” satisfied with implementation, whereas only 12% of leaders felt the same.
Willingness to discuss Ability to implement practices
When asked how their organizations have adjusted or introduced changes to DEIA practices beginning in 2025, the majority (69%) of respondents reported no changes. However, qualitative feedback reveals that this lack of change often stems from resilience rather than disengagement. Many organizations described themselves as “standing fast” in their values and reaffirming a “renewed internal commitment to DEIA.”
While some organizations noted they face fewer external threats because they are “not federally funded,” others explicitly stated they would “not comply in advance” with shifting political pressures. These voices point to a sector that remains deeply committed to its values, maintaining DEIA as a guiding principle even in the face of uncertainty.
“We are standing fast and strong by continuing our DEIA commitments and work around these topics. We are not federally funded so do not have that threat.”
The majority (~69%) of leaders indicated no changes.
“Renewed internal commitment to DEAI.”
“We have not done a single thing. We have made the decision not to comply in advance. Changes will only be considered if we are directly asked/told to do so.”
For the organizations that reported making changes to their DEIA practices beginning in 2025, the qualitative data reveals a spectrum of strategic adaptations. While the majority reported no changes, those that did typically followed one of three distinct paths: navigating external compliance, reaffirming their internal commitment, or formalizing policies.
“We have had to modify our language to talk about health access instead of using DEI. We have not modified our programming.”
“Took down the DEI webpage changed the language used on our website.”
“No changes we have doubled down on DEIAJ efforts.”
“DEIA is now part of our strategic plan so we have not moved away from it but leaned into it.”
“We have evaluated language and how we communicate the work that we have engaged in for decades.”
Workforce respondents identified several key shifts in how organizations are managing DEIA practices in 2025. Many reported a status quo, where policies remained unchanged because inclusivity was already a priority or staff were unaware of new adjustments. Others observed a push for capacity building, characterized by hiring more representative staff and boards or investing in specialized leadership training. A third group noted a move toward compliance and caution, with some organizations “re-branding” or removing DEIA language from public platforms to navigate funding mandates or potential backlash. Finally, a focus on accessibility emerged through expanded language resources, such as increased bilingual signage and translation services for community outreach.
“I haven’t seen/heard of any changes being made.”
“We developed a new strategic plan and made DEIA a focus area for our work serving TK-12 students.”
“We have re-branded our DEI efforts to be in compliance with federal mandates.”
“We are putting up a LOT for Spanish signage and trying to improve traffic flows to increase accessibility.”
Size reflects frequency of responses
Leaders identified several distinct challenges to increasing board and staff diversity within their organizations. While some have already reached their goals or report no barrier encountered, others face a struggle with time and interest/willingness and specific skills, citing a lack of candidate bandwidth or specialized expertise.
Compensation and cost of living also represent a significant hurdle, as high local living costs and noncompetitive wages impact both recruitment and retention. Finally, internal organizational factors and a limited recruitment networks, such as high giving requirements and ineffective outreach, continue to be challenges for many.
Candidates without sufficient education, expertise, or bilingual capabilities
“Qualified individuals with the expertise and skill sets we seek.”
Inability to pay competitive wages and meet cost of living leading to turnover and hiring issues
“Recruiting bilingual staff in a competitive environment with both salary and housing challenges.”
Recruitment Network & Effort
Compensation & Cost of Living
Lack of term limits, high giving requirements, lack of leadership understanding
“Barriers have been in increasing diversity on the board due to the current lack of diversity.”
Size reflects frequency of responses
Finding people with enough time, lack of interest, misalignment in the applicant pool
“Many of the folks who fit the demographics and/or lived experience of those we serve are either already serving on other boards or working individuals who don’t have the bandwidth to take on more.”
Challenges in recruitment methods, lack of focused outreach, ineffective job postings
“Applicant pool is determined by who receives notification of the vacancy. We could do a better job sending those out to diverse communities.”
Organizational Factors
Already achieved diversity, mitigated barriers, and has no challenges at the time
“The board was chosen to be representative of our community, and we persisted in making sure of that before forming the board.”
Nonprofits across Santa Barbara County continue to face an escalating demand for services driven by a complex range of community and political factors. This section explores the self-reported drivers behind these shifting needs and reflects the internal capacity of organizations to respond effectively. It also describes how nonprofits characterize their own ability to maintain service quality while managing increased demand and evolving community expectations.
The majority of leaders reported an increase in demand for their services, with 62% indicating growth, including 22% reporting a substantial increase and 40% a moderate increase. This represents a decline from the 2022/2023 report, where 82% reported increased demand. In the current findings, increases were most common among philanthropy, mutual benefit, and higher education organizations, while arts organizations more often reported stable demand and environmental organizations more often reported decreases.
Factors that have led to the change
“More
people have learned about our services and entered phases of life where our services are needed, but availability of services in the county has remained flat overall.”
Human Services Organization
“Still affects from COVID”
Human Services Organization
For the 62% of leaders who reported an increase in demand for their organization’s services, keeping pace with community needs remains a challenge. In the current survey, 20% of respondents stated their organizations are able to fully meet this increased demand, while 51% reported being able to address most of it. In the 2022/2023 survey, 12% were fully able to meet demand and 33% could meet most.
In the current survey, most leaders reported that their program operations are either provided to the same extent as usual (62%) or to a greater extent (23%). A smaller portion of respondents reported a moderately reduced capacity (10%), while very few reported a severely reduced capacity (4%) or not delivering services at all (1%). In the 2022/2023 survey, 37% of leaders provided services to a greater extent, 35% to the same extent, and 28% at a reduced capacity or not at all.
Financial stability in Santa Barbara County’s nonprofit sector is sustained through a combination of contributions, grants, program revenue, and diverse funding streams. This section reviews selfreported financial health indicators and shares leaders’ projections for the coming year. The section examines the status of operating cash reserves and the specific impacts of inflation on organizational operations and budgets. Additionally, this section describes how organizations are navigating the loss of federal funding, their evolving relationships with funders, and the strategic actions taken to secure future support, including instances of mission adaptation or expansion.

The nonprofit sector in Santa Barbara County has demonstrated continuous expansion in terms of revenue, expenses, and assets, as indicated by the most recent six years of IRS tax data. The total assets held by the nonprofit sector in the county reached $5.9 billion in 2023.
Barbara County 6-year trend in revenue, expenses, and assets (in billions)
Excludes hospitals, higher education, and Direct
IRS data reveal a persistent imbalance in how nonprofit resources and financial assets are distributed across Santa Barbara County. South County continues to have a greater concentration of headquartered nonprofits and substantially more assets per capita than North or MidCounty; for example, South County has one nonprofit for every 348 residents, compared to one for every 1,170 individuals in North County.
While South County has a higher concentration of nonprofit headquarters, the leader survey shows that these organizations often provide services beyond their main office locations. This regional reach is visualized in the heatmap on page 10, which represents the various areas served by participating nonprofits.
Excludes Direct Relief, hospitals, and higher education, though it may include organizations directly related to the higher education systems, such as UC foundations and alumni associations. Refer to Appendix on page 95 for information on regional classification.
Most nonprofit leaders report a favorable financial situation, with 69% (n=67) describing their current financial health as somewhat or very strong. These figures are consistent with the 2022/2023 report (67% reported somewhat or very strong).
Looking ahead, 74% of leaders (n=73) predict their financial health will either stay the same or improve over the next 12 months. This represents a decline in optimism from the 2022/2023 report, when 94% of leaders expected their situation to remain stable or improve, and only 6% anticipated it would worsen.
Additionally, survey responses highlighted the proportion of the organizations that have a healthy cash reserve, with 72% of the respondents (n=66) reporting having six or more months of cash reserves on hand, which is higher than the typical amount for nonprofits.
Leaders also predicted a declining outlook for fundraising for the next fiscal year, with 38% predicting that it would be the same and 36% somewhat or much worse than the previous year. This is a decline from the 2022/2023 report where 14% of leaders predicted the next fiscal year would be worse for fundraising and 51% predicted it would hold steady.
Nonprofit leaders identified funding capacity building (78%), offering unrestricted funding (73%), and maintaining proactive communication (65%) as the most frequently experienced funder practices. In comparison to the 2022/2023 report, there are some noteworthy changes. Most notably, the perception of funders prioritizing BIPOC-serving nonprofits dropped from 70% (2022/2023) to 61% (current), and the percentage of leaders reporting reduced reporting requirements fell from 58% (2022/2023) to 45% (current).
Funding capacity building for nonprofits
Providing unrestricted funding
Communicating proactively and regularly about decision making
Lifting up the voices of the communities least heard in public discourse
Prioritizing funding BIPOC-serving nonprofits
Providing multi-year support
Shortening applications
Funding advocacy and policy-related work
Reducing reporting requirements
When asked about the pressure to change how they operate to secure funding, most nonprofit leaders report they are not feeling pressured to shift their core focus. Overall, the data shows a strong commitment to staying the course; 64% of respondents feel no pressure at all to adapt their mission, and 62% report no pressure to chase funding opportunities that fall outside their organization’s primary purpose. While the majority remain steady, expanding the organization’s mission is the area where leaders feel the most weight while 57% feel no pressure at all, 43% report feeling some level of pressure to grow beyond their original scope to meet funding requirements.
Adapt your organization’s mission
Seek funding opportunities outside of your organization’s mission
Expand your organization’s mission
In the current survey, nonprofit leaders report feeling the effects of inflation, particularly regarding their workforce and operations. The most widespread effects reported are the pressure to raise salaries (73%) and increased prices for program-related costs (69%), while 44% of organizations have seen a decrease in the value of their investments. Despite these pressures, organizations are largely shielding their communities from the impact, with only 18% reporting they have had to raise prices for clients or consumers.
When compared to the 2022/2023 report, some changes emerge, most notably with the percentage of organizations experiencing increased prices for program-related costs dropping from 81% to 69%. Although the immediate pressure to raise salaries saw a minor dip from 79% to 73%, there is a significant increase in leaders who now expect this to become a challenge in the coming year, rising from 8% to 16%.
of inflation (ns=87→92)
Not yet, but expect to in the next 12 months Yes
We have had to raise prices clients/consumers pay for our services Decrease
Higher interest rates on credit or loans
Overall, Santa Barbara County nonprofits heavily depend on contributions (e.g., individual donations, government grants, and foundation and corporate grants), making up 50% of their revenue, followed by program revenue at 44%, which includes fees for services such as ticket sales and medical fees. Investment and asset sales, as well as all other revenue, make up smaller portions of their revenue at 4% and 3%, respectively.
When compared to other selected California counties, Santa Barbara County shows a lower percentage of revenue from contributions, balancing this with a higher percentage of revenue from program-based sources.
The revenue sources of different subsectors vary considerably. For instance, hospitals and higher education organizations rely heavily on program service revenue, whereas International and Religious organizations rely mostly on contributions.
In 2023, contributed revenue accounted for 50% of total revenue for nonprofits in Santa Barbara County. Of these contributions, direct contributions made up a pluarlity (49%) of contributions with government grants accounting for an additional 47%. Compared to other select counties, California State, and the United States, Santa Barbara County relies more on government grants and less on direct contributions.
Nonprofit leaders report a relatively balanced funding mix, with individual donations (22%) and foundation grants (21%) serving as the primary drivers of revenue. Government grants and contracts (18%) and fees for goods and services (17%) also represent significant portions of the local sector’s financial base. Smaller contributions come from fundraising events, membership dues, and investment interest, each accounting for roughly 5% of total revenue. Notably, the distribution of government funding reported by survey respondents closely mirrors broader government grant allocations across Santa Barbara County. This alignment strengthens confidence in the validity of the sample, particularly for analyses related to funding shifts and potential funding losses.
This report, consistent with the 2022/2023 State of Nonprofits in Santa Barbara County, found a discrepancy between leaderreported revenue estimates and 2023 IRS data. Program revenue from fees for goods and services is estimated at 17% by respondents, compared to 44% in IRS data. The survey sample also differs somewhat from the broader nonprofit sector reflected in IRS 990 data, with slight overrepresentation of human services, arts, and environmental organizations and underrepresentation of religious organizations. These differences may influence reported revenue patterns. The discrepancy likely reflects both sample composition and differences in how respondents interpret revenue categories compared to IRS reporting definitions.
For organizations that rely on government support, the future of federal funding is a major concern. Among the leaders who received federal funding, a significant majority are bracing for a reduction in support; 56% stated they anticipate losing federal funding in the future, while 24% report they have already lost it. With only 12% stating they have not lost funding and 36% still unsure of what to expect, these findings point to a period of high uncertainty for nonprofits that depend on federal sources to fuel their programs.
Note. Percentages may total greater than 100% as respondents were able to select all that applied.
When asked to predict the impact of losing federal funding, nonprofit leaders expressed deep concern about the potential for significant organizational disruption.
For many, the primary consequence would be a direct reduction in programming and services, such as critical aid to homeless youth, alongside necessary staffing adjustments like layoffs or shifts in job responsibilities.
Beyond operational cuts, leaders anticipate a rise in financial instability and fundraising pressure as they scramble to find alternative revenue sources to compensate for the loss.
For some, the impact would lead to a radical organizational transformation, potentially requiring executive-level layoffs and a complete shift in their business model, while the most vulnerable organizations face the ultimate risk of a total nonprofit shutdown.
“The loss of federal funding will reduce services to homeless youth.”
“…there will be layoffs or shifting job responsibilities.”
“I expect to raise funds from other sources to compensate.”
“Loss of our federal contract would fundamentally transform the organization... require a least one layoff reduction of Executive Director… & more traditional fundraising...”
“Close program and lay off team members.”

When describing their relationships with funders, nonprofit leaders shared experiences that range from deeply integrated partnerships to more minimal connections. The most prominent theme was one of positive, strong support, with many leaders highlighting collaborative partnerships where funders act as true champions for the mission. While some organizations are in a phase of evolutionary growth as they establish new ties, others experience limited engagement or challenging dynamics, often due to a lack of internal staff capacity.
Relationships with funders (Leaders) (n=84)
Lack of capacity or challenging aspects to funder relationships
“Weak. We are understaffed and have no development person.”
Emphasis on working together
“We’re grateful for opportunities to build relationships with funders as we’ve grown.”
Challenging/ Difficult
Collaborative/ Partnershipbased
Relationships in early stages
“In the early stages of establishing ourselves with funders.”
Funder relationships are good/solid
“Our funders are very generous and supportive.”
Growing/ Developing Mixed/ Varied by Funder
Some are positive, some challenging
“Healthy but they seem to expect a lot for granting very little.”
Minimal/limited funder engagements
“Our funders are committed to the work and believe in us. We communicate through written material, but do not have the opportunity to intimately get to know our funders.”
Size reflects frequency of responses
Nonprofits in Santa Barbara County have identified specific priorities for organizational growth, with strategic planning, communication, and crosssector collaboration emerging as primary capacity-building needs. This section explores self-reported confidence in conducting evaluation activities and examines various facets of organizational learning as reported by both leaders and workforce members. Additionally, these findings share workforce perspectives on organizational culture and the internal environment, identifying the most critical factors that staff members characterize as impacting their daily work.
When workforce members were asked to identify the most critical factors impacting their work, several core themes emerged that characterize the current professional environment. The most frequently cited concerns centered on financial and funding instability, alongside management and leadership deficits that impact daily operations. These issues are further compounded by workload and staffing strain, which many reported as a primary driver of burnout. Additionally, themes regarding compensation and a perceived lack of internal value and support highlight specific areas where morale and retention are most at risk, providing a clear roadmap for prioritizing organizational improvements.
Insufficient human resources to meet demands
“Having tons of work and not enough personnel to assist. Feeling burnout.”
Currently beneficial factors or coping mechanisms
“My direct supervisors… appreciate the work I do, allow autonomy when I need it and are there to support.”
Clarity, frequency, and quality of communication
“Insufficient communication with my manager and colleagues.”
Immediate supervisor or overall organizational leadership problems
“Leadership is extremely disorganized and lack communication with staff.”
Size reflects frequency of responses
Immediate and long-term financial health of the organization
“Unstable federal funding (and regulation) and trying to figure out a sustainable, more diversified funding model going forward.”
“I don’t feel valued any more or like I’m part of a team.”
Impact of inadequate or non-competitive salary
“The amount I am paid impacts whether I can continue my work for this organization.”
Outside factors that directly influence operations or clients
“Political climate, Medicaid cuts, grant funding.”
Workforce members were asked to describe their organizational work environment, revealing a landscape defined by both mission-driven commitment and significant operational strain. While many responses highlight a culture of support and collaboration, others point to challenges involving compensation, high workloads, and resource scarcity. The following themes provide a lens into the balance between the sector’s altruistic goals and the pressures impacting staff well-being.
(n=69)
Positive, friendly, healthy, or comfortable atmospheres, that include trust, professional respect, support from leadership.
Collaboration & Connection
Teamwork, communication, and connectivity, and a mission-driven focus to issues of being siloed or disjointed.
“Our President & CEO promotes a healthy work life balance for employees. We have a very positive, drama free work environment where employees feel valued and appreciated.”
“The organization is extremely siloed. It experienced a rapid growth period and leadership is having trouble adjusting to this. Cross functional collaboration isn’t intentional or strategic from the top down.”
High workloads, feeling undervalued, low pay relative to the cost of living (HCOL), or being under-resourced despite a strong passion for the organization’s mission.
“I sense/and have heard that in some there is quite a bit of bitterness about the amount of valuable work they do and feeling like they are ‘paid in passion.’”
Environments characterized by negativity, tension, disjointedness, toxicity, lack of professionalism, personal conflicts, or high stress.
“Big, busy and hard - the amount of vicarious trauma our staff are experiencing in working with clients facing chronic homelessness, severe mental illness, severe substance use has grown significantly in the last 5 years.”
Size reflects frequency of responses
Responses from nonprofit workforce members regarding their overall experience in the sector reveal a striking consistency with previous data, highlighting reoccurring challenges alongside strong personal rewards across respondents. The resulting themes are highly consistent with previous data, highlighting entrenched sectorwide challenges and deep personal rewards.
The most dominant finding is the conflict between intrinsic motivation and financial reality, contributing to retention challenges over time.
A commonly cited issue is low compensation, which prevents the nonprofit sector from competing with for-profit wages. This financial limitation is directly tied to the high local cost of living and housing.
“I want to continue this work very badly and am frustrated that it is so difficult to do so financially. I hate seeing passionate people forced out of their roles for the same reason.”
Internal organizational health appears to influence retention, with respondents reporting highly polarized experiences.
A subset of responses (the majority who are from the same subsector) identified significant concerns regarding organizational culture and leadership. These participants discussed strained environments and governance issues that directly impact workforce sustainability, resulting in frequent staff turnover and burnout.
“I have worked for several nonprofits, and…have dealt with multiple difficult bosses, and a few very challenging board members during this time.”
Alongside these challenges, the workforce is sustained by a powerful sense of mission, value, and fulfillment. Employees find their work meaningful, purposeful, and rewarding “beyond a paycheck,” seeing it as an honor to contribute to the community.
“I love working in the nonprofit sector. I feel like my work has value to the community and it gives me a sense of purpose.”
Strengthening communication and public relations (51%), strategic planning (50%), and board governance (50%) represent the most significant areas of focus as reported by nonprofit leaders. As the technological landscape shifts, artificial intelligence (17%) has also surfaced as an area of organizational capacity that is gaining attention. While many of the needs have remained consistent, some areas saw a decrease. For instance, DEIA training saw a substantial decrease from 43% (2022/2023) to 17% (current), and leadership development from 48% (2022/2023) to 30% (current).
Communication and public relations
Strategic planning
Board governance
Collaborating with other organizations
Program evaluation
Volunteer engagement/administration
Succession planning
Leadership development
Engaging in advocacy
Business modeling
Specific cohort or roundtable opportunities
DEIA training
Scenario planning
Artificial intelligence
Financial literacy
Other
When workforce members were asked to select the top organizational capacity needs for their organization, they mainly reflected sentiments similar to the needs identified by leaders, with some notable differences. While both groups align on the importance of communication and public relations (52% for workforce, 51% for leaders), workforce members selected collaborating with other organizations (44% vs. 39% for leaders) and engaging in advocacy (34% vs. 26% for leaders) more often.
Communication and public relations
Collaborating with other organizations
Strategic planning
Leadership development
Engaging in advocacy
Board governance
Program evaluation
Volunteer engagement/administration
Succession planning
DEIA training
Specific cohort or roundtable opportunities
Scenario planning
Financial literacy
Business modeling
Artifical intelligence
Other
Building on the assessment of organizational capacity, leaders shared their perspectives on their confidence in executing various evaluation activities. Respondents reported the greatest confidence in their organization’s ability to track program outputs, accurately measure program outcomes, and use evaluation findings for decision-making. While these results are largely consistent with the 2022/2023 report regarding which activities leaders feel most equipped to conduct, the current survey reveals a pattern of heightened confidence across nearly all categories. The only area to see a decline in confidence was seeking out external consultants or organizations.
Accurately measure program outcomes that result from programs
Use evaluation findings for organizational decision making
Have dedicated staffing responsible for monitoring and evaluation
Seek out external consultants or organizations to help with conducting evaluations
Ratings on various facets of organizational learning suggest a strong cultural emphasis on collaboration and development, particularly regarding knowledge sharing and continuous learning. While leaders generally agree that their organizations value feedback and adjust strategies based on new information, there is comparatively less consensus regarding the frequency of formal reflection and the availability of opportunities for experimentation and innovation.
Strongly
Encourages organization members to share knowledge and insights with one another
Values and uses feedback from various stakeholders for decision-making
Supports continuous learning through training, mentoring, or professional development
Adjusts strategies and practices based on new information and changing conditions
Regularly reflects on successes and failures to improve future practices
Values and uses feedback from evaluations for decision-making
Provides opportunities for experimentation and innovation
Workforce members reported generally positive levels of agreement regarding organizational learning facets, with the strongest consensus around knowledge sharing and continuous learning. However, a comparison with leadership data reveals a notable perception gap, as leaders reported “strongly agree“ at significantly higher rates across every category. This disparity is most pronounced regarding knowledge sharing (82% for leaders vs. 51% for staff) and supporting continuous learning (60% for leaders vs. 36% for staff), suggesting that while leadership may prioritize these cultural values, the frontline workforce experience varies. While it’s important to note that workforce members do not represent a direct one-to-one comparison to organizations represented by leader responses, the trend indicates a disconnect in how these cultural facets are felt from different perspectives across the sector.
Regularly reflects on successes and failures to improve future practices.
Values and uses feedback from staff for decision-making.
Provides opportunities for experimentation and innovation.
Adjusts strategies and practices based on new information and changing conditions.
Supports continuous learning through training, mentoring, or professional development.
Encourages organizational members to share knowledge and insights with one another.
Beyond specific capacity metrics, workforce members identified several pressing needs facing their organizations centered primarily on financial stability and employee well-being. From these responses, emergent themes begin with the primary concern of financial resources & sustainability, followed by compensation, benefits, & cost of living. Additional priorities include organizational culture and internal operations, specifically regarding leadership transparency and internal communication, and finally, the pressing challenges of staffing, retention, and capacity.
Financial Resources & Sustainability
29% Compensation, Benefits & Cost of Living
Need for increased and diversified funding, improving fundraising, building endowments, and concerns over financial stability and external policy changes.
“…low wages and coupled with high cost of living, as well as issues with supervisors. I have noticed quite a bit of turnover in my time here. …the recent federal cuts to funding has [added] additional pressure.”
28% Organizational Culture & Internal Operations
Low, uncompetitive pay for staff, the difficulty of affording the local cost of living and housing, pay disparities, and need for better benefits.
“Pay scales across the organization appear unbalanced... I have coworkers who are stuck in unpleasant rental situations, others who commute over an hour each way, and some who live in their cars”
22% Staffing, Retention, & Capacity
Changes to organizational culture, management/leadership transparency, and needs such as training, facilities, and board/volunteer engagement.
“…employees [are required] to push past their contracted hours while compensating with poverty wages and insulting salaries for this city.”
Understaffing, high rates of turnover, retention issues, need for more staff, burnout, and the need for qualified personnel to meet service demand.
Size reflects frequency of responses
“Many folks are on the brink of burnout and are certainly feeling like they aren't adequately compensated for doing multiple jobs.”
Nonprofit leaders in Santa Barbara County continue to modify organizational practices in response to shifting community needs. This section explores how organizations have utilized collaboration, adaptation, and innovation to improve service delivery, including the formation of new partnerships, shifts in programming, and adjustments to staffing models and technology. These findings highlight specific examples shared by leaders through the survey, illustrating the creative strategies employed to better serve their communities.
Of leaders said that their nonprofit participated in a network, coalition, or collective impact initiative.
Collaboration remains a cornerstone of local leadership, with most executives deeply embedded in the county’s network of coalitions and collective impact initiatives. Current data shows high engagement, with the majority of respondents participating in either three (26%) or six or more (27%) groups. These results mirror findings from the 2022/2023 report, indicating a sustained commitment to partnership as a primary strategy for addressing community needs.
Collectives with which nonprofits are engaged (n=70)
# of collectives
Nonprofit leaders described how they are adapting and innovating in response to ongoing challenges, with collaboration emerging as a consistent and central strategy. Many emphasized strengthening partnerships with other nonprofits, schools, healthcare providers, and public agencies to extend their reach and make more effective use of limited resources. Rather than working independently, organizations are aligning efforts, sharing capacity, and co-creating solutions that better reflect community needs, often with a strong focus on accessibility and inclusion. This shift reflects a broader move toward a collaborative multiplier model, with some organizations reporting up to fourfold increases in reach and greater resilience through shared fundraising and resource pooling. At the same time, these efforts are taking shape within a context of real financial constraint, where rising costs and limited funding are driving organizations to be more strategic, creative, and responsive in how they deliver their work. These perspectives are reflected in the following responses:
“Public event participation has been significantly raised by partnering with local non-profits that share [a] mission.”
“We collaborate with at least 100 local organizations and businesses.”
“Collaboration is at our core… we’ve experienced such an exciting readiness to work together to fill each other’s gaps and augment each other’s opportunities.”
Direct responses from leadership regarding relationships with other local nonprofits reveal a culture rooted in partnership and mutual respect. While connections are often described as “collegial” and “trusting,” the depth of these ties ranges from general community standing to mission-specific alliances. However, a tension exists between the desire for deeper strategic collaboration and the practical realities of limited capacity and a competitive funding landscape. Ultimately, the sector views itself as “stronger together,” yet often lacks the time and “follow-through” required to move from friendly coexistence to active execution.
Description of relationships with other nonprofits as reported by leaders (n=84)
High Sentiment / Positive Standing Active Collaboration & Partnership Geographic or Sector Specificity Developing & Growing Competition & Isolation Capacity & Execution Barriers
Strong, healthy, or “excellent” reputations and relationships. “Strong, trusting, credible”
Working together, shared missions, and the belief that “many hands make light work.”
Strong relationships in a specific field or town.
“We recognize that one organization can’t do it alone.”
Organizations in the early stages of building a presence or seeking more “follow-through.”
“Strong, especially in our subfield.”
Challenges of a competitive funding landscape or a lack of connection.
“We’re still very much in the relationship-developing stages.”
“There is a growing sense of competition for funding.”
Limited staff, time, or resources that hinder the ability to maintain or grow relationships.
“Barriers in being able to foster and catalyze these relationships properly without a staff team.”
Size reflects frequency of responses
The Santa Barbara Foundation’s recommendations below are informed by the findings from the current State of Nonprofits research, as well as trends observed over six years and three report cycles. This longitudinal perspective allows us to speak with confidence about emerging trends, areas of progress, and opportunities for continued improvement. The following recommendations are intended to empower decision-makers across sectors. They focus on how we can collectively support the nonprofit sector, strengthen organizational health and effectiveness, and better serve our communities.
Understand and support the true costs of services
Nonprofits across Santa Barbara County are absorbing rising costs rather than passing them on to clients a choice that, while mission-driven, is quietly depressing wages, stretching staff capacity, and limiting organizations’ ability to scale with growing community need.
The data are clear: more than two-thirds of nonprofit leaders report increased prices for program-related costs, and more than 80% identify the local cost of living and housing market as their greatest barrier to staff recruitment and retention. At the same time, workforce members consistently identify workload and staffing strain as a primary driver of burnout, a direct consequence of operating under-resourced in an environment of escalating demand. Addressing this requires action on two fronts.
Organizations should invest in accurately compiling and transparently communicating the full costs of their programming, including staff compensation that reflects Santa Barbara County’s cost-of-living reality. When establishing pay ranges and annual increases, best practices for compensation analyses recommend benchmarks include local cost data, to accurately account for what it takes to live and work in this region.
Presenting full-cost budgets to funders is not a risk; it is an opportunity to make the case that sustainable community services require sustainable funding. Similarly, we recommend that funders incorporate budget review processes that account for the true cost of delivering services in a high cost-of-living environment.
Flexible funding mechanisms, including general operating support, help make it more possible for organizations to cover what is commonly their largest expense personnel and pay fair wages, stabilize their workforce, and direct their full capacity toward mission. Fair compensation expands the candidate pool, reduces turnover, and ultimately strengthens program effectiveness. Recognizing full costs in grant budgets is not overhead tolerance, it is an investment in the long-term health of the sector.
Volunteers are essential to nonprofit work across Santa Barbara County 88% of organizations rely on them, and more than 70% report that volunteers are absolutely essential or very important to program delivery. More than half of volunteers engage on a long-term basis, reflecting strong community commitment. Yet recruiting and retaining volunteers requires meaningful investments of time, funding, and staff capacity, as well as specialized skills. This includes building a pipeline of prospective Board members who can contribute their expertise to mission fulfillment.
Despite this reliance on volunteers, more than a third of organizations struggle to recruit them, and for nearly three-quarters of those, the shortfall directly impacts service delivery. Smaller organizations, which tend to be most dependent on volunteers, have experienced the steepest declines in volunteer engagement since 2020. Both the private sector and funders have meaningful roles to play. Businesses can partner with nonprofits through civic engagement initiatives, paid volunteer time, and gift-matching programs tied to volunteering. Funders can invest in capacity building that supports volunteer recruitment, training, and Board development.
Santa Barbara County’s longstanding geographic and socioeconomic divide means that Mid- and North County residents face greater need with fewer resources and fewer nonprofit organizations serving them. Over the past six years, however, there are encouraging signs of progress including growth in both the number of nonprofits headquartered in these areas, as well as an increase in the number of existing organizations expanding services to serve Mid- and North County. The number of nonprofits headquartered in Mid- and North County grew by 14% between 2020 and 2023, improving the population-to-nonprofit ratio in both regions. Nonprofit revenue per capita also increased—27% in Mid-County and 22% in North County and MidCounty saw a particularly notable rise in assets per capita (+41%).
Despite this progress, significant disparities remain. South County-headquartered nonprofits continue to hold assets greater than those in other regions and serve notably smaller populations with considerably more nonprofits. The gap between resources and need is substantial and persistent.
We commend the organizations that have already expanded or established services in Mid-, North, (and East!) County, and encourage all decision-makers to continue directing attention and investment toward these underserved areas.
Santa Barbara County’s nonprofit sector has built a genuine and durable collaboration culture. Eight in ten nonprofit leaders report active participation in a network, coalition, or collective impact initiative, a rate consistent with the prior report, reflecting sustained commitment rather than a passing trend. What’s emerging from this foundation is something more than coordination: it is a model of shared problem-solving that produces measurable results.
Nonprofit leaders describe a shift away from isolated service delivery toward what the data characterizes as “collaborative ecosystem multipliers,” integrated partnerships that bypass traditional capacity limits to achieve broader community reach. In practice, this has meant multiplier models where organizations train others to deliver programs, expanding the number of people served. It has also meant collective resilience, with networks mounting coordinated fundraising responses to absorb economic shocks in real time.
The barriers to deepening this work are not willingness: they are capacity and funding. Sustaining and scaling this momentum requires deliberate action from all sectors. Nonprofit leaders can actively explore opportunities for efficiencies and expanded reach through partnerships and collaborations with others that have shared areas of focus, complementary services, or constituencies.
We can all help the sector normalize what is working: shared service models, co-delivery arrangements, and joint programming, so that collaborative innovations outlast individual relationships or grant cycles. Funders and crosssector partners can create space for multisector dialogue that surfaces shared goals and partnership opportunities. They can also dedicate resources specifically to collaborative capacity, including funding for coordination roles, shared infrastructure, and the planning time required to move from idea to execution. Finally, it is essential we recognize collaboration as a fundable activity, not just an outcome. Doing so will allow the sector’s strong relational culture to translate into lasting collective impact.


*Additional demographic information such as race and gender identity is not displayed due to a low number of respondents answering those demographic questions.
County Region Classification
North County (Guadalupe | New Cuyama | Orcutt | Santa Maria)
Mid-County (Buellton | Lompoc | Los Alamos | Los Olivos | Santa Ynez | Solvang | Vandenberg SFB)
South County (Carpinteria | Gaviota | Goleta | Isla Vista | Montecito | Santa Barbara | Summerland)
U.S. Census Bureau. (2020). QuickFacts: Santa Barbara County, California. Retrieved from https://www.census.gov/quickfacts/santabarbaracountycalifornia References