PORTFOLIO
Saptadeep Deshmukh

Saptadeep Deshmukh
Hi! I am Saptadeep, a promising urbanist and urban planner who exhibits a profound interest in exploring the possibilities of machine learning integration into transportation planning. Having recently graduated with a degree in urban planning, I am is eager to apply my knowledge to real-world urban challenges. Of particular interest to myself, is the integration of machine learning and transportation planning, as I believe that machine learning can provide the foundation for data-driven, decision-making that can significantly improve mobility, reduce congestion, and enhance the quality of life in urban areas. In my personal time, I enjoy exploring the city on foot and bike, and remain an avid reader of urban planning and technology literature. I am passionate about the possibilities that technology can bring to urban environments, and aspire to make a meaningful contribution to the field of transportation planning through my research and work.

CURRICULUM VITAE
CONTACT DETAILS: WORK EXPERIENCE:
Postal Address: May 2021 -
Mobile:
E-mail:
LinkedIn:
House No. 3/8, Mathura Refinery Nagar, Mathura, Uttar Pradesh
+91 - 9910670508
pl.saptadeep492d@gmail.com
https://www.linkedin.com/in/saptadeep-deshmukh-6369b4197/
ACADEMIC HIGHLIGHTS:
Bachelors in Planning (B. Plan)
School of Planning and Architecture, Bhopal
CGPA - 7.37/ 10
High School Certificate (10+2)
Somerville School, Noida
Subjects: Physics, Chemistry, Maths, English
AREA OF INTERESTS:
• Transportation
• Public Transport
• Urban Freight
• Sustainability
• Machine Learning
• Remote Sensing and GIS
SOFTWARE SKILLS:
• ArcGIS
• QGIS
• Adobe Creative Suit
• Microsoft Suit
• Python Programming (Basic to Intermediate)
• IBM SPSS
• AutoCAD (Basic)
• SketchUp (Basic)
• Data Science (Basic)
August 2021
GIS Based Master plan for Greater Imphal Region, Manipur
• Project Intern at School of Planning and Architecture, Bhopal.
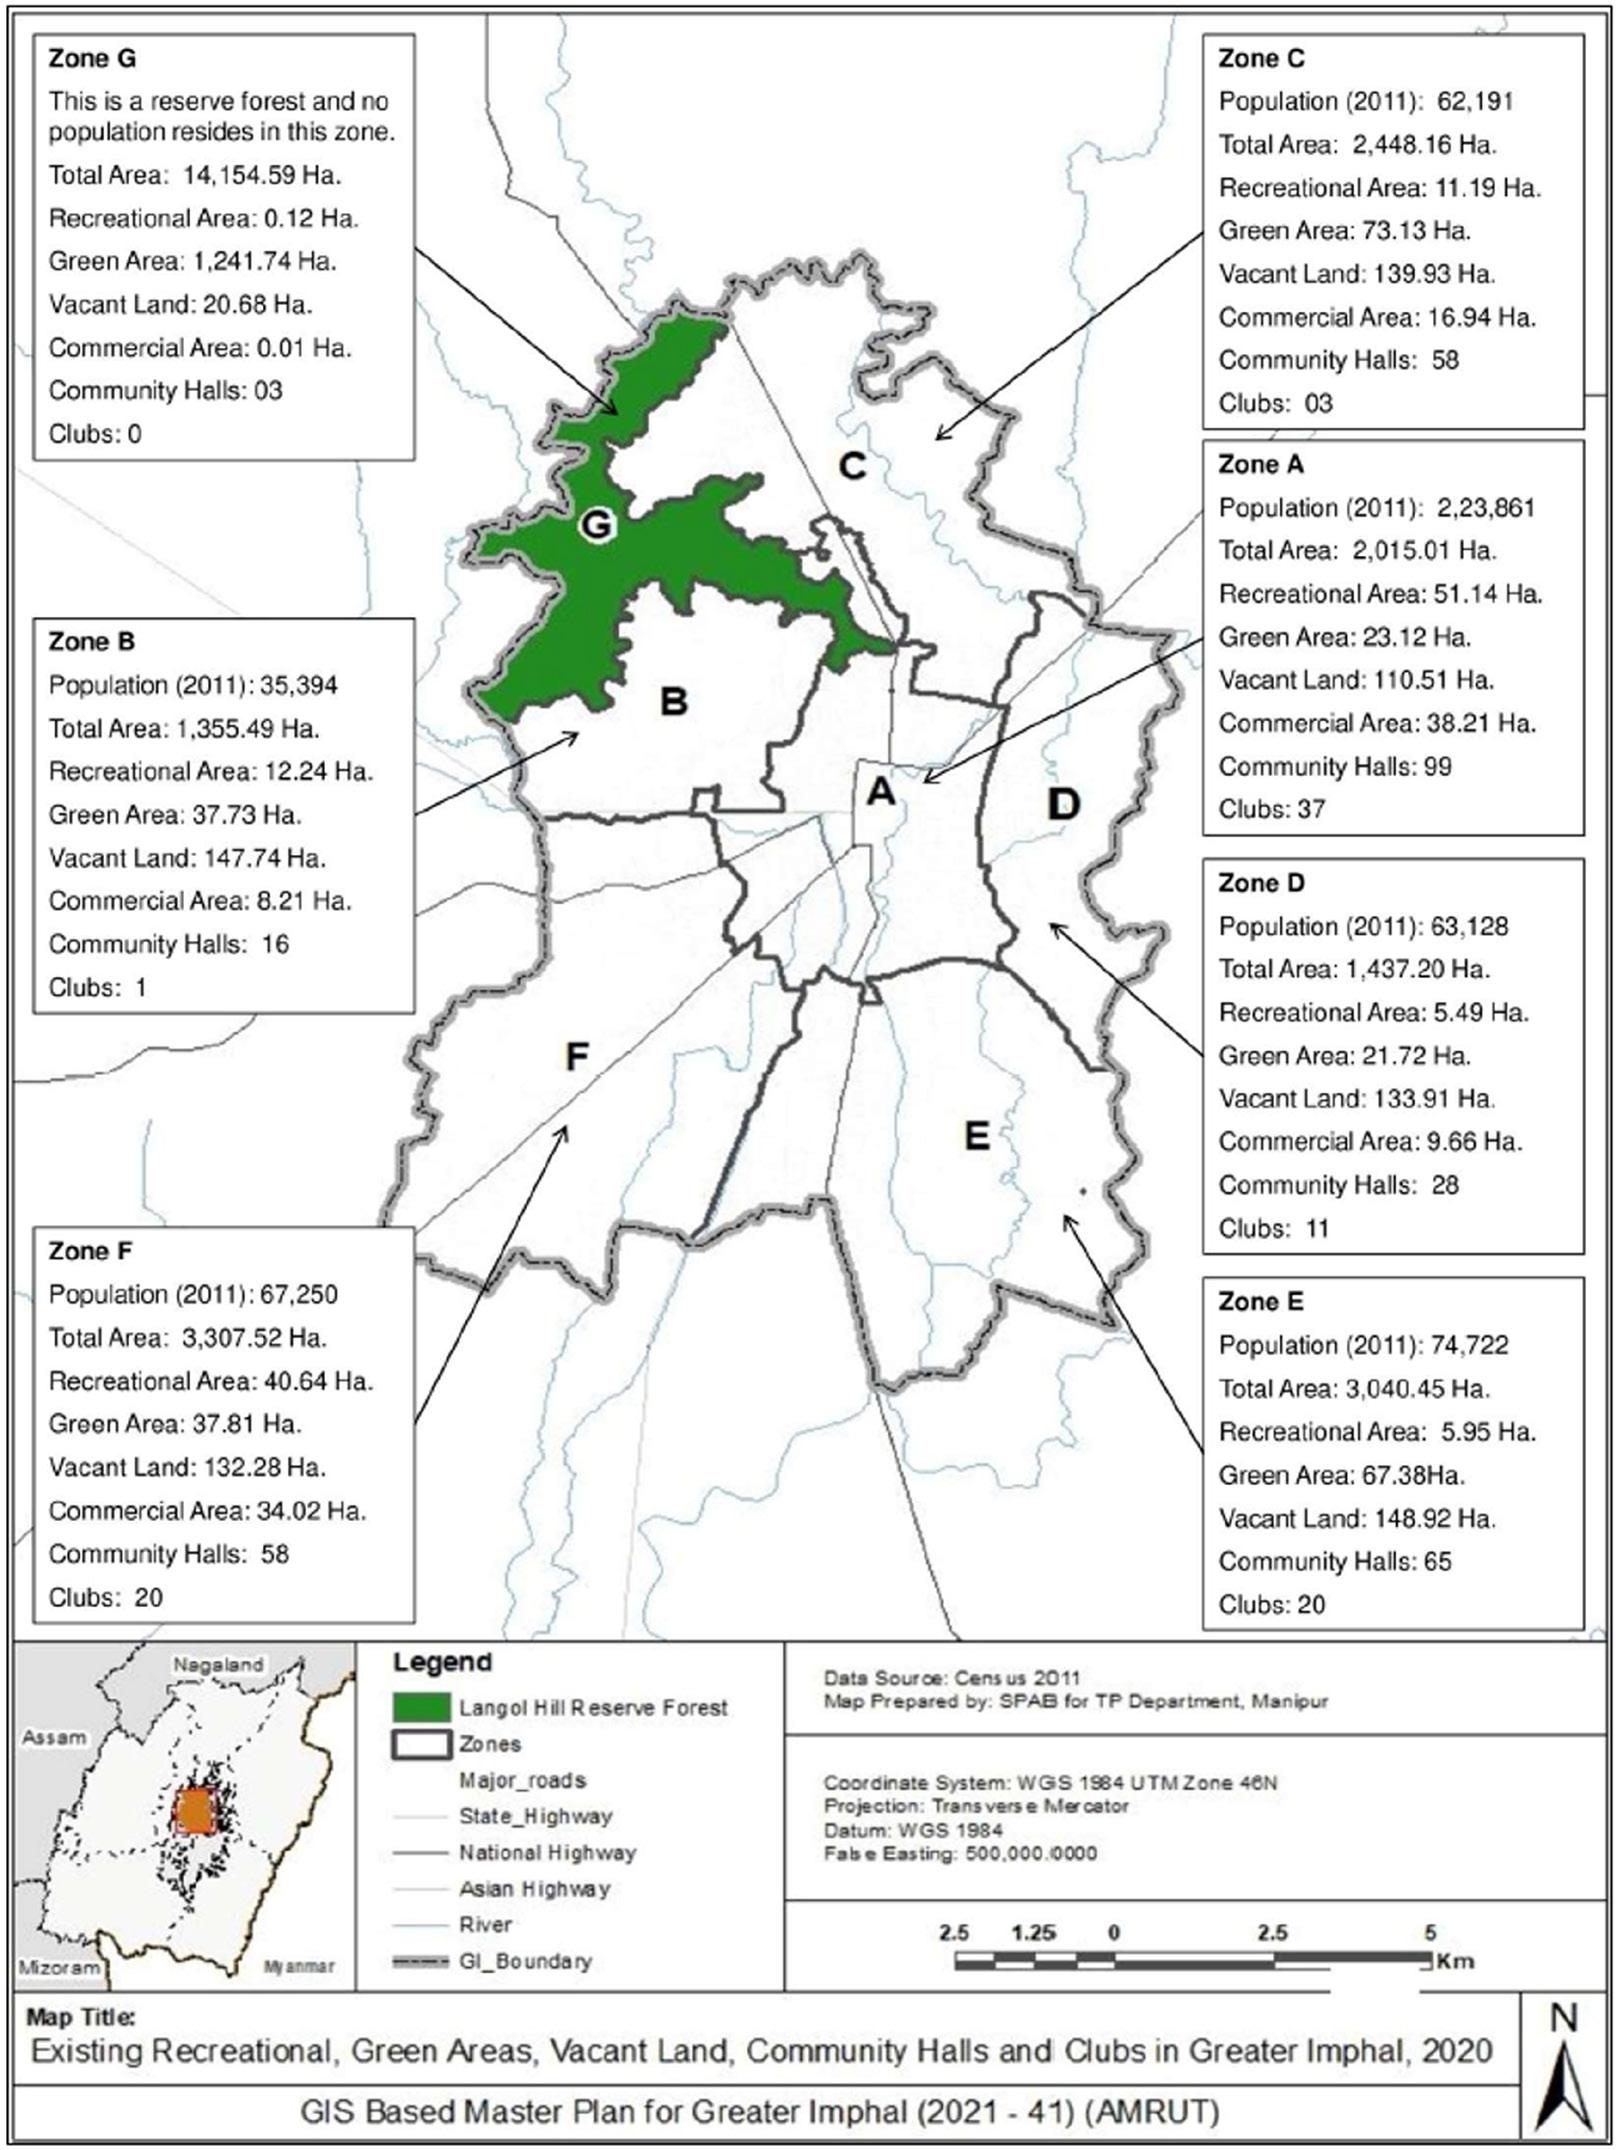
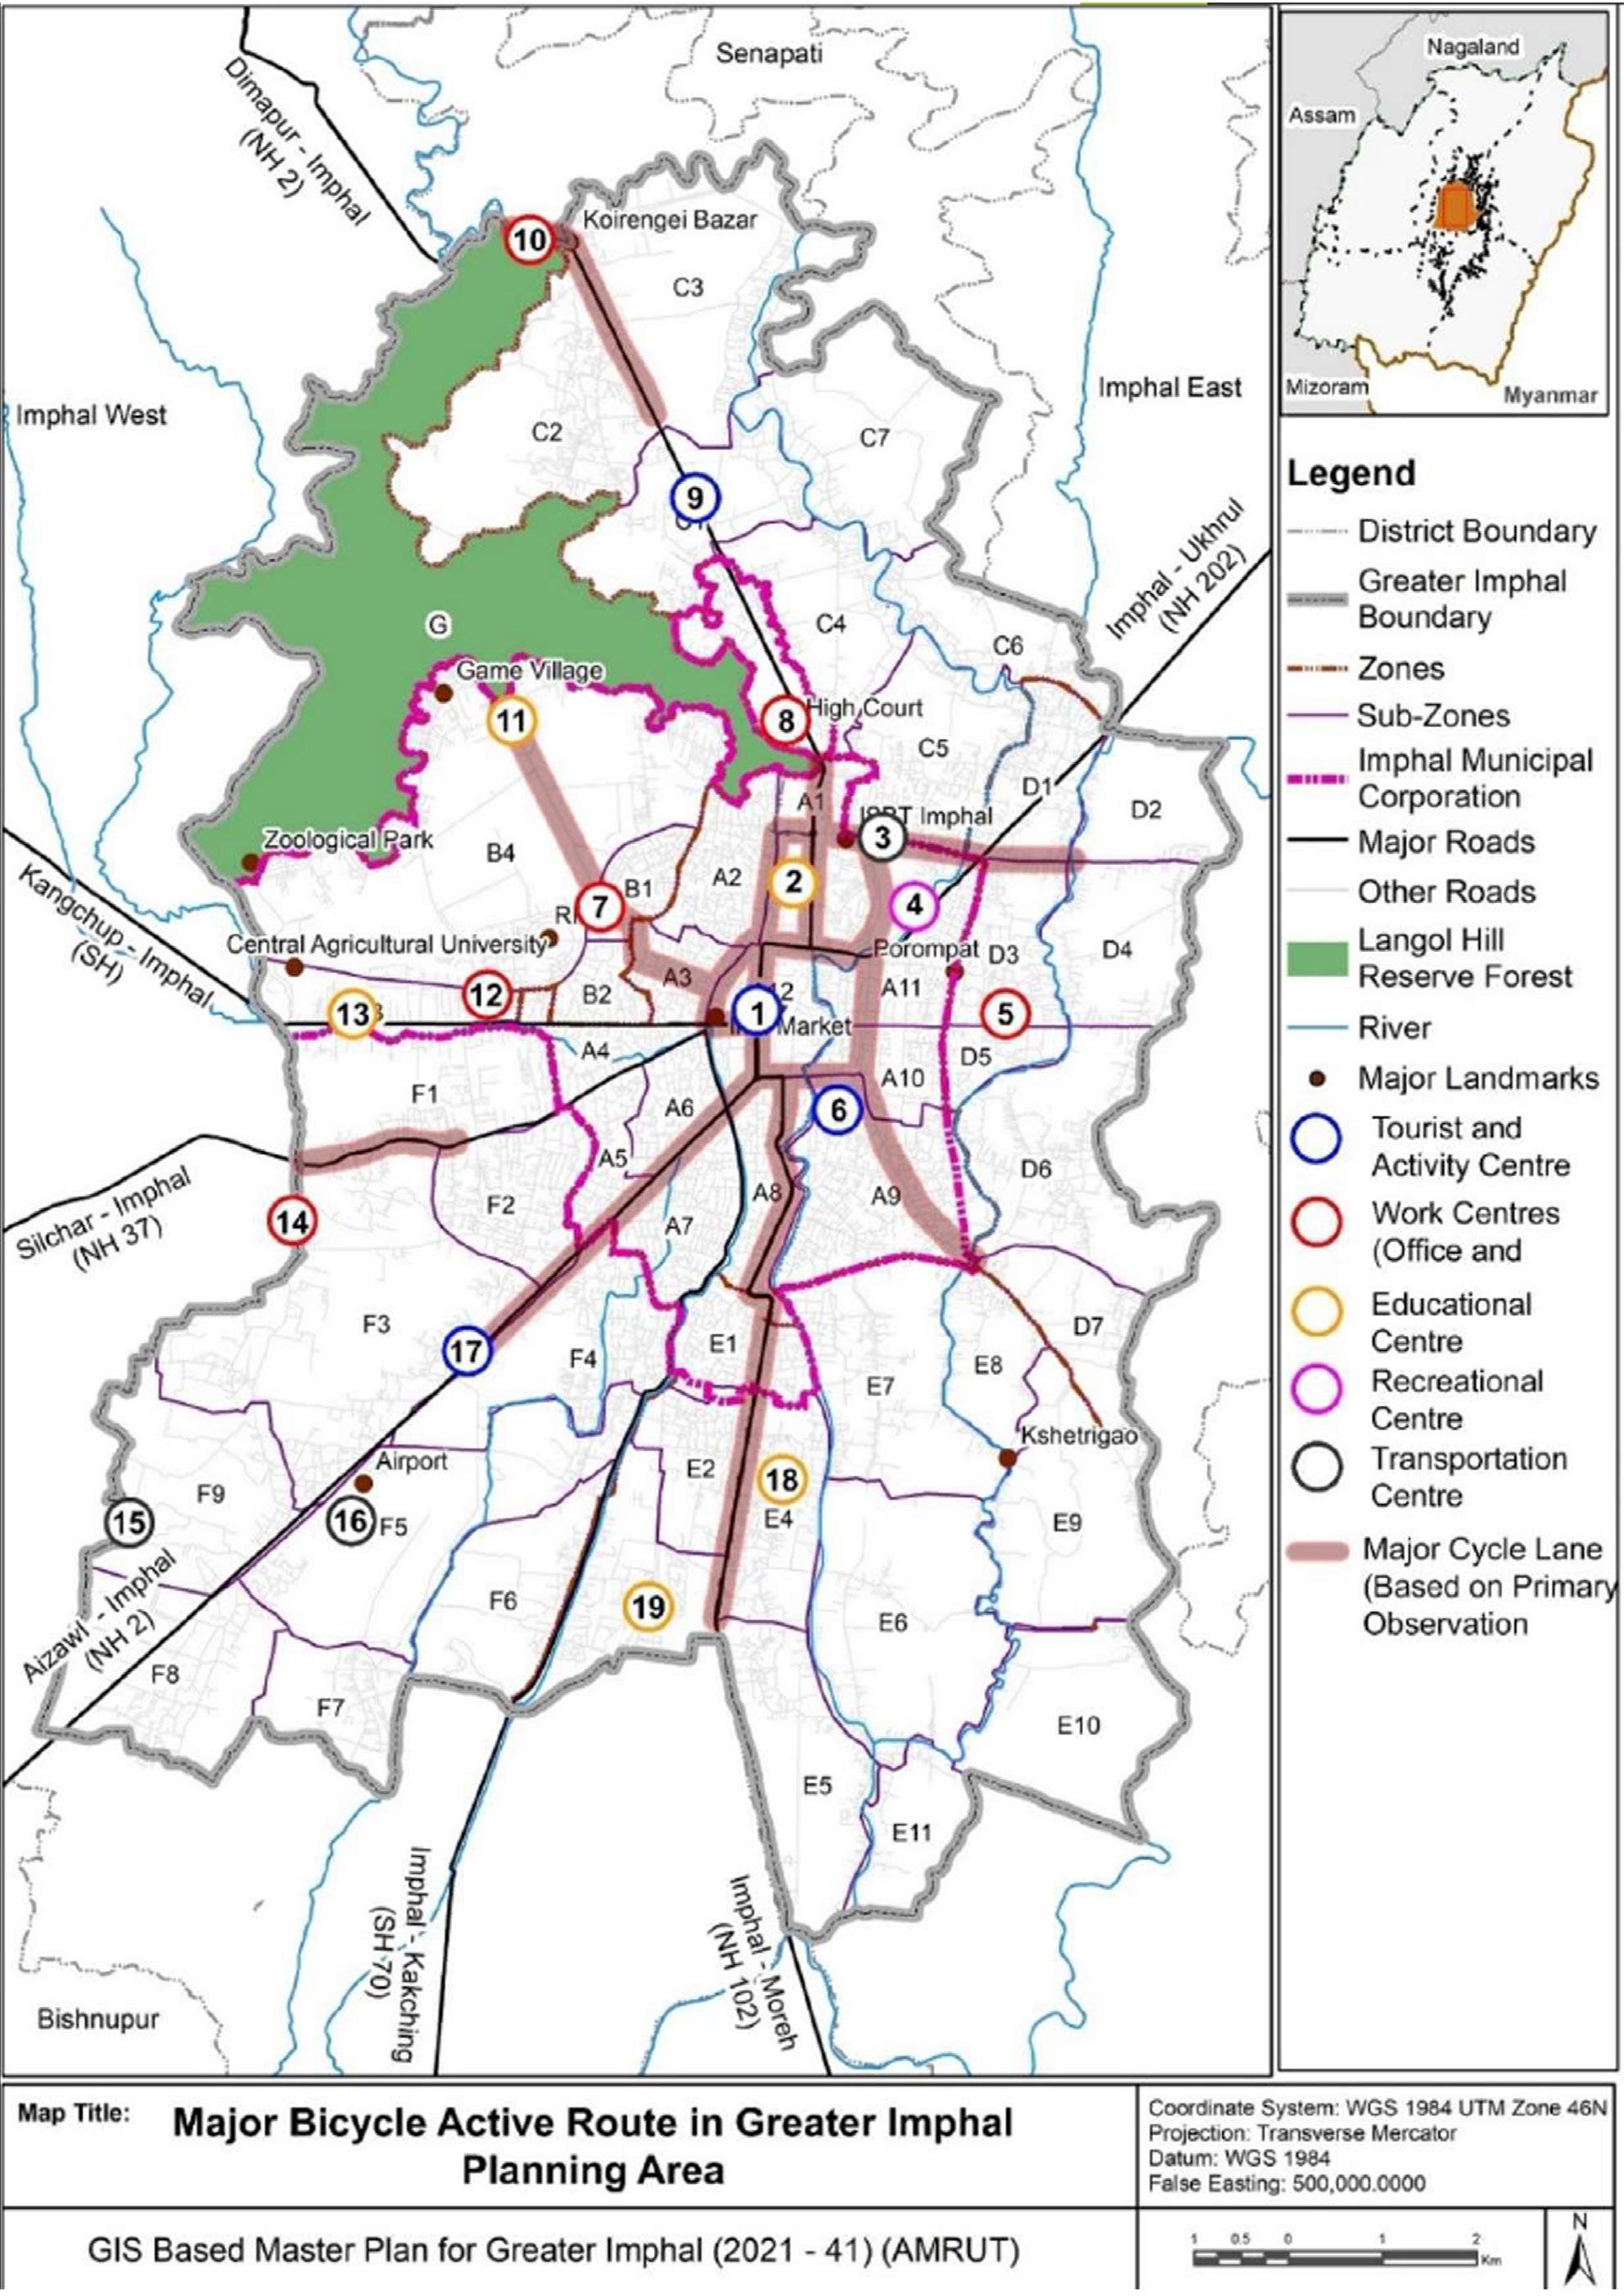
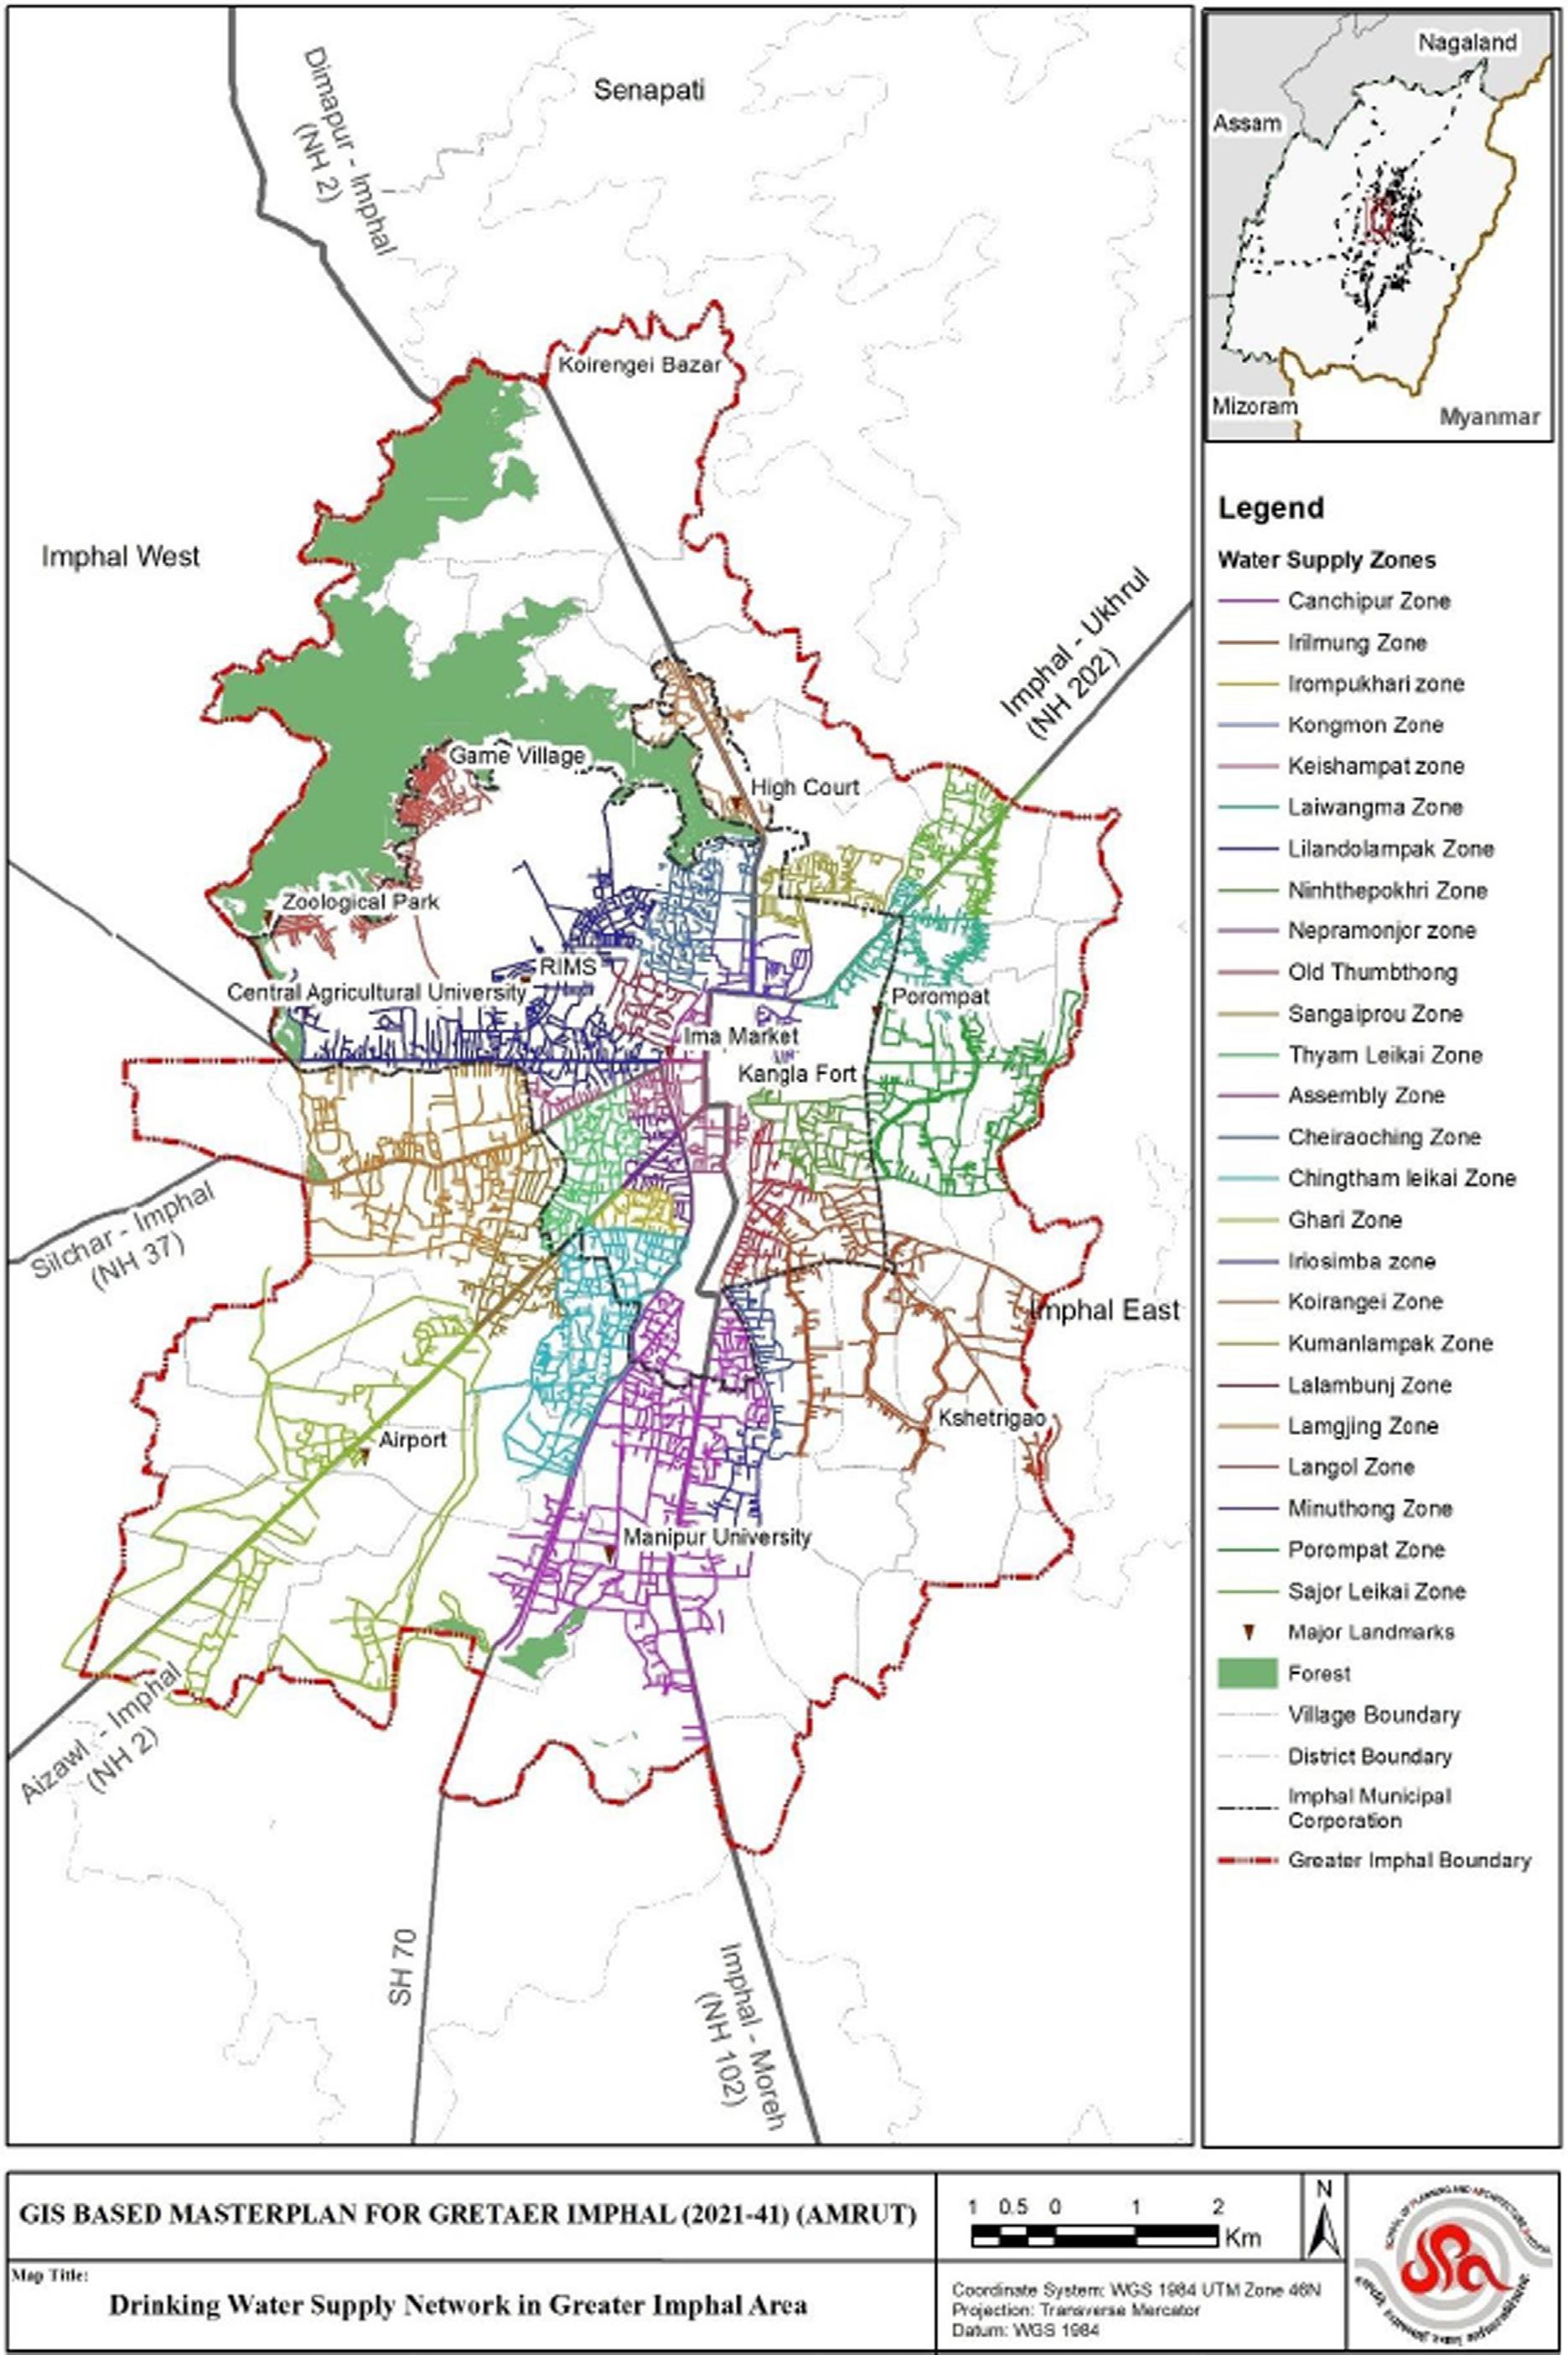
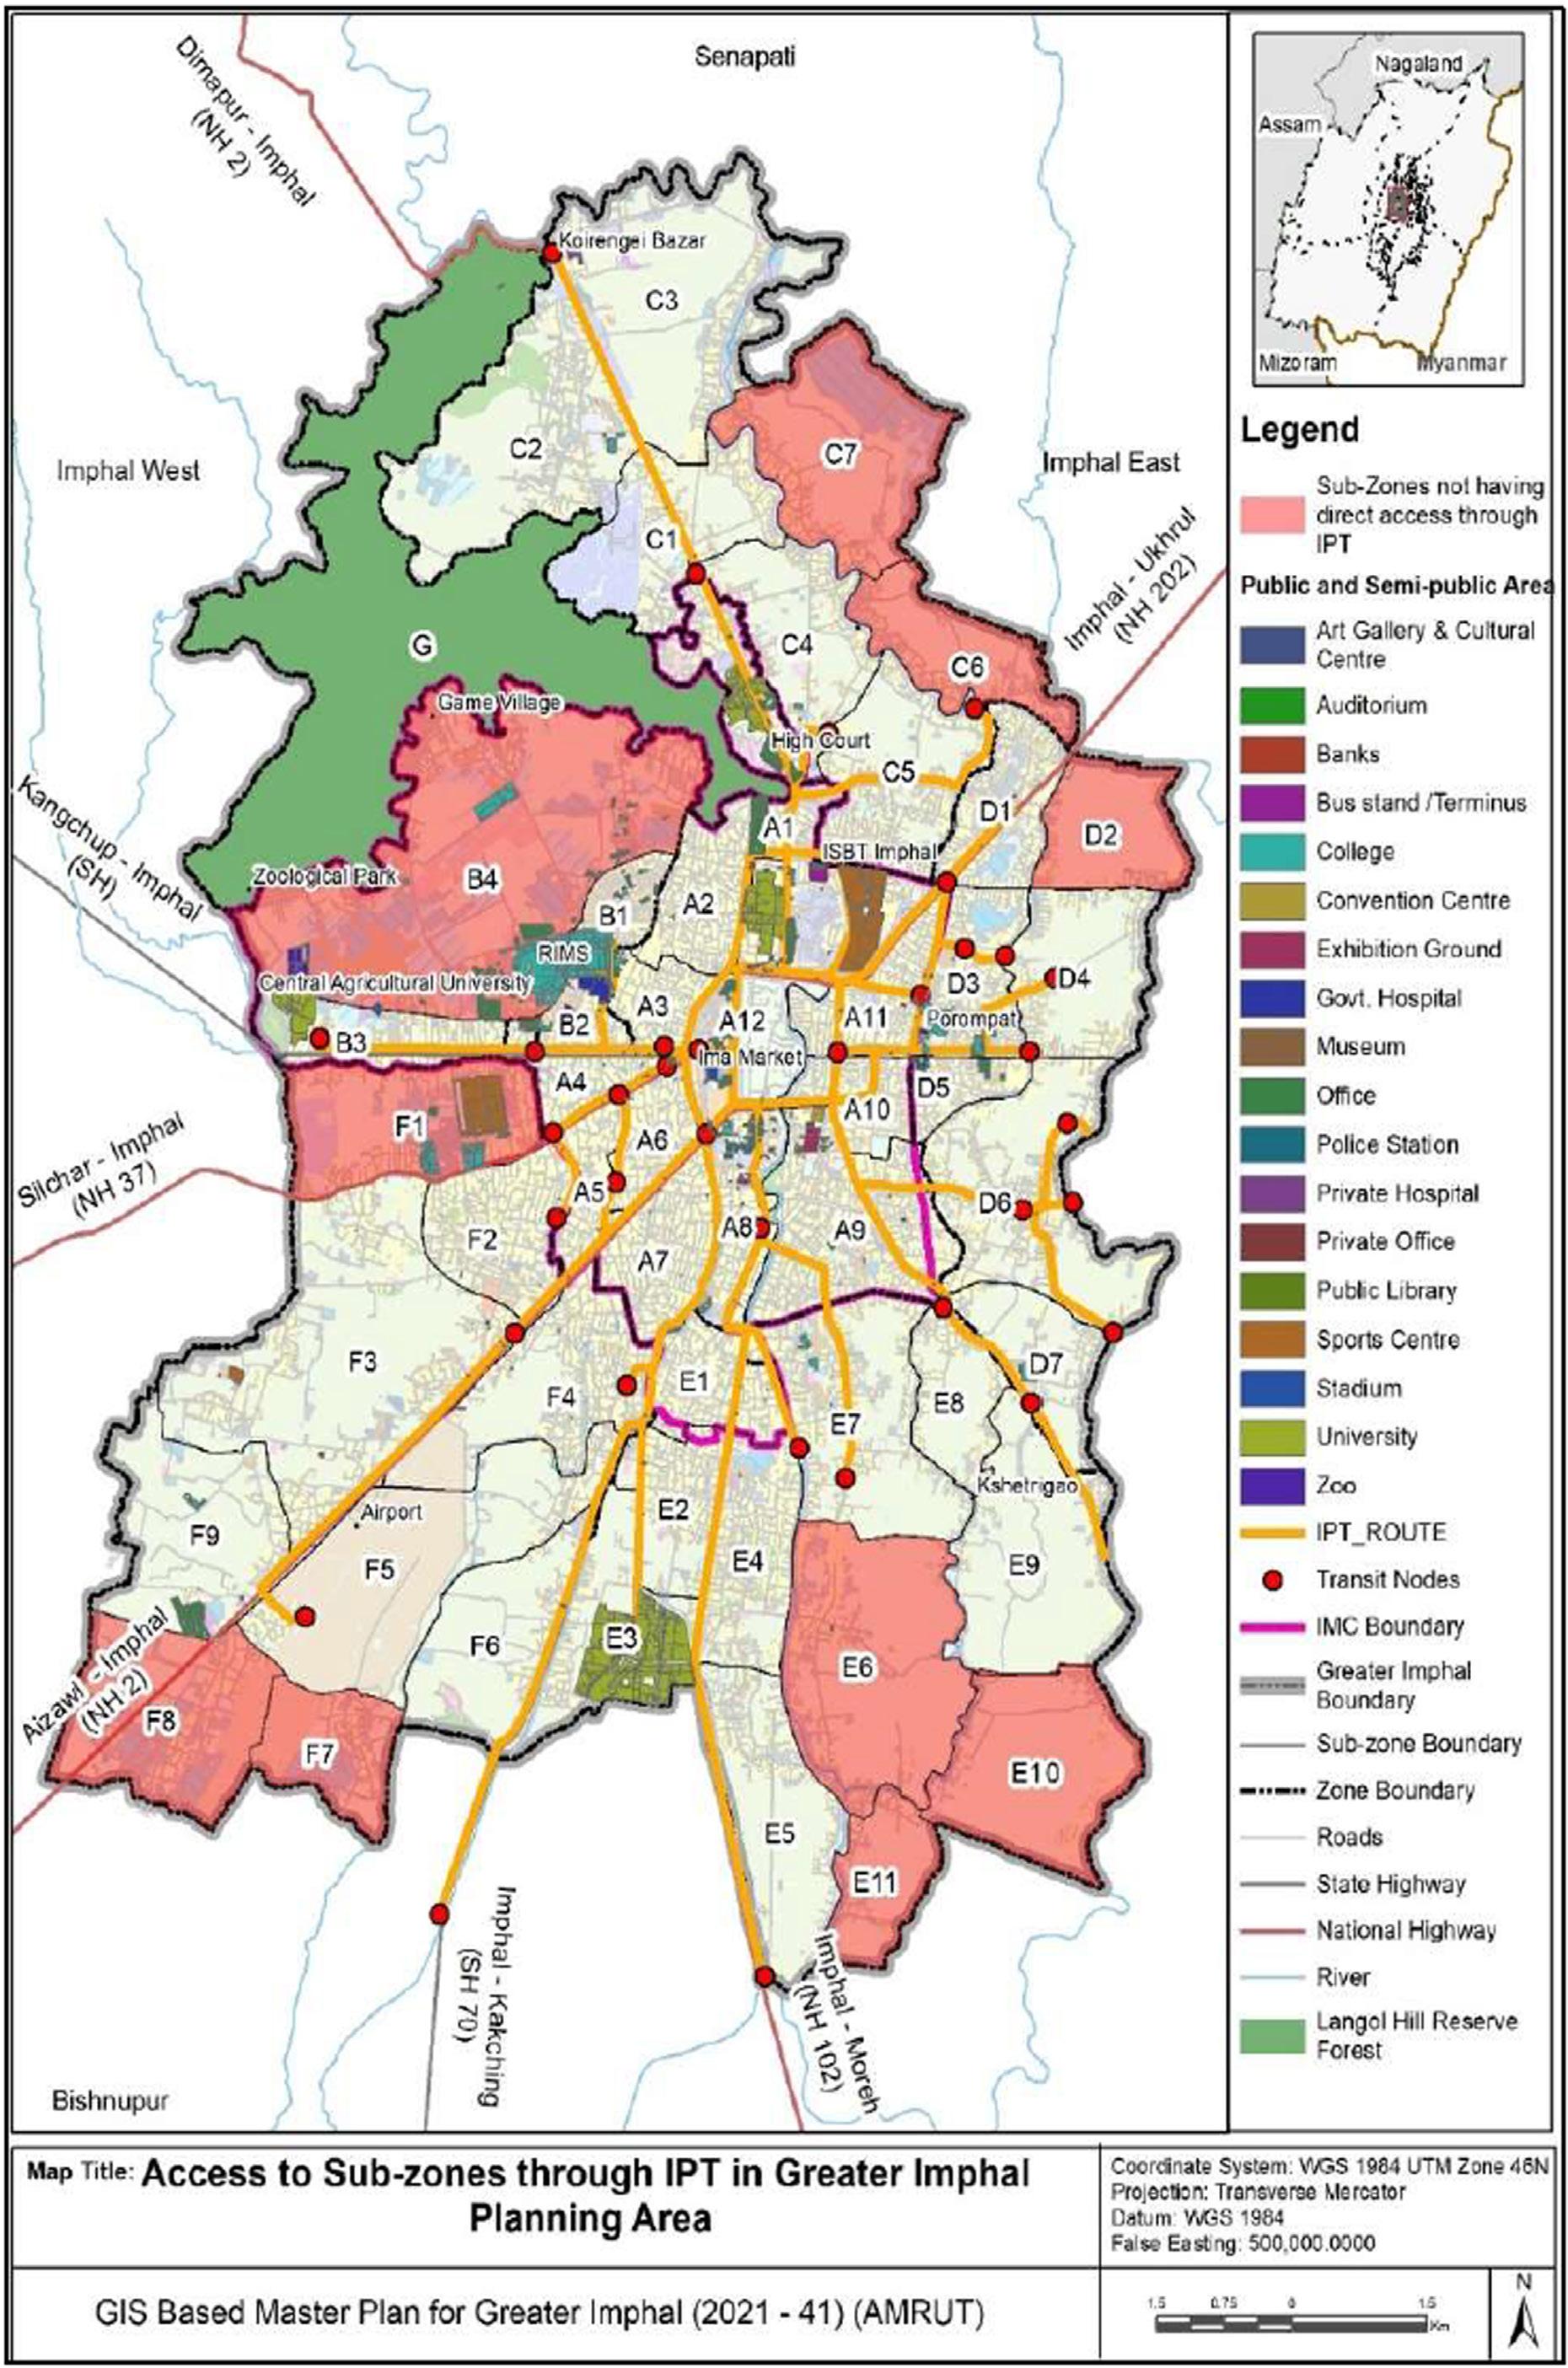
• GIS mapping of core infrastructure maps: Water Supply systems; Infrastructures for Public Transportation systems and Intra Para-Transit systems; Land Use maps; and Solid Waste Management Systems.
• Final Project report .
• Skills used: Research, Microsoft Suites, ArcGIS, Adobe Creative Suites, AutoCAD and Presentation skills
January 2020 -
May 2021
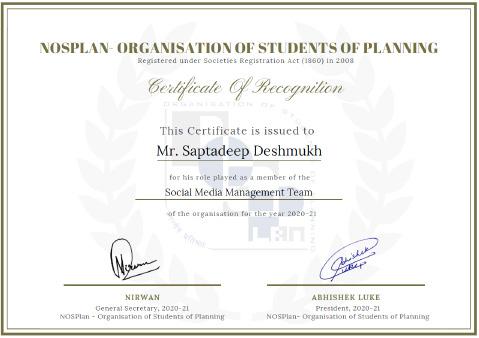
Social Media Team
• Graphic Designer at NOSPlan
• Spreading awareness regarding the different topics of Urban Planning.
• Increasing crowd interaction through different marketing and design strategies.
• Hard skills acquired: Research and Adobe Creative Suites
ACADEMIC PROJECTS:
January 2022 -
June 2022
August 2021 -
December 2021
January 2021 -
May 2021
August 2020 -
December 2020
Planning Thesis (8th Semester)
Topic: Planning for Bicycle Infrastructure in Hauz Khas, Delhi
Projectisation of Urban Development Plan Studio (7th Semester)
Proposed for Projectisation of Electric Bus Project in Prayagraj
Urban Planning Studio(6th Semester)
Proposed for Sustainable Freight (road) Transportation in Prayagraj
Local Area Planning Studio (5th Semester)
Proposed for Better Road Infrastructure and Physical Infrastructure in Bhopal
January 2020 -
May 2020
August 2019 -
December 2019
January 2019 -
May 2019
Transportation Planning Studio (4th Semester)
Proposal for Increment in the Walkability Factor in Indore
Neighborhood and Site Planning Studio (3rd Semester)
Proposed for Neighborhood Design and Cost Estimation in Bhopal
Area - Appreciation Studio (2nd Semester)
Modeling the Site Area in Bhopal
2018 - 2022 2017 - 2018TABLE OF CONTENTS
01 02 03 04
Plamning for Bicycle Infrastructure: A Case Study of Hauz Khas, Delhi
(Thesis, 2022 - VIII Semester)
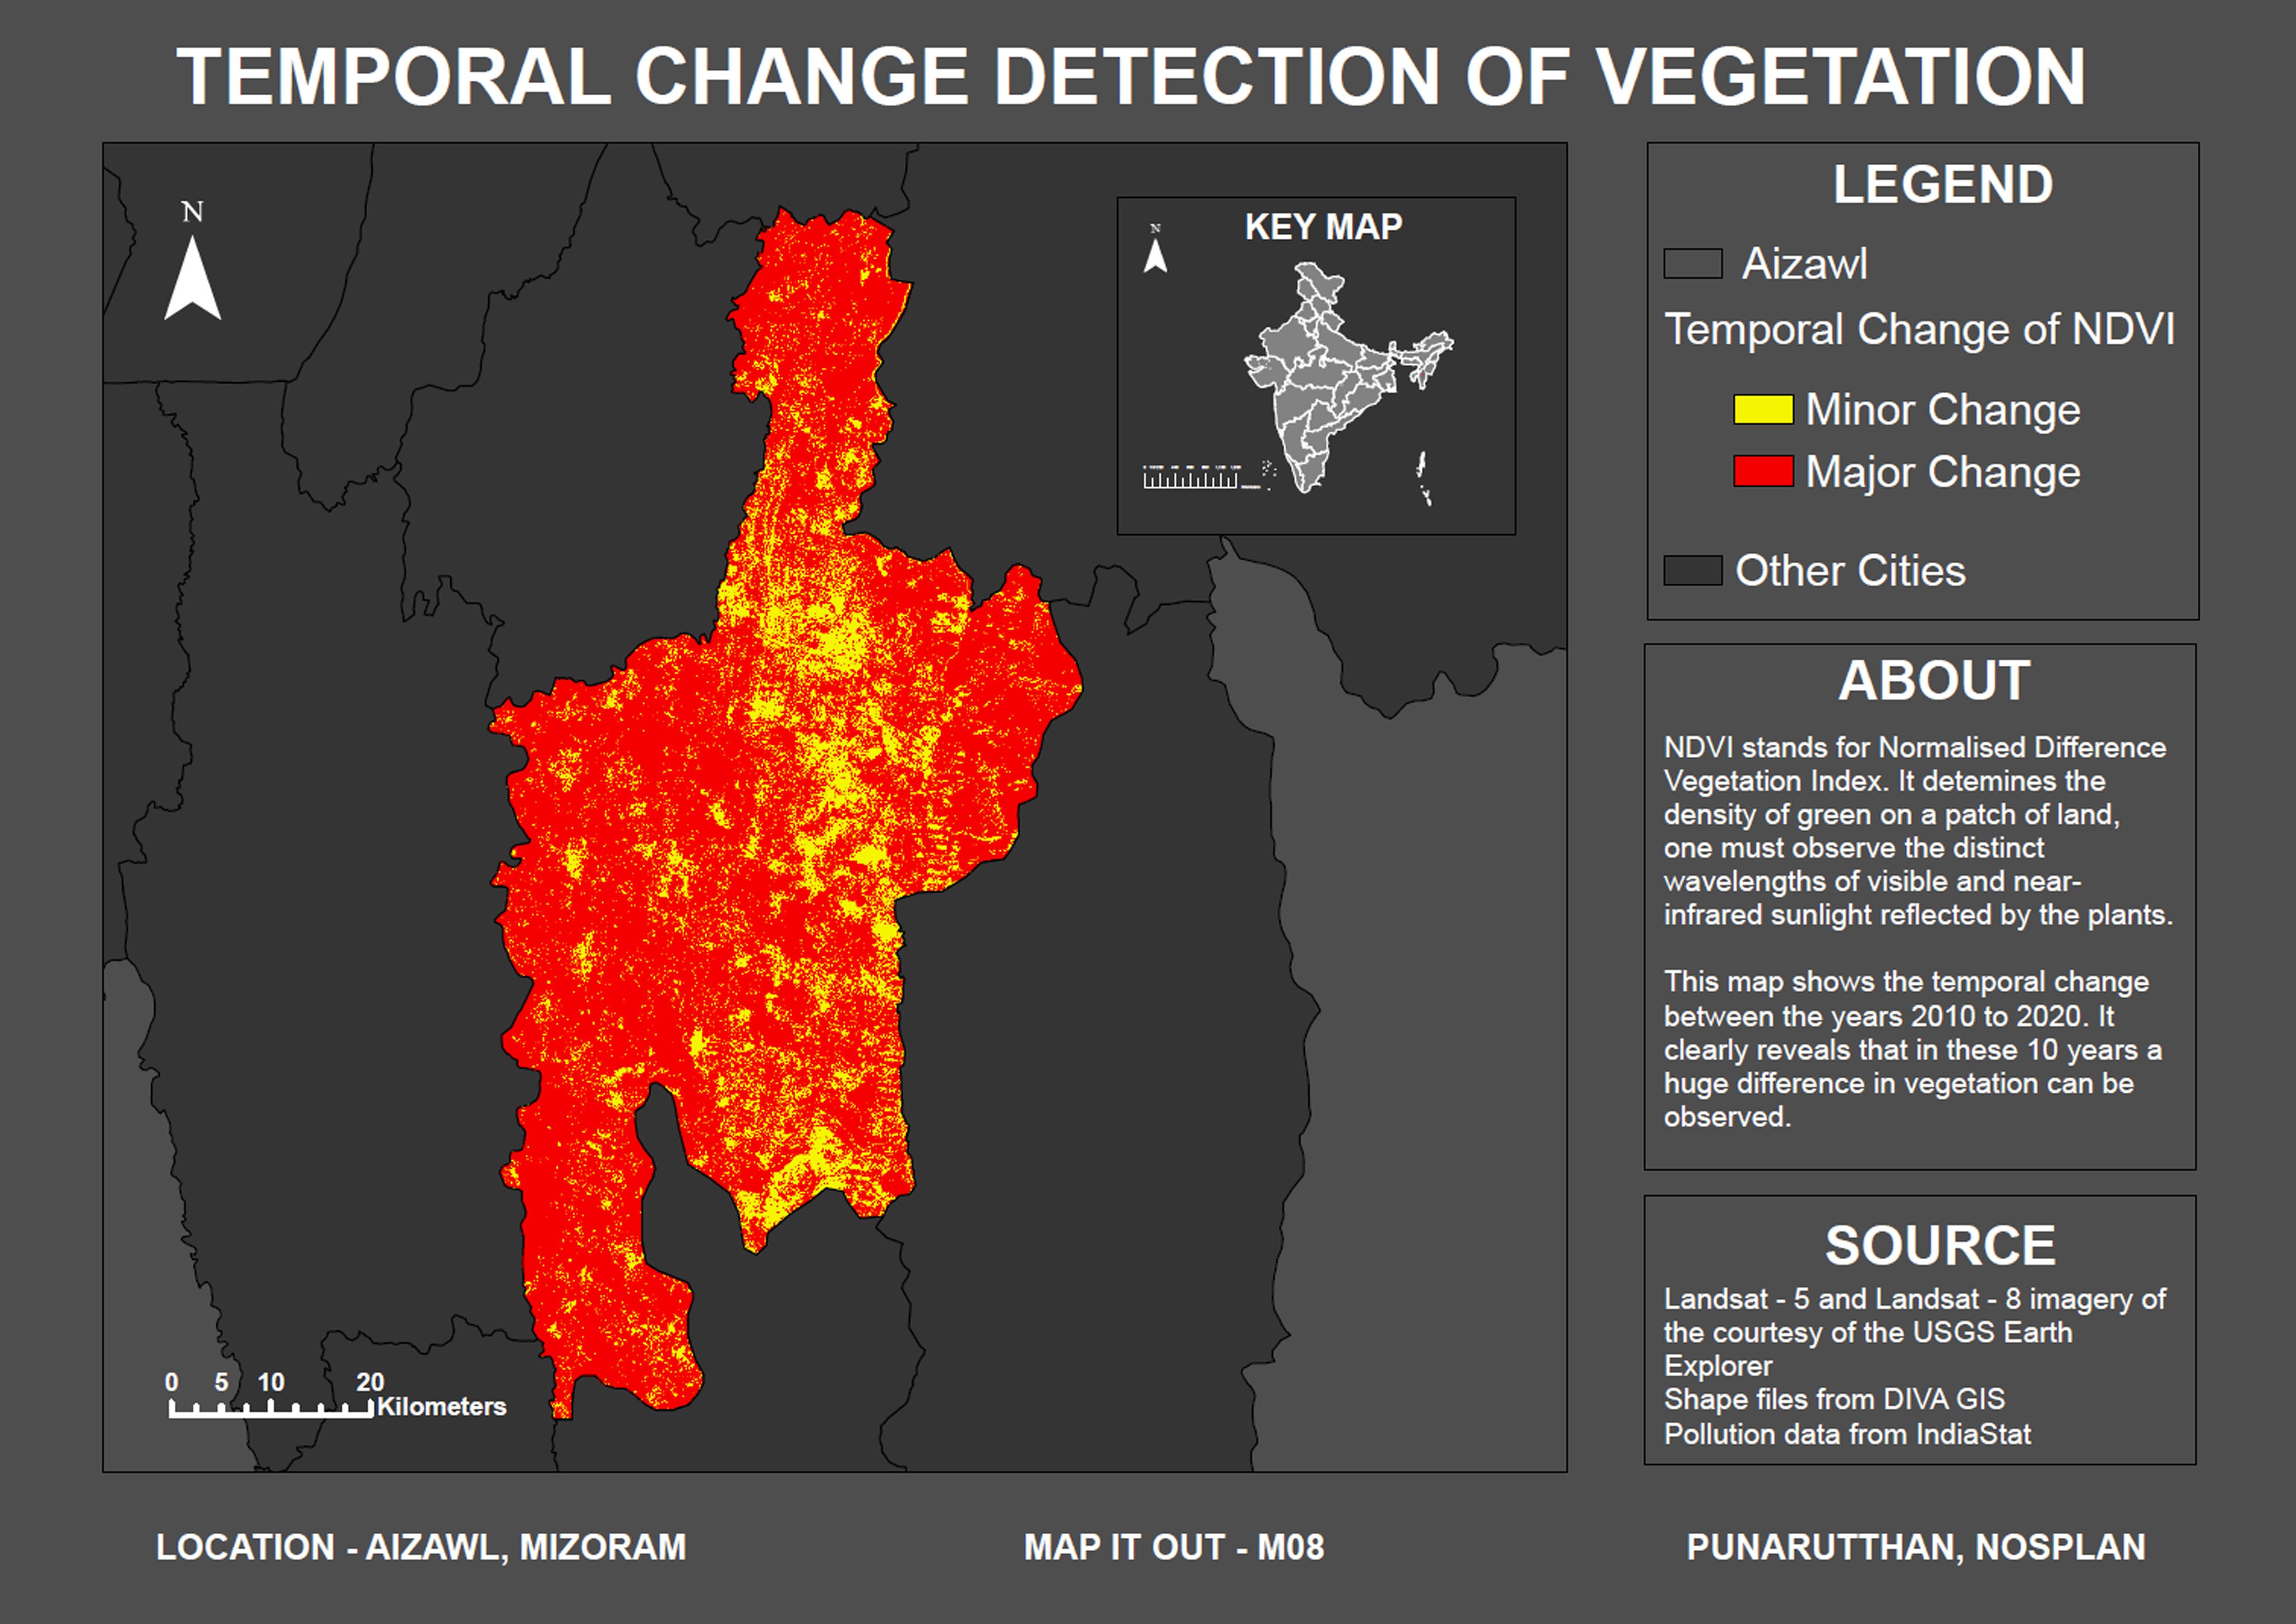
Temporal Change Detection of Air Pollution: A Case Study of Aizawl, Mizoram
(Map It Out, Punarutthan - NOSPlan 2021)
GIS Based Master Plan (2041): A Case Study of Greater Imphal, Manipur
(Research Internship, School of Planning and Architecture, Bhopal)
Workshops & Certifications
Planning
for the Bicycle Infrastructure:
A Case Study of Hauz Khas, Delhi
(Thesis, 2022 - VIII Semester)
01
BACKGROUND
The introduction of motor vehicles has led cities to be designed around them, causing overconsumption of resources and environmental degradation. India’s emphasis on car-centric development has resulted in a shortage of public space and fewer users of public bike-sharing systems. India, like other countries, concentrated on car-centric development, resulting in the overconsumption of public space, environmental degradation, and other concerns. Although the introduction of public bike-sharing (PBS) systems targeted educational and work-related commutes, it failed to attract the expected number of users. Prioritizing sustainable transportation solutions and adopting a people-centric approach to urban planning is critical to minimize the impact on the environment and society’s social and economic aspects.
OVERVIEW OF THE THESIS
Research has shown that the use of paved bicycle routes can substantially decrease the likelihood of bicycle accidents. While off-street bike paths are typically used for recreational purposes, they have the potential to be integrated into an overarching bicycle infrastructure plan, connecting disparate parts of town without requiring the use of shared streets. This approach can prove beneficial in facilitating safe, seamless, and sustainable transportation for cyclists in urban areas.
The study involved a multifaceted analysis of the urban green spaces within the study area, as well as a network analysis of the existing road infrastructure. In addition, a correlation matrix was employed to analyze the perception-based survey forms, while descriptive statistics were used to interpret the findings. The data utilized in the study was obtained from various government agencies, with primary surveys conducted through offline and online questionnaires.
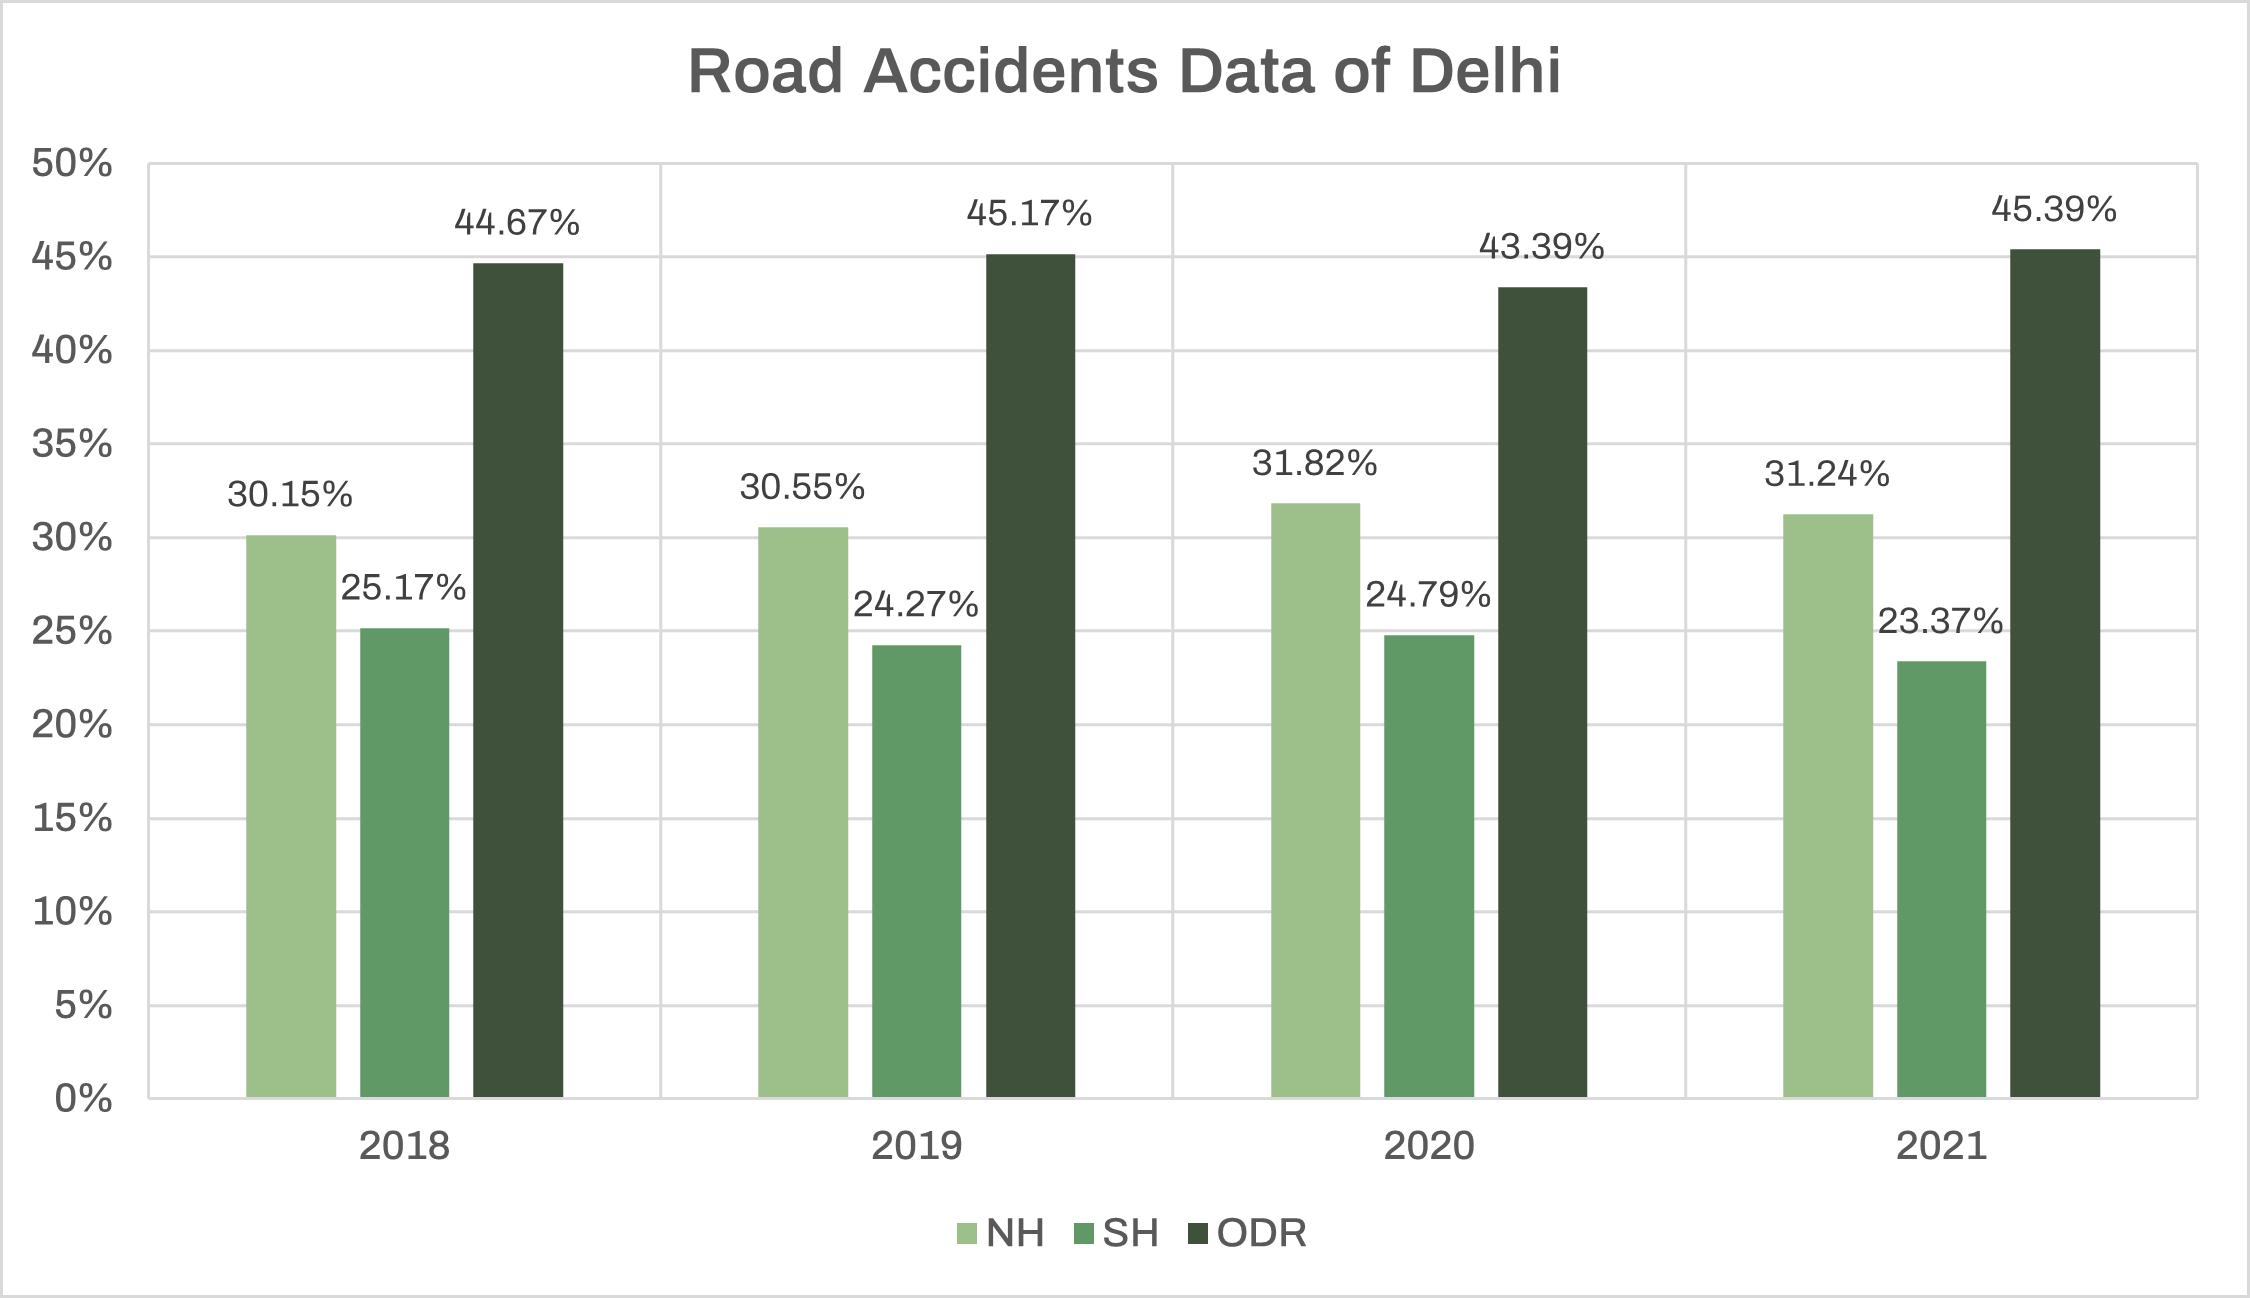
POLLUTION & ROAD ACCIDENTS DATA


MERITS OF PROMOTING BICYCLE INFRASTRUCTURE


DETERMINANTS OF PROMOTING CYCLING


INTRODUCTION
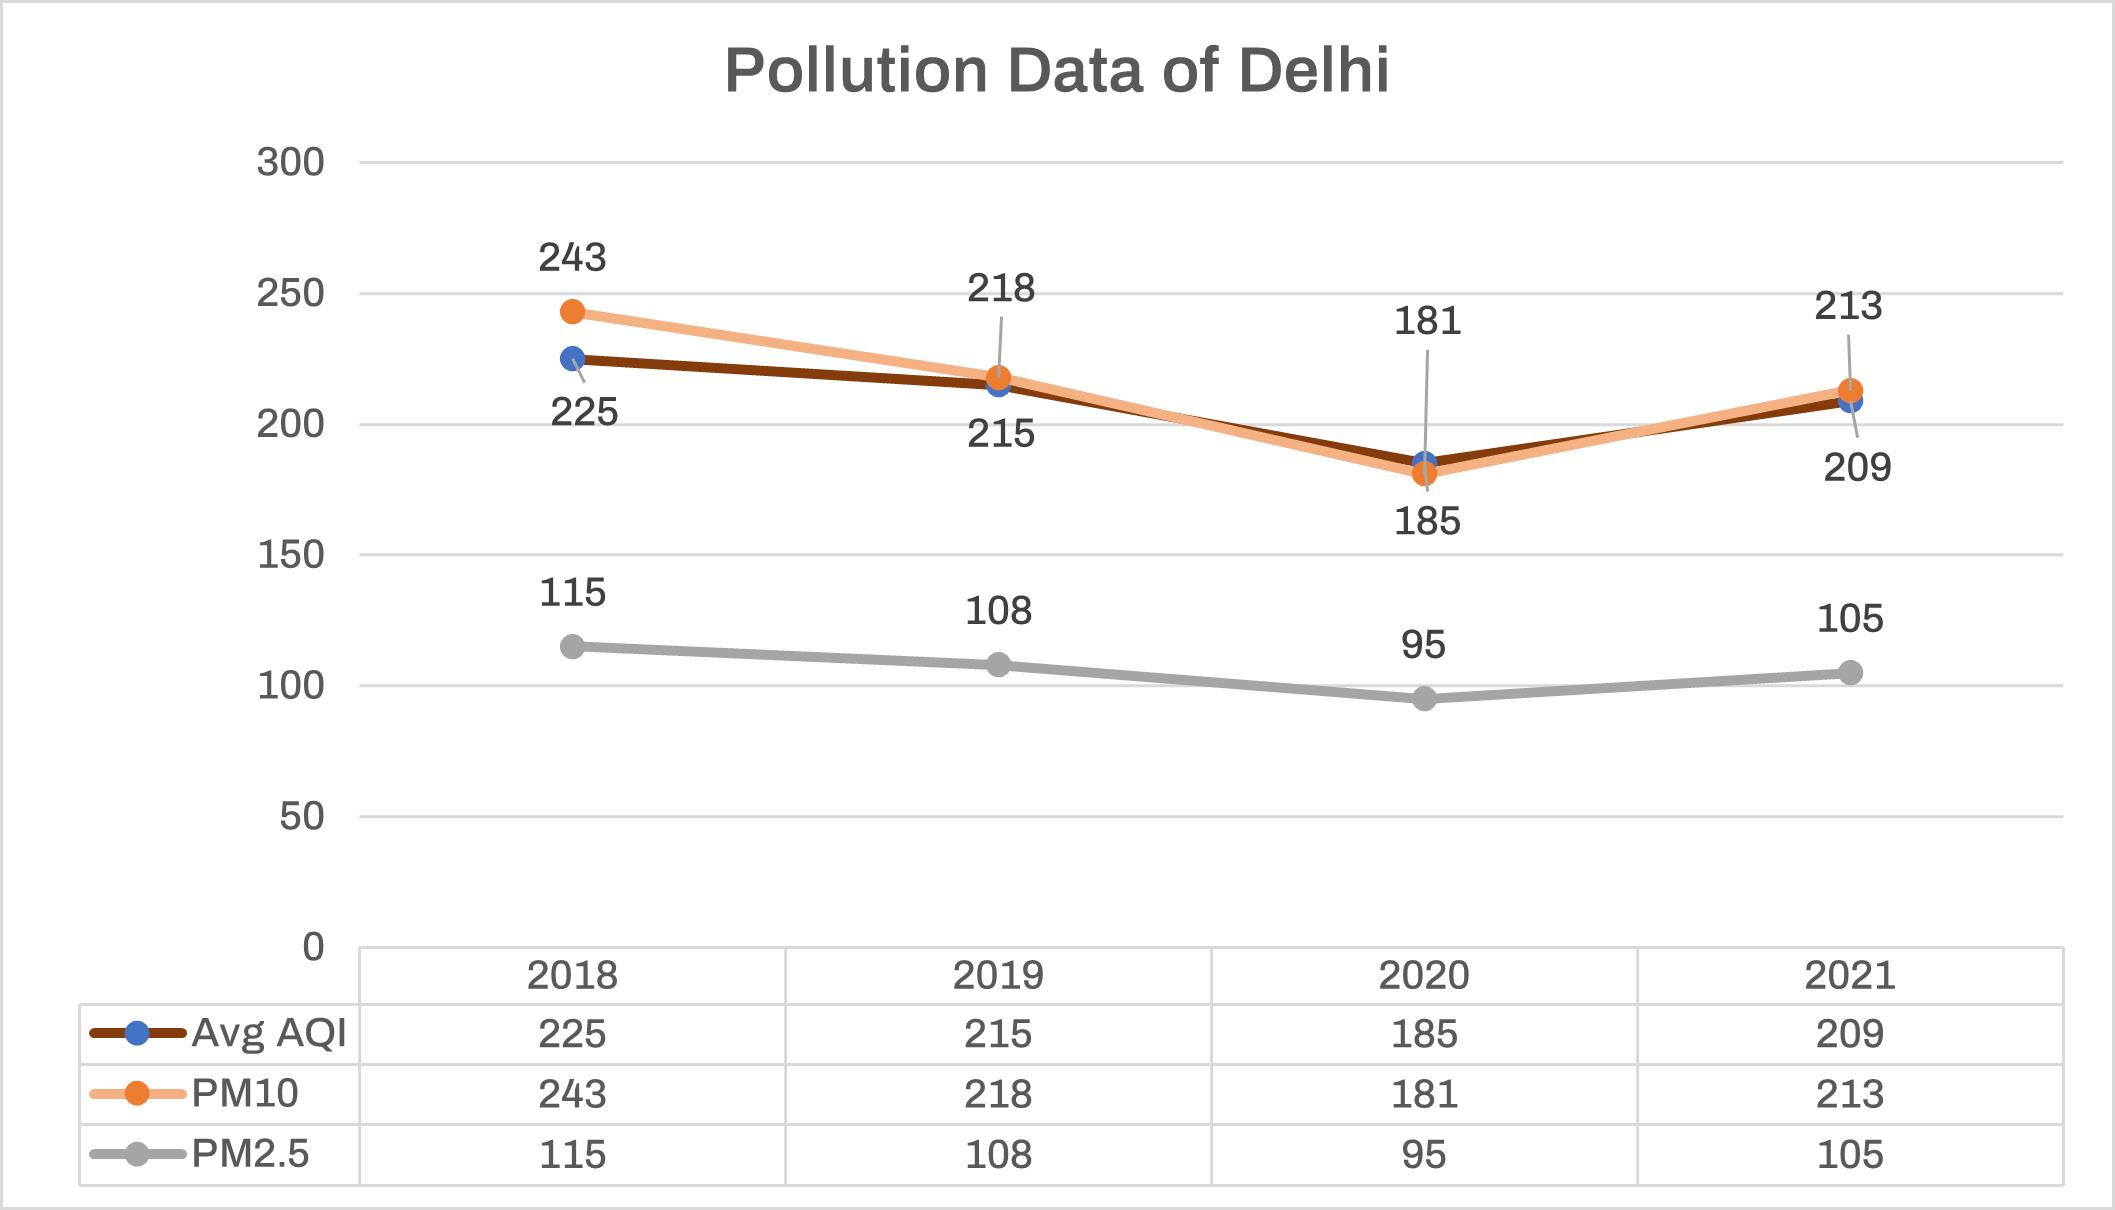
Figure shows the pollution data over a span of 4 years (2018 - 2021)
Figure shows the road accidents data over a span of 4 years (2018 - 2021)
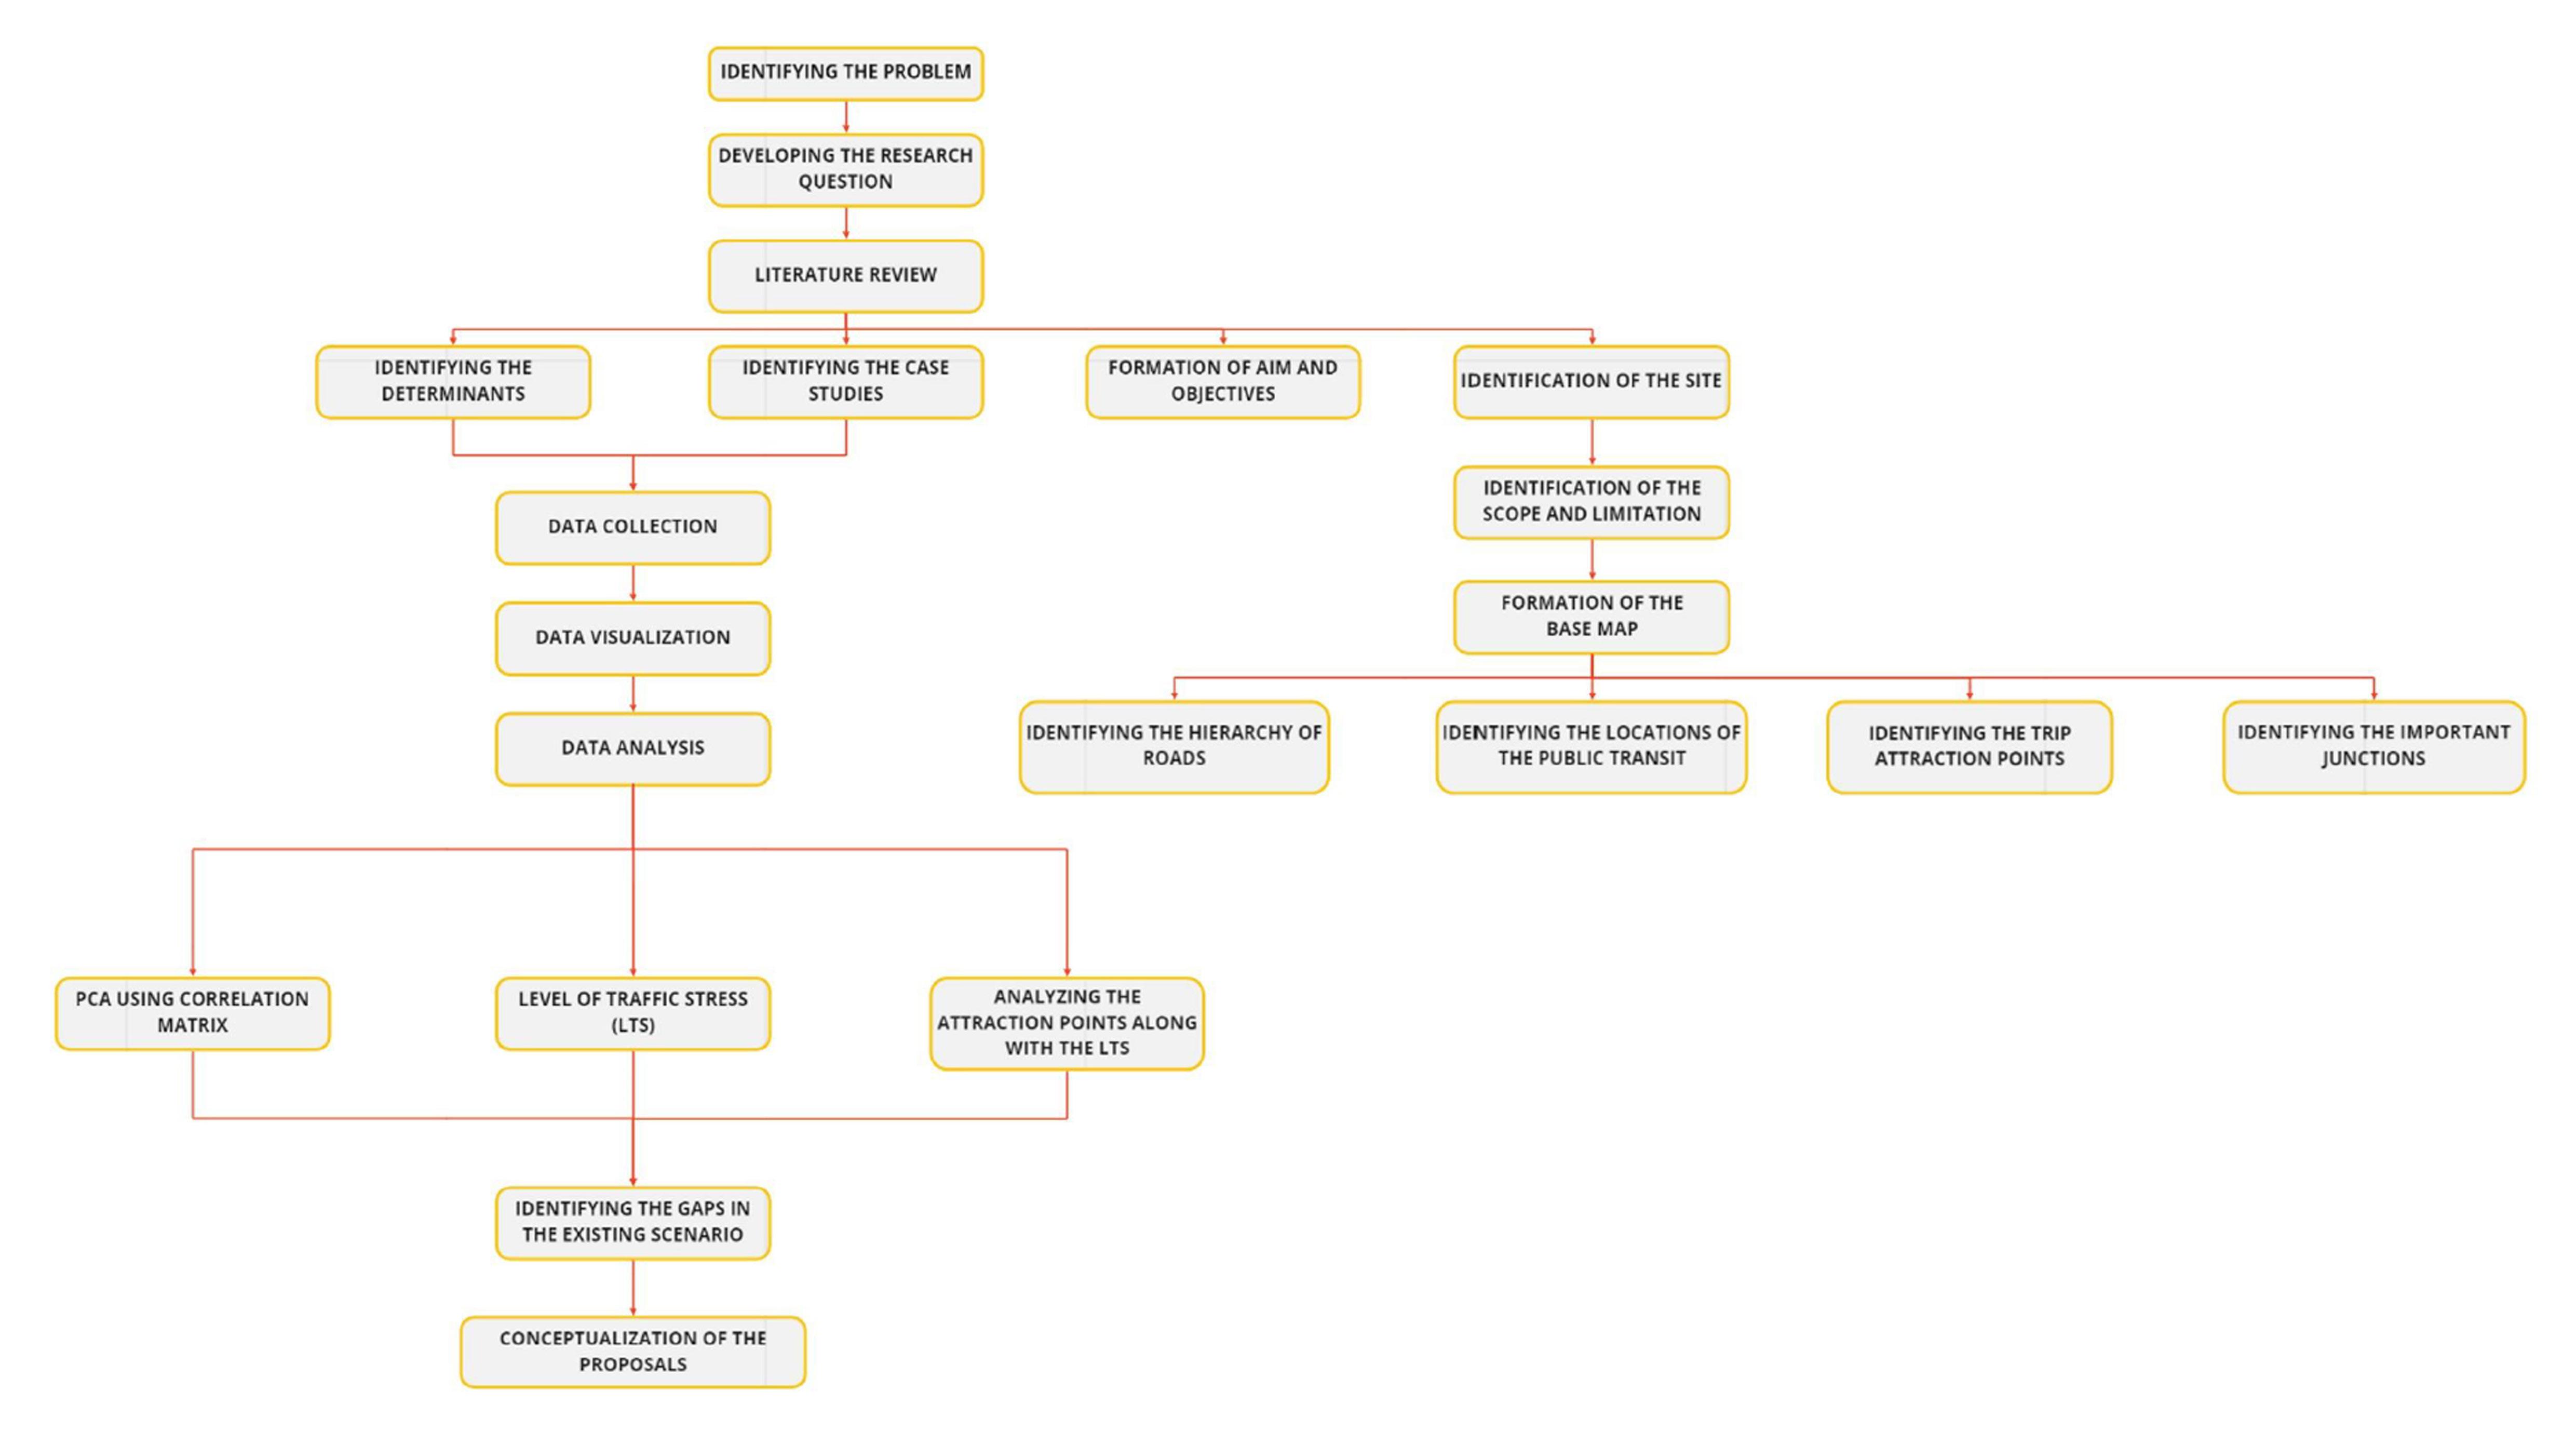
METHODOLOGY
INTRODUCTION
ABOUT THE SITE
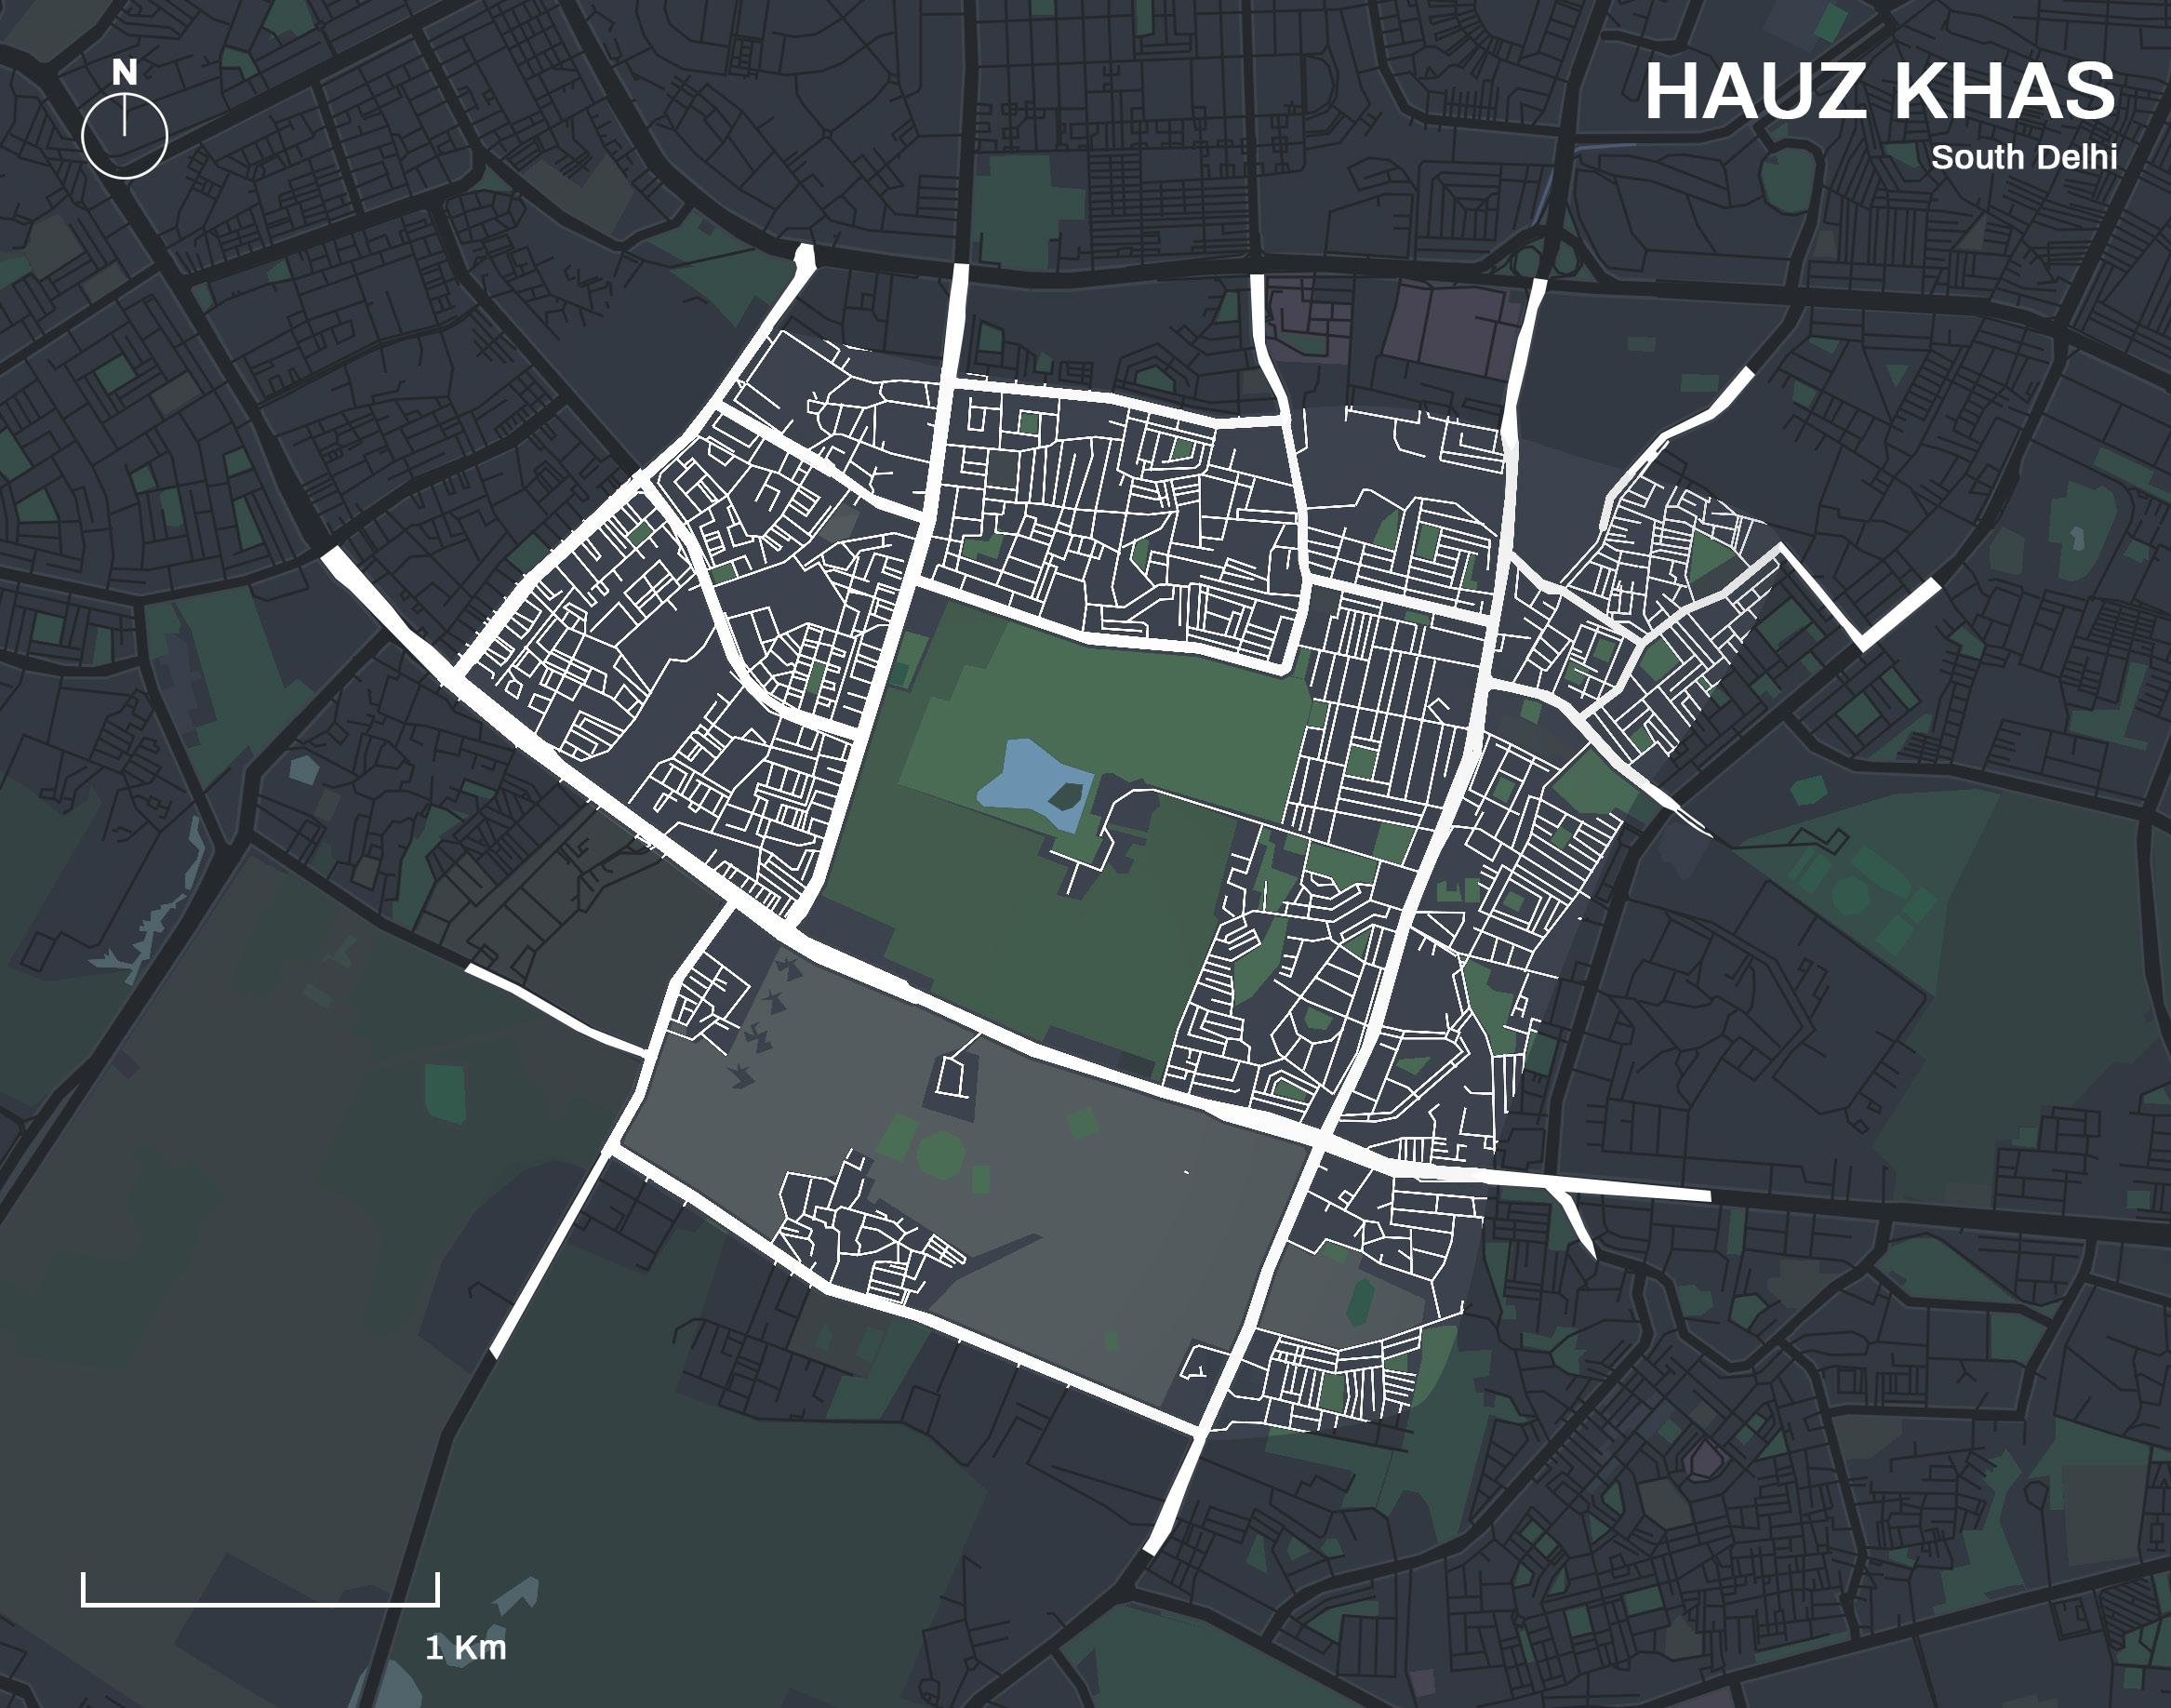
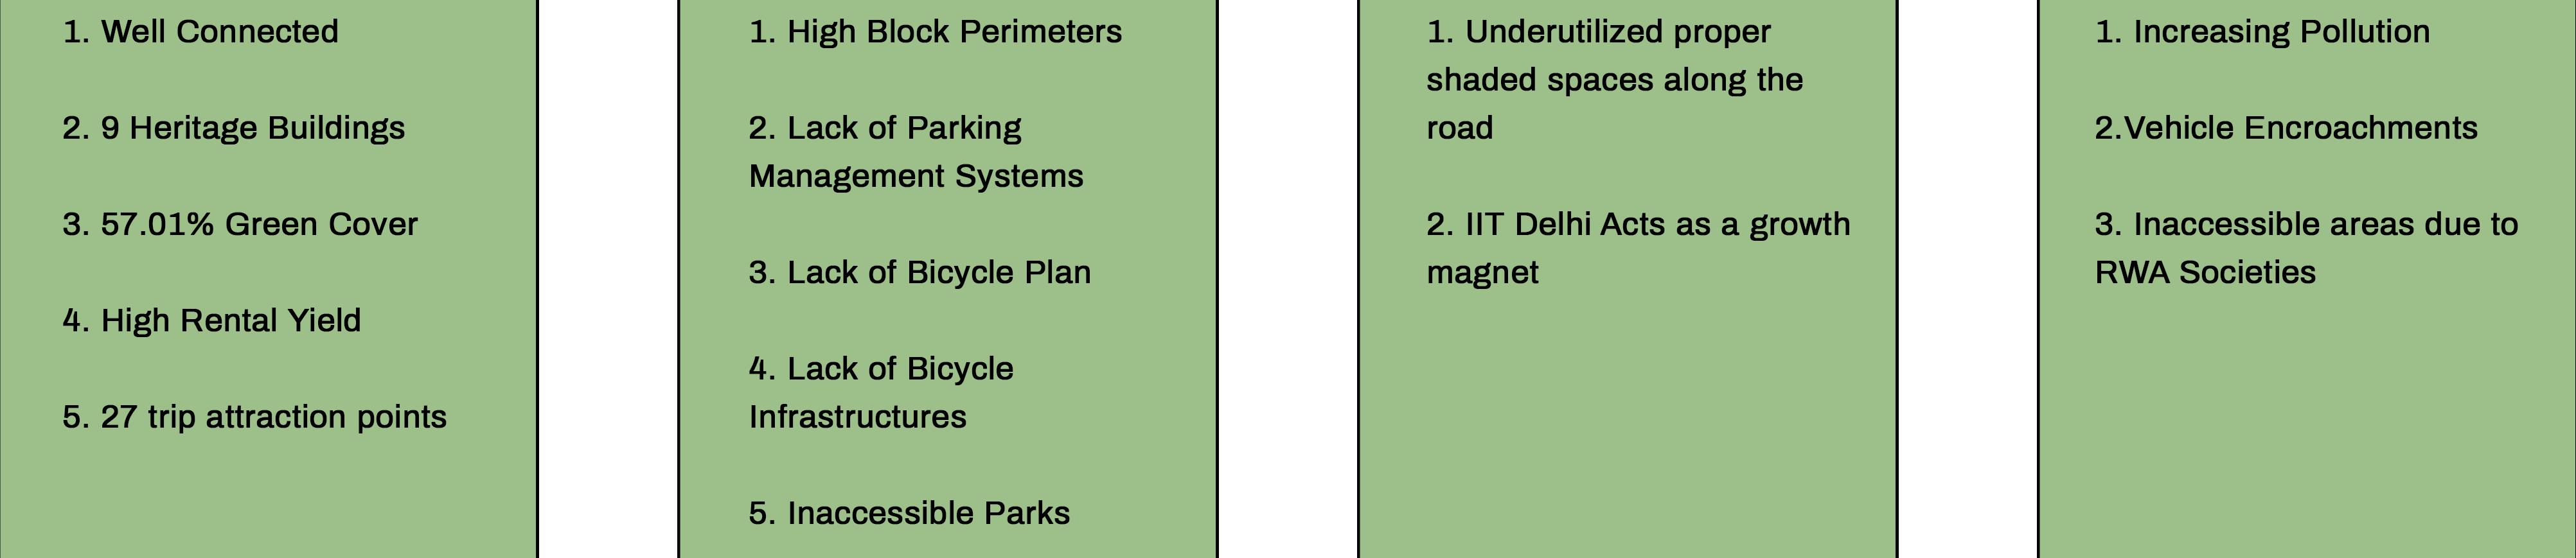
Hauz Khas, located in the South Delhi District, falls under Zone F of the Master Plan 2021. The National Capital Territory of Delhi (NCTD) is divided into 15 Zones or Divisions, denoted by the letters ‘A’ through ‘P’, excepting Zone ‘It’. Notably, Hauz Khas features several historic landmarks and is conveniently accessible via the Delhi Metro, attracting visitors from India and other domestic middle-class tourists from across the country. The area spans across 303.11 hectares and boasts a green cover of 57%, contributing to the region’s overall ecological balance and enhancing its aesthetic appeal.
DEMOGRAPHICS
According to the 2011 Census, the region under study is home to a population of 12,31,293 individuals, with a sex ratio of 870 and a literacy rate of 86.87%. The accompanying table provides a summary of the area’s demographic characteristics. Additionally, the average elevation of the area is measured at 236 meters above sea level. These findings offer valuable insight into the social and economic dynamics of the region and inform future planning and policy decisions for the area.
SWOT ANALYSIS
DATA VISUALIZATION
SITE ANALYSIS
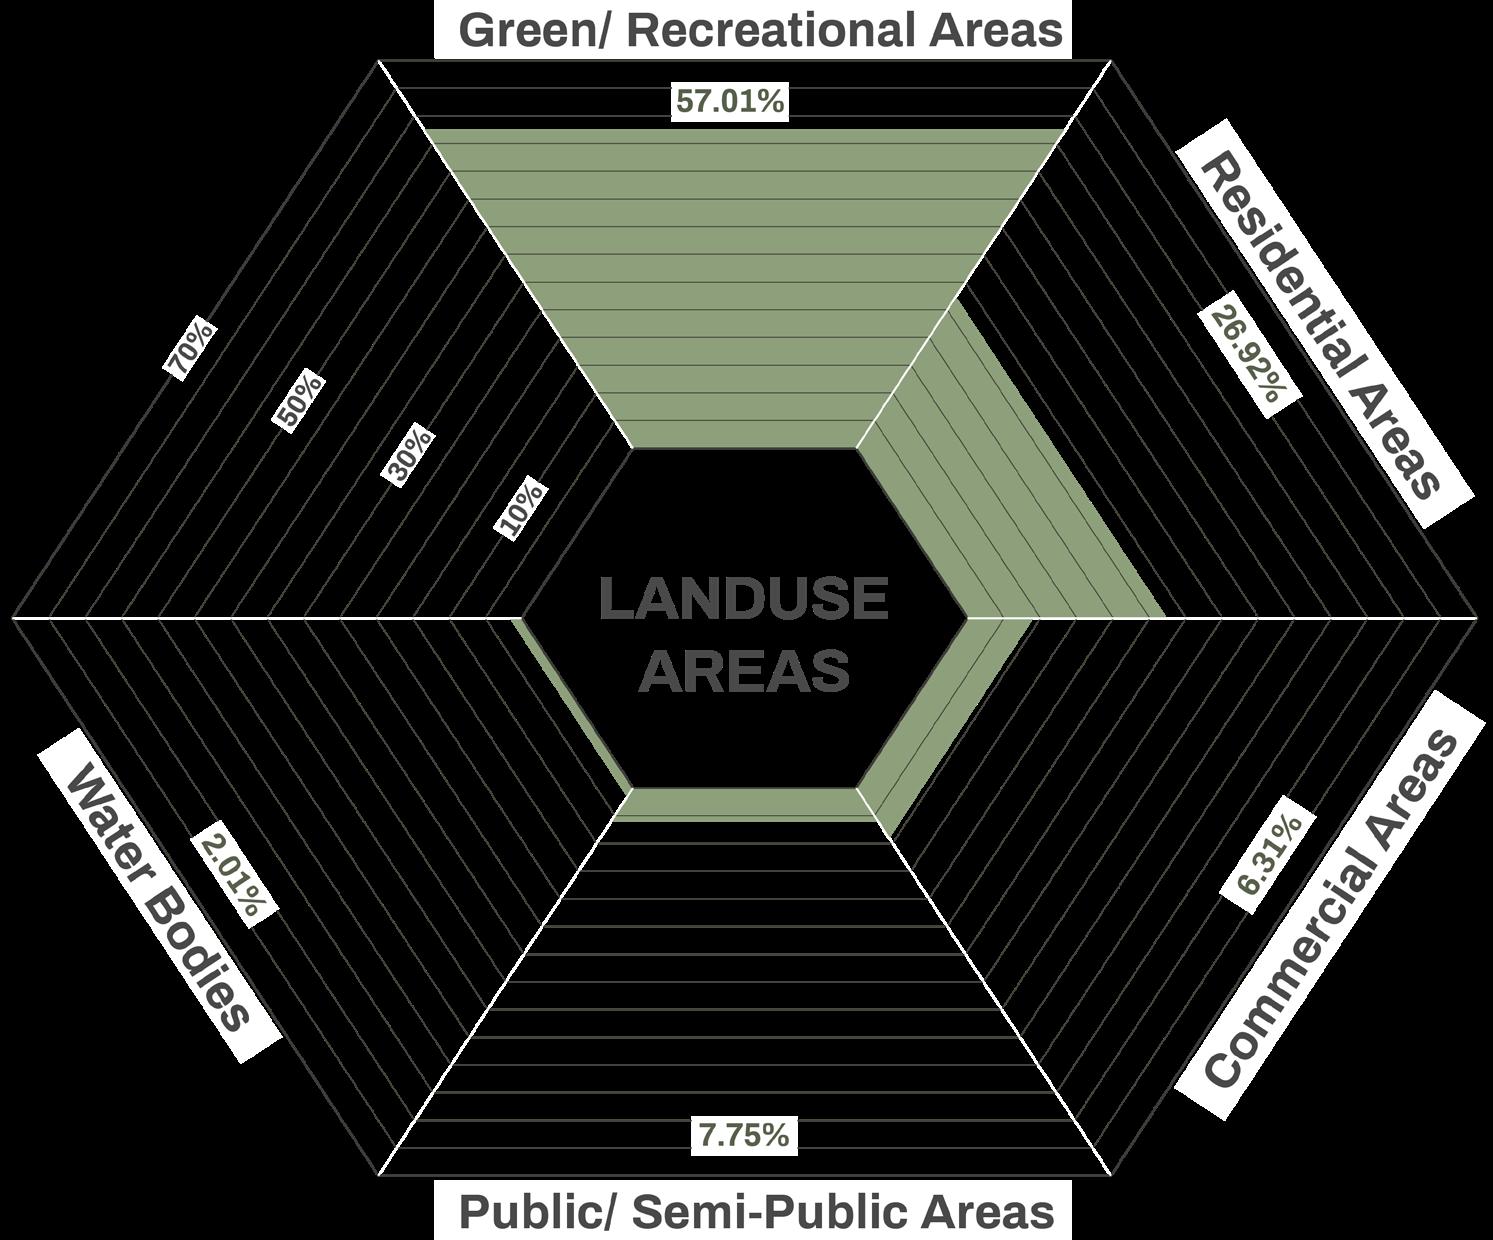
Figure shows the percentages of areas of different land uses
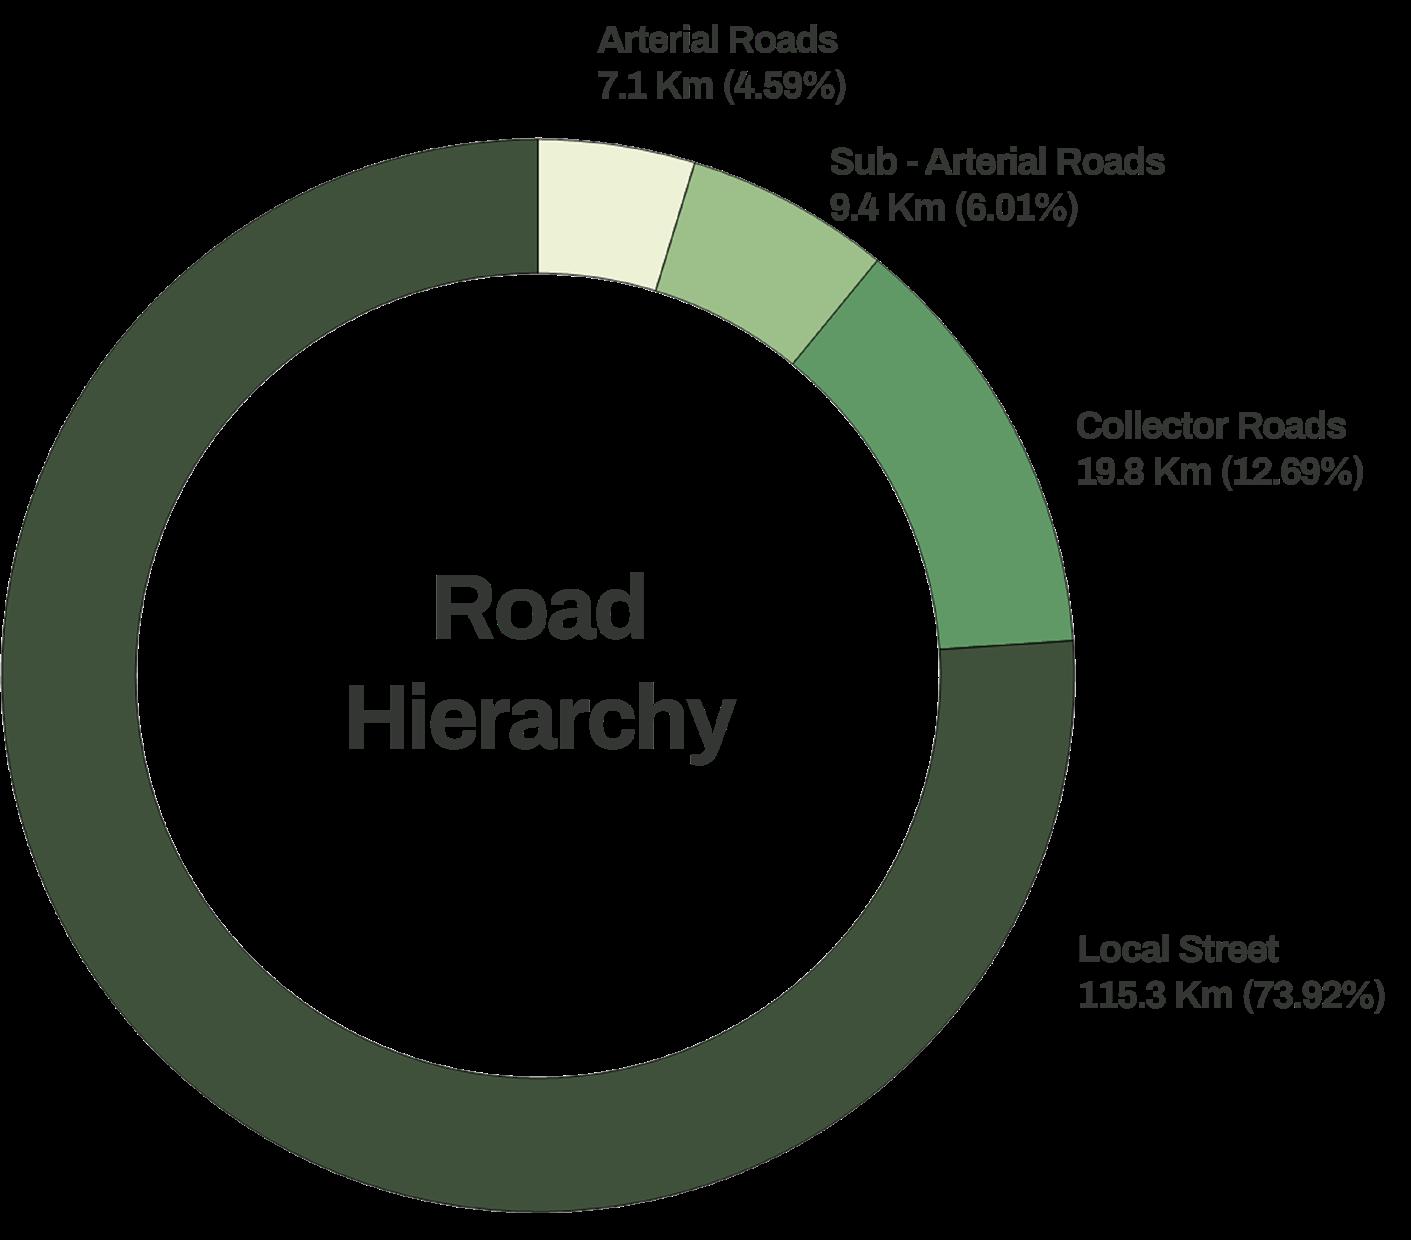
Figure shows the percentages of lengths of different road types
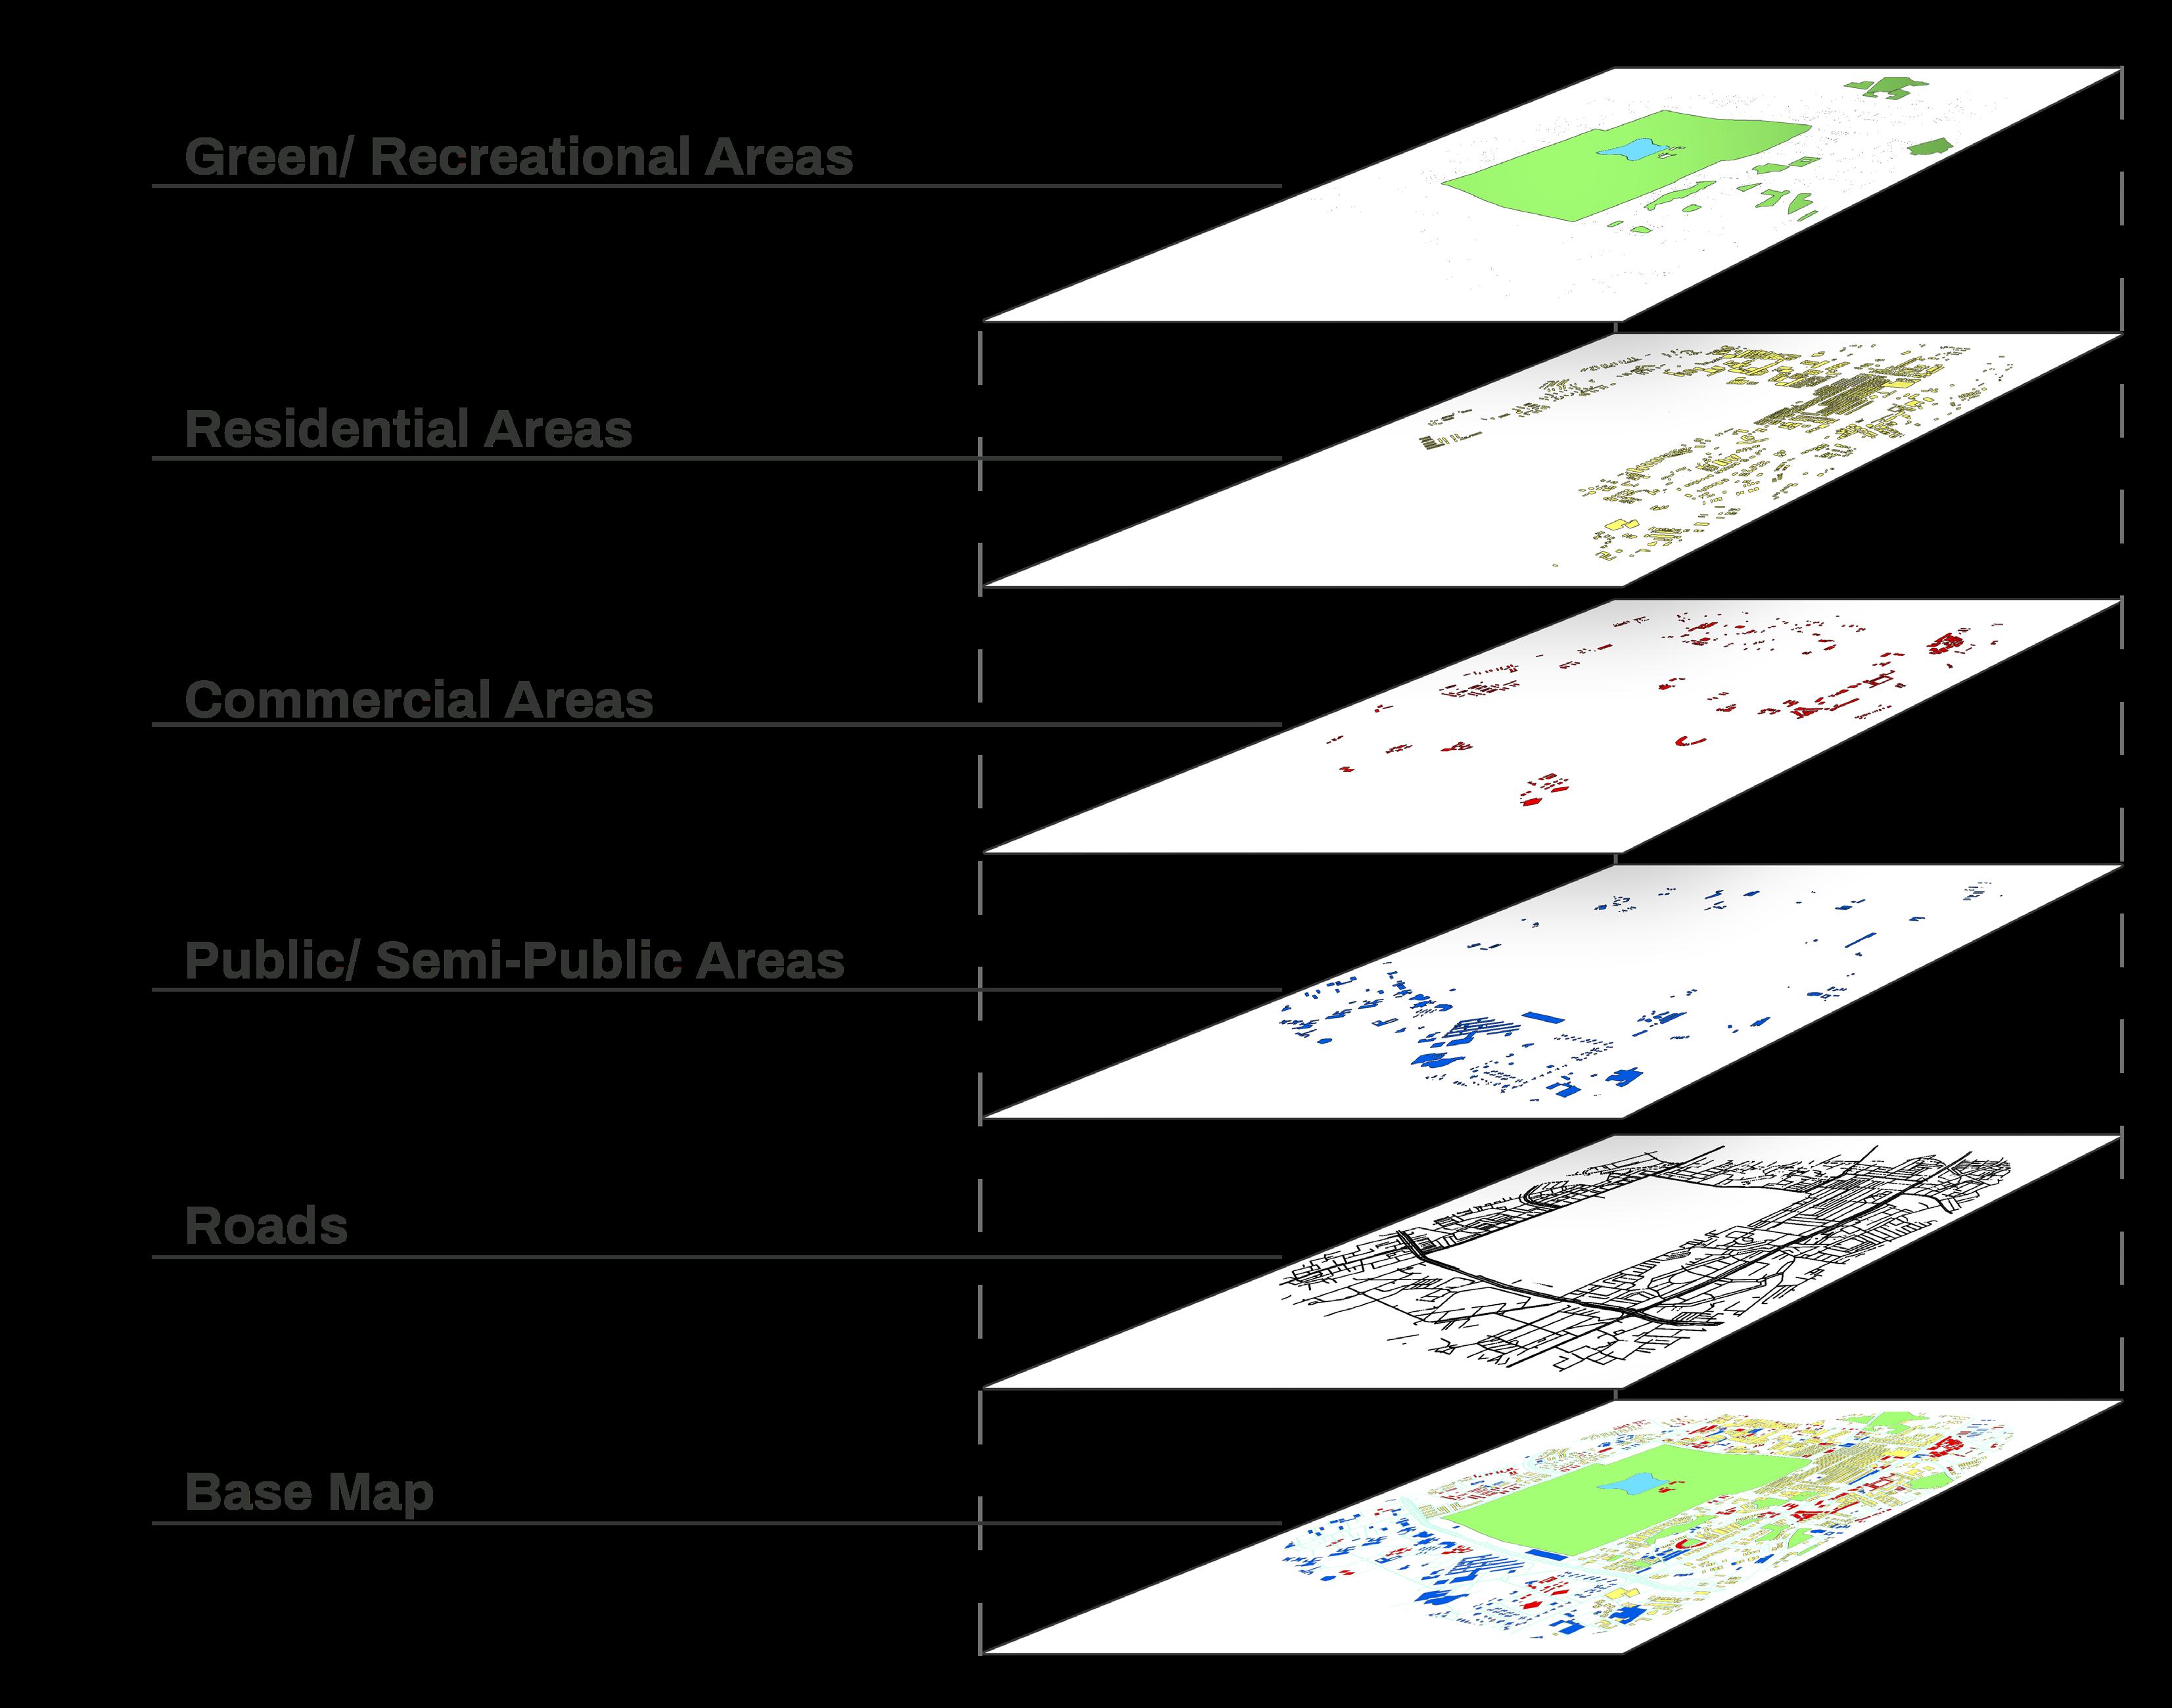
EXPLODED VIEW OF BASE MAP
SITE ANALYSIS
Figure shows the exploded view of the base map
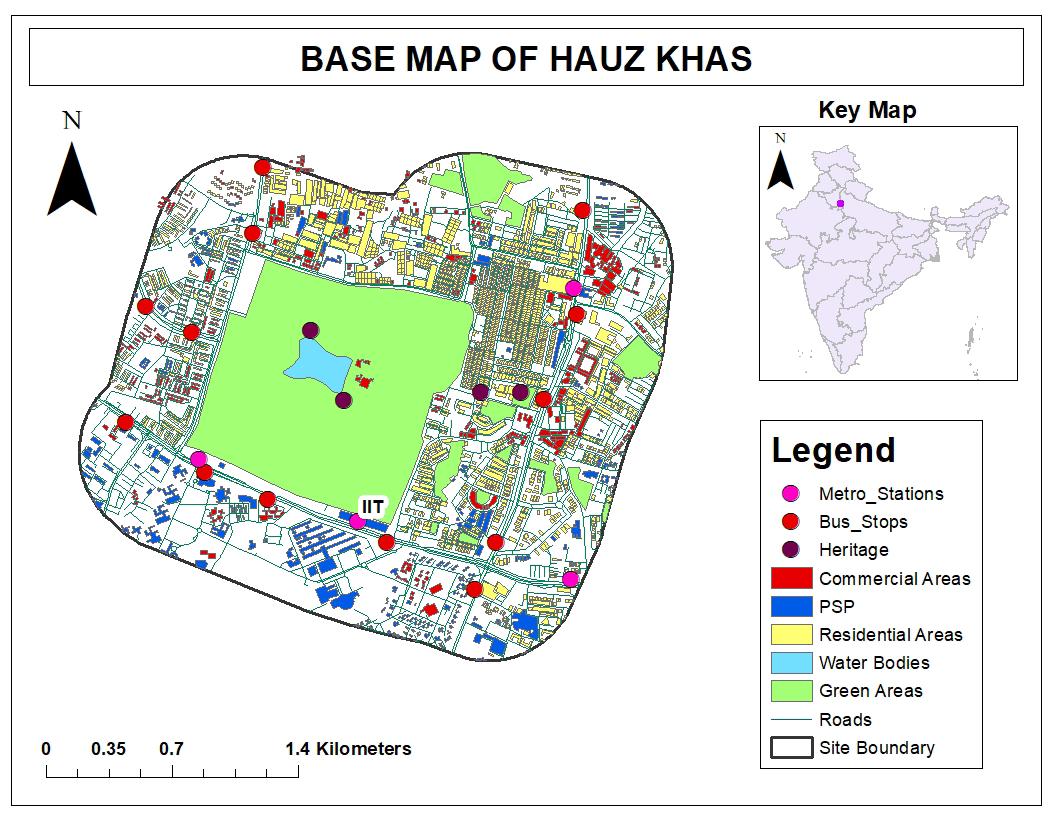
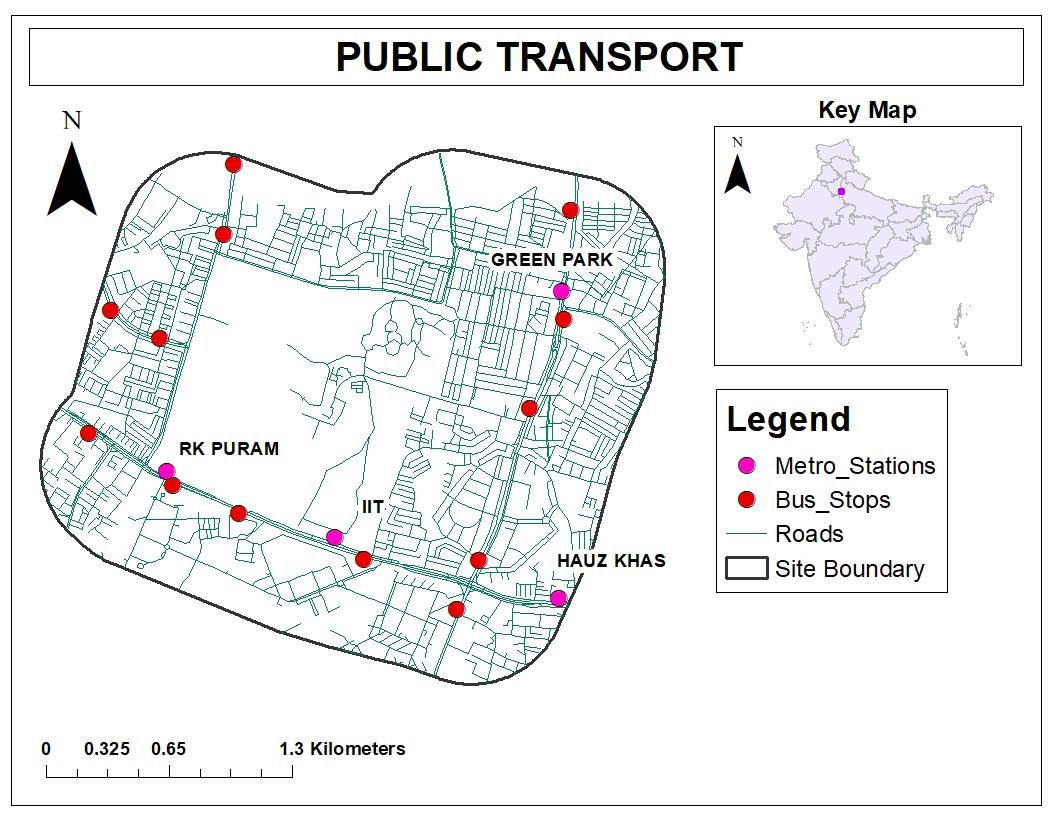
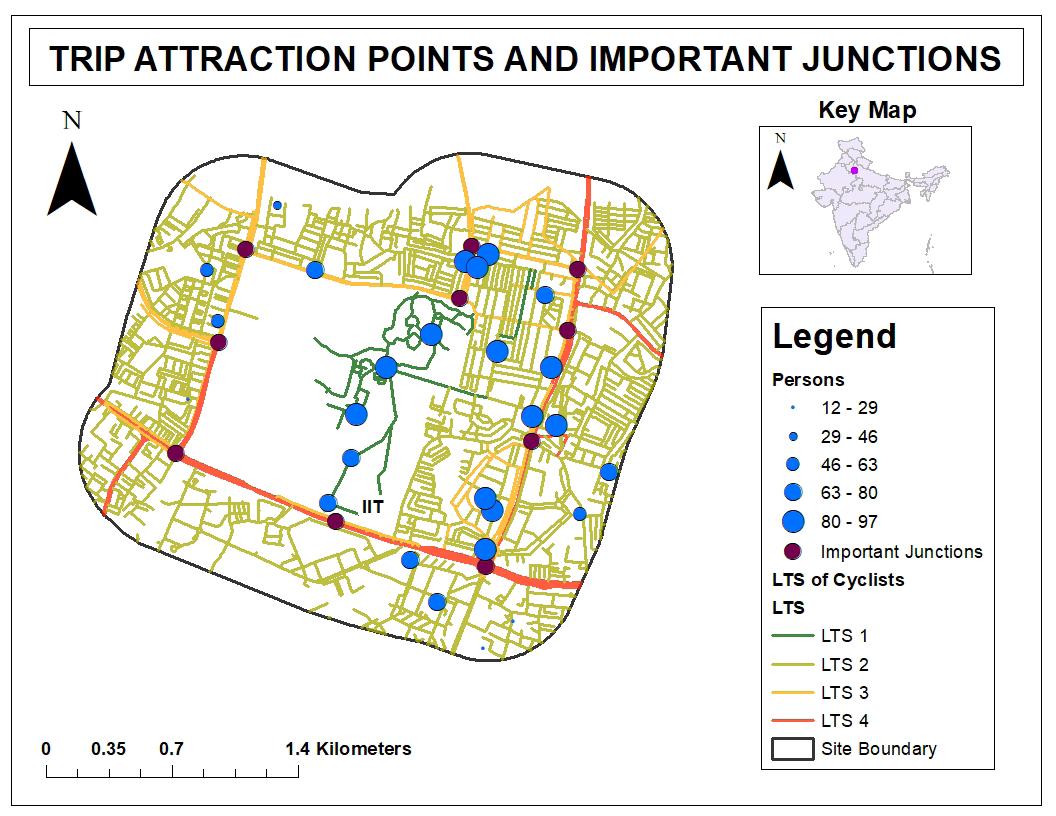
SITE ANALYSIS
BASE MAPS
RESPONDENT CHARACTERISTICS TRAVEL CHARACTERISTICS
The questionnaire for the primary data collection was divided in to two parts - Respondent Characteristics and Trip Characteristics. Google forms were circulated (as mentioned above) and 97 responses were received, out of which 57% participants were from Hauz Khas (site), 33% live d near the site and were regularly traveling to the site and the rest 10% were from other parts of Delhi.
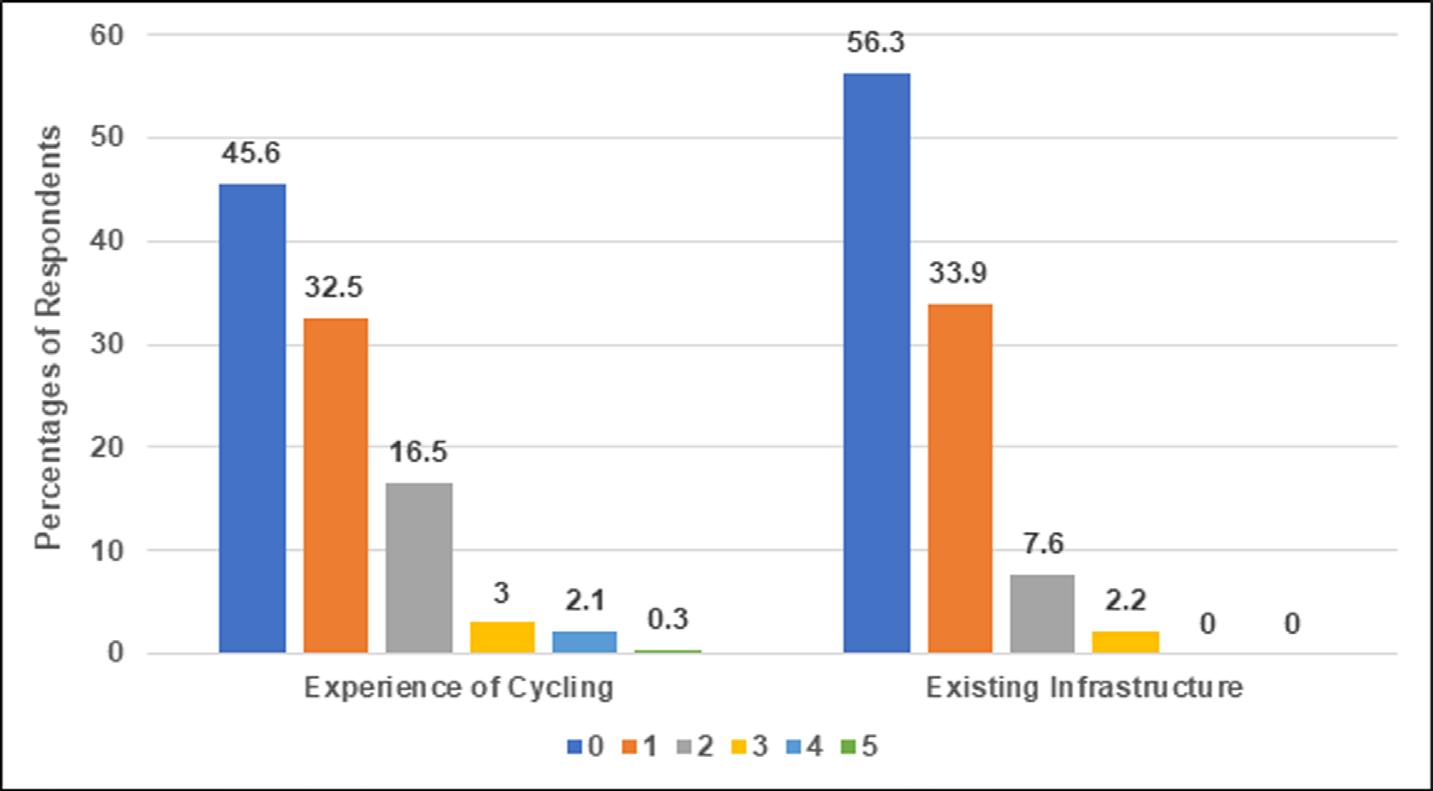
The respondent characteristics showed that 92% of the respondents were under the age group of 19 - 30 years of age, out of which 71 % were students studying either in Hauz Khas or were studying outside the site area. Out of the 97 respondents, 56.7% were male, 40.4% were females and the rest 2.9% were transgenders. The data for owning bicycles revealed that 48.5% had one cycle, 12.6% had two cycles and the rest 38.9% had no cycles.
Experience of Cycling Infrastructures
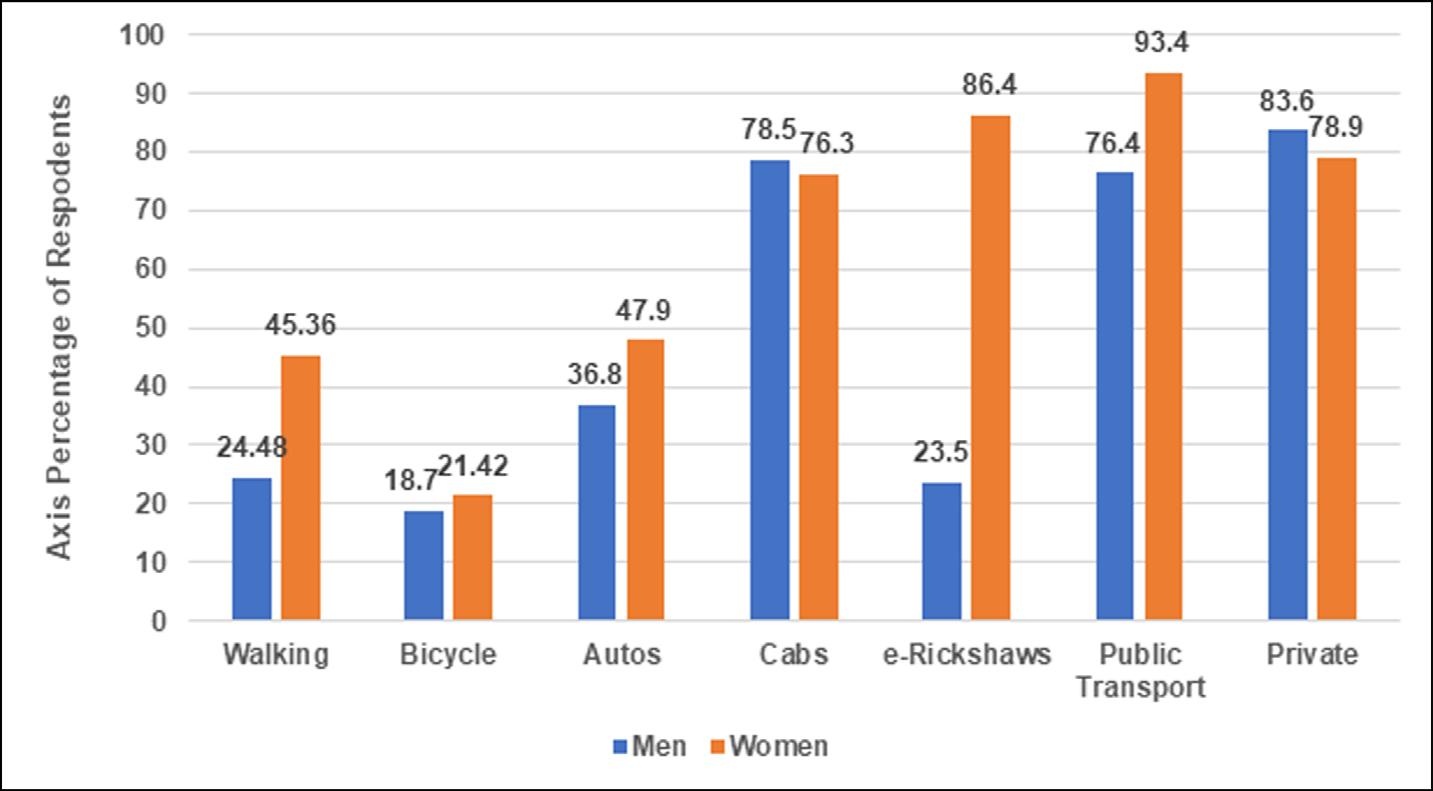
Gender Based Mode Choice
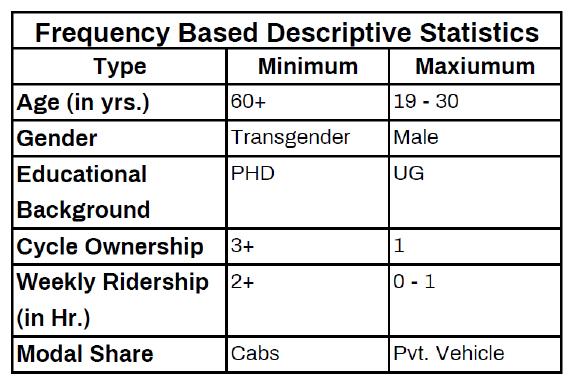
Table shows frequency based descriptive statistics
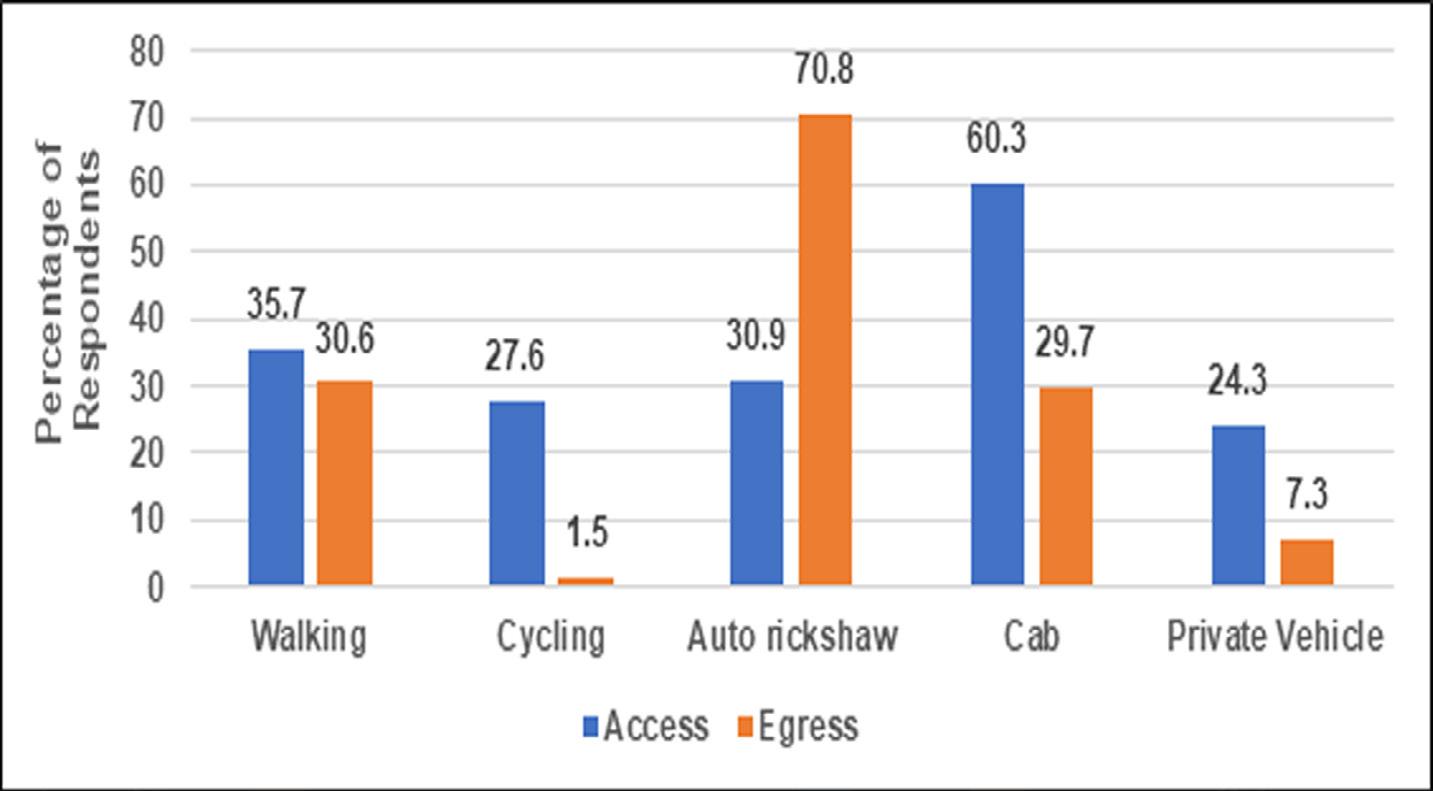
and Egress
Access
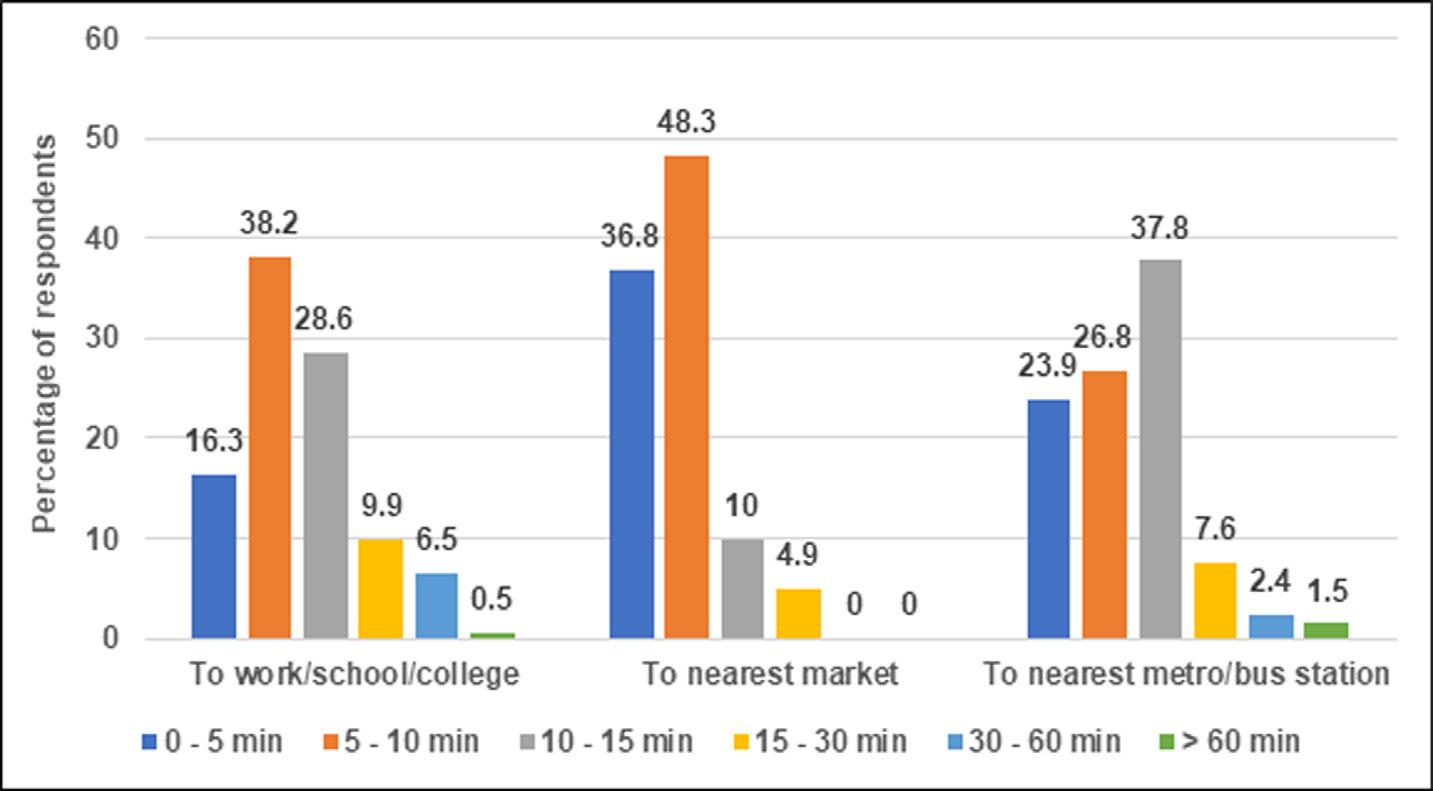
Time Taken to Reach Each Destination DATA
ANALYSIS
CORRELATION MATRICES
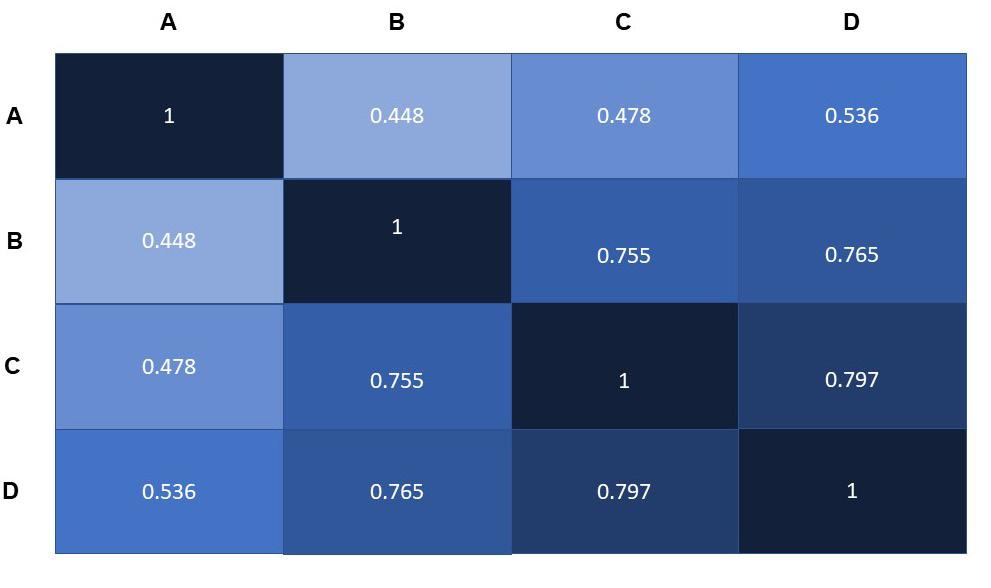
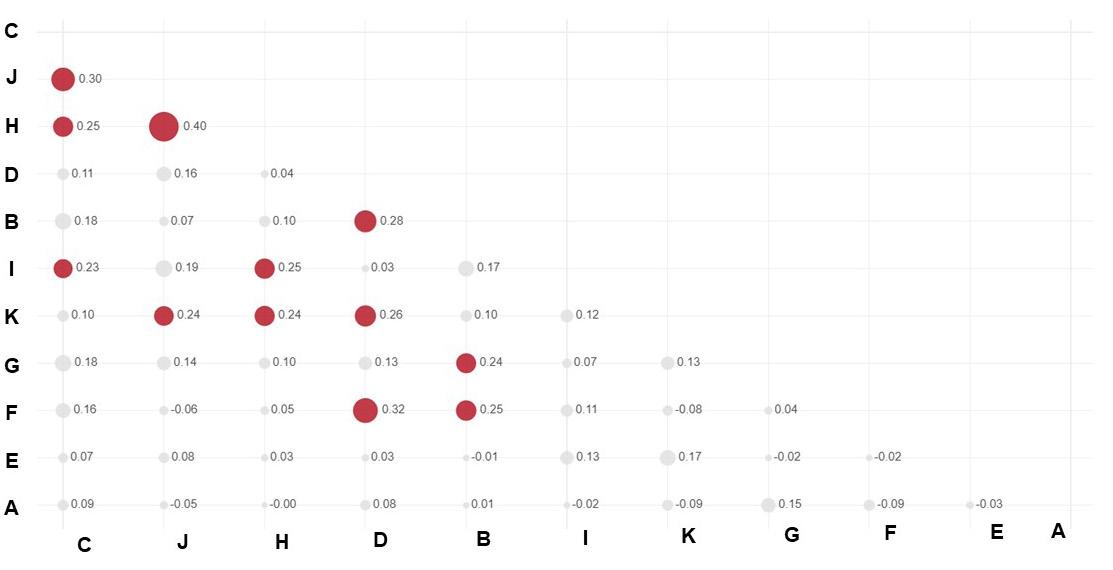
The correlation matrix is a statistical method which gives you values from -1 to 1, and which can be used to identify relationships between variables. The correlation matrix is useful to show correlation coefficients (or degrees of association) between variables. In some cases, we can generate a correlation matrix, which is a square table showing correlation coefficients among multiple variables. Depending on the sign of the Pearson’s correlation coefficient resulting, we may get either a negative or positive correlation, in the event, that there is any kind of relation between the two variables.
Note:
A = ‘The cost of fuel affects my decision about how to travel’;
B = ‘Congestion on roads is a serious problem’;
C = ‘l have many options about how I travel’;
D = There is adequate and convenient bike parking’;
E = ‘l think that cycling provide me the opportunity to exercise’;
F = ‘Extreme weather conditions make me reconsider my travel mode’;
G = ‘l feel safe cycling on the streets after dark’;
H = ‘The cycling infrastructure allows me to connect to different parts of the city’;
I = ‘l think that the flexibility of departure time is an important factor in my travel decisions’;
J = ‘l cycle to save the environment from further degradation’;
K = ‘There is too much pollution to cycle outside’.
RESULT:
The ‘Perception towards Recreational Trips’ was positively correlated towards the ‘Experience of Cycling’ (+ 0.797)
Note:
A = Convenience of traveling to nearest bus stop/ auto stand/ metro station;
B = Existing infrastructure for cycling;
C = Perception/ experience towards cycling;
D = Perception towards incorporating green space
RESULT:
The attitude ‘l cycle to save the environment from further degradation’ was found the most correlated (+ 0.40) to the attitude ‘The cycling infrastructure allows me to connect to different parts of the city’. However, a few variables were found to be negatively correlated like the most negatively correlated (-0.02) were the attitudes, ‘l cycle to save the environment from further degradation’ and ‘Extreme weather conditions make me reconsider my travel mode’
DATA
ANALYSIS
Figure shows the correlation matrix of different variables
Figure shows the correlation matrix of different variables
LEVEL OF TRAFFIC STRESS
The Bicycle Level of Traffic Stress (BLTS) framework serves as an essential planning tool for urban planners and policymakers, working in conjunction with other factors such as community input and crash data to identify gaps and prioritize necessary improvements. With the aim of improving the safety and accessibility of local roadways for cyclists, planners in the District, as well as in Montgomery and Arlington counties, leverage satellite maps and street-level data to assess the Level of Traffic Stress (LTS) along existing roadway infrastructure, taking into account factors such as roadway width, speed limits, and parking patterns. These measures help ensure that urban planners can make informed decisions about infrastructure development, considering the needs of cyclists and creating safer, more accessible environments for all road users.
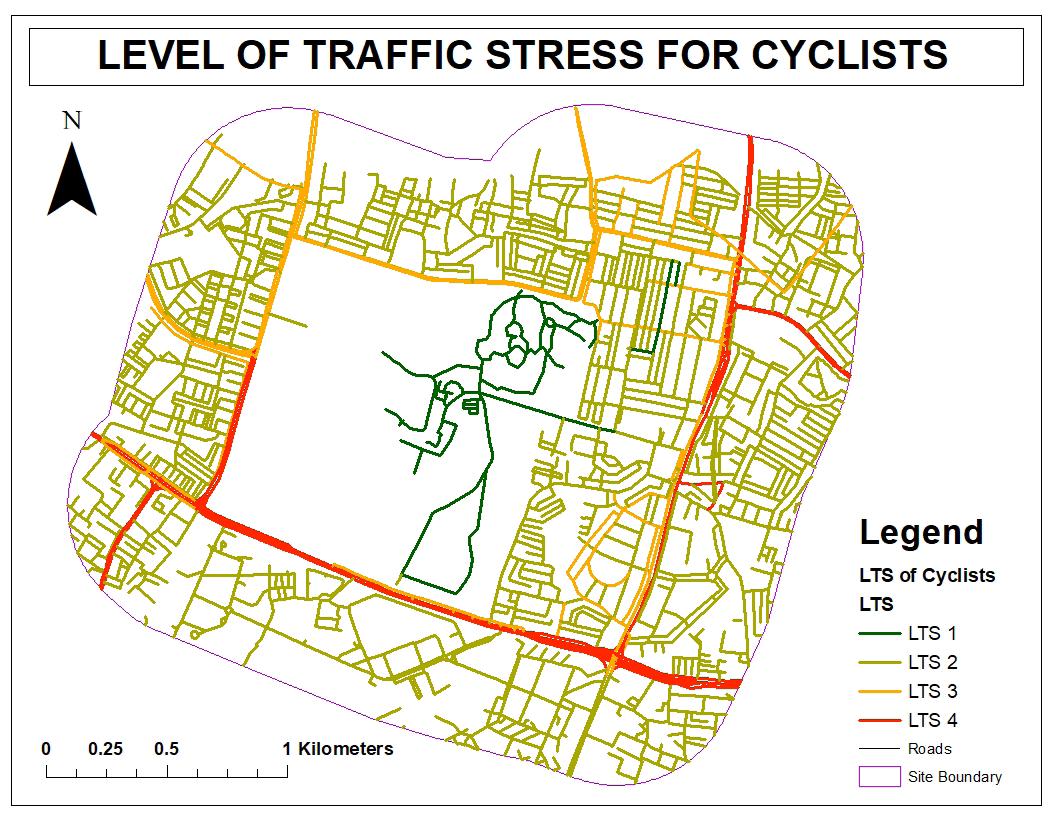
By leveraging satellite maps and street-level data, planners can assess the LTS along local roadways, identifying factors such as roadway widths, speed limits, and parking patterns that may pose a challenge for cyclists. This data can then be used to develop targeted interventions to address specific barriers to cycling, such as improving visibility for cyclists or reducing speed limits on high-stress routes.
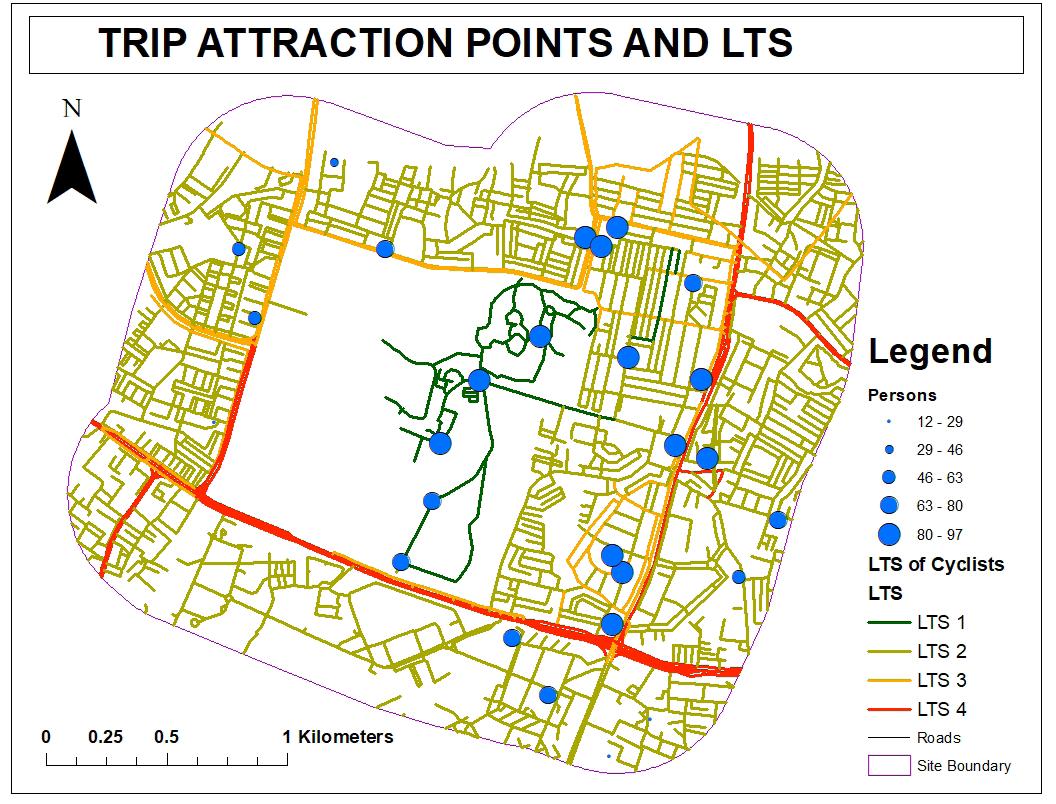
Result: The findings indicated that LTS 1 was identified for the trips taken inside the deer park, while LTS 2 was noted for the streets without adequate bicycle infrastructure. Additionally, sub-arterial roads were found to have LTS 3, and for the arterial roads, LTS 4 was identified. These results highlight the need for appropriate planning and infrastructure implementation in the study area to ensure safe and efficient transportation for cyclists.
DATA
ANALYSIS
PROPOSED BICYCLE ROUTES
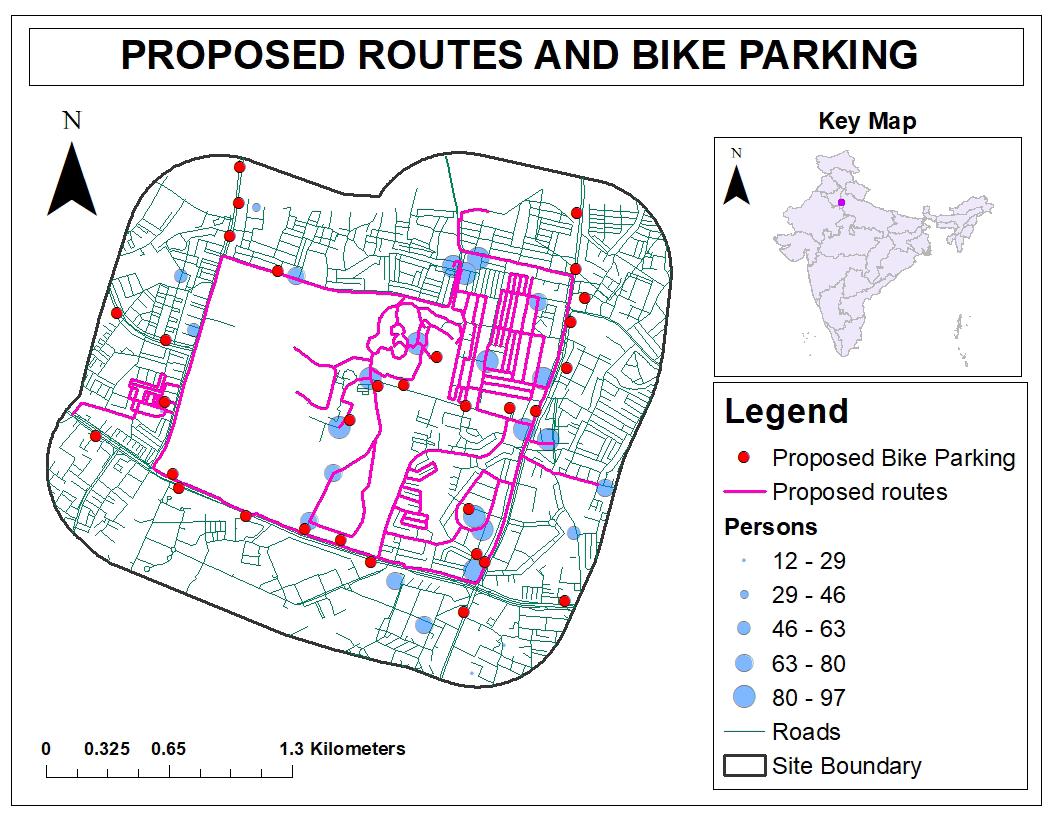
The purpose of this proposal is to promote cycling as an appealing mode of transportation and increase bicycle ridership. The proposal suggests a pink line that represents the proposed routes, which will connect residential and commercial areas to trip attraction points and important junctions. This route connects the major arterial road with the sub-arterial and collector roads, making it a comprehensive transportation network. Along the route, the proposal also includes red dots representing proposed bicycle parking stations that will offer end-of-trip facilities like toilets, bike racks based on Intelligent Transportation System (ITS), and repairing stations. The strategically placed stations will be located in essential commercial and Public Transport Stops to provide easy access to riders.
Additionally, the route links to the skating ring, deer park, adjacent parks, and major heritage areas. This was done intentionally to promote cycling for recreational trips, aiming to increase the overall bicycle ridership.
Based on the proposal outlined above, the inference drawn is that the recommended route aims to improve the experience of cycling, whether for leisure or work. By creating a network of paths that are shorter than typical motorable roads and providing safe connections to important junctions and attractions, the proposal seeks to make cycling an enjoyable mode of transport. In particular, the proposal is designed to encourage recreational cycling, with the aim of increasing ridership for both leisure and work purposes. Overall, the proposal aims to create a more attractive and sustainable mode of transport for the local community.
PROPOSALS
ROAD DESIGN PROPOSALS
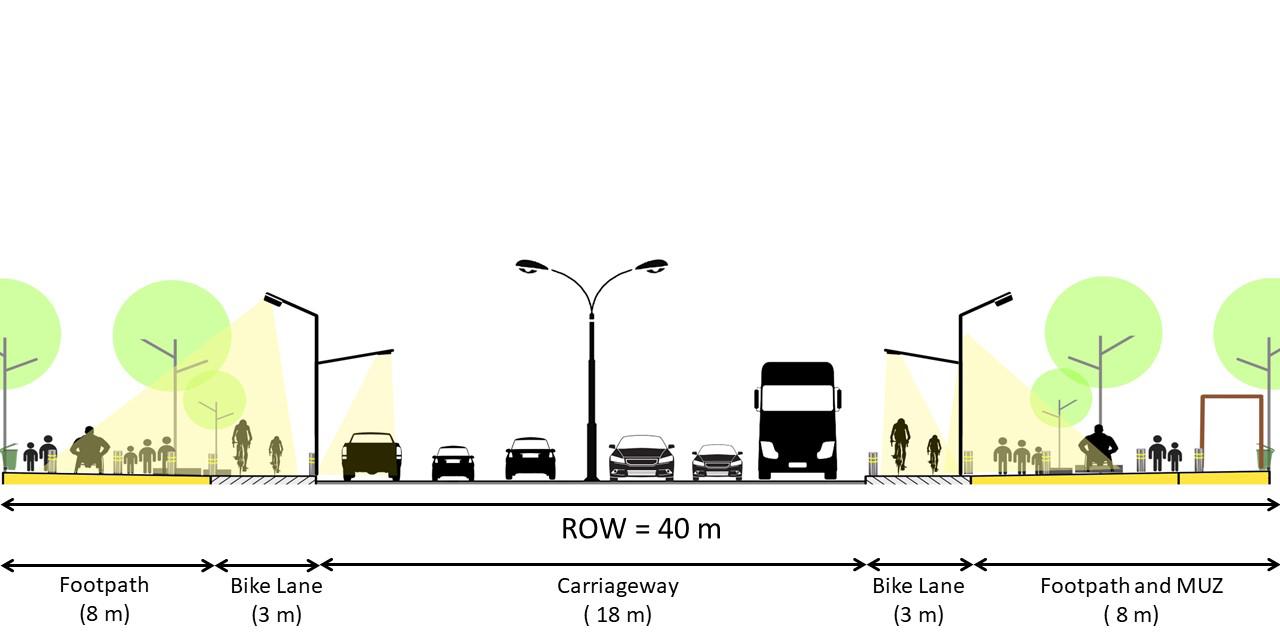
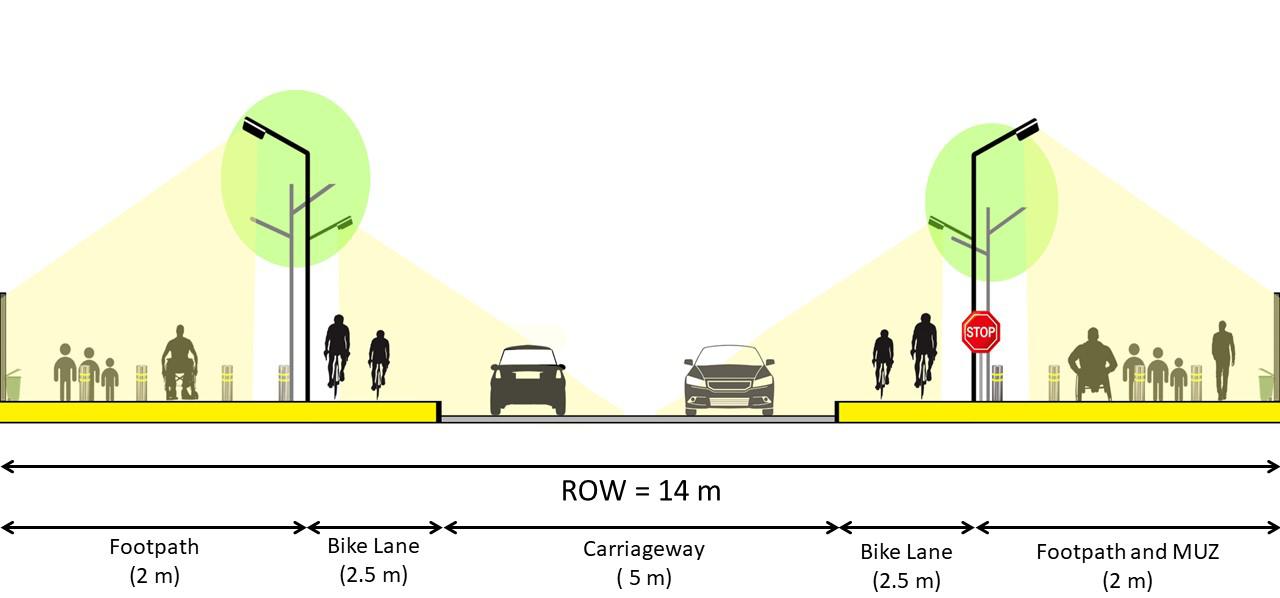
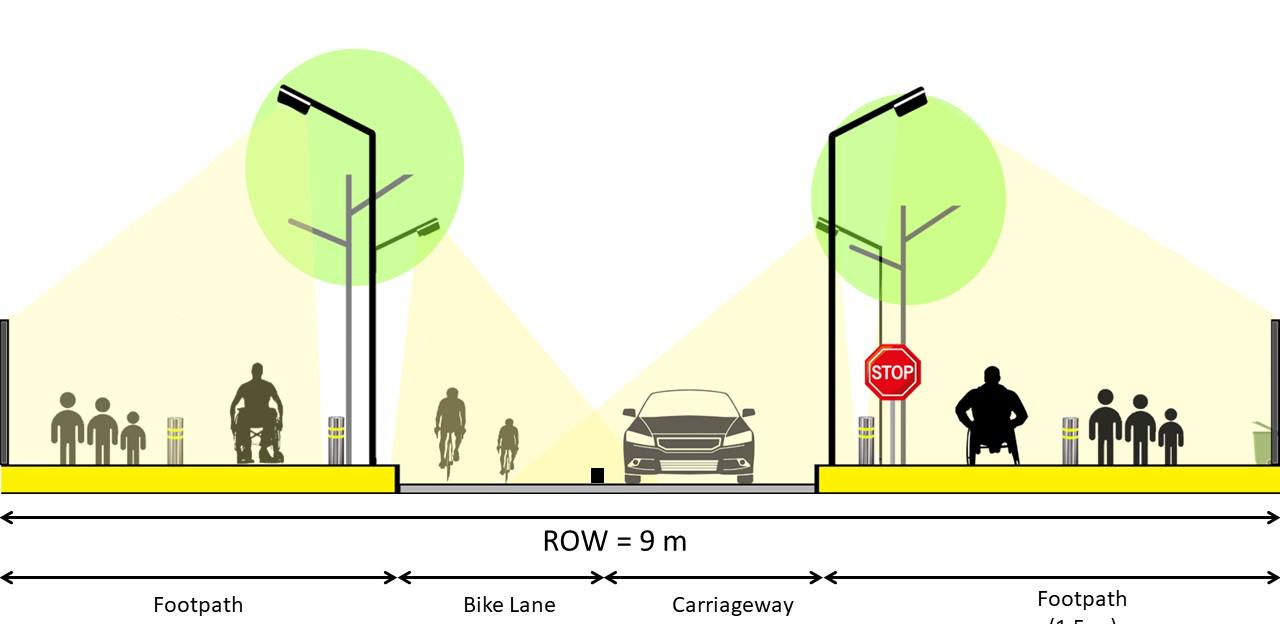
This proposal aims to improve continuity in bicycle lanes through the implementation of proposed cross sections for four types of roads: arterial road (40 m), sub-arterial road (24 m), collector road (14 m), and local residential street (9 m).
The current 40 m road has a service lane that serves as a parking spot, with the footpath located in the middle of the service lane and the carriageway. The proposed road will place the footpath in the location of the service lane, and the bike lane will take its place.
The 24 m road, located in one of the most affluent commercial streets, has a large footpath but no space for a bike lane, which this proposal addresses.
The 14 m road currently lacks sufficient space for pedestrians to move safely, and vehicle encroachment creates further problems for cyclists.
Similarly, the 9 m road experiences similar issues, along with dead edges for cyclists.
PROPOSALS
POLICY DESIGN PROPOSALS
In this proposal, a set of policies is proposed to ensure the success of the previously suggested proposals. The policies aim to create an environment that encourages cycling as a mode of transportation. The proposed policies are as follows:
1. The proposed bicycle routes should have priority-based traffic lights, which means that traffic lights will prioritize cyclists over other motor vehicles. This will help cyclists to have a smoother and more efficient journey, as they will not have to stop at every traffic light. The priority-based traffic lights will ensure that cyclists can travel with less interruption, improving their overall experience and making cycling a more appealing mode of transportation.
2. The implementation of proper signage for cyclists, which will help to improve their safety on the roads. The signage can be used to indicate the direction of the bicycle routes, warn motorists of the presence of cyclists, and provide information about the rules of the road. Proper signage will ensure that cyclists are aware of the route they need to take and help to prevent accidents.
3. Tax benefits for people who choose to cycle to work, which can be an incentive for people to start cycling. Tax benefits can be given in the form of income tax deductions or other financial incentives that encourage people to choose cycling over other modes of transportation. This policy can also help to reduce traffic congestion and air pollution by promoting cycling as a viable mode of transportation.
4. In mixed-use streets, one lane should be exclusively reserved for cyclists, where they can ride in both directions. Meanwhile, vehicles will run uni-directionally. This will ensure that cyclists have a safe and uninterrupted path to travel, reducing the likelihood of accidents and improving the overall cycling experience.
5. During peak hours on shared roads, users using motorized vehicles will be liable to pay a toll amount, while bicycle users will not. This policy aims to promote cycling as an affordable and environmentally friendly mode of transportation while also discouraging the use of motorized vehicles during peak hours, which can help to reduce traffic congestion and air pollution.
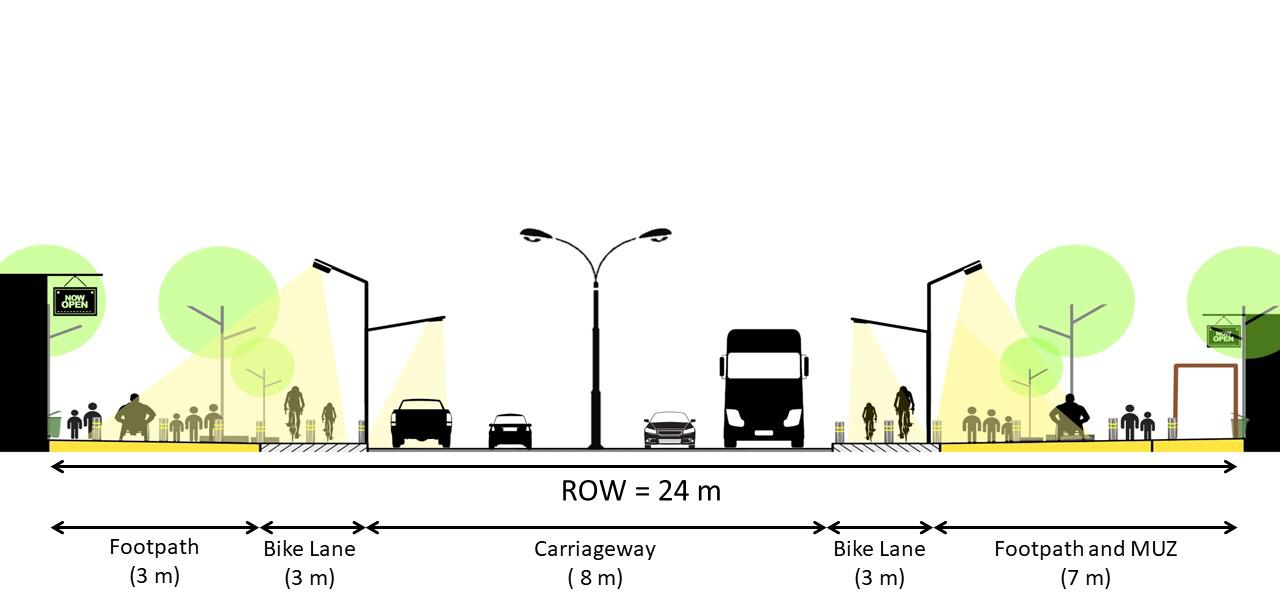 Figure shows the road design of a road of ROW 9m
Figure shows the road design of a road of ROW 14m
Figure shows the road design of a road of ROW 24m
Figure shows the road design of a road of ROW 40m
Figure shows the road design of a road of ROW 9m
Figure shows the road design of a road of ROW 14m
Figure shows the road design of a road of ROW 24m
Figure shows the road design of a road of ROW 40m
02
Change Detection of Air
Temporal
Pollution: A Case Study of Aizawl, Mizoram (Map It Out, Punarutthan - NOSPlan 2021)
ABSTRACT
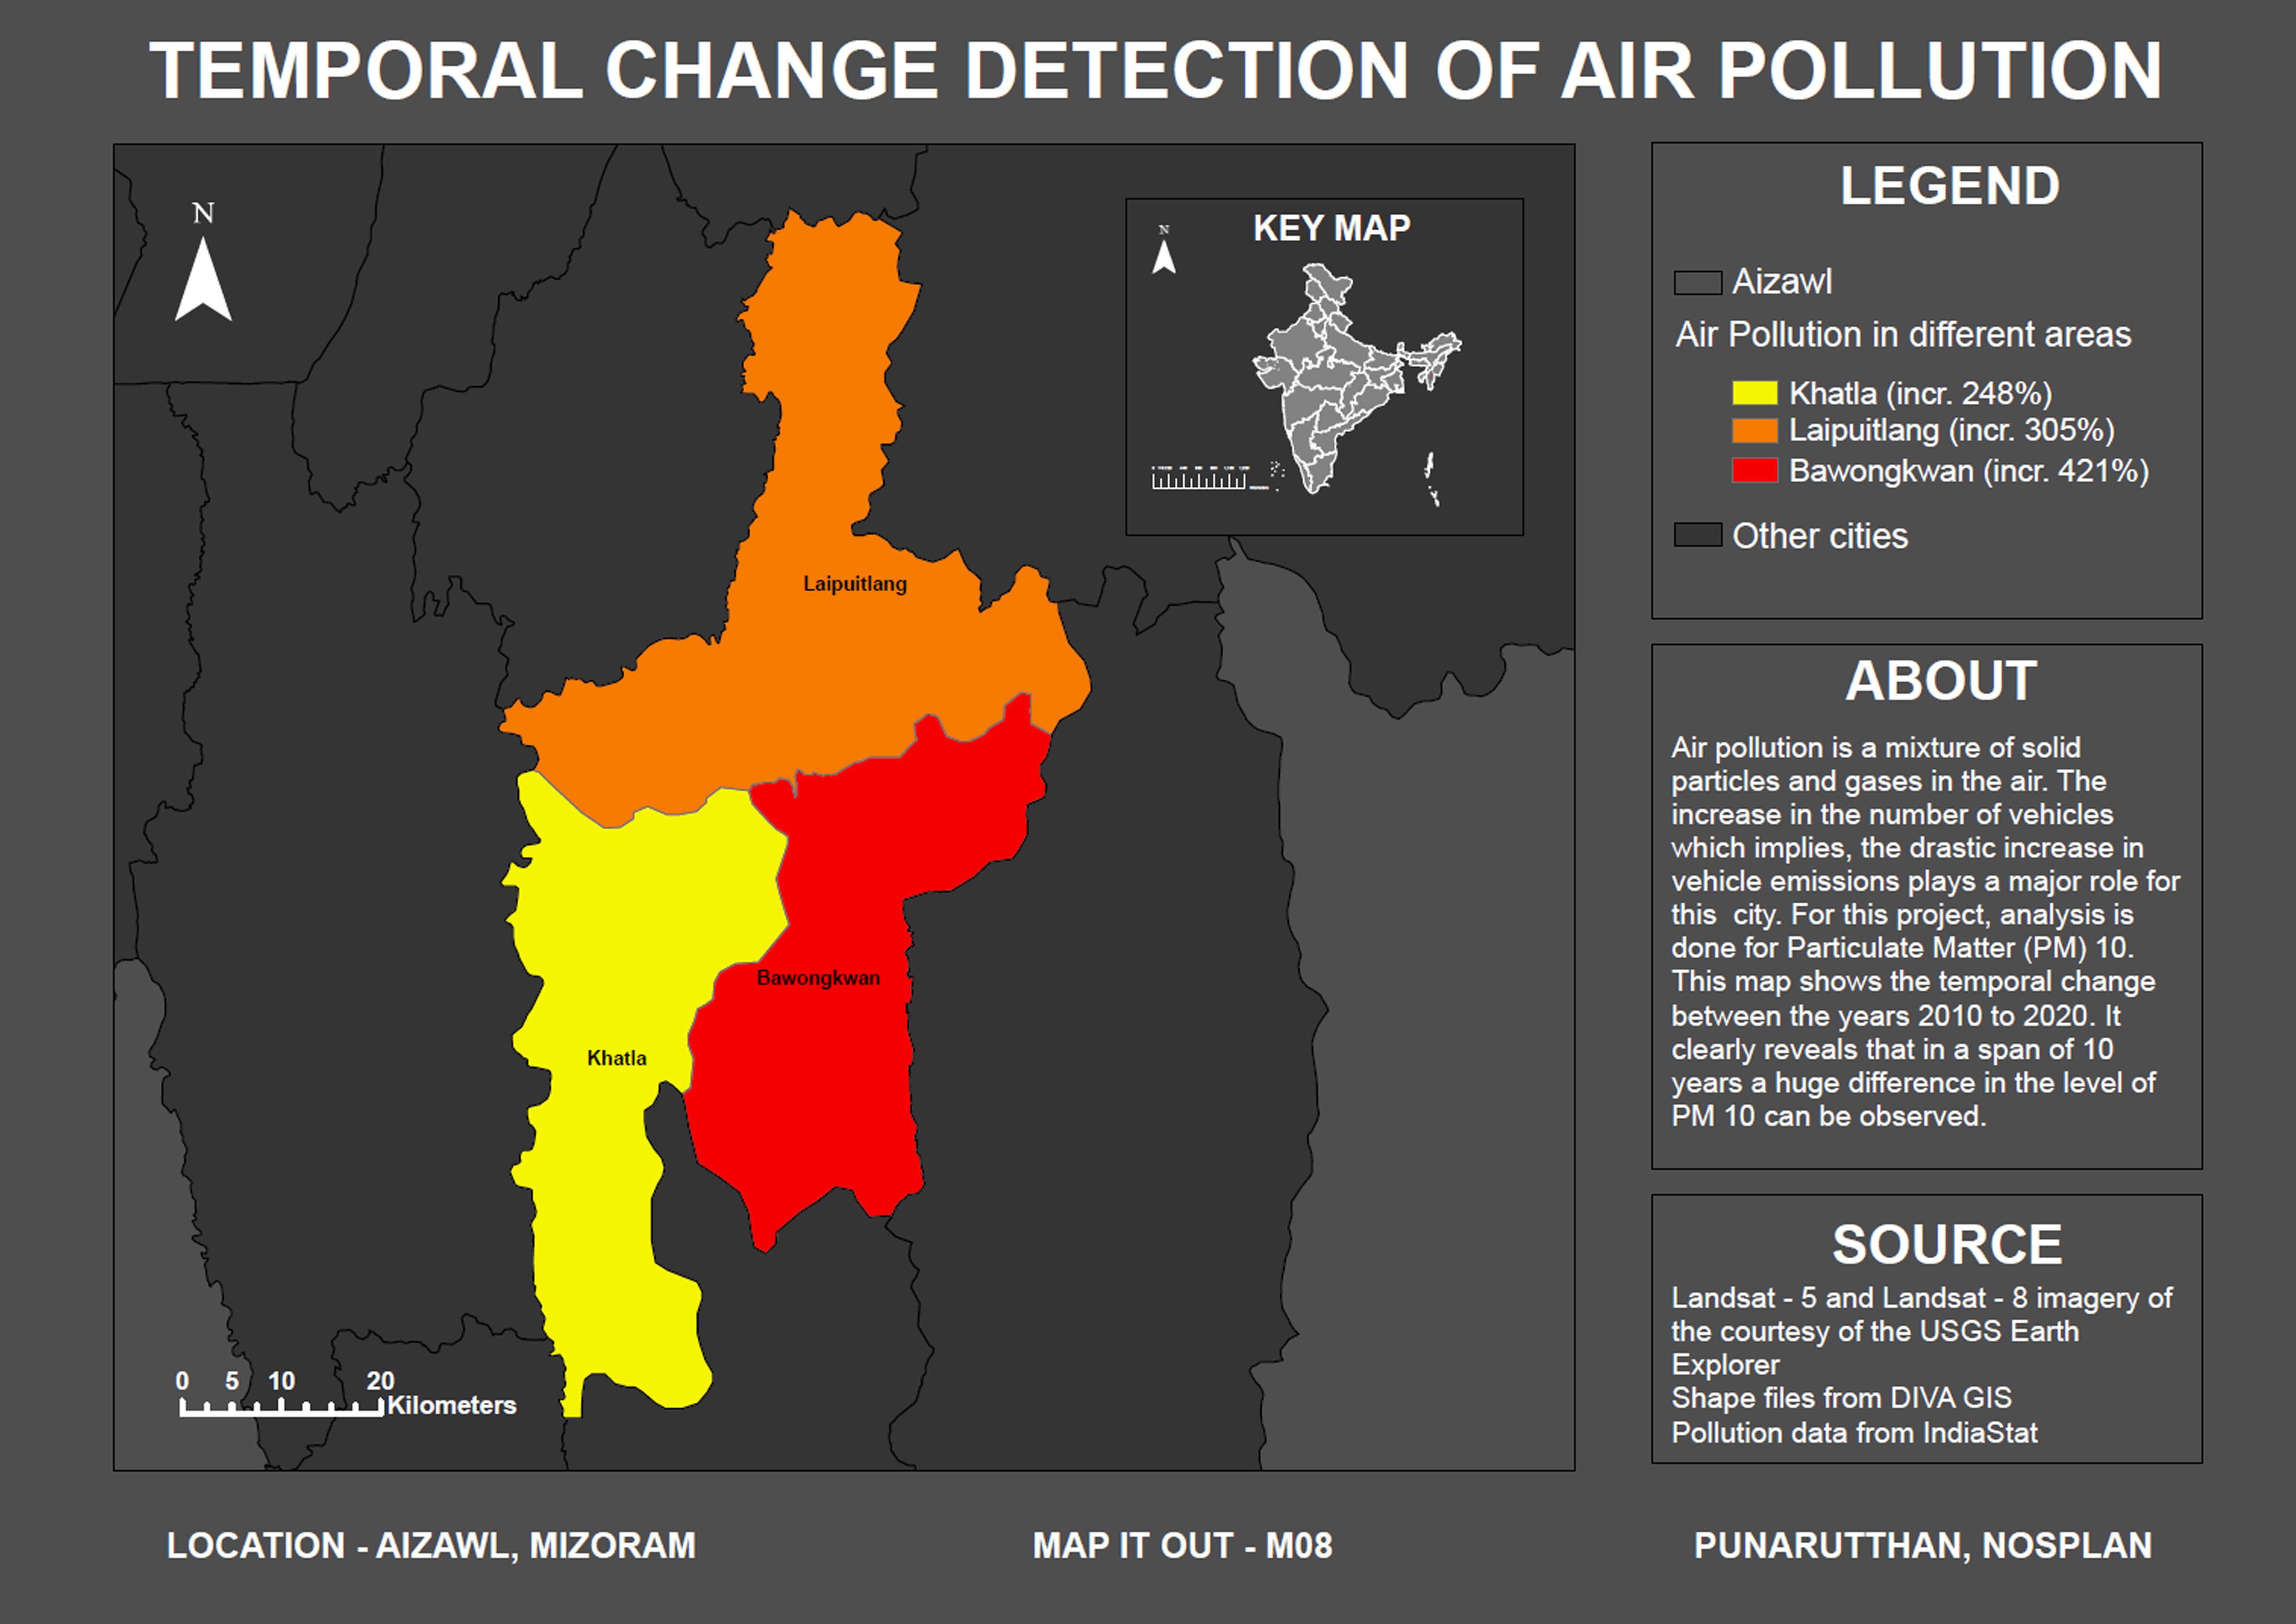
Air pollutants are extreme and chronic trouble in Aizawl which is located on a ridge 1,132 meters (3715 ft) above sea level.
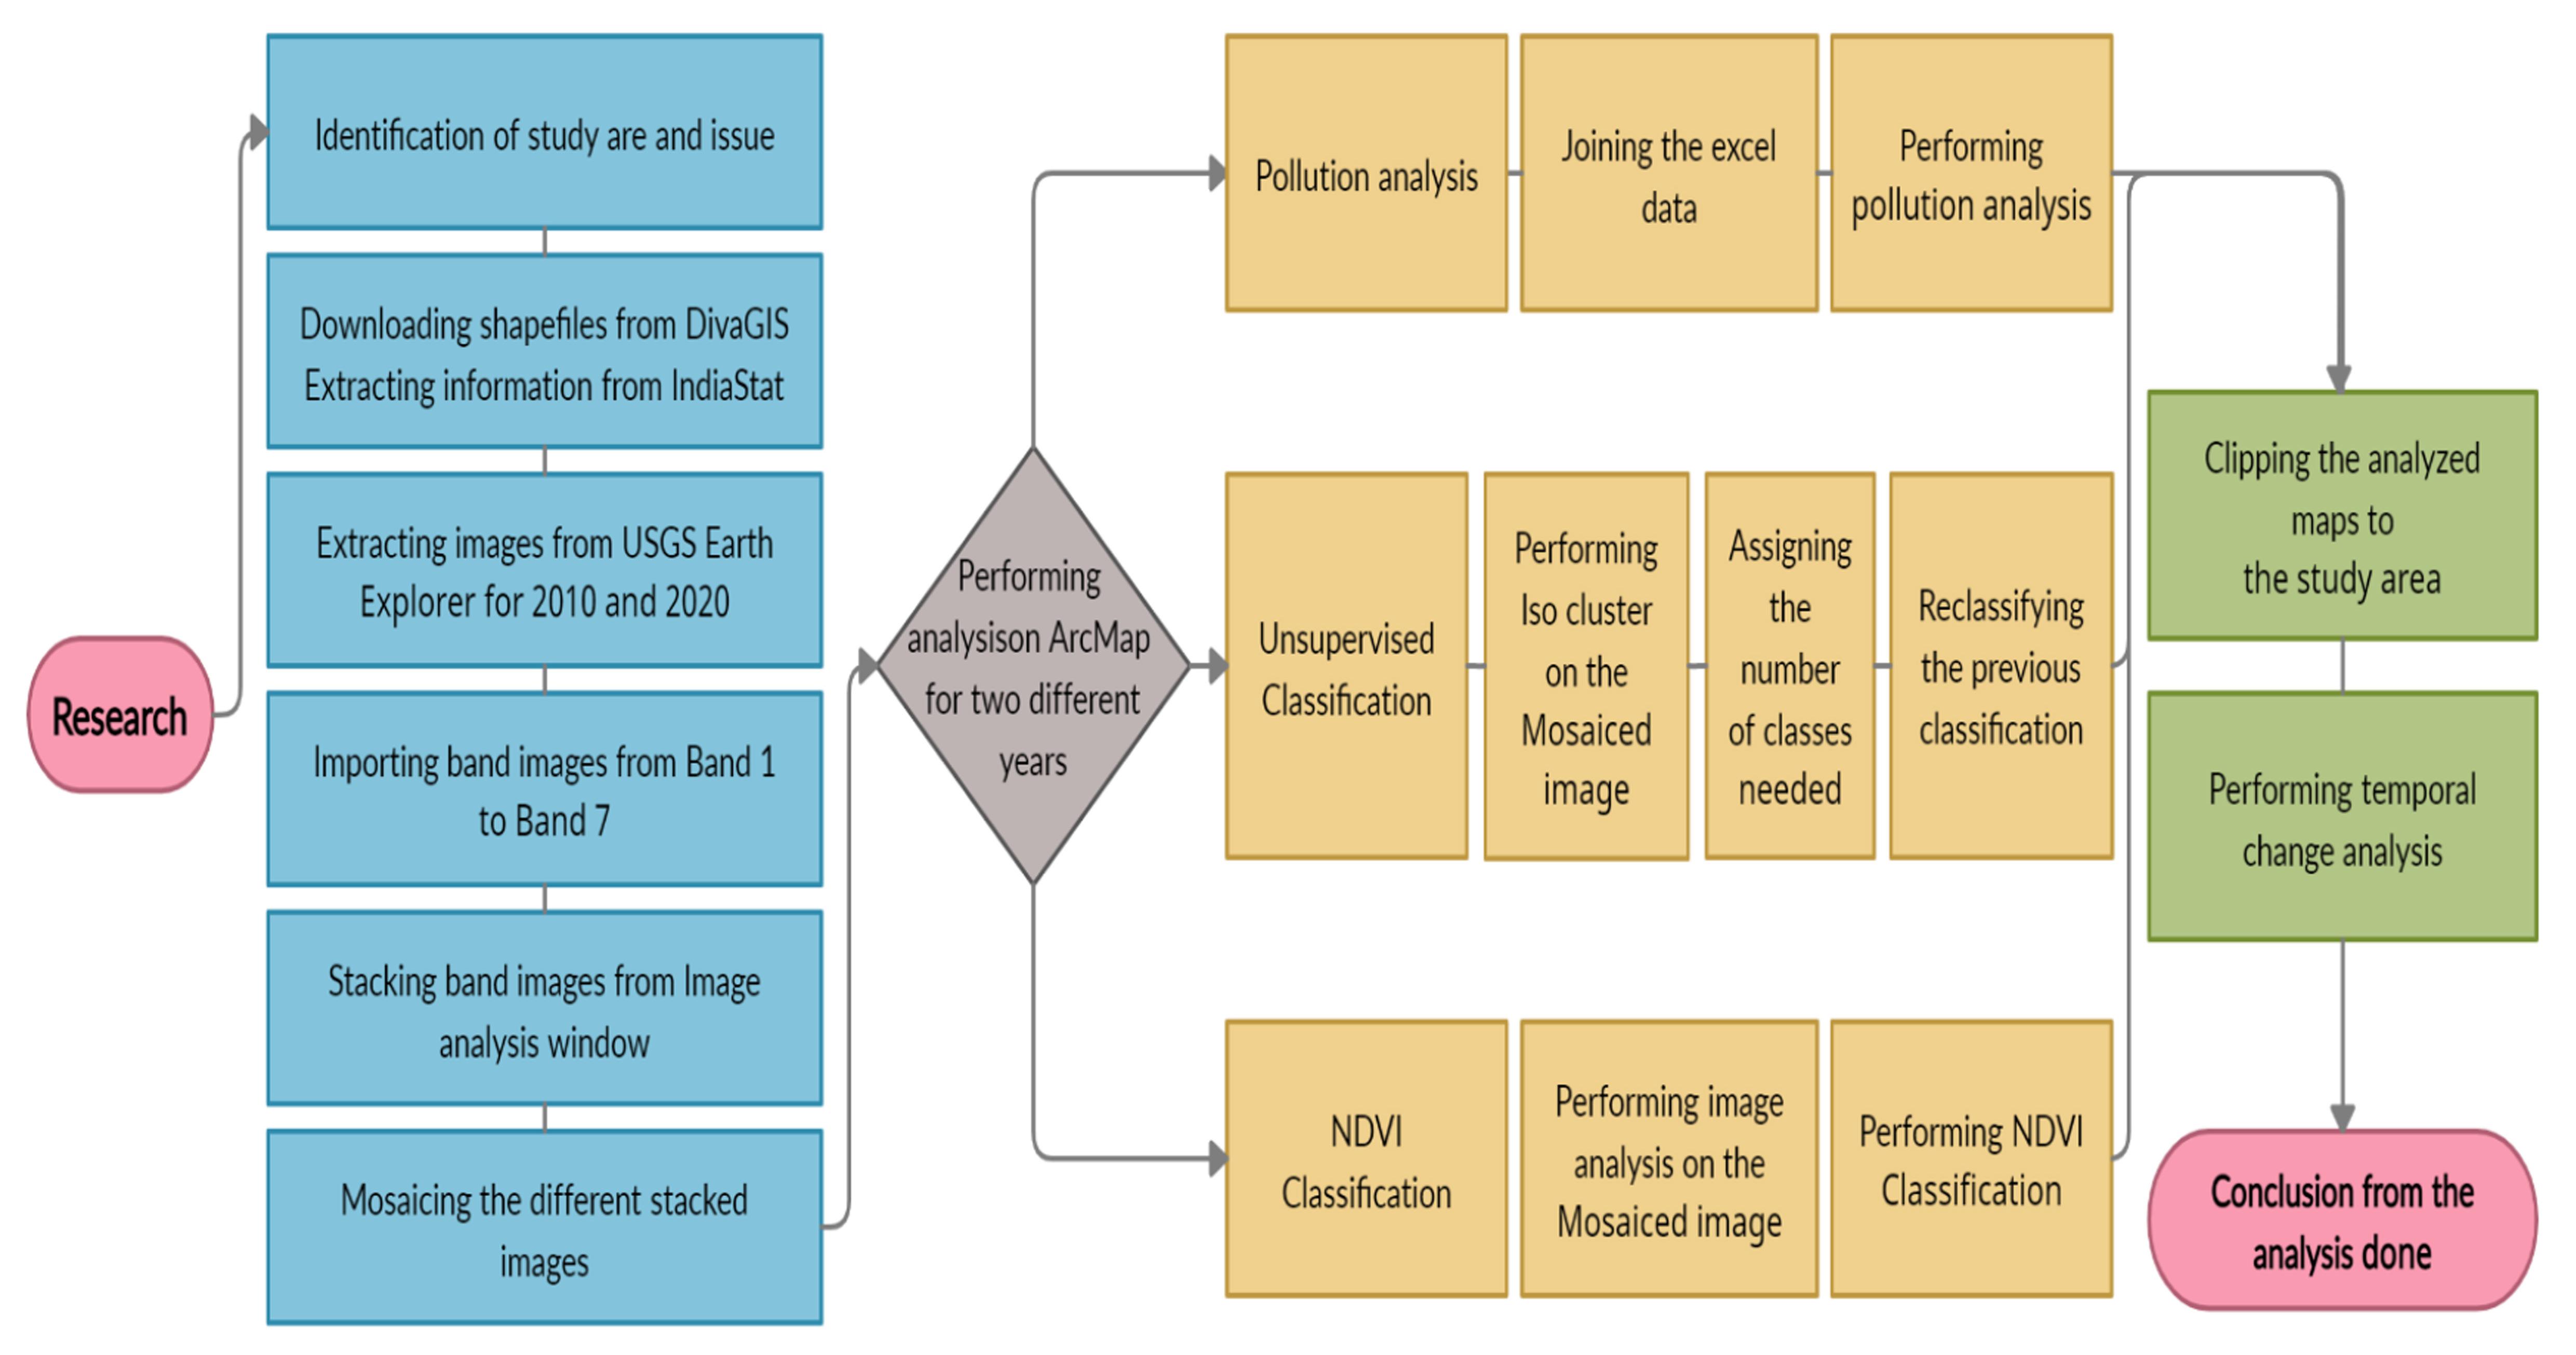
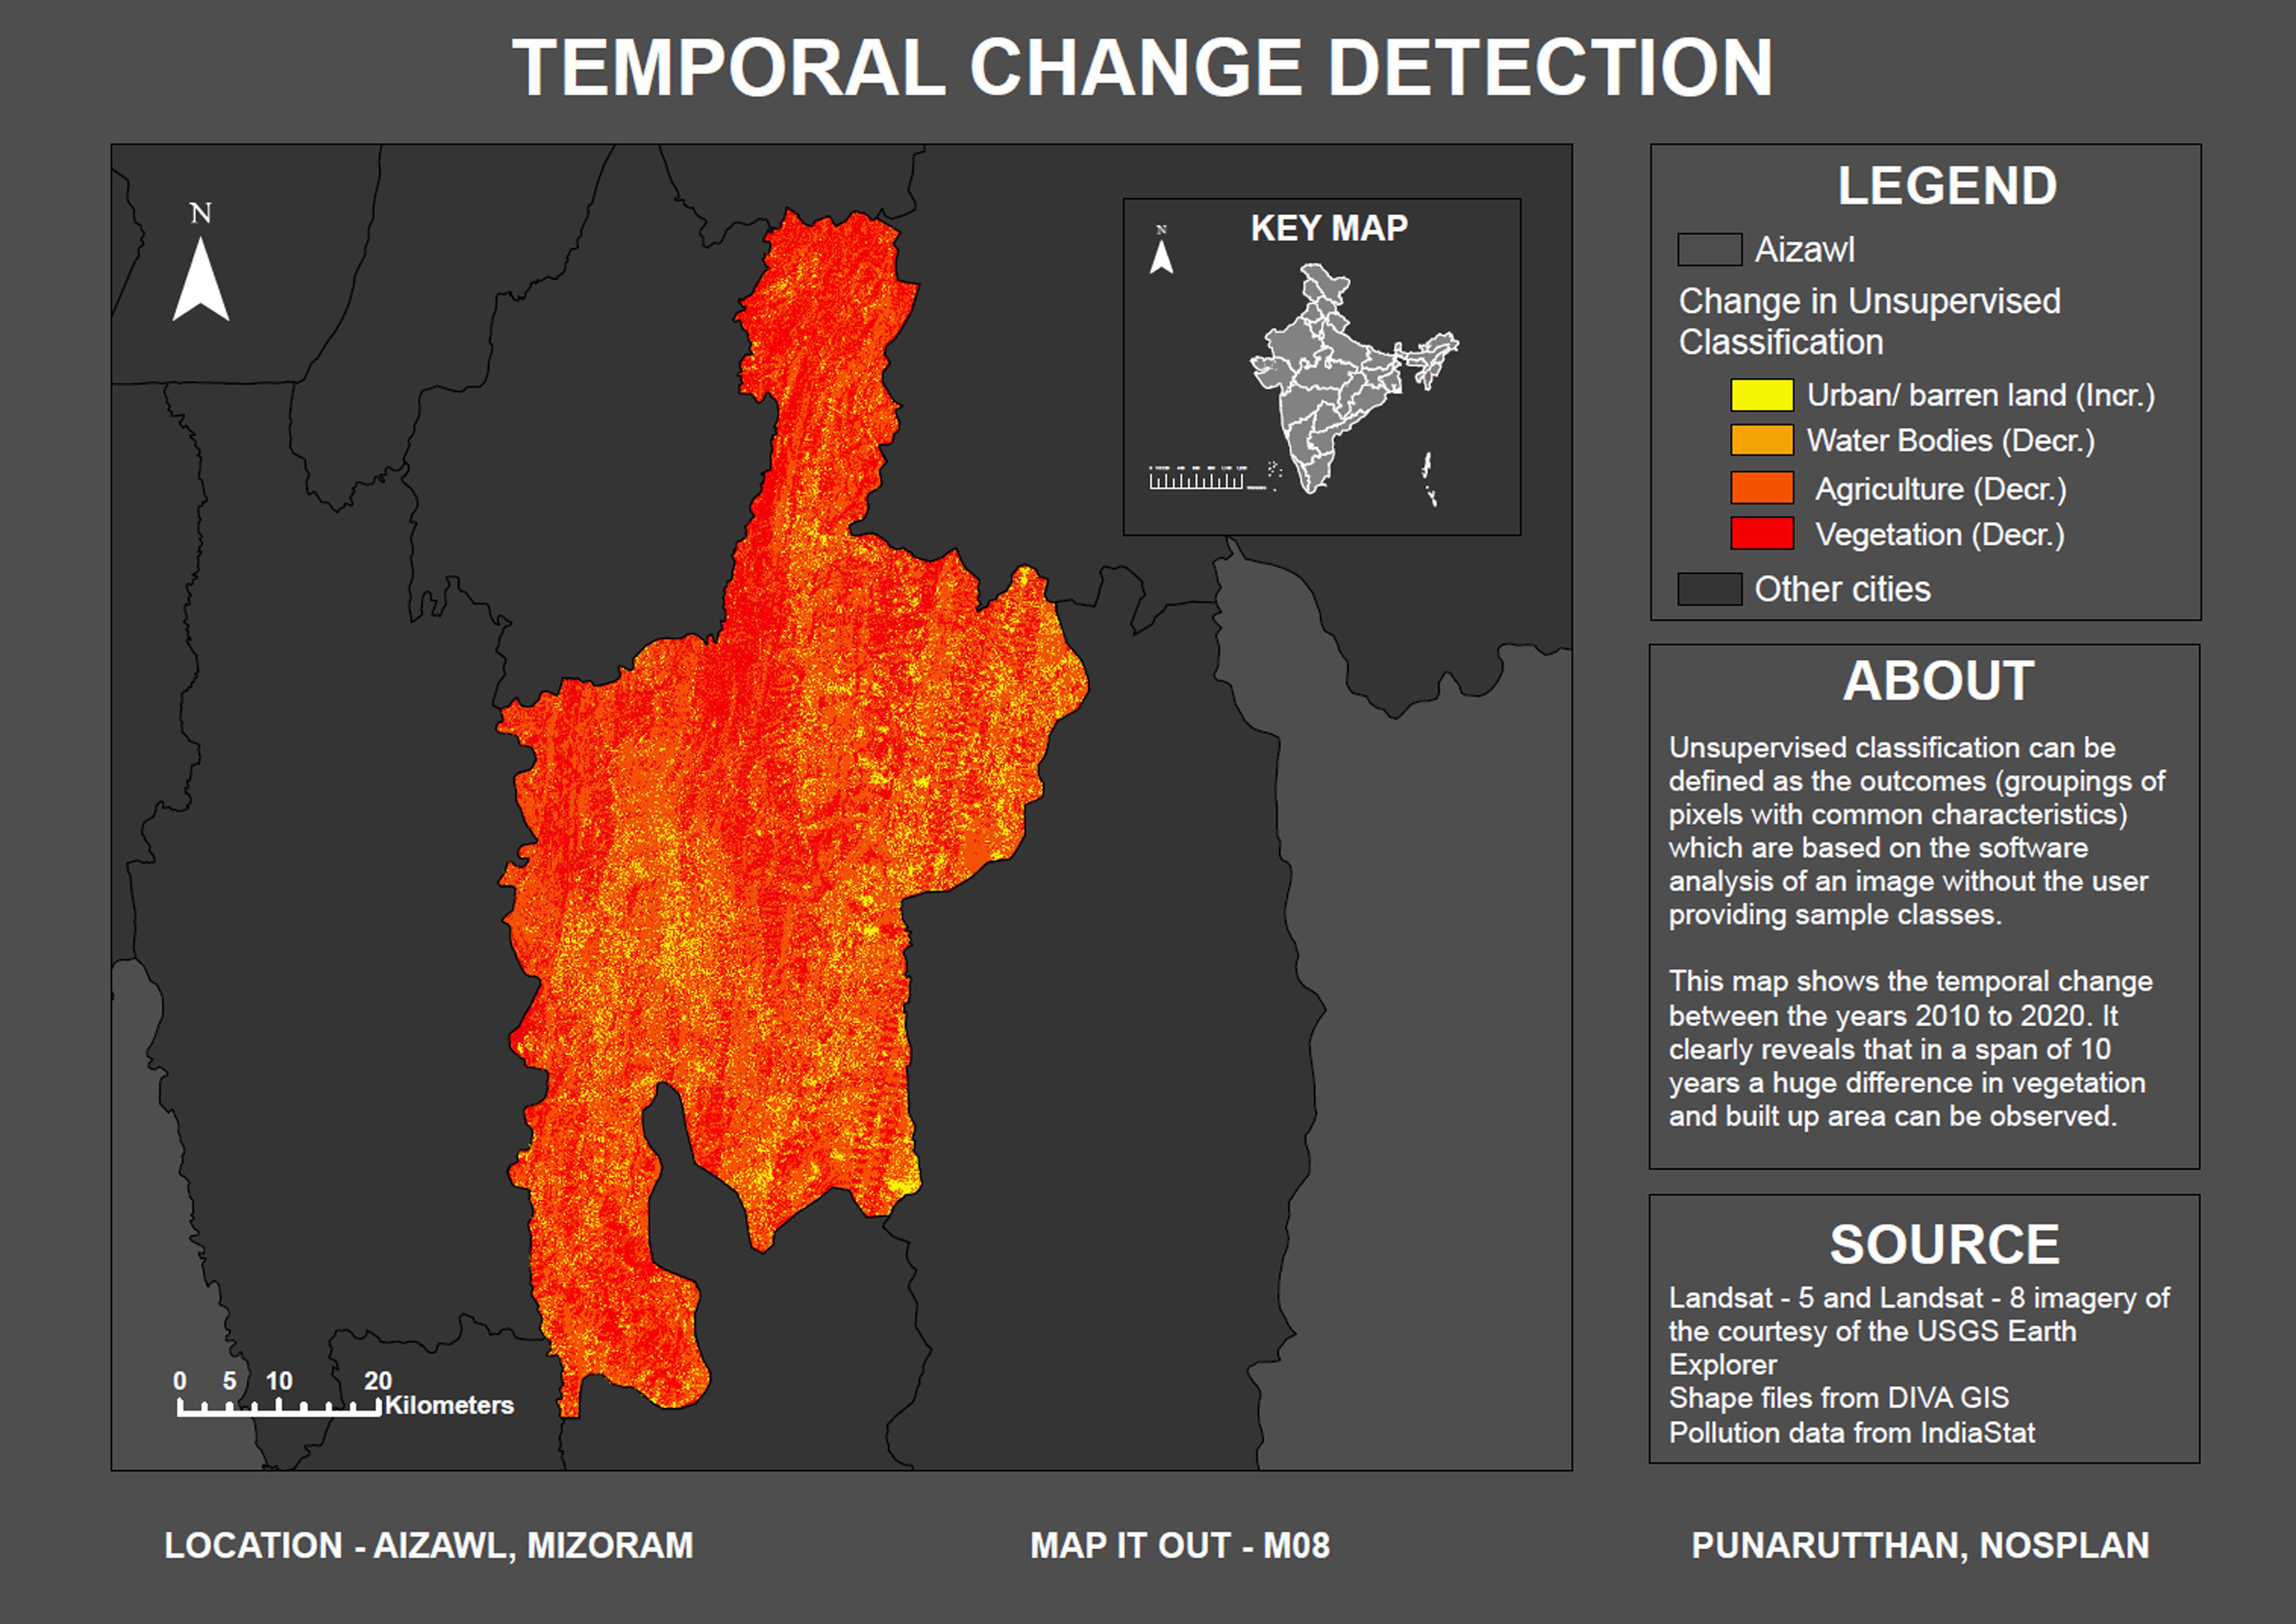
Air quality is crucial to our health and environment; however, assets of contamination are frequently hard to monitor. With the help of GIS, which uses statistical and spatial statistics tools to offer spatial services, the connection between air pollution and occurrences of human interventions in the environment is analyzed. This record ambitions to map the air pollution of Aizawl with the help of various GIS products.
METHODOLOGY
NOSPLAN COMPETITION
NOSPLAN COMPETITION
NOSPLAN
COMPETITION
NOSPLAN COMPETITION
GIS Based Master Plan (2041): A Case Study of Greater Imphal, Manipur
(Research Internship, School of Planning and Architecture, Bhopal)
03
INTERNSHIP WORK
PROJECT BRIEF
Under the funding of the Atal Mission for Rejuvenation and Urban Transformation (AMRUT), Ministry of Housing and Urban Affairs, Manipur’s Chief Minister, N Biren Singh, launched a website of the Town Planning Department for the Geographic Information System (GIS) based master plan for Greater Imphal for the Horizon Year 2041 on 22 August, 2019.
School of Planning and Architecture, Bhopal along with the Government of Manipur took up this task.
JOB ROLE (Research Intern)
1. Creating and maintaining GIS maps of core infrastructure including water supply systems, public transportation and para-transit systems, land use maps, and solid waste management systems.
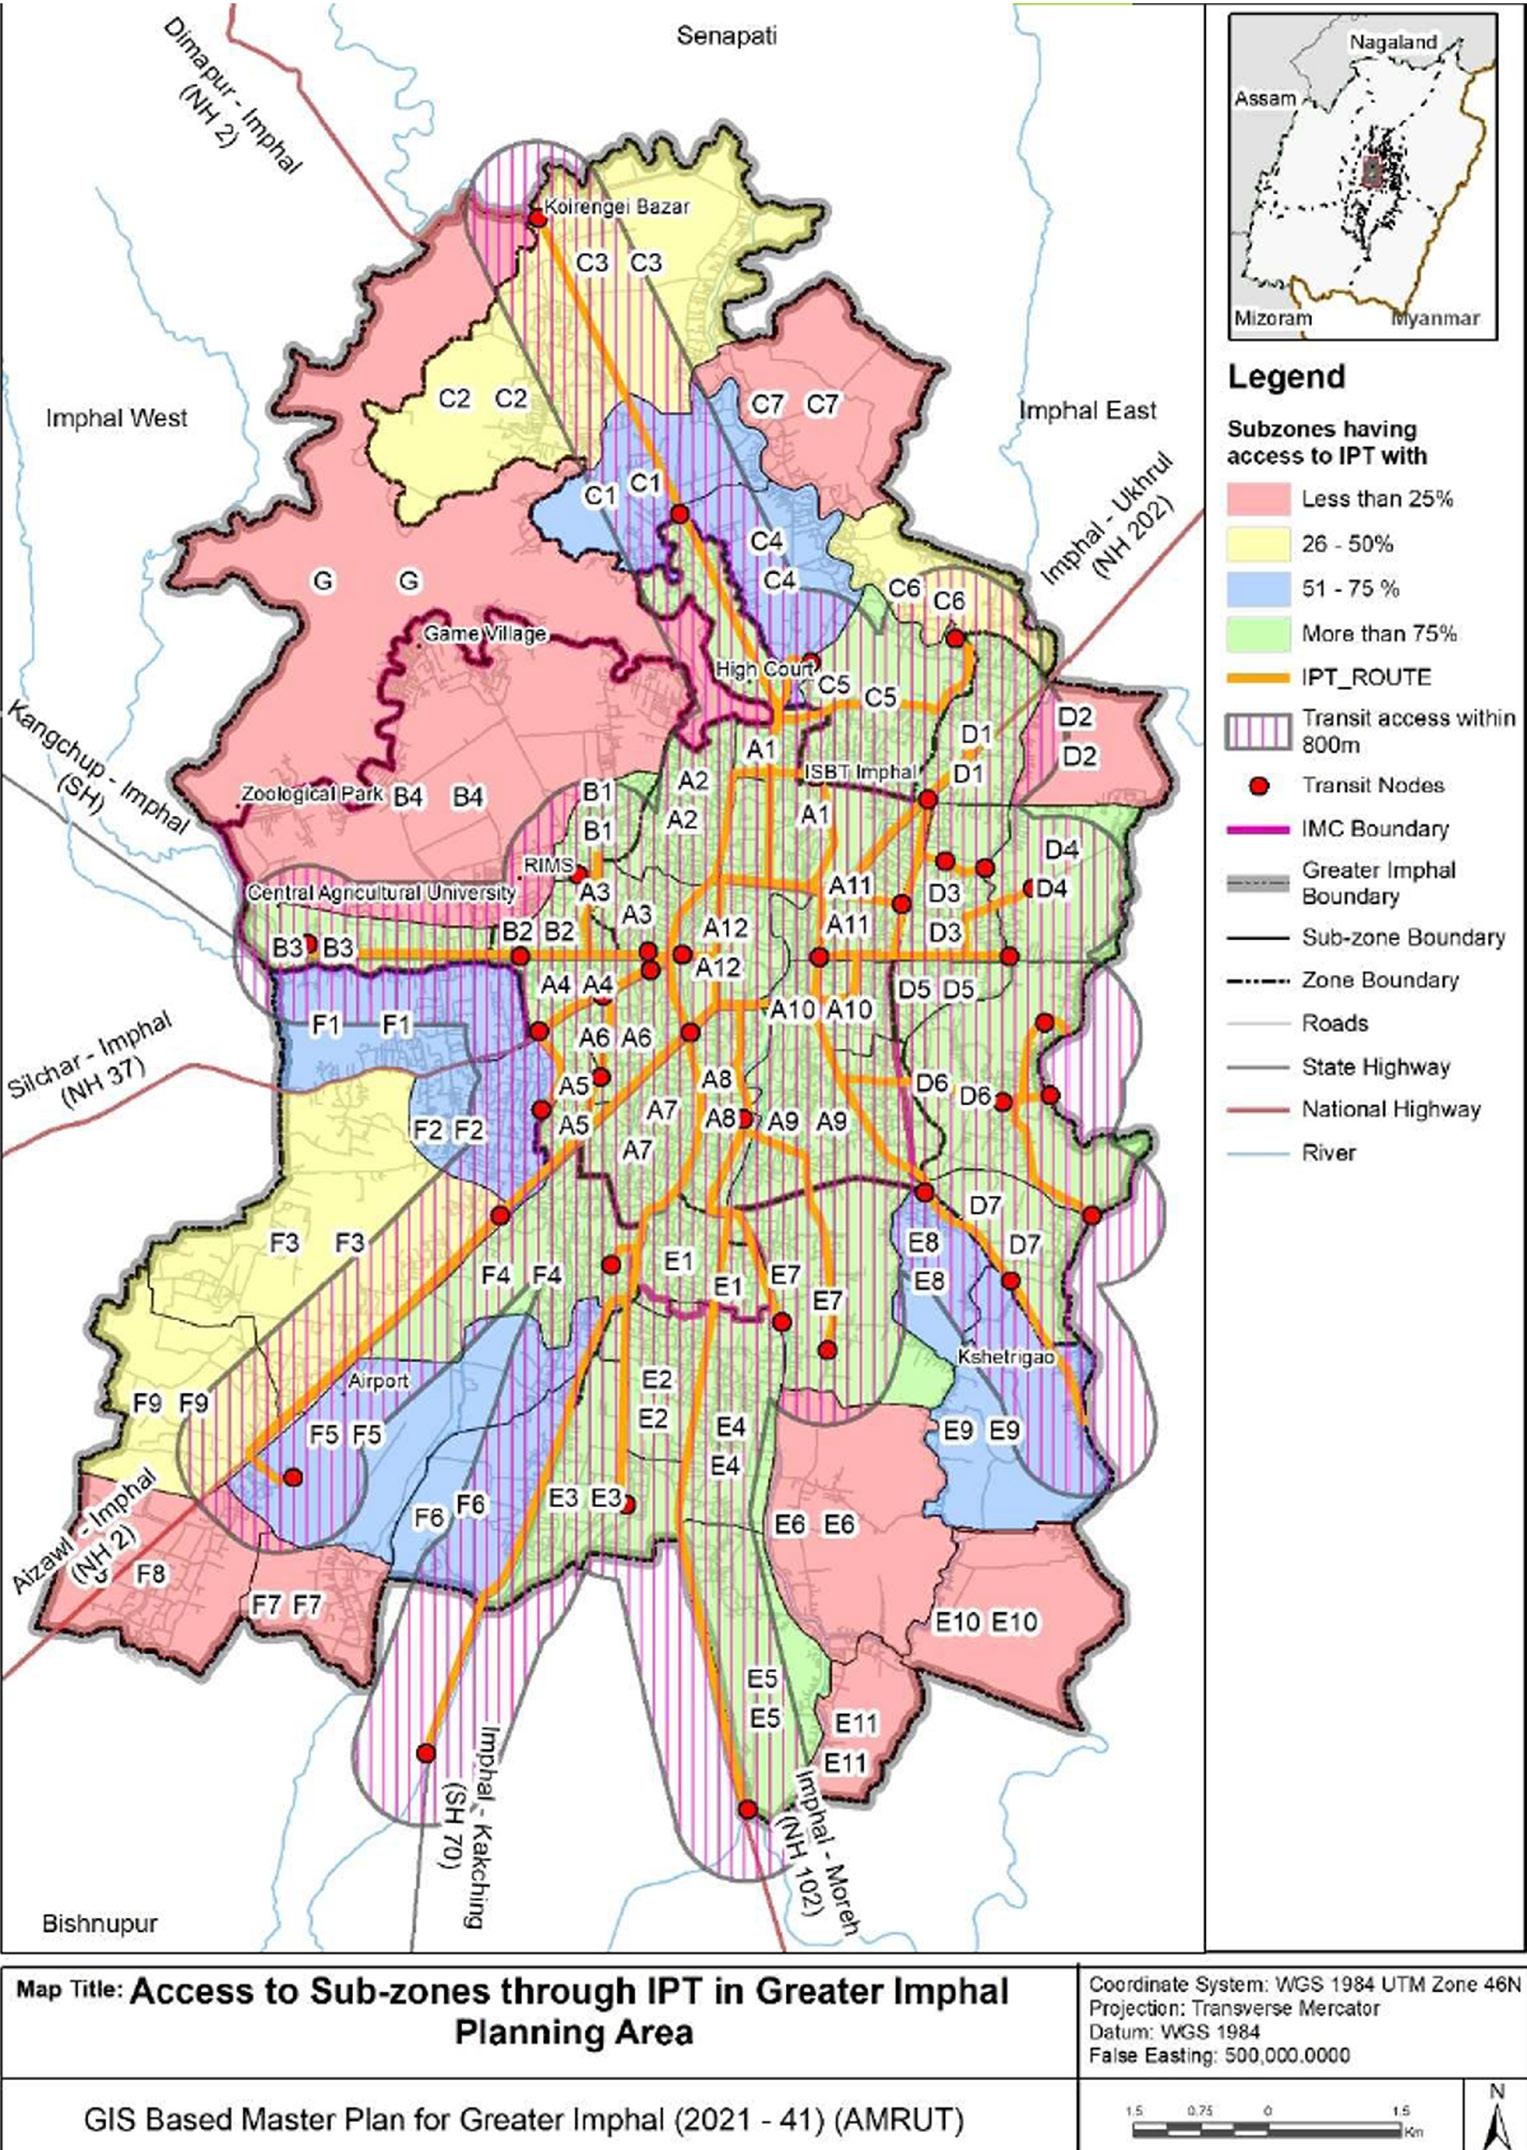
2. Analyzing spatial data and perform geo-spatial analysis to support decisionmaking processes.
3. Preparing and presenting reports, maps, and other visualizations to communicate geo-spatial information to stakeholders.
INTERNSHIP WORK
INTERNSHIP WORK
Workshops & Certifications
04
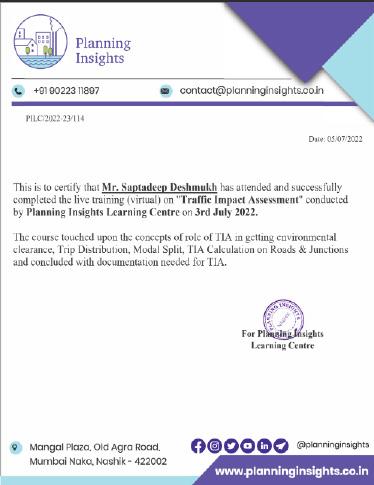
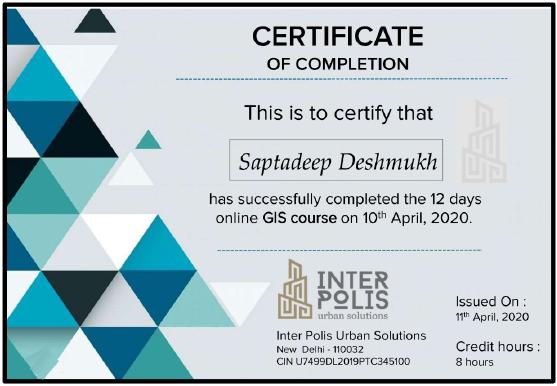
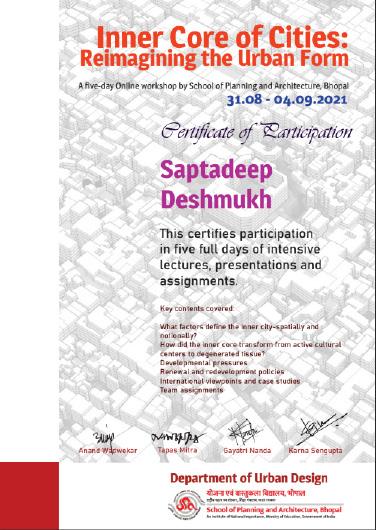
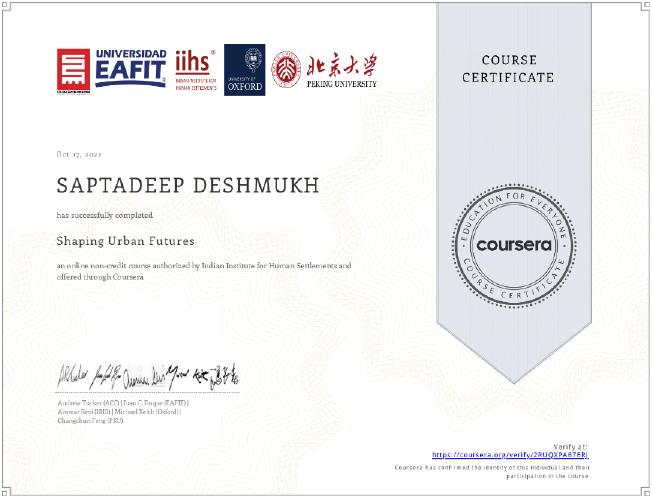
WORKSHOPS AND CERTIFICATIONS


WORKSHOPS AND CERTIFICATIONS