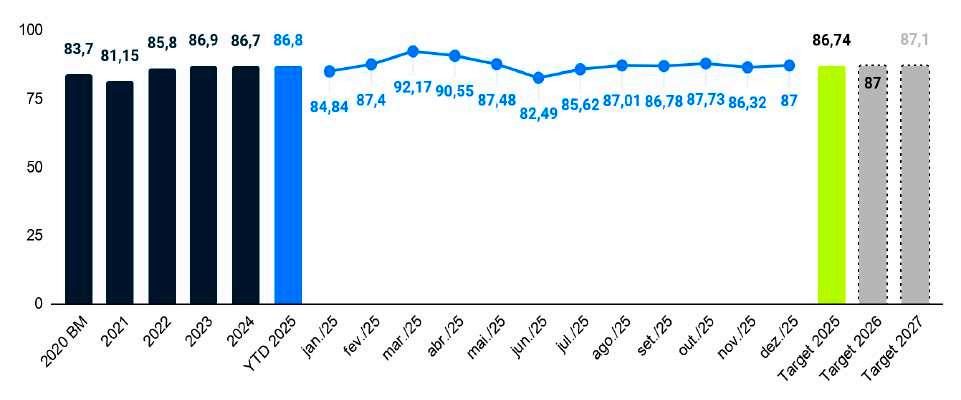
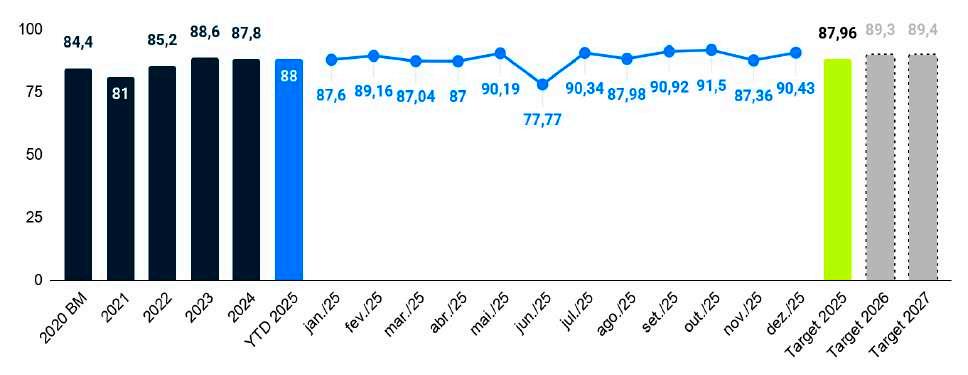
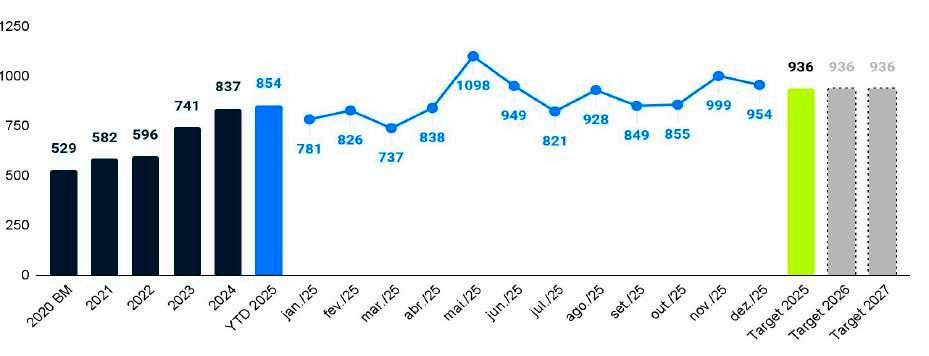
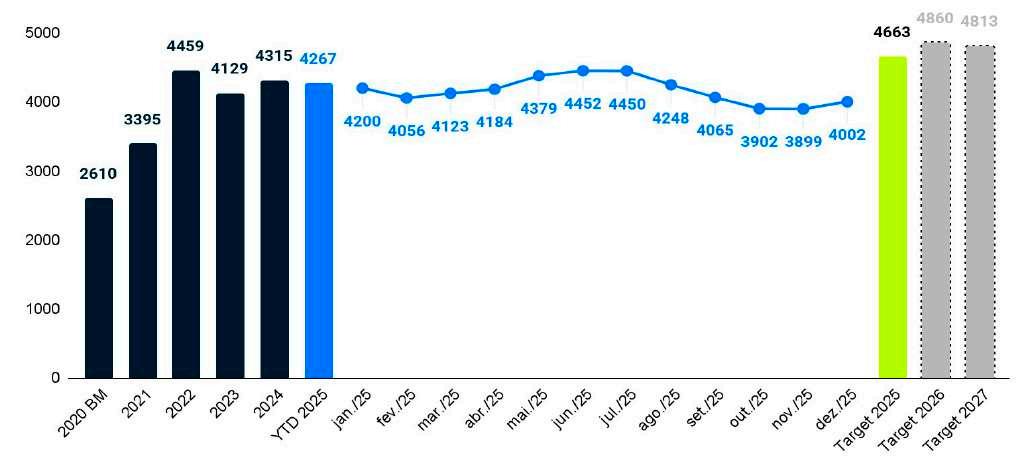
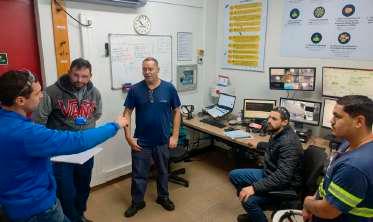
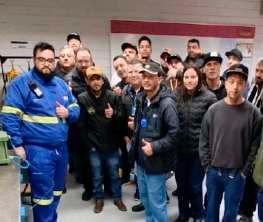
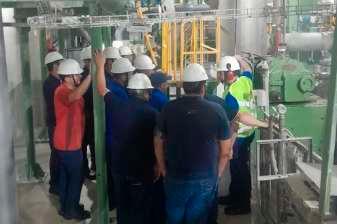
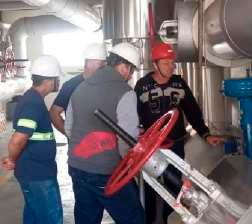
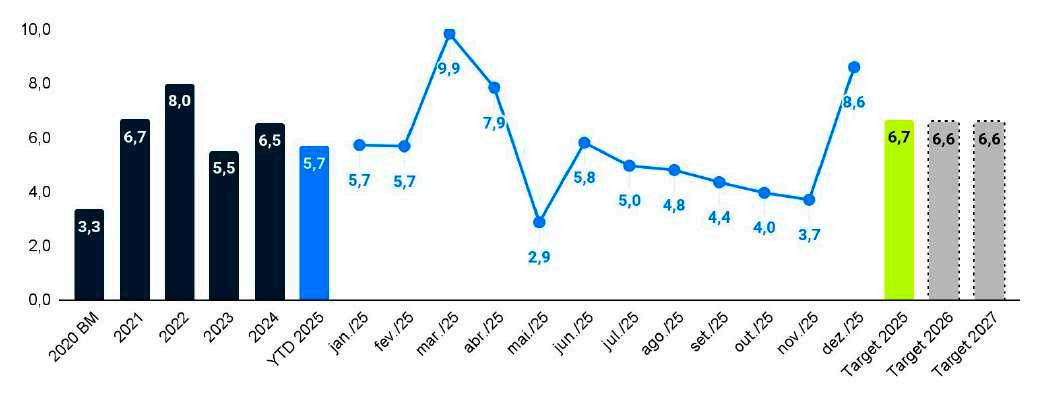
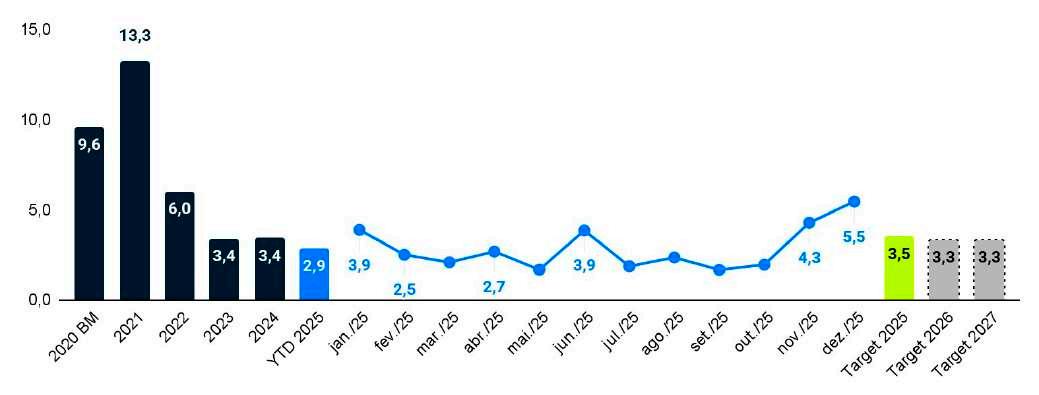
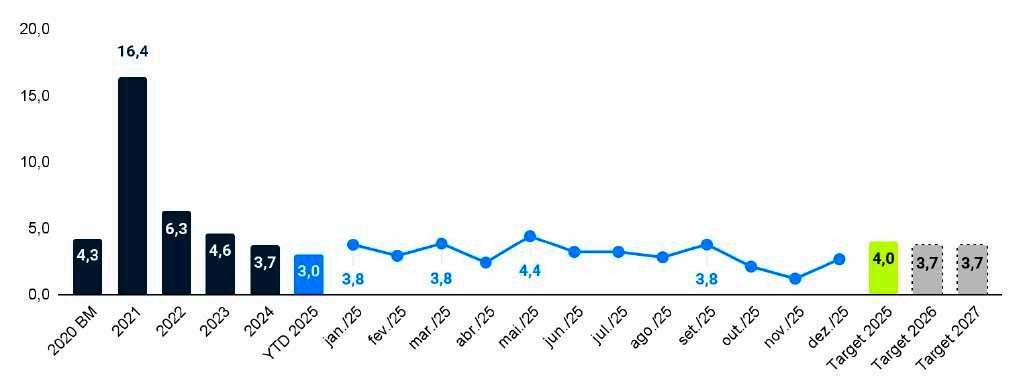
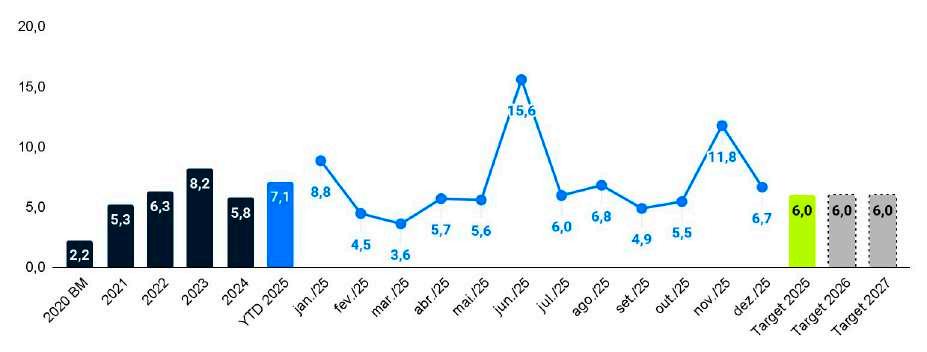
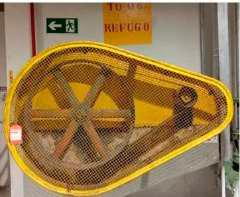
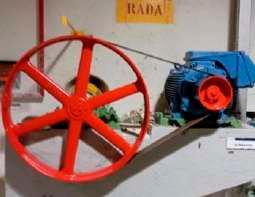
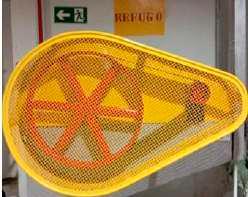
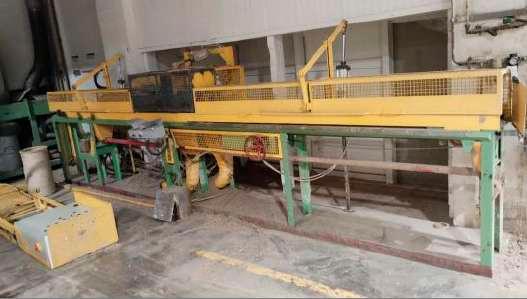
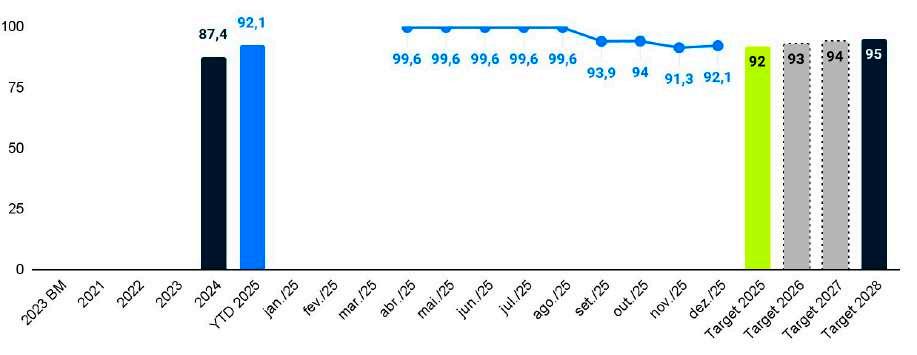
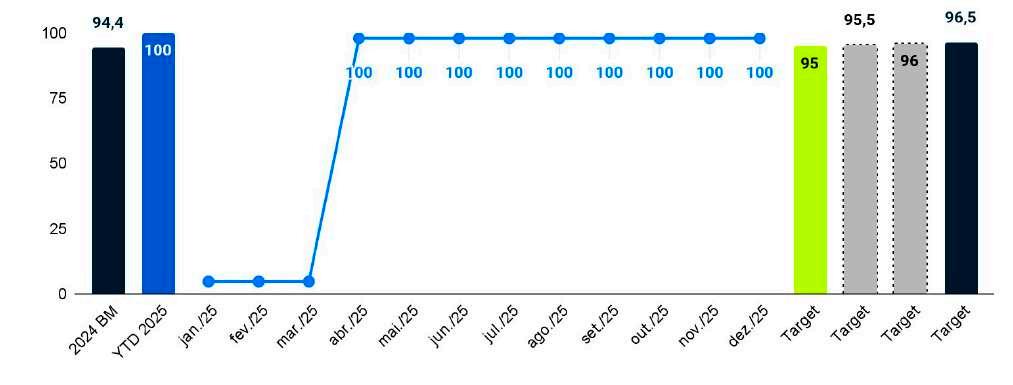
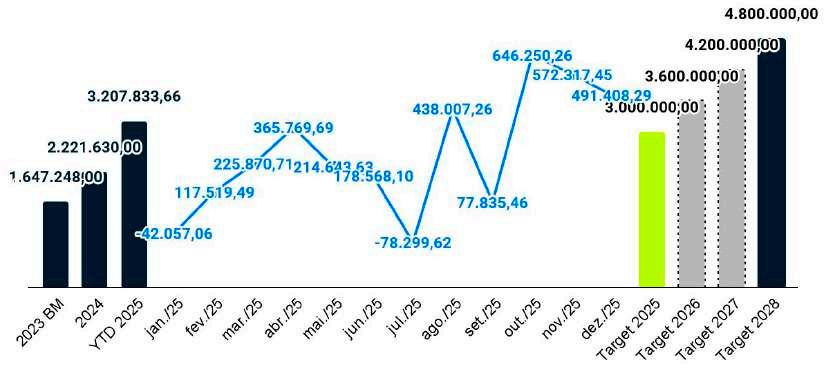
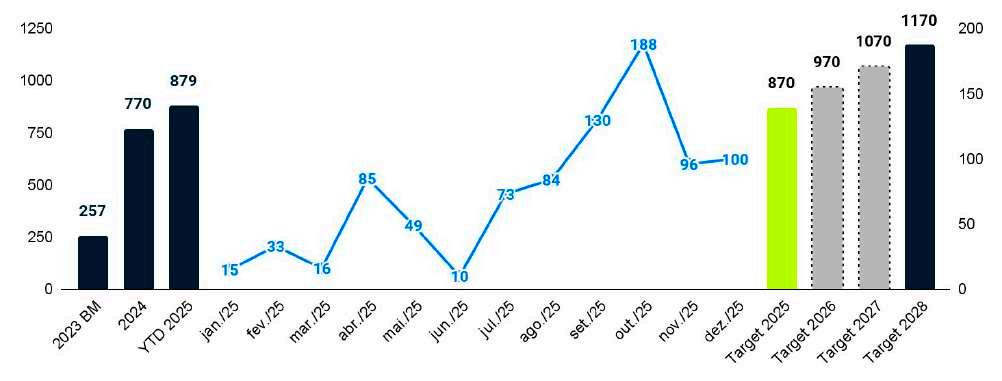
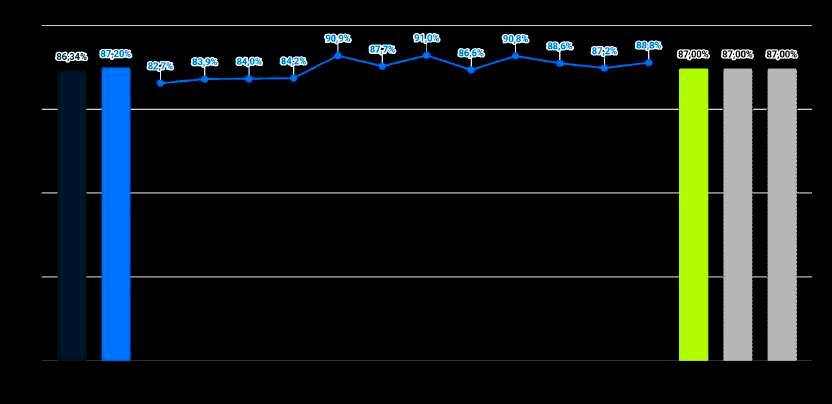
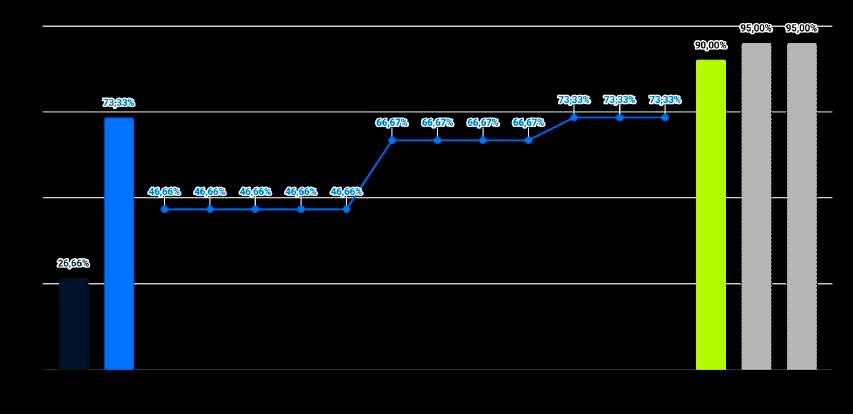
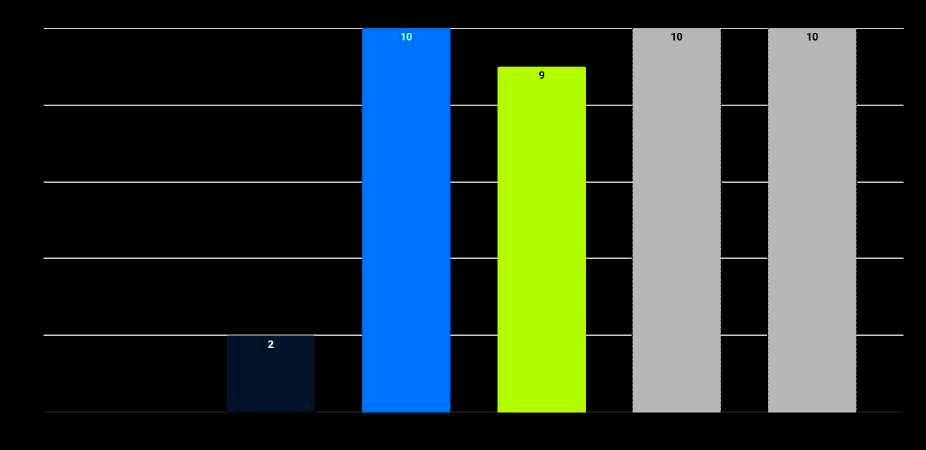
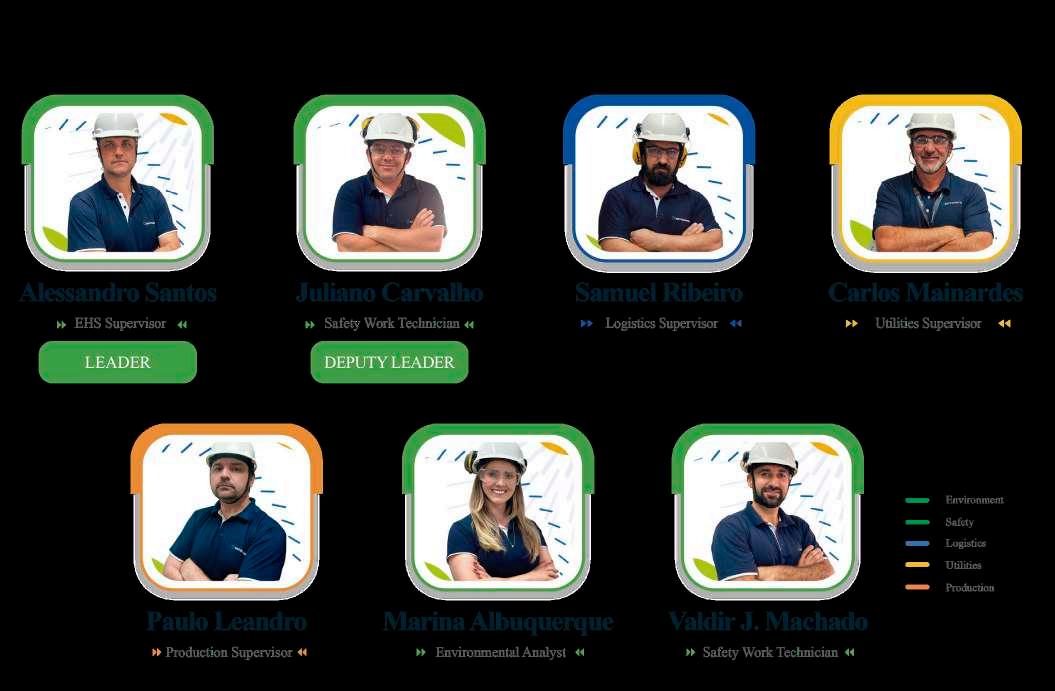
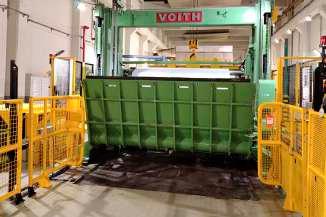
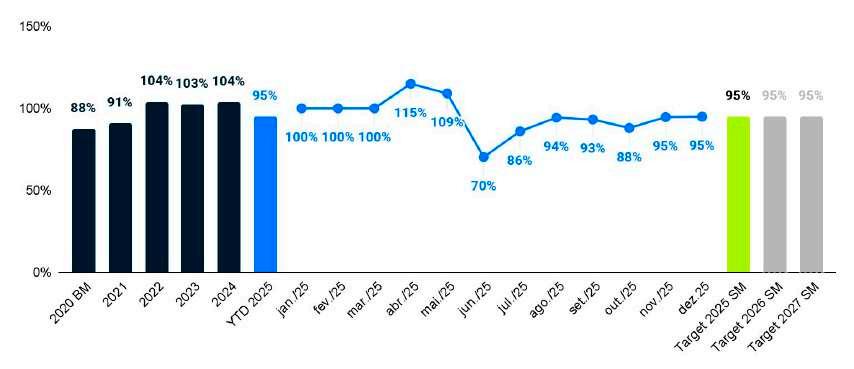
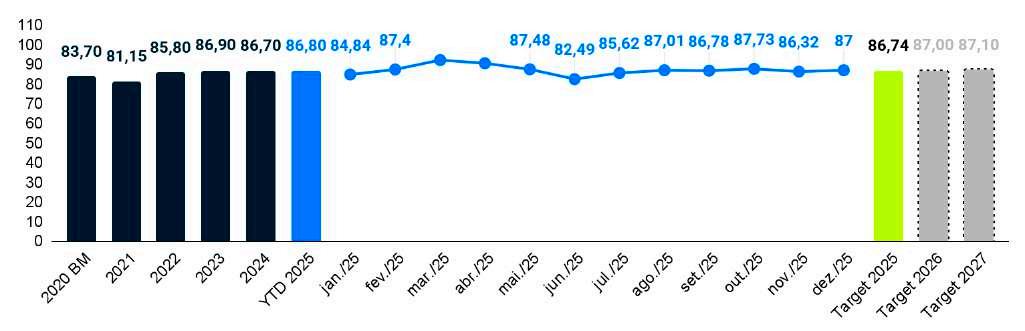
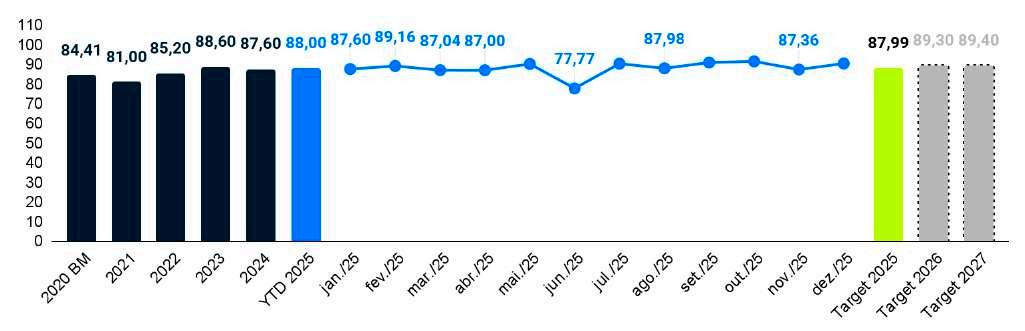
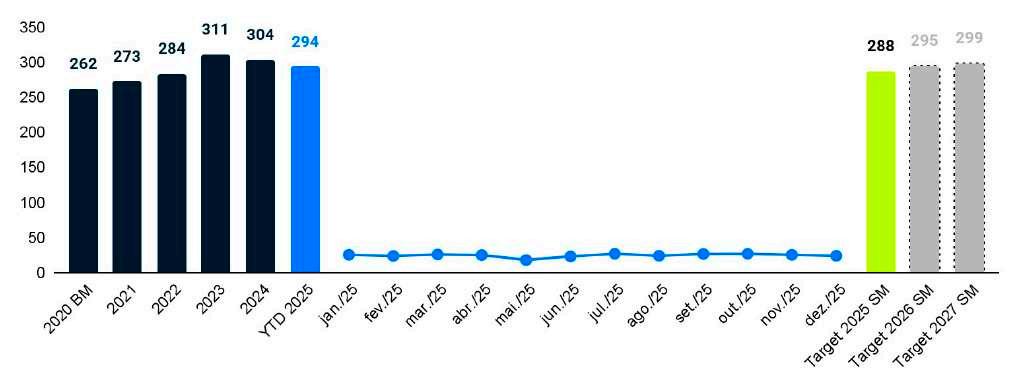
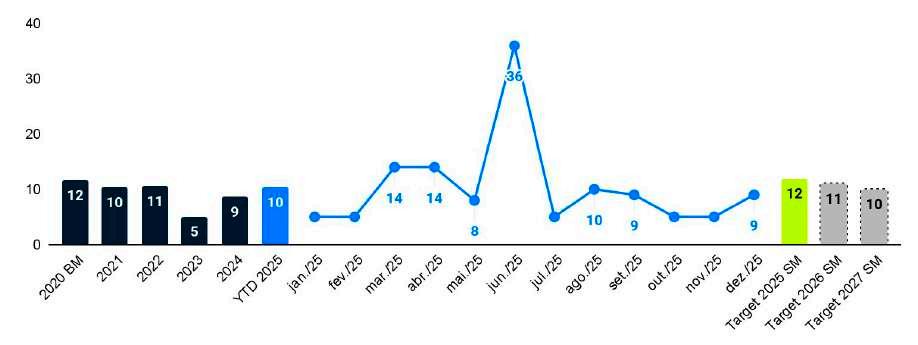
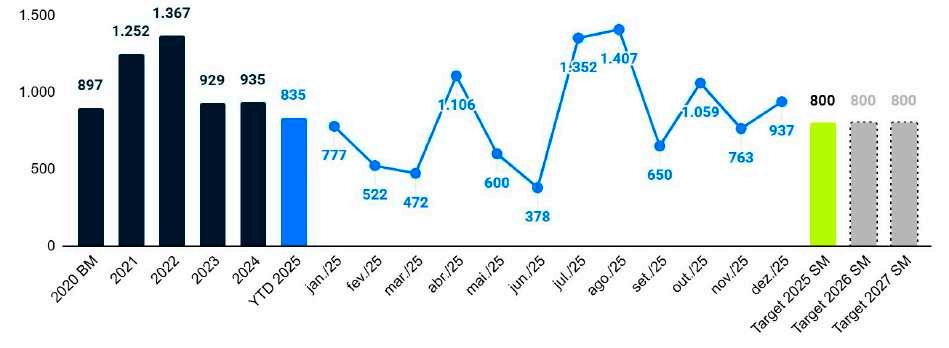
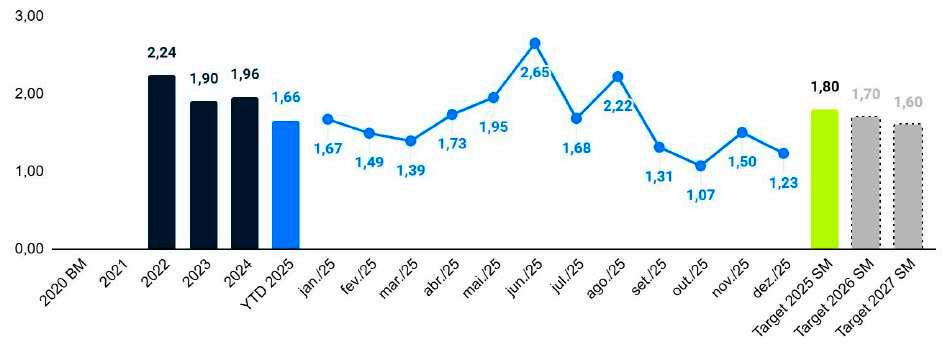
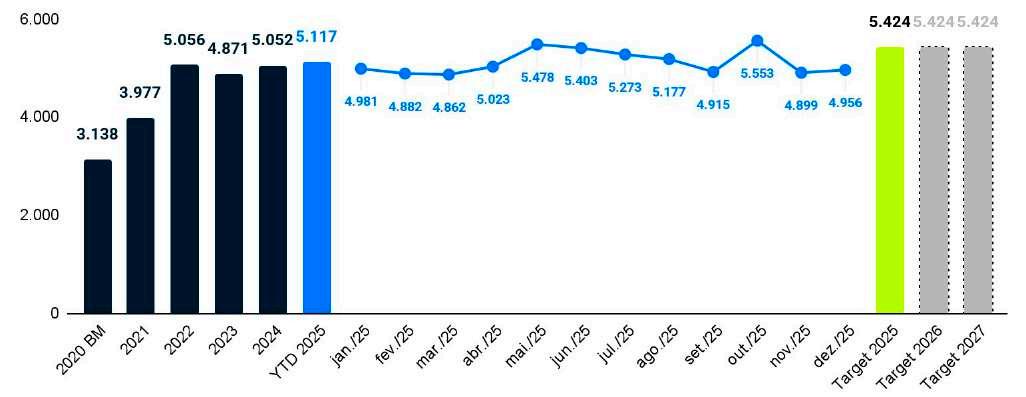
It is with great pleasure that we submit our Activity Book to the Japan Institute of Plant Maintenance. This document tells our story and reinforces Santa Maria Papéis’ strong commitment to Operational Excellence and Continuous Improvement, continuously striving to enhance our processes and elevate our performance to international standards of quality and productivity.
My professional career began at Santa Maria 25 years ago. I started my journey as a Trader in 1999 and, over the years, I have held several positions, including Export Manager, Sales Manager, Sales Executive, and Sales Director, until assuming my current role as Business Unit Director for Paper. In this position, I have played a key role in the development of new leaders and in strengthening the management team’s capabilities, ensuring a firm and consistent approach to value creation for Santa Maria.
In addition, I have been deeply engaged in improving CAPEX management, with a strong focus on combating equipment and machinery obsolescence, as well as fostering innovation within our product portfolio. Through these initiatives, we aim to expand our presence in new markets while improving the company’s cash generation and EBITDA.
I would like to conclude this letter by inviting the Professors to conduct the evaluation of the implementation of the TPM methodology at our paper mill, located in Guarapuava, Paraná, Brazil. Our team is fully engaged and prepared to share the progress achieved, as well as the challenges faced throughout this journey.
We would be honored by the presence of the JIPM Professors at our facility and look forward to welcoming you and sharing our progress.
Sincerely,
Mario Cesar Sterza
Paper
Unit Head
mario.sterza@santamaria.ind.br
Evandro
Meireles da Costa
Continuous
Improvement Supervisor
evandro.costa@santamaria.ind.br
Company and Plant Outline
01 03
TPM Organizations and Activities
Pág. 07
05
Autonomous Maintenance Activities
TPM Policies and Objectives
02 04
Focused Improvement Activities
06
Planned Maintenance Activities
Pág. 35 Pág. 85 Pág. 26 Pág. 49
116
Quality Maintenance Activities
Education and Training
Pág. 152
Early Management Activities
Pág. 186
Safety, Health and Environment
Pág. 217
TPM Office
Pág. 257
Pág. 289
TPM Effect and Evaluation on KPIs
Pág. 332
GLOSSARY
ACA Accidents with Absenteeism
ADM Administrative
AG Autonomous Groups
AP12 Equipment that enables all paper losses generated in the machines to be reused
APIR Preliminary Risk Analysis
ASA Accidents without Absenteeism
BSC Balanced Scorecard
BU Business Unit
CAD Shareholders and Board Committee
CI Continuos Improvement
CID Incident and Deviation Report
DNPBS New Paper Development
EBITDA Earnings Before Interest, Taxes, Depreciation and Amortization
ECRS Eliminate, Contain, Reduce, Simplify
EIA Electrical, Instrumentation and Automation Maintenance
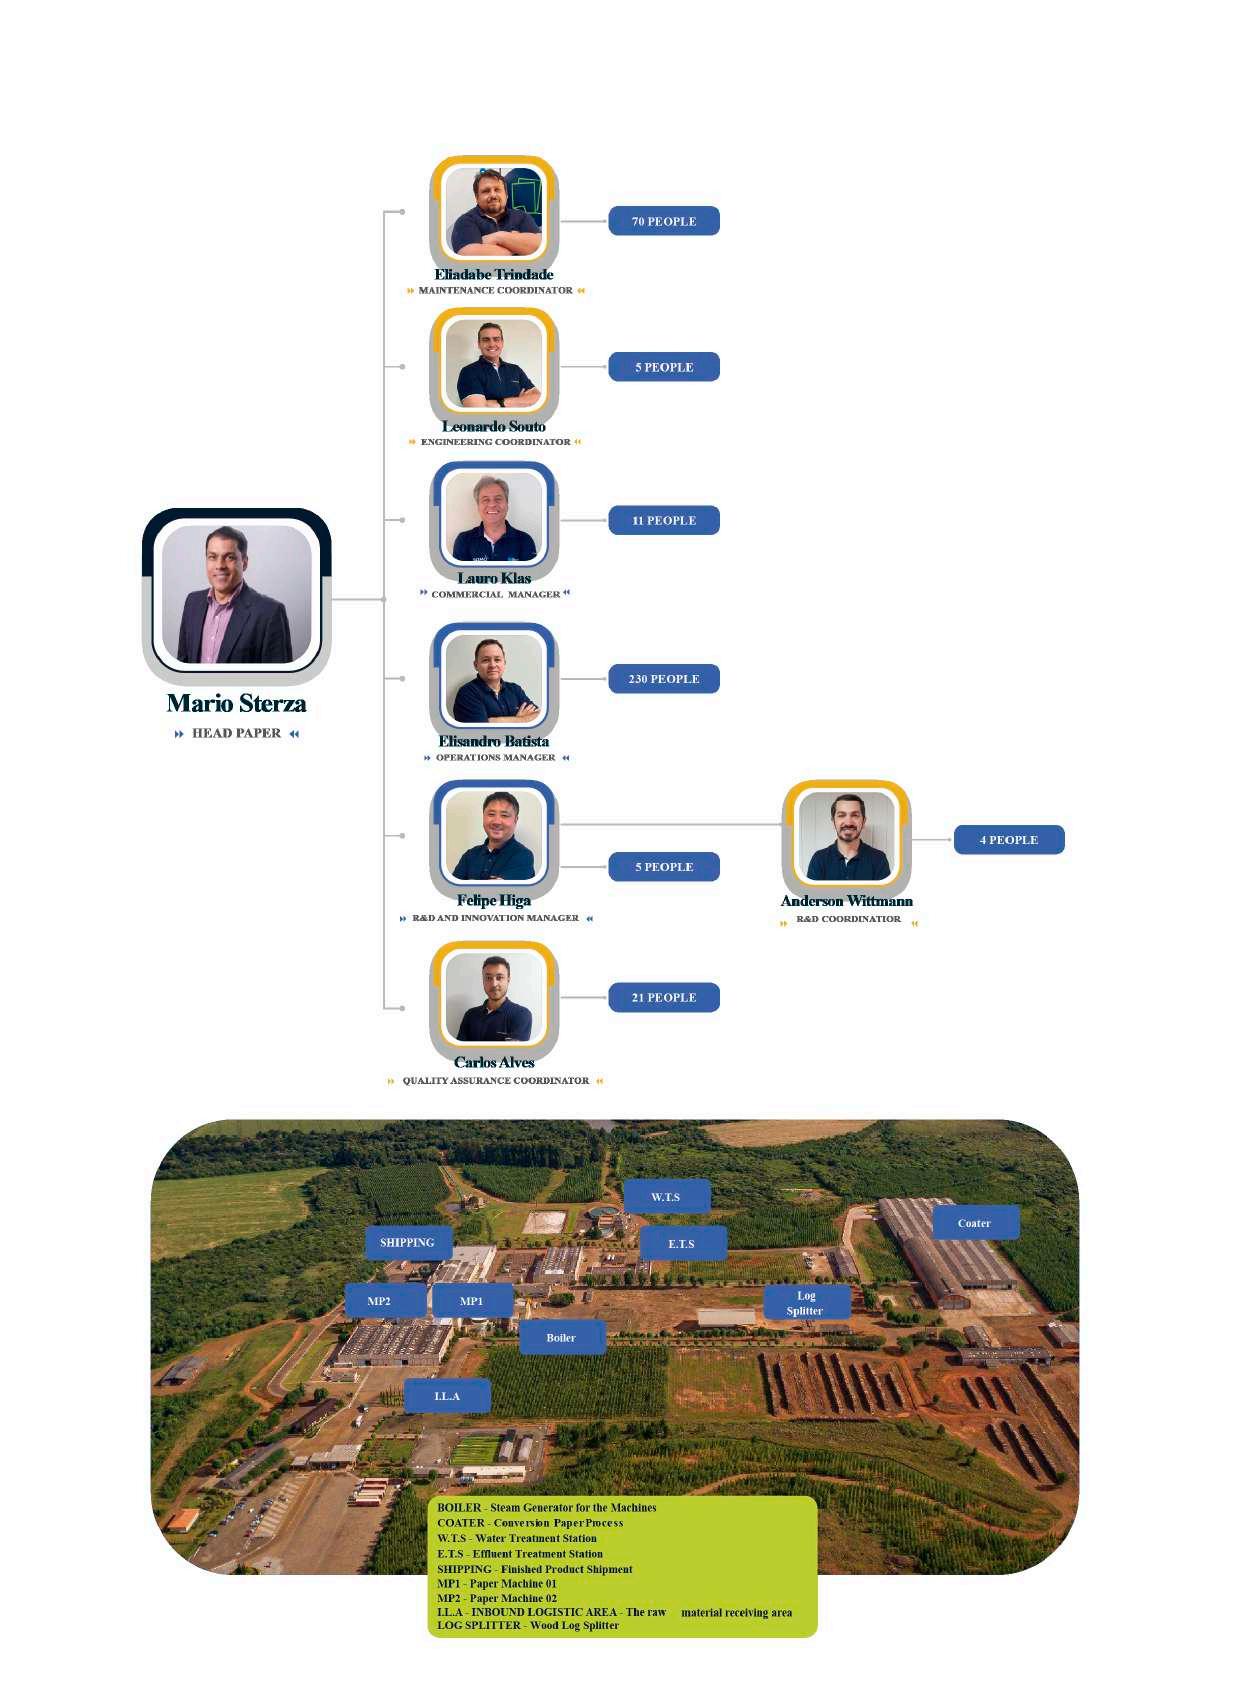
ETS Effluent Treatment Station
FM Outsourced Maintenance Team
FSC Forest Stewardship Council
FS Contamination Sources
GMD Expense Matrix Management
GMP Good Manufacturing Practices
HEAD Business Director Title
ILA Inbound Logistic Area – The raw material receiving area
ITR Work Instruction
IVP Loss Valuation Index
LDA Hard to Access Location
MFC Microfibrillated Cellulose
MH Skills Matrix
MP1 Paper Machine 1
MP2 Paper Machine 2
OEE Overall Equipment Effectiveness
OPE Overall Plant Effectiveness
OPL One-Point Lesson
PCCM Maintenance Planning and Control
PCP Production Planning & Control
PDI Individual Development Plan
PEQ Equipment Shutdown
PG General Shutdown
PP Scheduled Shutdown
P&D Research and Development
RC Purchase Requisition
REB2 Rewinder 2
ROSSJET Paper Machine Cleaning System
RU Moisture Resistance
SAMA Santa Maria Paper and Pulp Company
SAP Project Opening System
SCM Supply Chain Management
SHIPPING Finished Product Shipment
S&OP Sales and Operations Planning
TAC Conduct Adjustment Agreement
TEP Project Closing Term
TPM Total Productive Maintenance
VALMET Automation Service Provider
W.T.S Water Treatment Station
GETTING TO KNOW BRAZIL
Official Name: Federative Republic of Brazil
Capital: Brasília
Population: Approximately 214 million inhabitants
Official Language: Portuguese
Area: 8.5 million km² (the fifth-largest country in the world)
MAIN ECONOMIC SECTORS:
GDP: Brazil has one of the largest economies in the world, with a Gross Domestic Product (GDP) of approximately USD 2 trillion.
Agribusiness: One of the world’s largest producers and exporters of soybeans, coffee, beef, and orange juice.
Industry: Key industrial sectors include automotive manufacturing, aeronautics, petrochemicals, steelmaking, and the manufacturing of machinery and equipment.
Services: A broad services sector encompassing banking, telecommunications, information technology, and tourism.
INDUSTRIAL INFRASTRUCTURE:
Industrial Parks: Brazil has several important industrial hubs, including São Paulo, Minas Gerais, Rio de Janeiro, and the southern region of the country.
Energy: A significant portion of Brazil’s energy supply comes from renewable sources, particularly hydropower. The country also continues to invest in wind and solar energy.
Transportation: An extensive network of highways, railways, and ports, with ongoing investments aimed at modernization and expansion.
CONCLUSION
CULTURE AND SOCIETY:
Cultural Diversity: Brazil is known for its rich cultural diversity, resulting from the blending of multiple ethnic groups, including Indigenous peoples, Africans, Europeans, and Asians.
Organizational Culture: The business environment in Brazil places strong value on personal relationships and trust.
Brazil, with its vast territorial extension and its cultural and economic diversity, presents a complex yet opportunity-rich environment for the development and implementation of Total Productive Maintenance (TPM) practices. With a robust and continuously evolving industrial market, the country represents fertile ground for initiatives aimed at increasing industrial eficiency and productivity.
OUR 62-YEAR JOURNEY
WHEN WE BEGAN
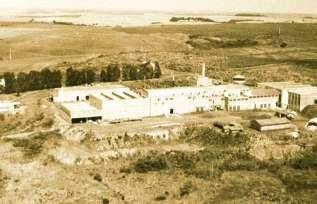
The company began its operations on March 31, 1962, in the Guarapuava region, located in the central-southern area of the state of Paraná. Initially, the company operated as a sawmill serving the domestic timber market, and subsequently established a mechanical pulp manufacturing facility.
A PLACE TO MAKE PAPER
The location needed to have a river capable of ensuring the water supply required for production, as well as suficient land to allow for industrial expansion. In January 1972, the site where the mill would be built was identified, located on the banks of the Coutinho River, 23 kilometers from the city of Guarapuava.
A NEW CYCLE OF ACHIEVEMENTS
In the early 1970s, the company began a new cycle development. This transformation started with Reflorestadora São Manoel, which planted its first pine seedlings. It continued with the construction of the São Pedro Mill, whose purpose was to supply the first paper machine of Santa Maria.
PAPER MACHINE I
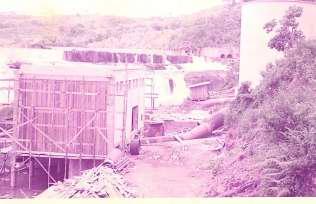
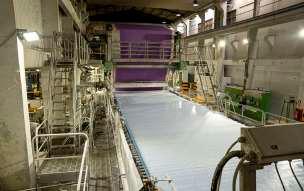
While the establishment of the forest plantations progressed, the construction of the building intended to house the first paper machine advanced at an accelerated pace. This facility later accommodated Paper Machine I, manufactured by Voith.
FROM GUARAPUAVA TO THE WORLD
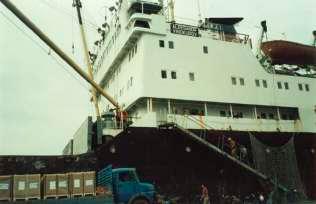
After years of dedicated work, Santa Maria began to gain recognition and market share within the domestic paper industry. In the early 1980s, the company initiated the expansion of its sales worldwide, starting with markets across Europe and the Middle East.
THE FIVE-MILLION-DOLLAR NAPKIN
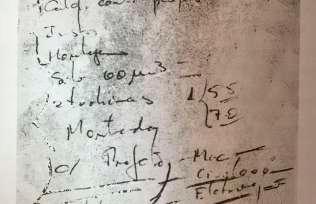
With the objective of generating energy and steam for the paper machines through the use of biomass, the boiler was commissioned shortly before the start-up of Paper Machine II. This project originated from an idea conceived by Manoel Vieira and sketched on a paper napkin.
EXPANDING AGRIBUSINESS
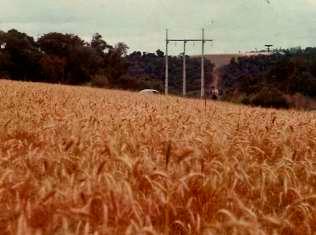
The company decided to diversify its investments and expanded its agricultural activities, which had been carried out on a modest scale since the 1980s. In the early 1990s, the company moved into grain cultivation, acquiring farms to plant soybeans, corn, and wheat. Later, in 2002, a grain silo was constructed to optimize the agricultural operation, with a storage capacity of 36,000 tons.
WOOD PROCESSING INDUSTRY
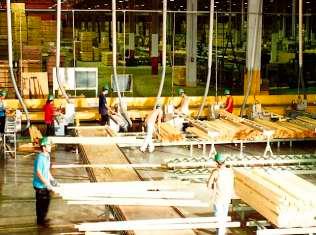
In the early 1990s, the company returned to its origins, from which it had moved away since the start of paper production. This venture revolutionized the concept of sawmilling in Brazil. Shortly after its inauguration, the operation began exporting wood panels and moldings produced from its own reforested areas to customers in the United States and Europe.
GREATER COMMITMENT TO THE ENVIRONMENT
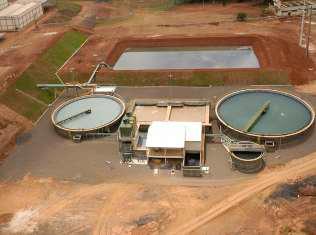
Santa Maria has always valued environmental stewardship, recognizing its importance and anticipating a need that, at the time, was not yet a concern for many. The company invested in the construction of a new Effluent Treatment Plant, a fundamental process for treating all water used in the paper manufacturing process.
THE MOST SUSTAINABLE FARM IN THE COUNTRY
On April 8, Globo Rural magazine recognized Santa Maria’s Três Capões Farm as the most sustainable farm in the country in the annual crops category. The 790-hectare farm earned this award due to its strong administrative management combined with environmental management practices aligned with sustainability principles.
MORE ENERGY TO SUPPORT GROWTH
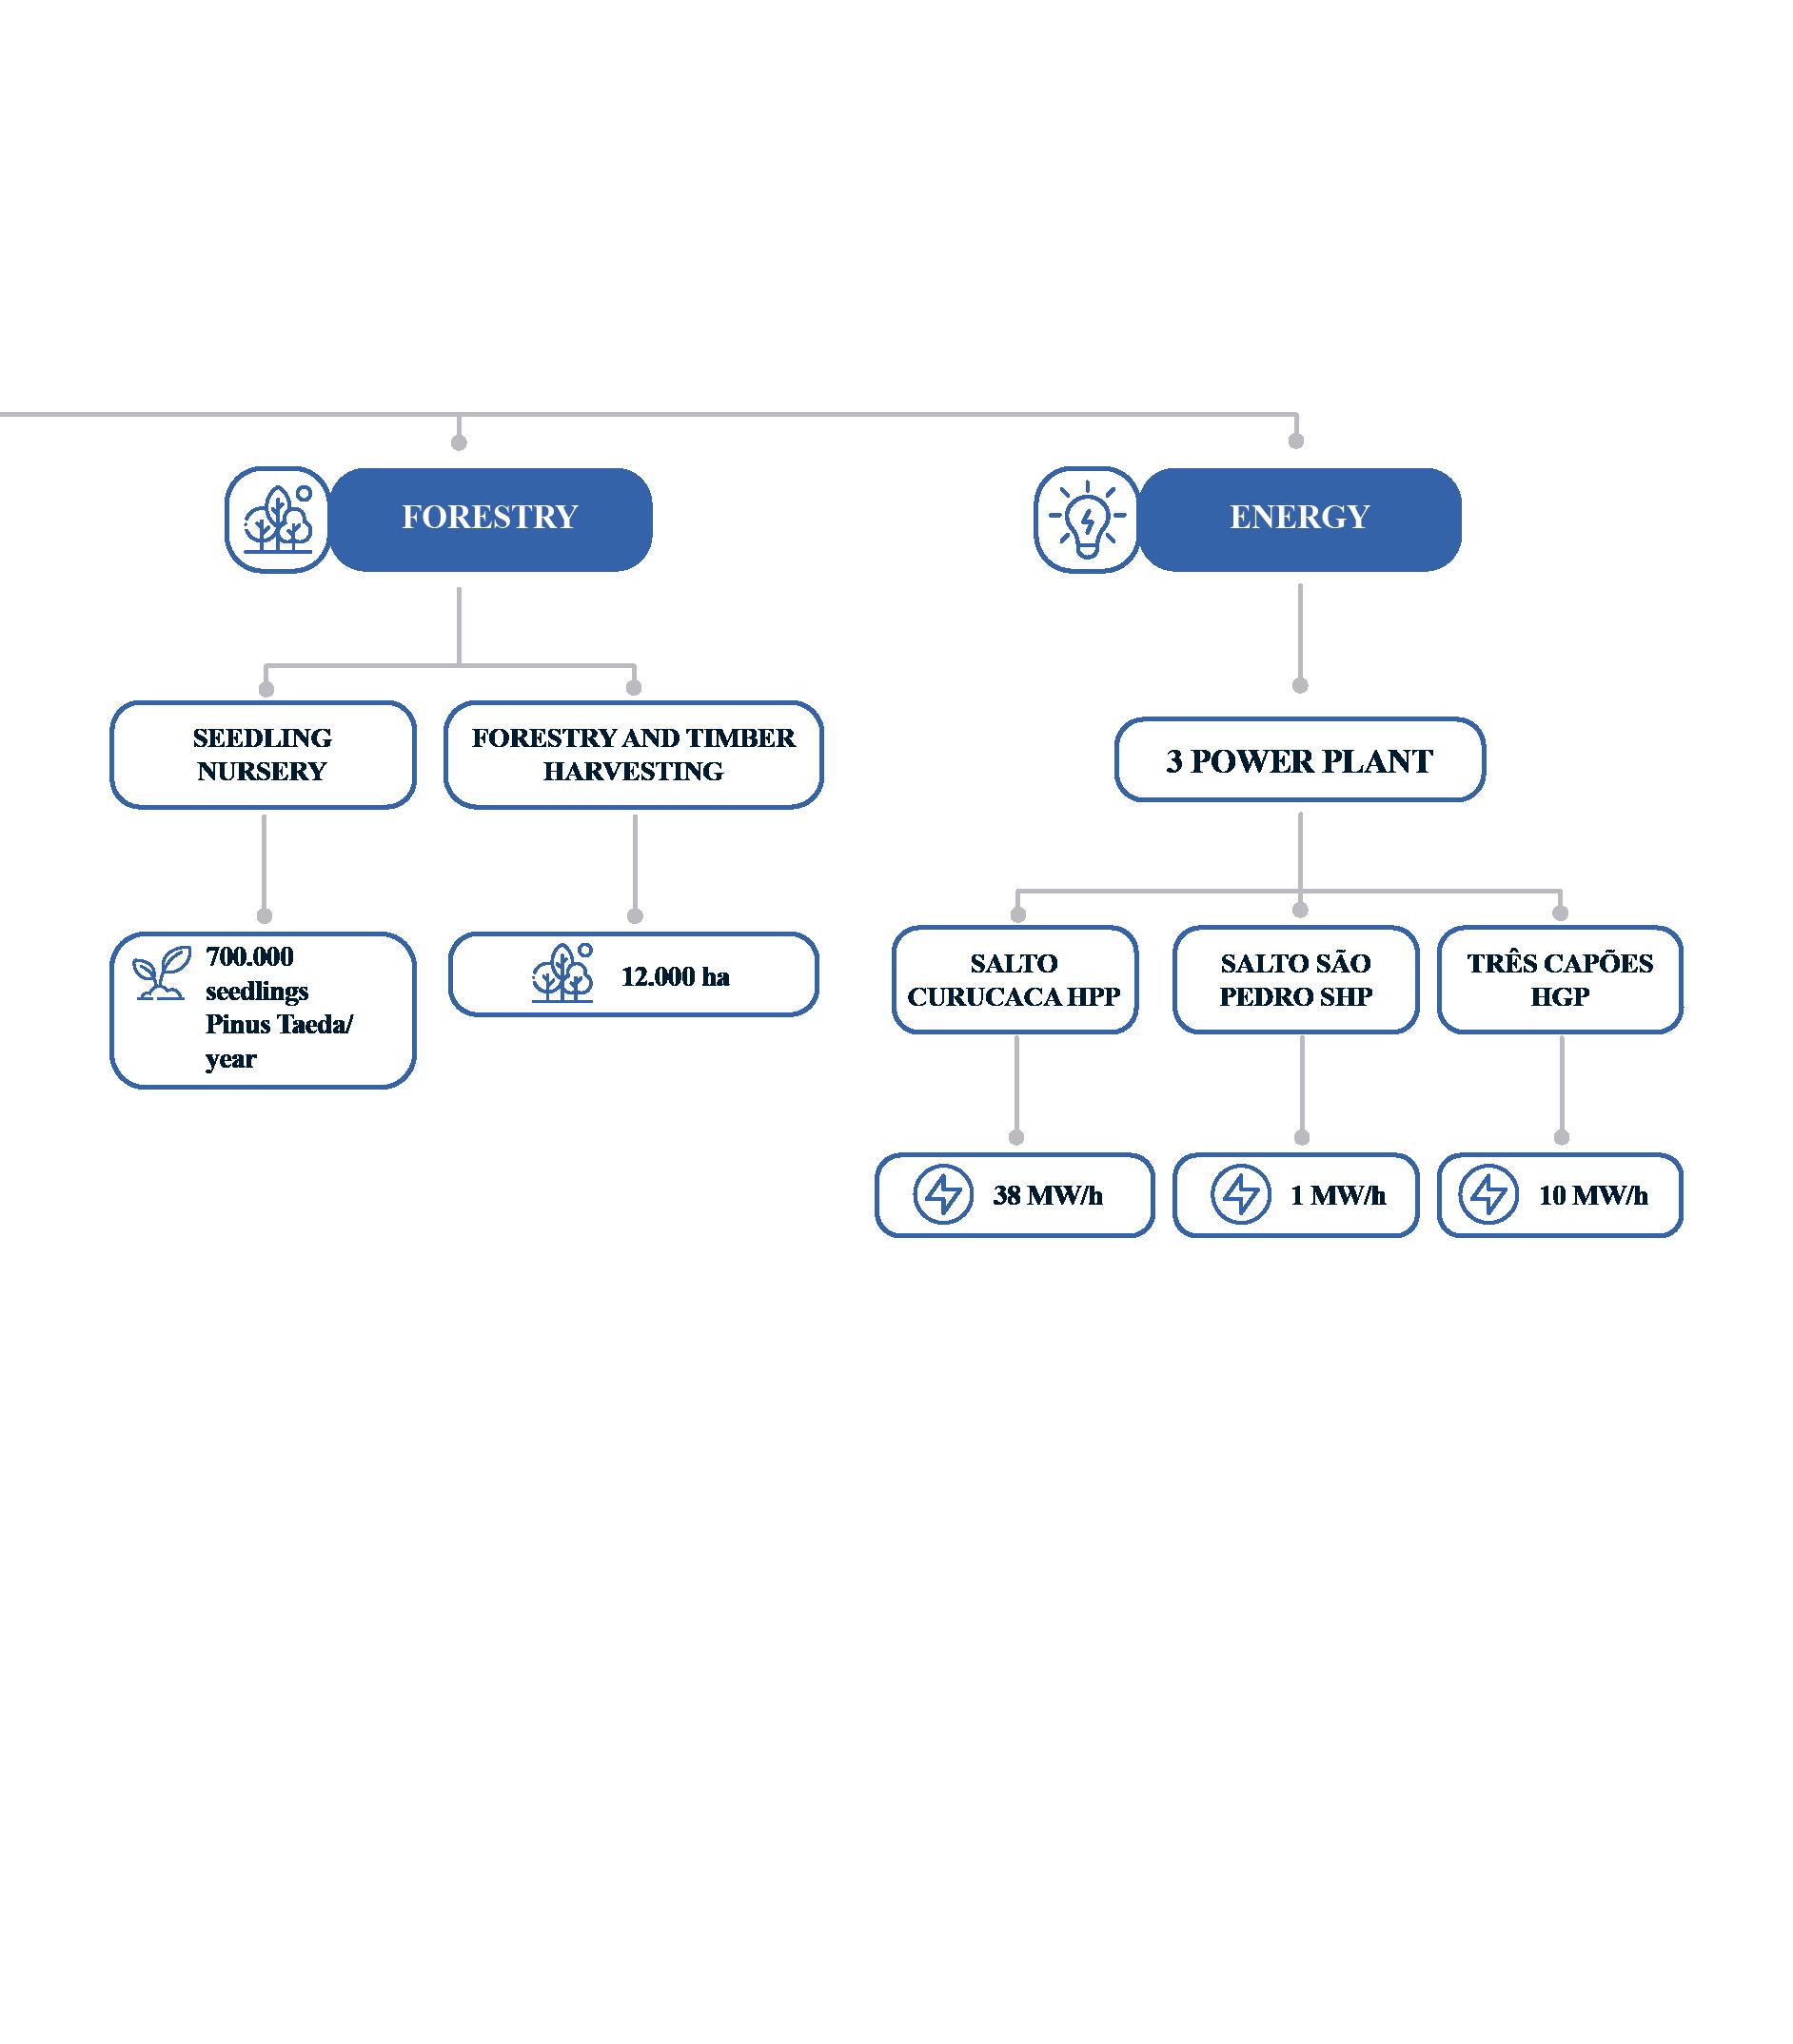
In January 2014, construction began to increase the energy generation capacity of the Curucaca Plant, which previously generated 7.4 MW and was expanded to 37 MW. The project was made possible through a partnership with Cooperativa Agrária and began generating energy in May 2016.
INAUGURATION OF THE TRÊS CAPÕES SMALL HYDROELECTRIC PLANT (SHP)
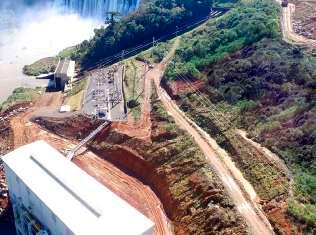
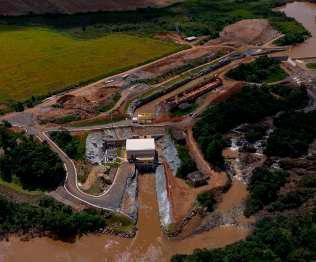
April 25 was a special day for the Santa Maria Group. On this date, the Três Capões Novo Small Hydroelectric Plant (SHP), located on the banks of the Jordão River in Guarapuava, Paraná, was inaugurated. With a total installed capacity of 10 megawatts (MW), the plant has the capacity to supply electricity to approximately 24,000 households.
BUSINESS UNITS 1.3
AGRICULTURE
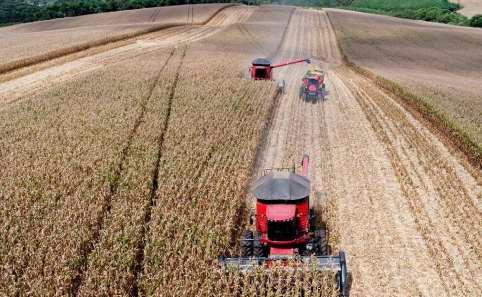
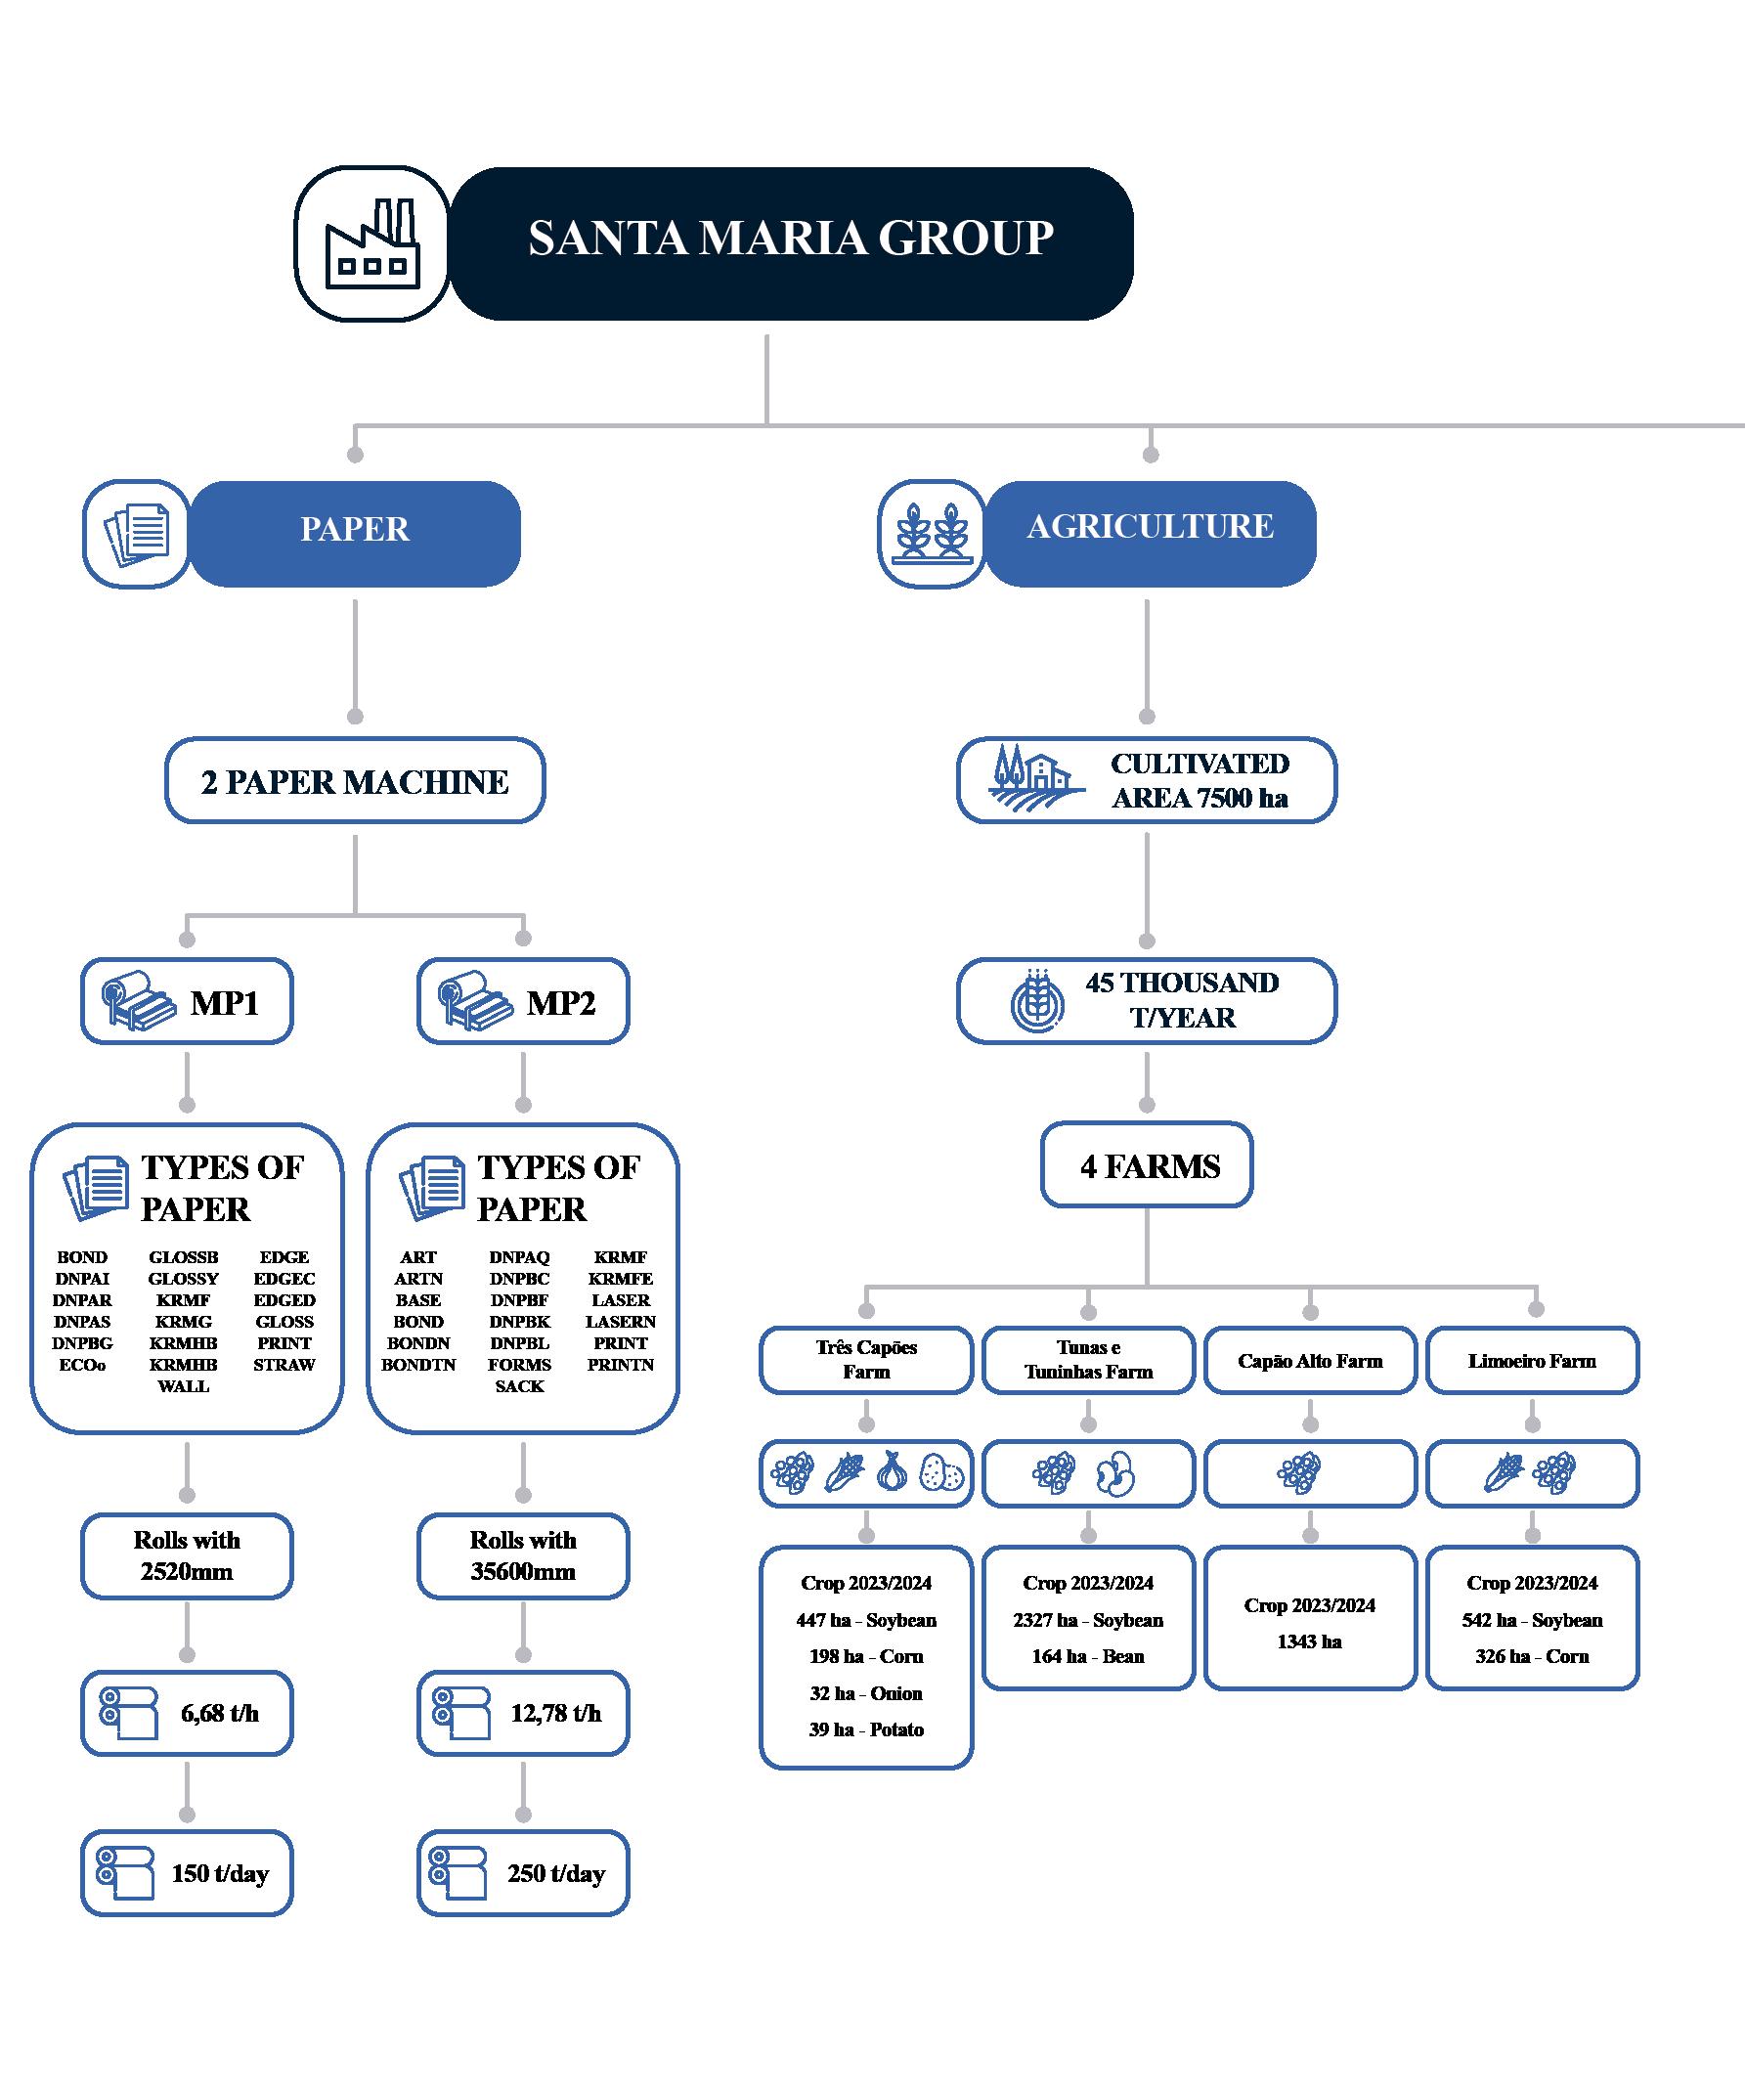
In the agriculture business, Santa Maria operates approximately 5,000 hectares of cultivated land. Across these production units, soybeans, corn, and wheat are grown, with an annual production of approximately 35,000 tons.
FORESTRY OPERATIONS
Its commercial forests comprise more than 12,000 hectares of Pinus taeda and Eucalyptus spp., distributed across several farms within a 100 km radius of the industrial plant, ensuring raw material self-sufficiency.
PAPER
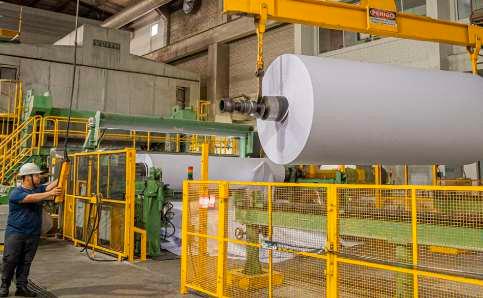
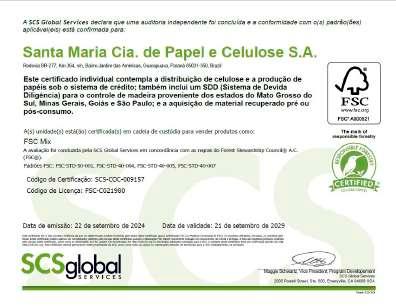
Santa Maria Papel has operated in the paper market for more than 52 years, serving the segments of offset paper, laser paper, white kraft, glassine and translucent papers, sublimation paper, edge banding paper, and wallpaper, all of which are FSC® certified.
ENERGY
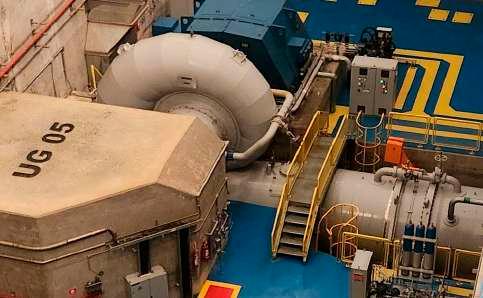
Santa Maria Energia conducts its operations through three hydroelectric facilities: the Salto São Pedro Small Hydroelectric Plant (CGH), located in the municipality of Pinhão; the Salto Curucaca Hydroelectric Power Plant (UHE), located in Guarapuava; and the Três Capões Novo Small Hydroelectric Plant (PCH), also located in Guarapuava.
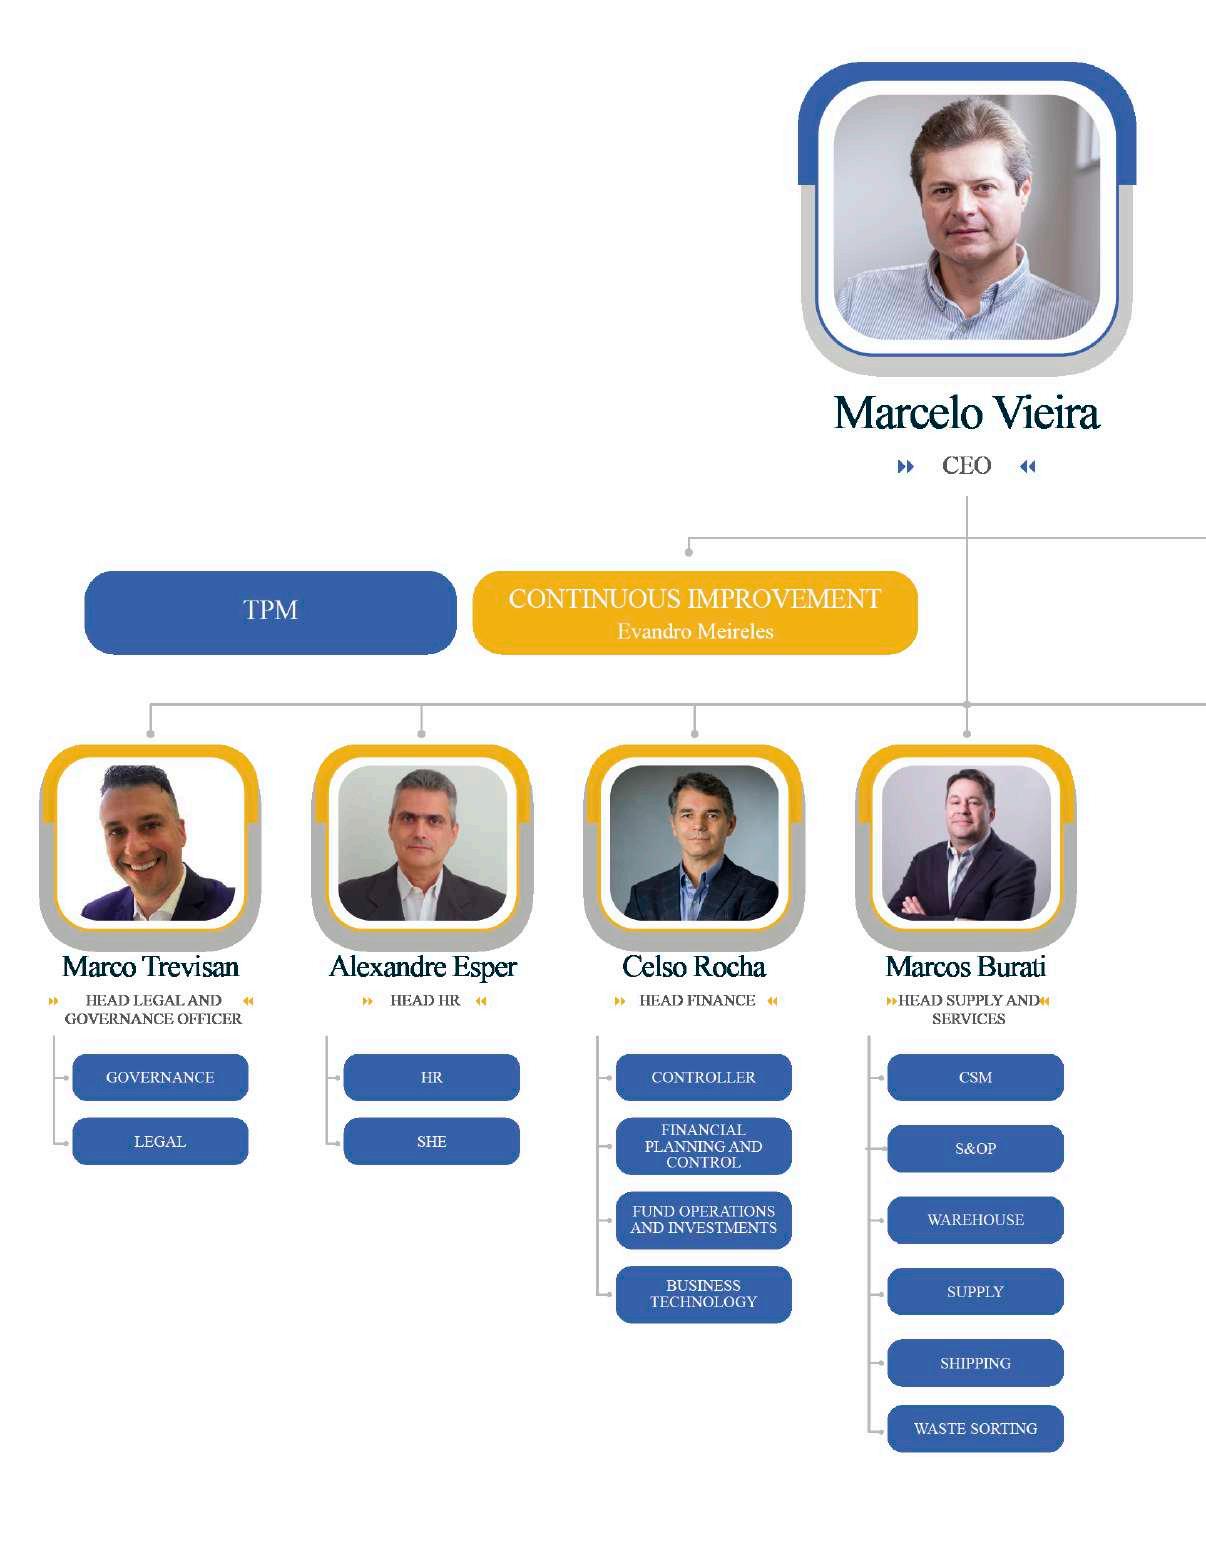
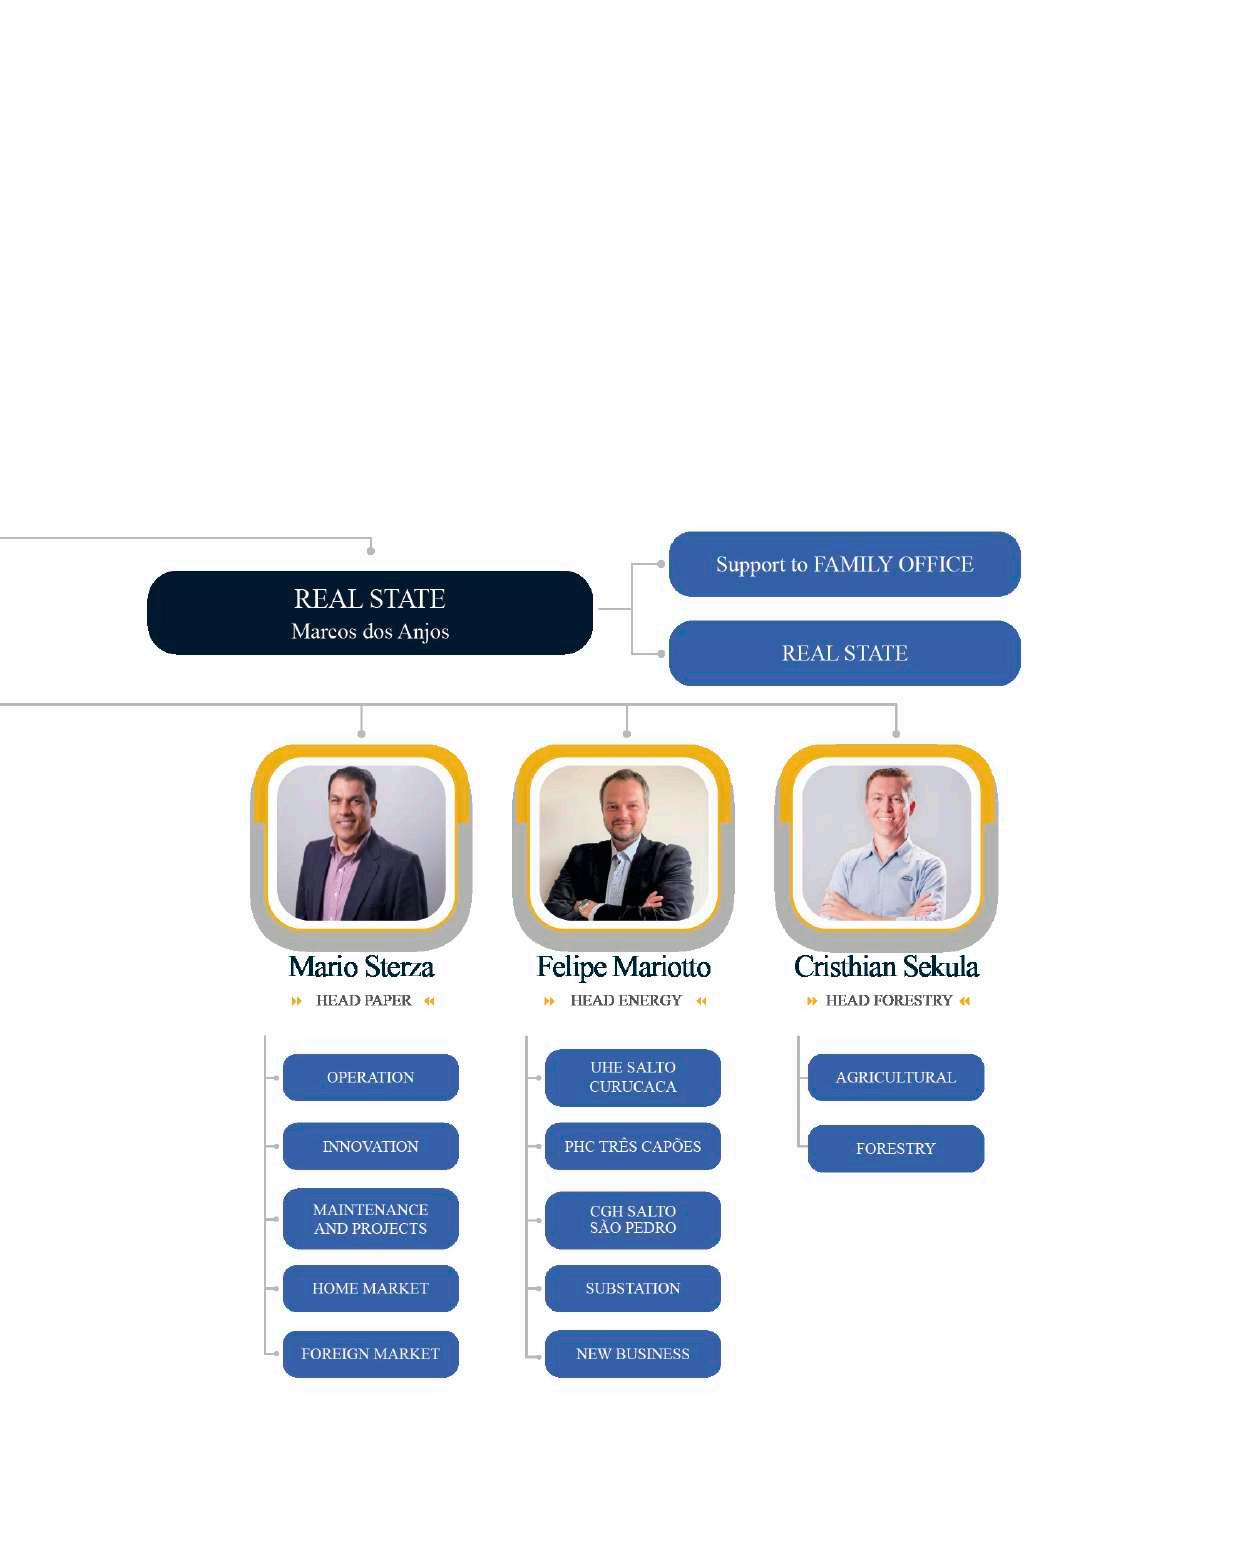
SANTA MARIA ORGANIZATIONAL CHART
BUSINESS AND PRODUCTS
SANTA MARIA - SAMA AND GUARAPUAVA
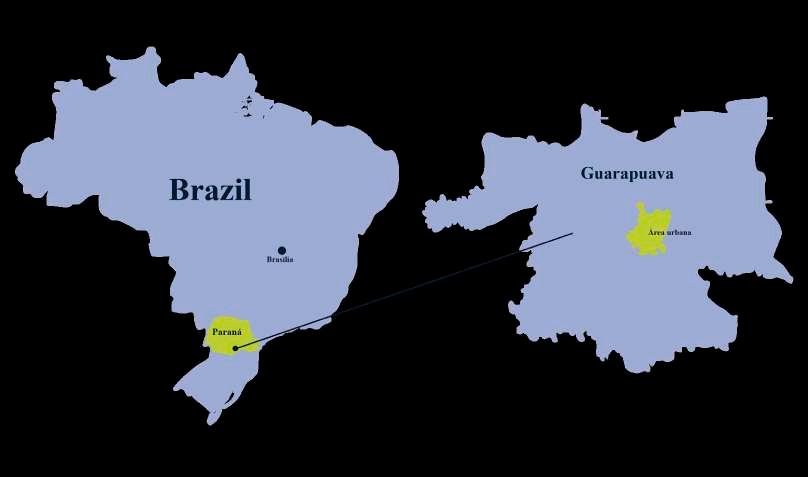
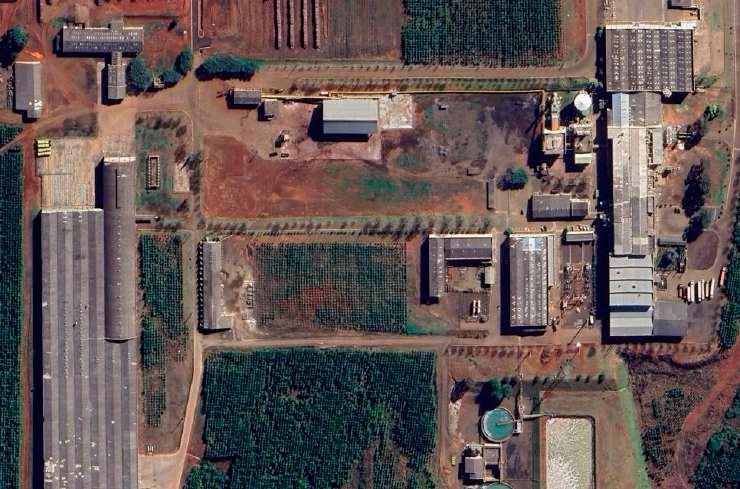
Santa Maria is located in the city of Guarapuava, in the state of Paraná, Brazil. Guarapuava, founded in 1819, is a city in the central-southern region of Paraná, known for its strong agricultural base and economic growth.
GEOGRAPHY
Location: Situated in the central-southern region of Paraná, Guarapuava is approximately 300 km from the state capital, Curitiba.
Climate: The climate is humid subtropical, with cold winters and warm summers.
ECONOMY
Agriculture: The local economy is strongly based on agriculture, with emphasis on the production of soybeans, corn, beans, and livestock farming.
Industry: The city also has a growing industrial sector, including food processing, metalworking, and pulp and paper companies.
INFRASTRUCTURE
Education: Guarapuava has several schools and educational institutions, including higher education institutions such as the State University of Paraná (UNICENTRO), the Federal University of Technology – Paraná (UTFPR), as well as other private colleges.
Healthcare: The city has several hospitals and healthcare centers, offering medical and specialized services to the population.
Transportation: The city is connected by major highways and has well-developed transportation infrastructure.
ABOUT SANTA MARIA PAPER (SAMA)
Santa Maria manufactures high-quality papers using premium raw materials that undergo rigorous control throughout the entire production process. Our stateof-the-art equipment and highly qualified team ensure products with high resistance, printability, calendering performance, impregnation, safety, and productivity. Our paper range is widely recognized for its excellence
and meets the highest market demands, making it ideal for a wide variety of applications that require durability and superior performance.
We value the nature and essence of the product, the environment, quality of life, and respect for our suppliers and customers, always striving to do our best for everyone connected with us.
Versatility in Sublimation produced over the last 4 years, from 2020 to 2024
10.037 ton
24.362 ton
Packaging produced over the last 4 years, from 2020 to 2024
17.972 ton
Sustainable Bags produced over the last 4 years, from 2020 to 2024
42 ton
High-quality thermal printing produced over the last 4 years, from 2020 to 2024
Sublimation
16.719 ton
produced over the last 4 years, from 2020 to 2024
Offset paper printing produced over the last 4 years, from 2020 to 2024
104.517 ton
39.417 ton
Label Printing produced over the last 4 years, from 2020 to 2024
87 ton
15.302 ton
Edge Tape produced over the last 4 years, from 2020 to 2024
Secure Packaging produced over the last 4 years, from 2020 to 2024
79.494 ton
Wallpaper Base produced over the last 4 years, from 2020 to 2024
PRINTING AND WRITING
More pleasant writing and reading produced over the last 4 years, from 2020 to 2024
101.001 ton
Variable Printings produced over the last 4 years, from 2020 to 2024
53.278 ton
1.7.1
SAMA PAPER MANUFACTURING PROCESS
OUR RAW MATERIAL ORIGIN
OUR RAW MATERIAL
The quality of Santa Maria papers is strengthened through FSC certification, a globally recognized standard that ensures paper production from the conscious use of natural resources, in a socially fair, economically viable, and environmentally responsible manner. Santa Maria does not have an integrated mill and therefore sources its raw materials from suppliers.
PINUS 12 to 15 years of development
Our long-fiber cellulose comes from Pinus species wood, which is a type of pine tree; this cellulose has longer and more resistant fibers. This provides the paper with greater strength and durability, making it ideal for products such as kraft paper used in bags and packaging.
1.7.2
PAPER MANUFACTURING PHASES
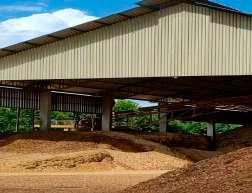
The received wood is chipped, turning into wood chips and fuel for the boiler.
EUCALIPTO 7 years of development
Our short-fiber cellulose comes from Eucalyptus species wood; this cellulose provides the paper with a smoother texture and excellent printability, making it ideal for office papers such as print and laser.
Wood chips are used to feed the boiler and produce steam utilized in the paper machines. Part of the wood chips is purchased from third-party suppliers, while part results from the transformation of wood into chips in the previous process stage (log splitter).
LOG SPLITTER PULPING
30,960 m³/month of pulped cellulose
The cellulose is pulped in water, forming the paper stock.
CHEMICALS ADDITION REFINING
16,000 L/month of additives for the machines
The stock receives chemical additives that adjust its properties.
1,400 L/min of refined fibrous suspension
The fibers are refined to improve the paper’s strength and uniformity.
CHEMICALS ADDITION REFINING
Removal of 18% to 20% of water in the drainage stage LOG SPLITTER DRYING
Removal of 47% to 51% of water in the drying stage
The paper is dried to remove the remaining humidity.
Machine 1 = 3,393 tons/ month and Machine 2 = 6,439 tons/month of wound paper.
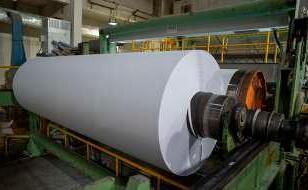
The dried paper is wound into large reels for storage and transportation.
Removal of 26% to 28% of water in the pressing stage
The sheet is pressed to remove excess water and compact the fibers.
The fibers are refined to improve the paper’s strength and uniformity.
Machine 1 = 3,246 tons/month and Machine 2 = 6,008 tons/month of rewound and wound paper.
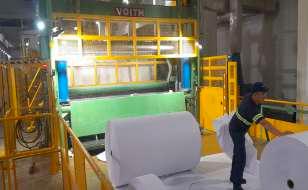
The large reels are rewound into smaller reels according to specifications.
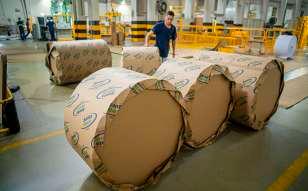
The rewound and separated reels are packaged and shipped to the end customer.
W.T.S
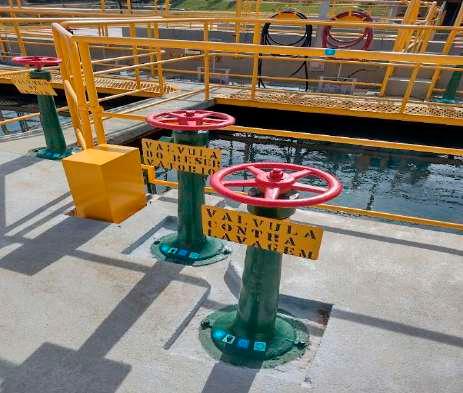
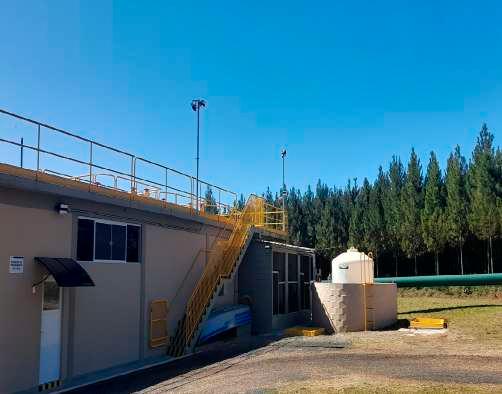
At the Water Treatment Station (W.T.S.), Santa Maria collects water from the Coutinho River for steam production and industrial water uses, while treating it to ensure proper return to the river without harming wildlife and vegetation, promoting conscious and sustainable use of this natural resource.
290,000 m³ of treated water.
E.T.S
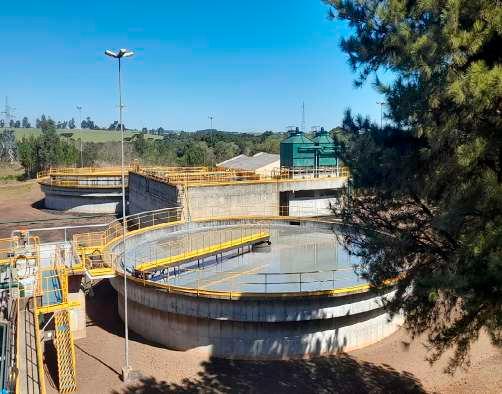
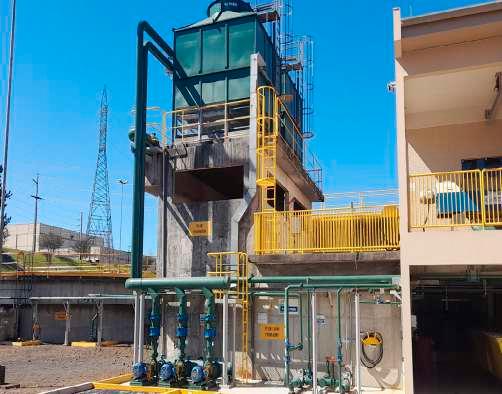
The Effluent Treatment Station (E.T.S.) treats the factory’s effluents from the paper manufacturing process, handling organic and inorganic compounds for proper waste disposal.
290,000 m³ of treated effluents.
SAMA PRODUCTS 1.8
SaMa Kraft Monolúcido is a paper with a glossy side that ensures high visual and printing quality. Ideal for bags, sacks, and food packaging, it enhances products and conveys quality in packaging.
SaMa Eco is a sustainable paper made with post-consumer raw materials, combining print quality with environmental appeal. Ideal for store and mall bags, it meets consumers who value sustainability and circular economy.
SaMa Gloss is a paper with shine on one side, used in the textile industry for sublimation and in various applications such as lamination, labels, packaging, fancy papers, tags, and stamps. It ensures high definition and quality in image and print transfers.
SaMa Print is a versatile and resistant offset paper, ideal for printing and writing in books, agendas, magazines, catalogs, blocks, leaflets, envelopes, and promotional materials.
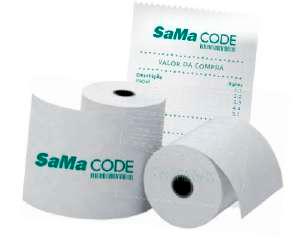
SaMa Code is a paper developed for thermal coating, ensuring good print quality and information preservation, ideal for everyday use with practicality and reliability.
SaMa Edge is a resistant and durable paper used for edge finishing on furniture. With shine and smoothness on one side, it ensures superior standards and high moisture resistance, ideal for impregnation with resins.
SaMa Colore is a high-quality paper for demanding sublimation applications, ensuring vibrant colors, high definition, and rich details in images.
SaMa Art is an untreated sublimation paper with high absorption and efficient drying, ensuring good transfer of water-based inks. It offers uniformity, stability, and excellent cost-benefit for industrial productions.
SaMa Bond is a parchment-like paper, ideal for school notebooks, agendas, refills, and office materials, offering excellent machinability, extreme whiteness, and quality.
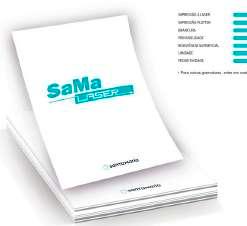
SaMa Laser is a low-moisture paper ideal for laser and inkjet printing, including variable data and customized commercial materials, ensuring excellent quality and performance.
Papers produced by Santa Maria are present in various moments of our daily lives, making life more practical, creative, and sustainable. From children’s learning with SaMa Bond in notebooks, agendas, and office materials, to SaMa Print for books, magazines, and catalogs, each paper is designed for quality, durability, and excellent user experience.
For packaging and visual communication, SaMa Kraft Monolúcido, SaMa Eco, and SaMa Gloss ensure high-definition prints that enhance products and convey care, style, and environmental responsibility. Sublimation papers like SaMa Art and SaMa Colore enable creations with rich details and vibrant colors for products and fabrics.
In industry and commerce, SaMa Code and SaMa Laser facilitate reliable printing of important information and data, while SaMa Edge provides special finishes for furniture and products requiring resistance and high quality. Each Santa Maria paper combines technology, aesthetics, and sustainability, transforming everyday materials into special experiences across all life stages with quality, safety, and innovation.
MAIN CUSTOMERS
Moschetti S/A
Embalagens orders from 2022 to 2025 represent 6.15% of our production.
Antilhas Gráfica e Embalagens Ltda orders from 2022 to 2025 represent 5.21% of our production.
Moschetti S/A Embalagens is a leader in its segment, with manufacturing units in Canoas/RS (10,000 m²) and Cotia/SP (5,000 m²), both compliant with GMP standards. With cuttingedge flexographic printing technology and paper packaging, it ensures strategic logistics across Brazil and South America.
Antilhas Gráfica e Embalagens Ltda, headquartered in Santana de Parnaíba – SP (Alameda Antilhas, 140 – Polo Empresarial Tamboré), specializes in producing high-quality graphic solutions and packaging. It offers customized services, combining innovation, efficiency, and client-focused attention to meet specific needs.
Máxima Cadernos
Indústria e Comércio Ltda orders from 2022 to 2025 represent 3.72% of our production.
Papex do Brasil
Indústria e Comércio de Papéis EIRELI orders from 2022 to 2025 represent 2.85% of our production.
Máxima Cadernos Indústria e Comércio Ltda, headquartered in Itapetininga – SP, manufactures notebooks with a focus on quality and innovation.It serves various segments nationwide, offering reliable products and customized solutions for clients across the country.
Papex do Brasil Indústria e Comércio de Papéis EIRELI, headquartered in Caiçaras, Belo Horizonte – MG, operates in the paper sector with a focus on quality and efficiency. It provides customized solutions for various segments, combining experience, innovation, and commitment to clients.
Clear Indústria de Papéis Ltda orders from 2022 to 2025 represent 2.82% of our production.
Clear Indústria de Papéis Ltda is part of a group with over 50 years in the paper sector, headquartered in Contagem with a 25,000 m² industrial plant and high production capacity. Operating nationwide, it is a reference in paper solutions, combining innovation, efficiency, and total client focus.
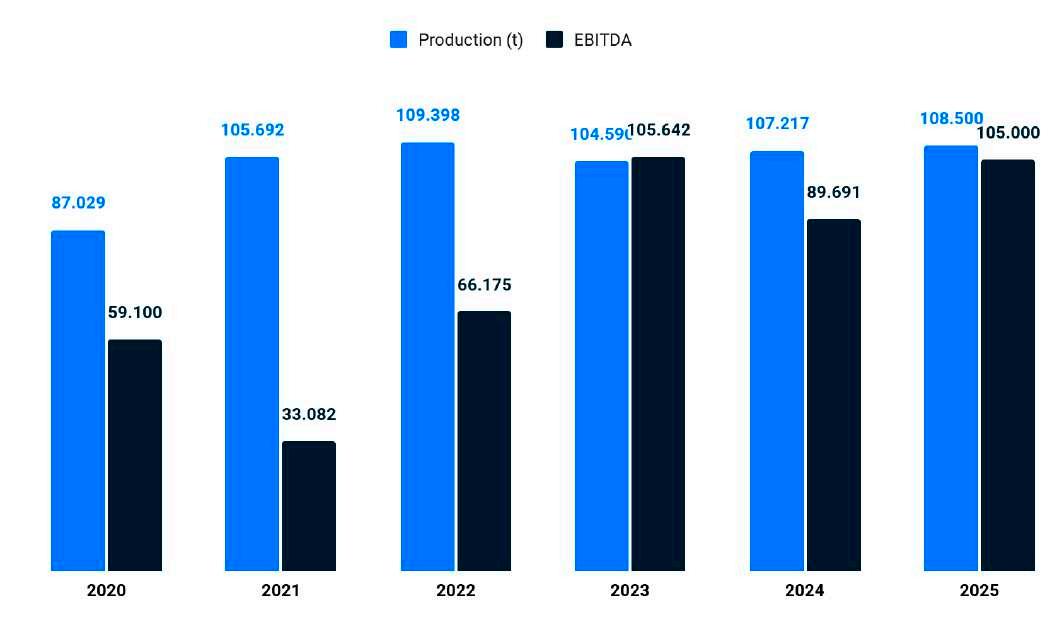
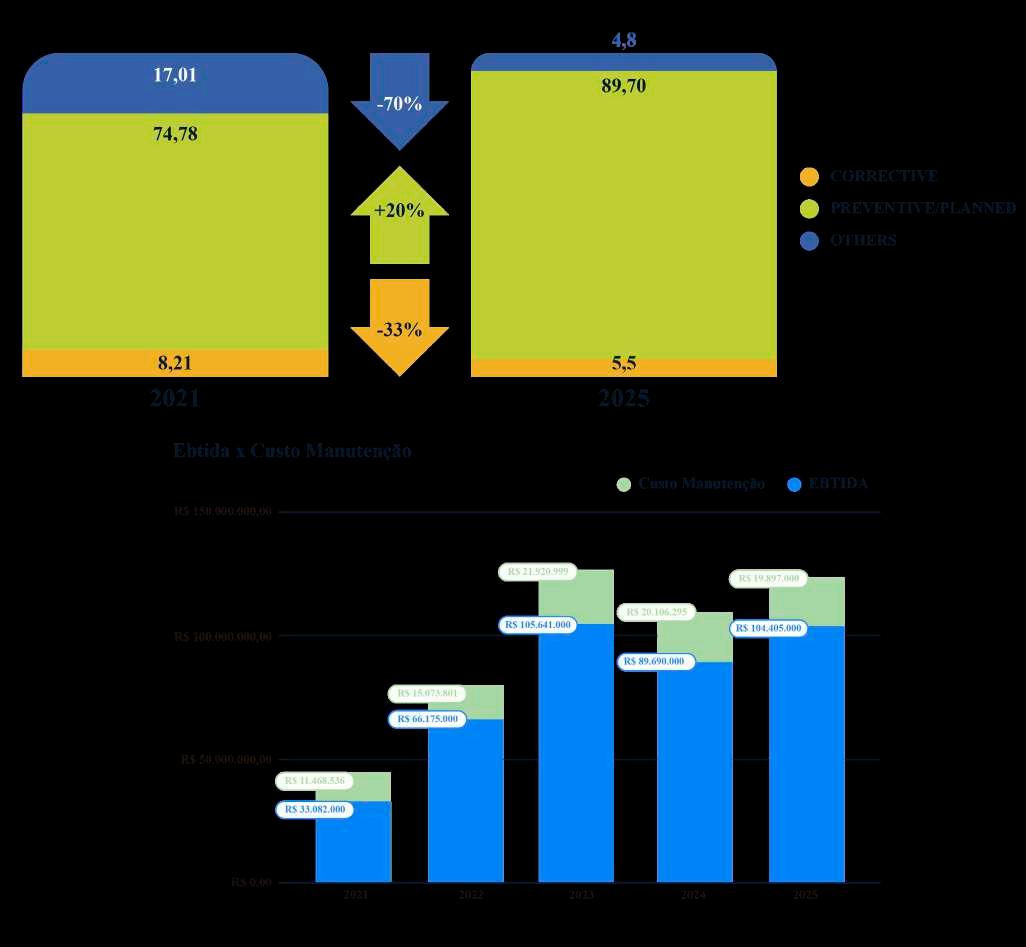
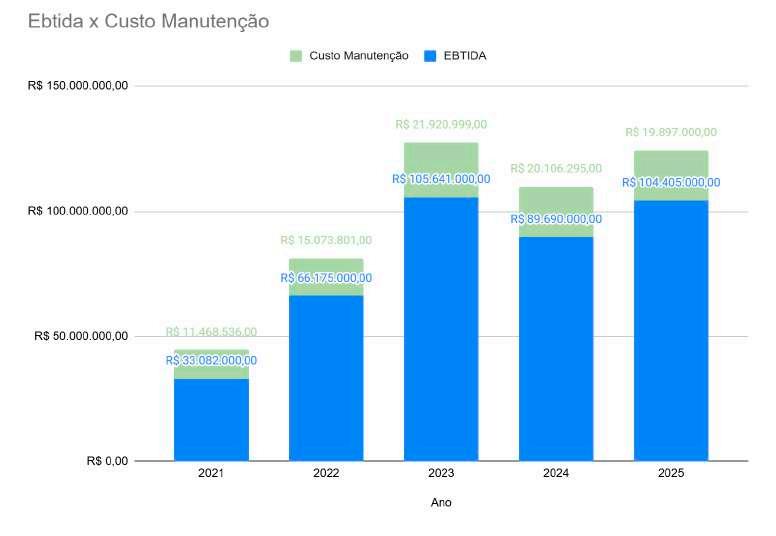
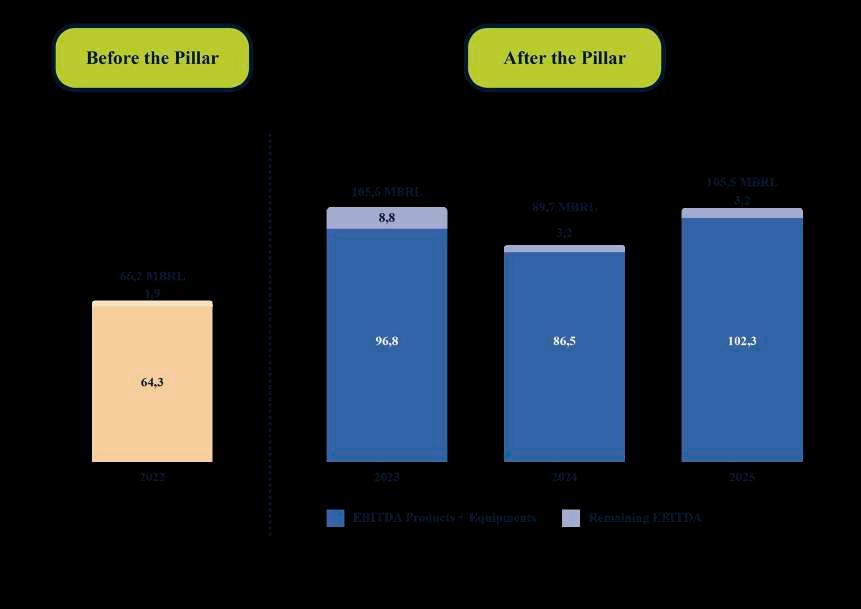
PAPER EBITDA HISTORY
The rise in EBITDA levels resulted from a set of strategic and structural decisions. Key advances include implementing marginbased approval authority, established after identifying in 2020 sales of certain papers with margins below expected levels; negotiations below the defined standard now require CEO and Business Head approval, ensuring stricter commercial governance and pricing discipline.
A detailed portfolio mapping identified highest-profitability products, prioritizing them in machine production mixes to increase high-value-added papers’ share.
Another milestone was adopting the Business Unit (BU) concept, aligning all areas toward measurable EBITDA improvement with defined responsibilities and integrated goal deployment, fostering high-performance culture and consistent results amid global volatility.
2.1
At Santa Maria, our vision is to be recognized as a global benchmark in sustainable solutions, actively contributing to a future where societal transformations are met with innovative and responsible forest-based products. With a constant focus on renewability, recyclability, and biodegradability, we aim to lead the way in a continuously evolving industry, offering our customers environmentally responsible alternatives that promote a sustainable product lifecycle.
2.2
SANTA MARIA COMMITMENT STRATEGY
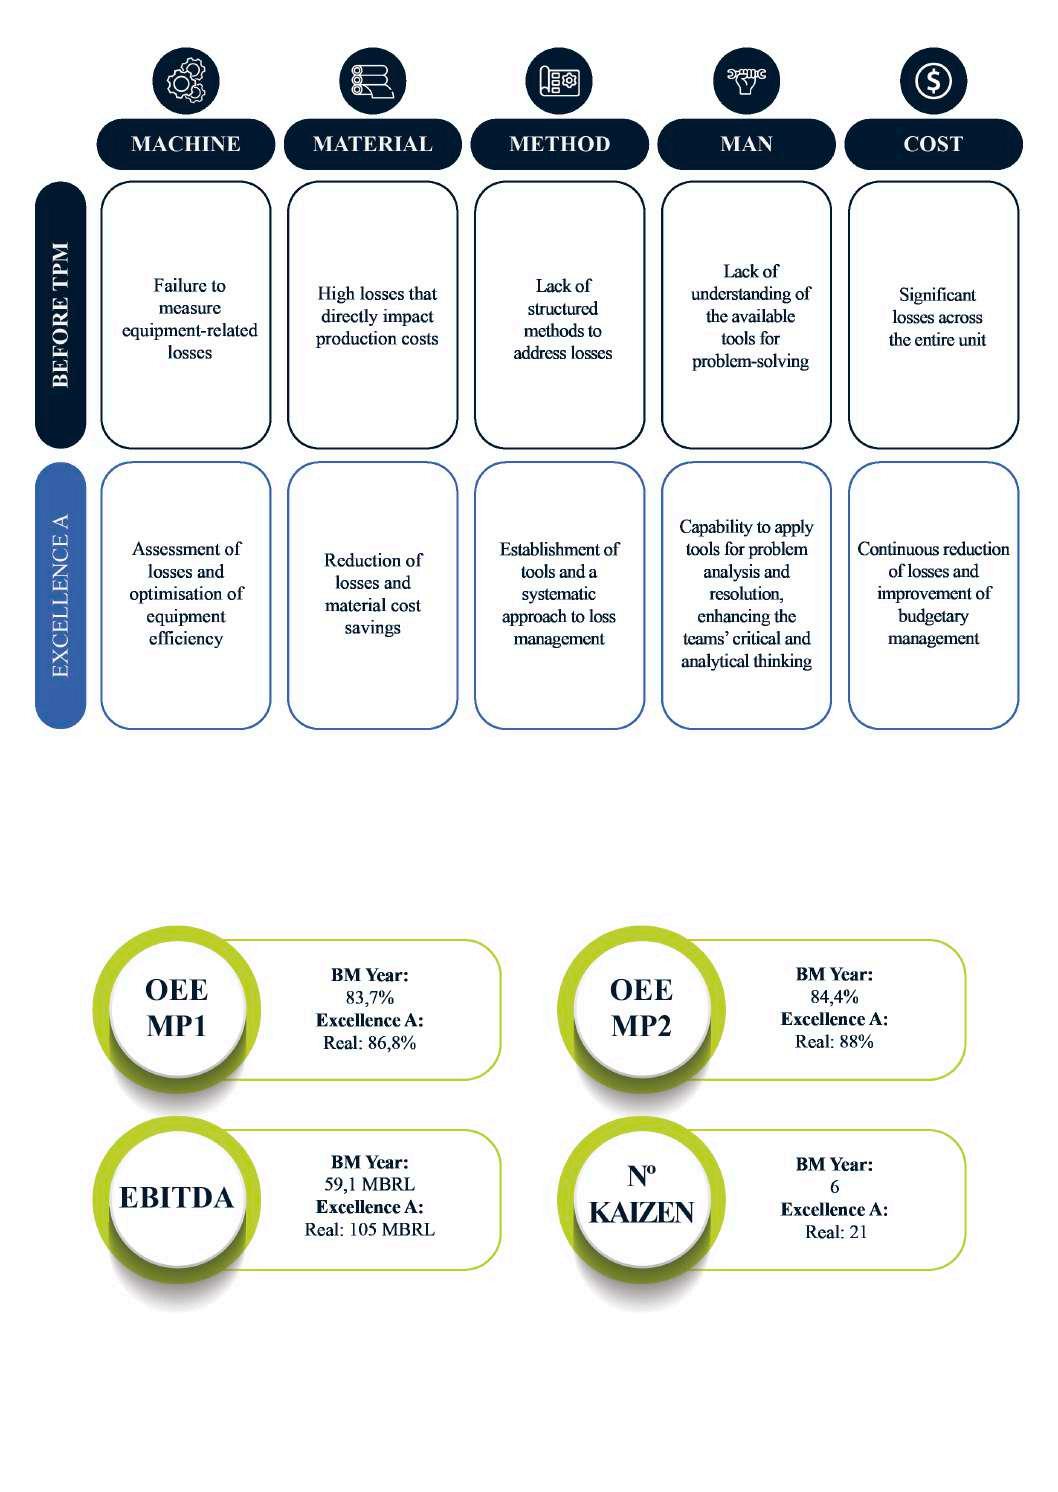
TPM was chosen as the methodology guiding all business operations, with the purpose of improving operational efficiency by reducing downtime and costs, increasing quality and equipment lifespan, and promoting employee safety and engagement.
2.3
STRATEGIC OBJECTIVES
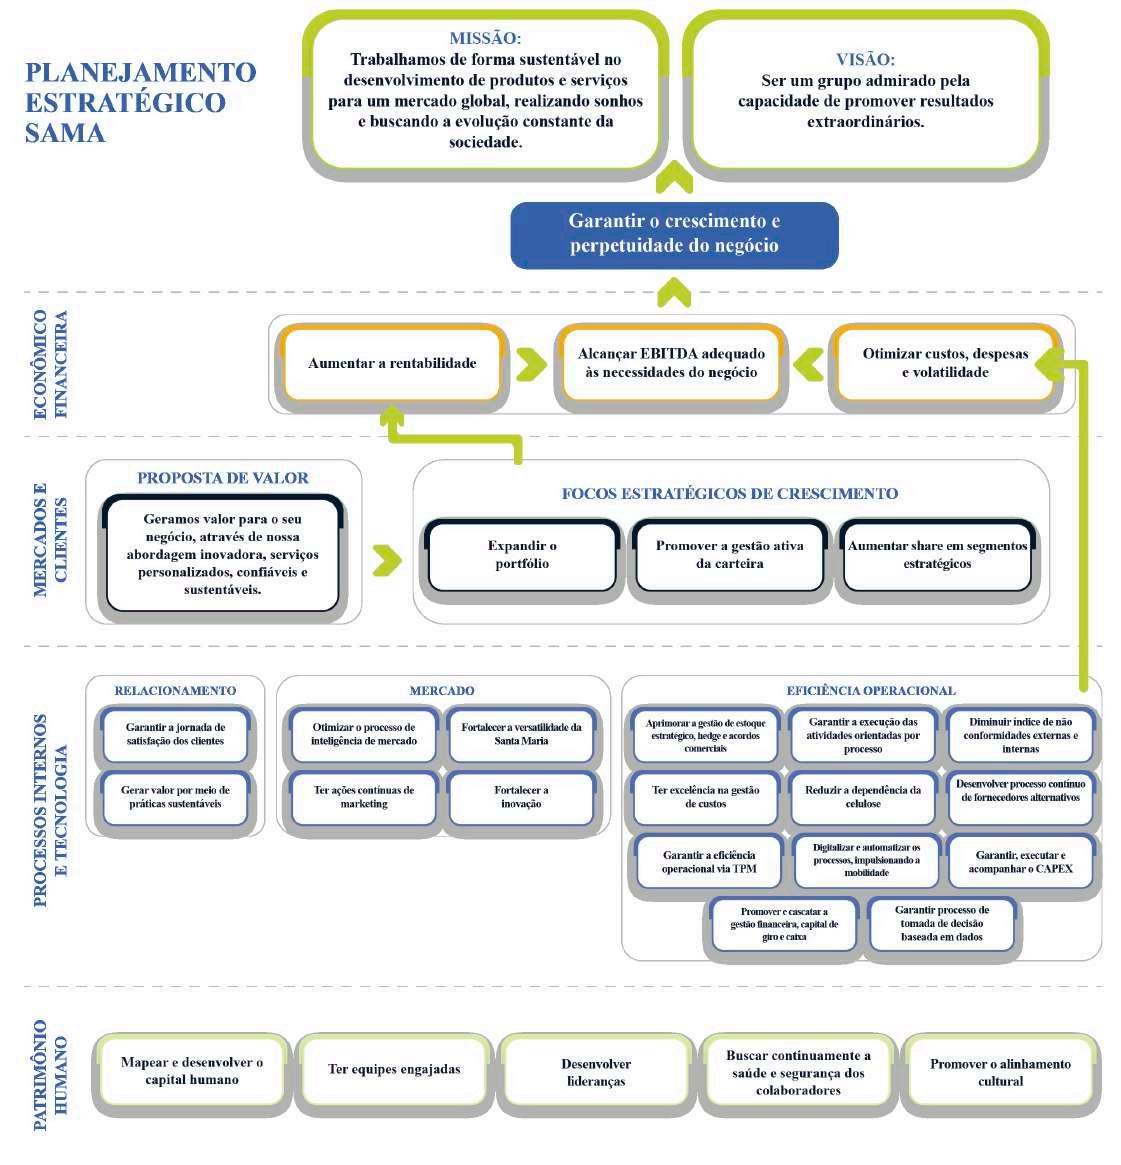
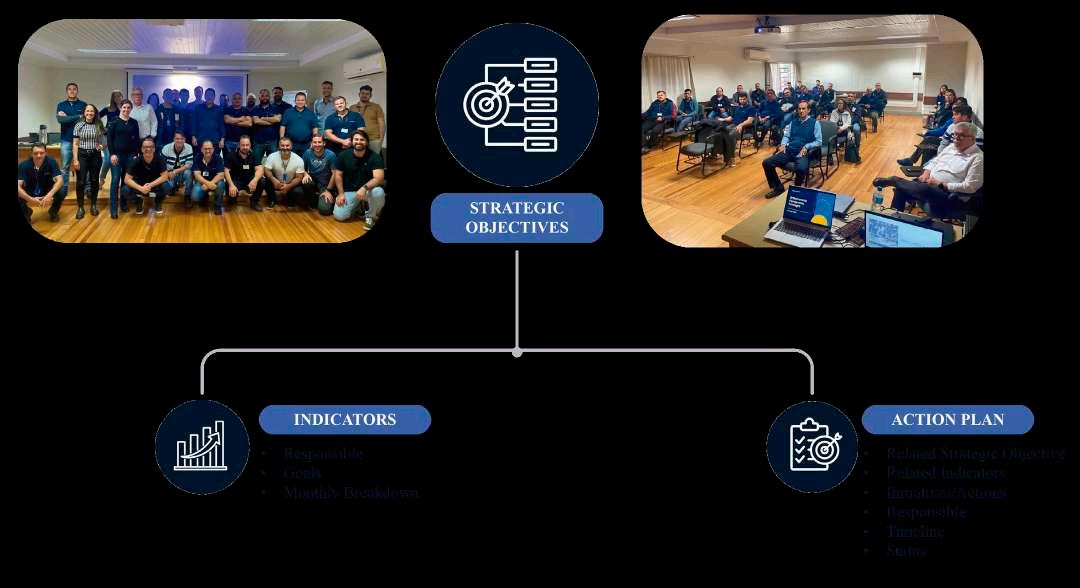
Today, at the Santa Maria Group, we use the Balanced Scorecard (BSC) methodology. This approach has helped us translate the company’s vision and mission into tangible objectives. We conduct regular sessions to update and monitor the established plans.
TPM AND STRATEGIC OBJECTIVE 2.3.1
TPM was chosen as the group’s primary methodology, allowing it to be incorporated into all strategic deployments of the company. In this way, we ensure that the methodology is fully integrated into our processes, driving efficiency across the entire organization.
LINE OF SIGHT
Approval and facilitation of the acquisition of the new coater.
EBITDA R$82.0 million.
Consolidate a suitable technical alternative for the boiler.
Achieve production volume for the current coater above 4,300 tons/year.
Internalize industrial databases.
Industry 4.0 implementation for large equipment.
Provide corporate network access across the entire manufacturing site.
Virtualization of the VALMET control room.
Investment in safety for the reel transfer system.
Signing of the TAC and initiation of the new fire protection project investment.
Enable cross-docking model.
OPE Machine 1 / OPE Machine 2.
EBITDA: 12%
Establish an innovation center.
Conduct 10 industrial-scale tests with agricultural fiber pulp.
Achieve 65% score on the JIPM checklist.
Expand innovation activities in the external market.
Coater production volume: 4,500 tons/ year.
Install a Santa Maria MFS pilot plant.
Expand six-month sales forecast accuracy.
Implement cross-docking model.
OEE Machine 1 and 2.
JIPM award application
EBITDA: 14%
Coater production volume: 4,800 tons/year
Assessment for GMP certification
Have a structured project for agricultural fiber pulp
Have a structured project for the MFC plant
OEE Machine 1 and 2
VISION
Win the JIPM award
Start-up of the new Coater
Factory insurance
Substation modernization
Santa Maria operations
OEE Machine 1 and 2
To be a group admired for its ability to deliver extraordinary results.
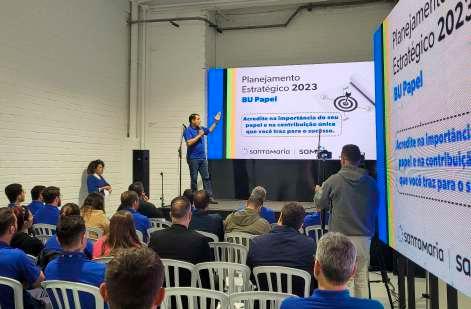
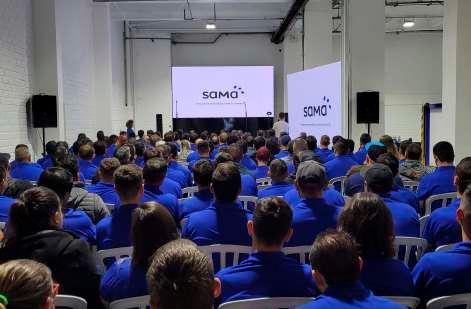
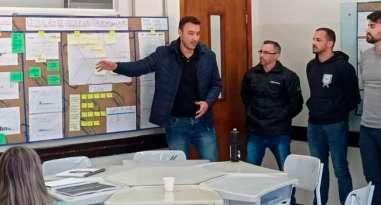
We carried out the strategic deployment and presented it on the GEMBA during an initial event to ensure that everyone understands the direction of each business unit and the key activities that will drive us to success.
The Focused Improvement (FI) pillar serves as the guardian of this methodology, responsible for disseminating the action plans. Additionally, the pillar is tasked with monitoring and scheduling regular meetings for the presentation and follow-up of the 139 actions defined in the 2024 review. All pillars contribute to the execution of this action plan, each with its own specific roles and responsibilities.
PAPER BUSINESS
INDICATORS AND TARGETS
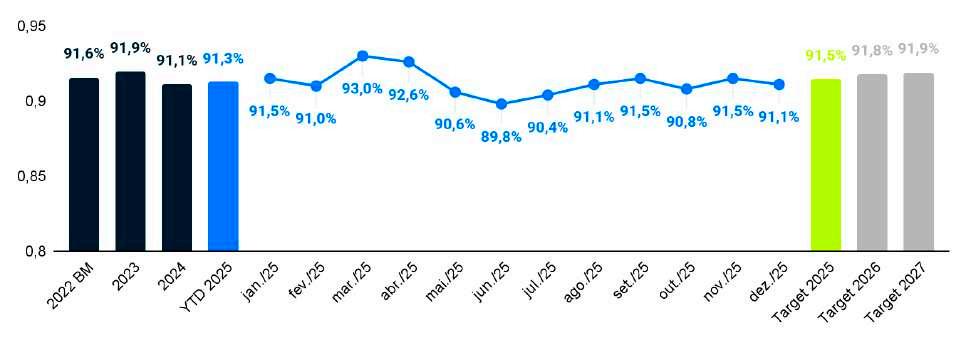
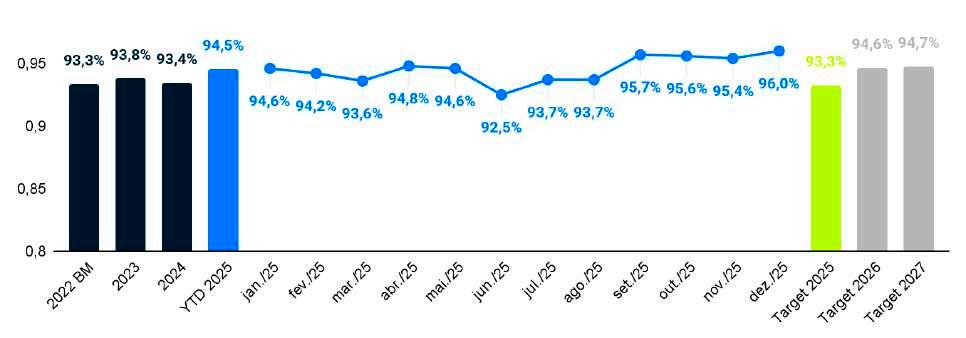
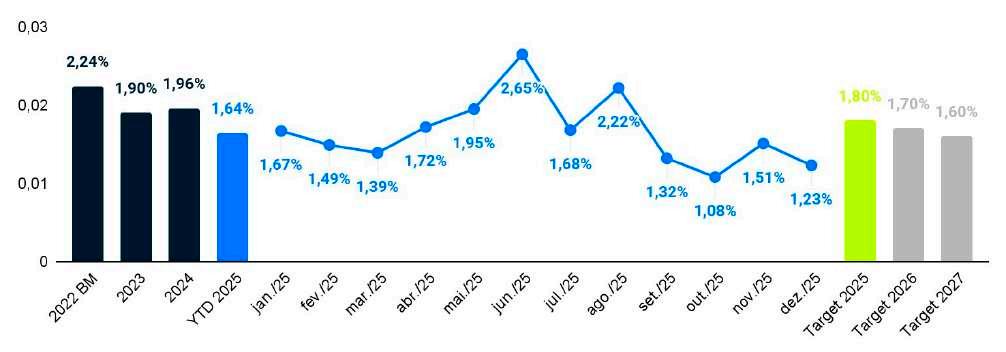
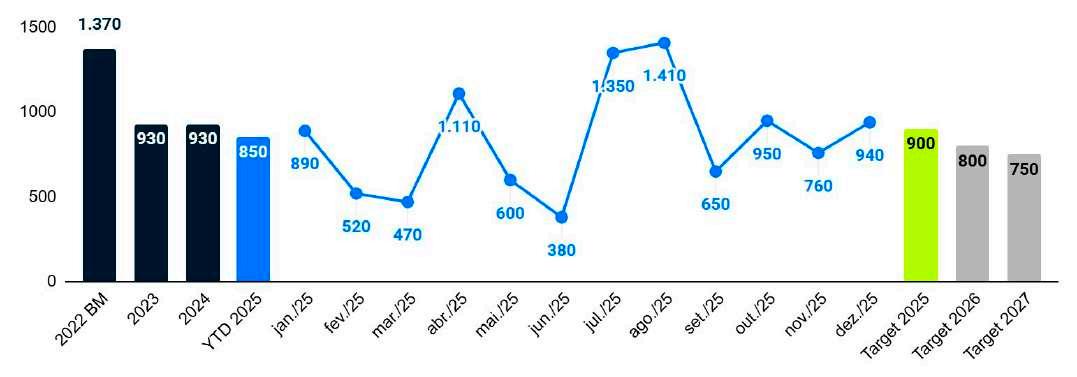
Key performance indicators are implemented and grouped within the PQCDSME, forming the indicator dashboard for the Santa Maria Group’s Paper Unit. These industrial indicators measure results and provide monthly performance monitoring. The unit’s strategic deployment is divided into four main categories: Human Capital, Internal Processes and Technology, Markets and Customers, and Economic-Financial. Based on these indicators, the pillars meet to break them down within the PQCDSME, enabling close monitoring of our activities’ performance.
FROM STRATEGY TO THE GEMBA: THE INDICATOR JOURNEY 2.5
At the heart of our organization’s strategy lie the KMIs (Key Management Indicators) — indicators that point the direction of the business, acting like a compass for the future. They translate ambitious goals into tangible targets. One of these KMIs, for example, was clear: Increase Sellable Production and Profitability (EBITDA).
But a compass alone does not move a ship. It needed to be translated into something that everyone could see, feel, and act upon. Thus, this KMI was broken down into several KPIs (Key Performance Indicators) — performance indicators that measure operational results. In this case, the selected KPIs included:
Equipment Availability,
OEE (Overall Equipment Effectiveness),
Scrap,
Variable Cost and Maintenance Cost, among others.
Each of these KPIs became part of the PQCDSME Dashboard, enabling a clear and structured view of the production pillars: Production, Quality, Costs, Delivery, Safety, Morale, and Environment.
But the real transformation only occurred when the KAIs (Key Activity Indicators) came into play. These are the indicators that measure the activities and behaviors that drive the KPIs. Here, autonomous teams and cross-functional groups took center stage.
Examples of KAIs derived from the KPIs above included:
Number of improvements implemented (FI),
Savings from improvements (R$),
Completion of Failure Analyses (PM),
Adherence to maintenance plans (PM),
Number of OPLs applied (ET),
Training feedback and technical development (ET).
These KAIs became part of the daily routine of the GAs, supported by meetings, rituals, and visual management boards. The major strategic indicator (KMI), which once seemed distant, was now experienced by every employee on the shop floor.
The journey of a KMI becoming a KAI is not just a cascade of indicators. It is a living connection between the company’s purpose and the hands that deliver the results. It embodies the culture of continuous improvement, where each person understands the “why” and the “for what” of their activity. This story shows that, beyond numbers, indicators tell stories of transformation. And it is this transformation that drives our business — from strategy to operations, from vision to results, from intention to action.
ACTION PLAN FOR ACHIEVING EBITDA 2.6
Through strategic planning and the creation of indicators, monthly monitoring was established, allowing us to develop action plans to address any deviations.
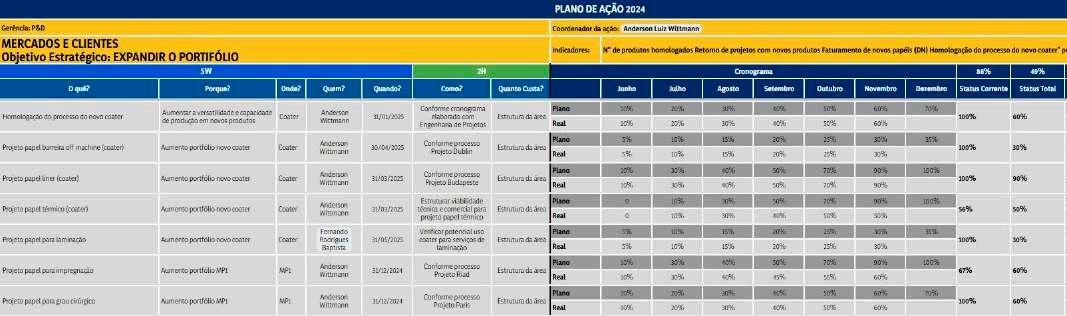
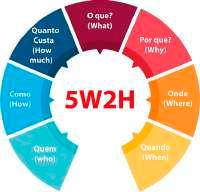
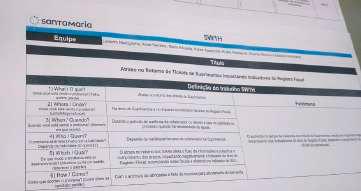
We adopted the 5W2H methodology to plan actions related to the execution of the strategic plan. Monitoring is conducted by the pillar and presented to the steering committee once a month, aiming to maintain engagement and involvement from all stakeholders. This approach has proven to be highly effective, enabling us to achieve excellent results. It was especially crucial during the crises caused by rising pulp prices.
PEOPLE ENGAGED IN TPM
Key performance indicators are implemented and grouped within the PQCDSME, forming the indicator dashboard for the Santa Maria Group’s Paper Unit. These industrial indicators measure results and provide monthly performance monitoring. The unit’s strategic deployment is divided into four main categories: Human Capital, Internal Processes and Technology, Markets and Customers, and Economic-Financial. Based on these indicators, the pillars meet to break them down within the PQCDSME, enabling close monitoring of our activities’ performance.
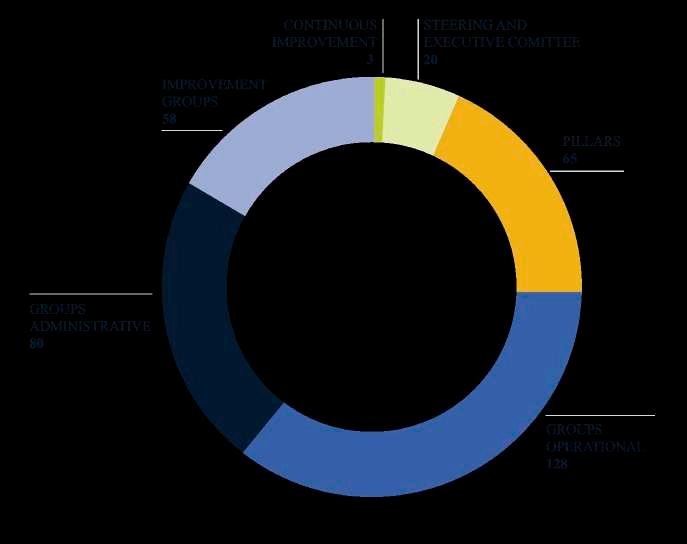
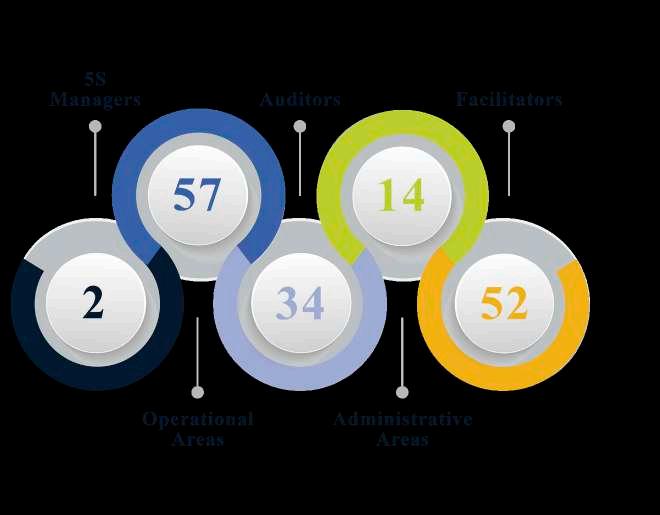
Today, approximately 354 people are directly participating in the TPM program in the Paper BU, representing 74.05% of the personnel working in administration and the paper mill.
TEAM STRUCTURE
TPM POLICY
MISSION
To advise the Executive Committee, business areas, and Pillars in the execution of their activities, in accordance with the TPM Methodology, valuing people, with a focus on eliminating losses and applying continuous improvement to processes.
To ensure employee safety, as well as excellence in processes and products, through active engagement and the empowerment of people.
VISION
OBJECTIVES
Achieve zero accidents, breakdowns, failures, and defects. Develop TPM methodology knowledge in 100% of employees.
Ensure adherence of the pillars and autonomous groups to the proposed schedules. Become a reference for the TPM methodology in the Guarapuava region.
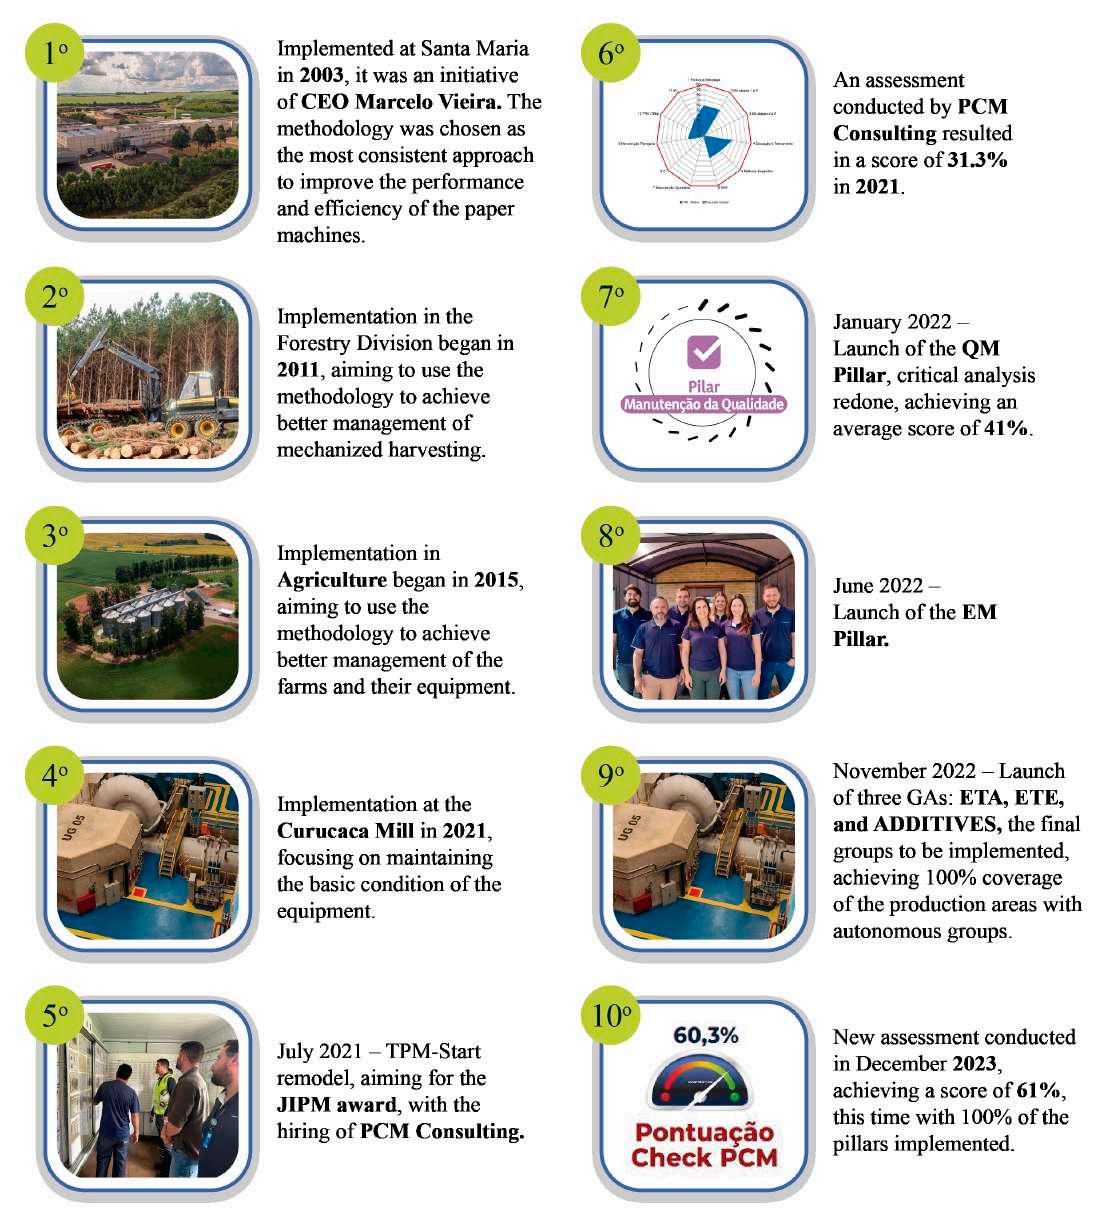
WHEN TPM WAS INTRODUCED AT SANTA MARIA?
A NEW MILESTONE IN THE TPM PROGRAM
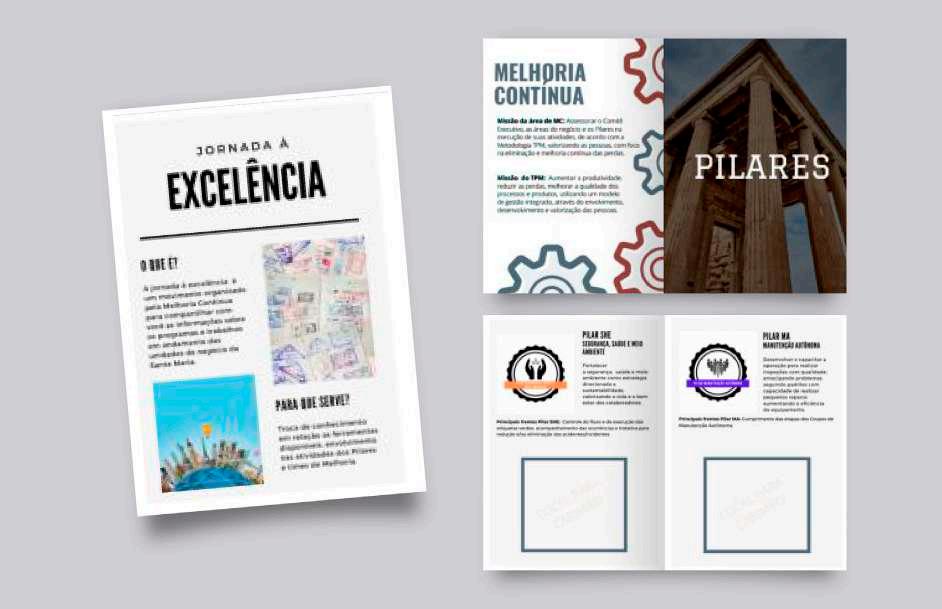
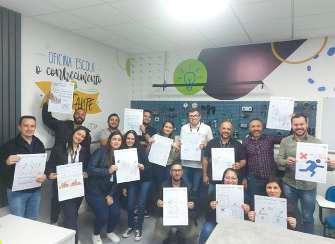
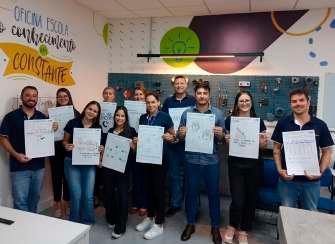
To establish a new milestone in the TPM program and pursue the JIPM award, we organized a special event called “Around the World – Journey to Excellence”, held on October 19, 2021.
During these three days of the event, we had the presence of CEO Marcelo Vieira, Paper Head Mario
Sterza, Supply and Services Head Marcos Burati, Energy Head Felipe Moriotto, and Agro and Forestry Head Cristhian Sekula, along with managers from all business units, coordinators, operations teams, and administrative departments. We achieved 87% employee participation. The event featured lectures, presentations of the pillars, and unit success cases.
3.5.1
The event was organized to share information and standardize basic knowledge on continuous improvement initiatives, including the TPM methodology, pillars, tools, projects, teams, and EVENT OBJECTIVE
recognitions. The objective was to engage 100% of Santa Maria Group employees, ensuring that everyone was aligned with the fundamental principles and practices of the program.
3.5.2
CUSTOMIZED HANDBOOK
3.6
GUIDANCE FOR THE PILLARS
In 2022, together with the Pillars, the Continuous Improvement team, and PCM Consulting, we developed the Master Plan, a document that guides us and sets the pace for achieving our excellence goals. Each pillar has its own Master Plan, detailing the activities for each stage and their respective delivery dates.
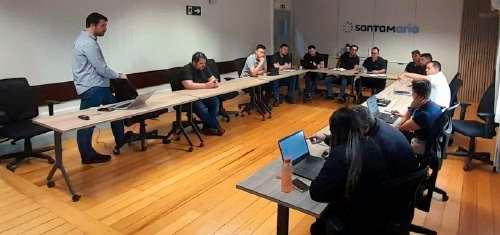
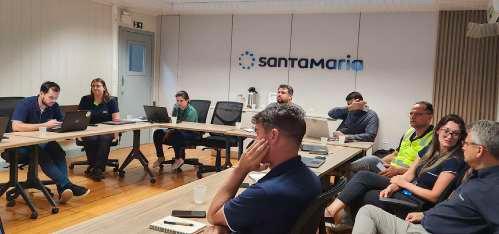
We hold two monthly meetings with PCM Consulting, dedicated to resolving questions and validating what has been developed, with time allocated for each pillar. We also facilitate inter-pillar meetings to discuss deliverables and pending items. At the end of each two-month period, we present the results to the steering committee and the CEO of the Santa Maria Group.
3.7
CORRELATION BETWEEN THE PILLARS
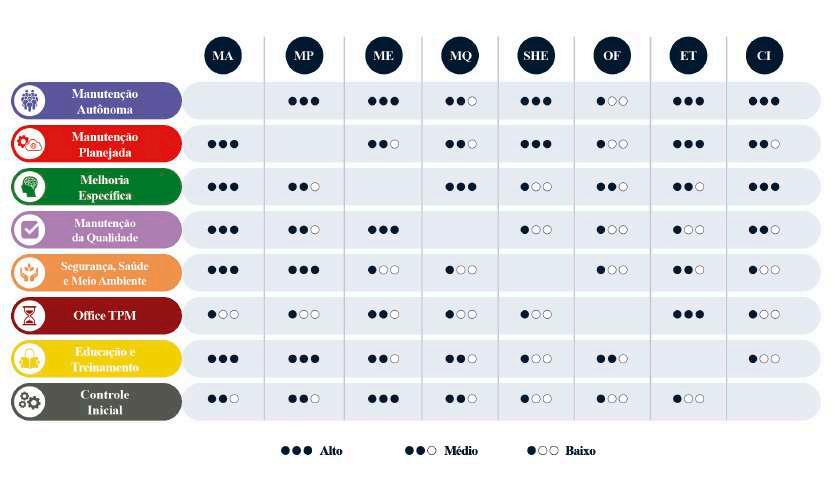
This correlation highlights the level of interaction between the pillars, as expected. The pillar with the highest interaction with the others is Autonomous Maintenance (AM), as it works directly with the Autonomous Groups, supporting their development, driving improvements in their respective areas, restoring basic conditions, and performing various other activities that connect the groups to all TPM pillars.
PILLARS AND TRAINING
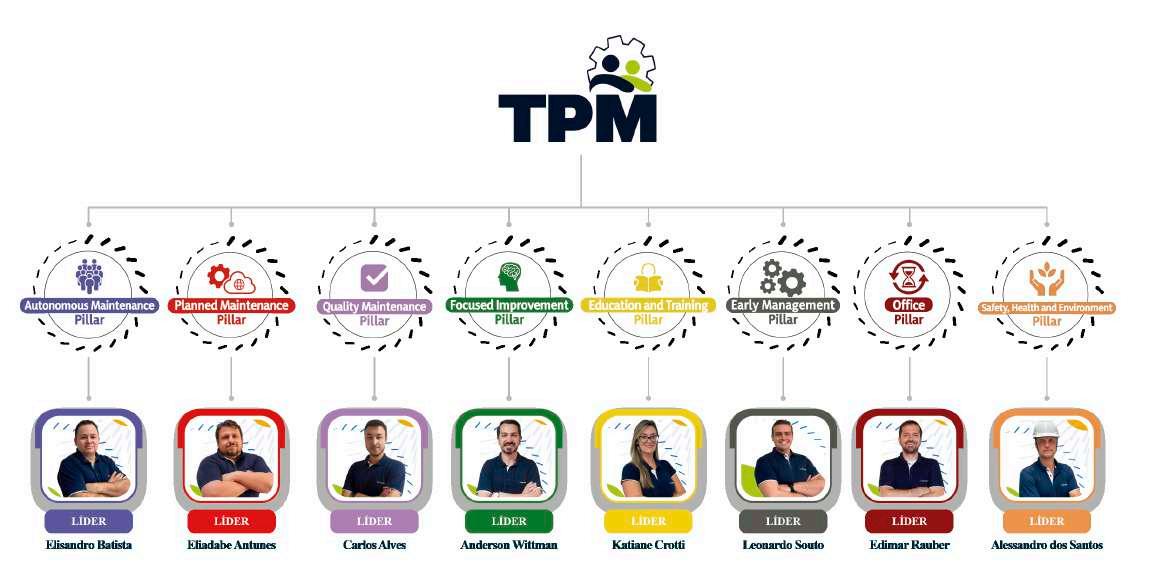
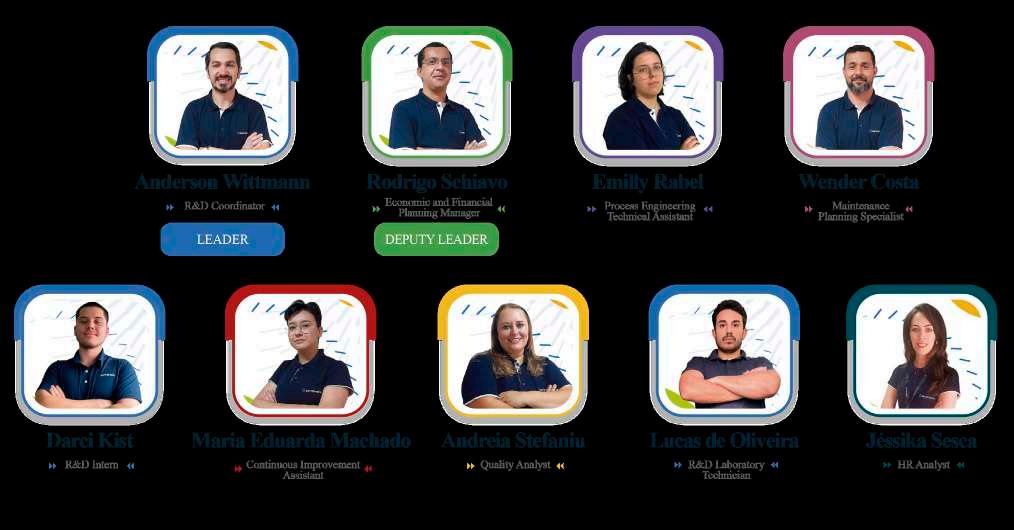
Each pillar has a leader and a deputy leader, strategically composed of key representatives from different areas. For example, the SHE Pillar includes representatives from Production, Maintenance, Processes, Health, Safety, Environment, and the Administrative department.
All members of a pillar undergo training as TPM facilitators, equipping them to perform their roles within the pillar. In addition, we conduct other specific training sessions focused on each pillar or on the tools required for its implementation.
PILLAR GOVERNANCE
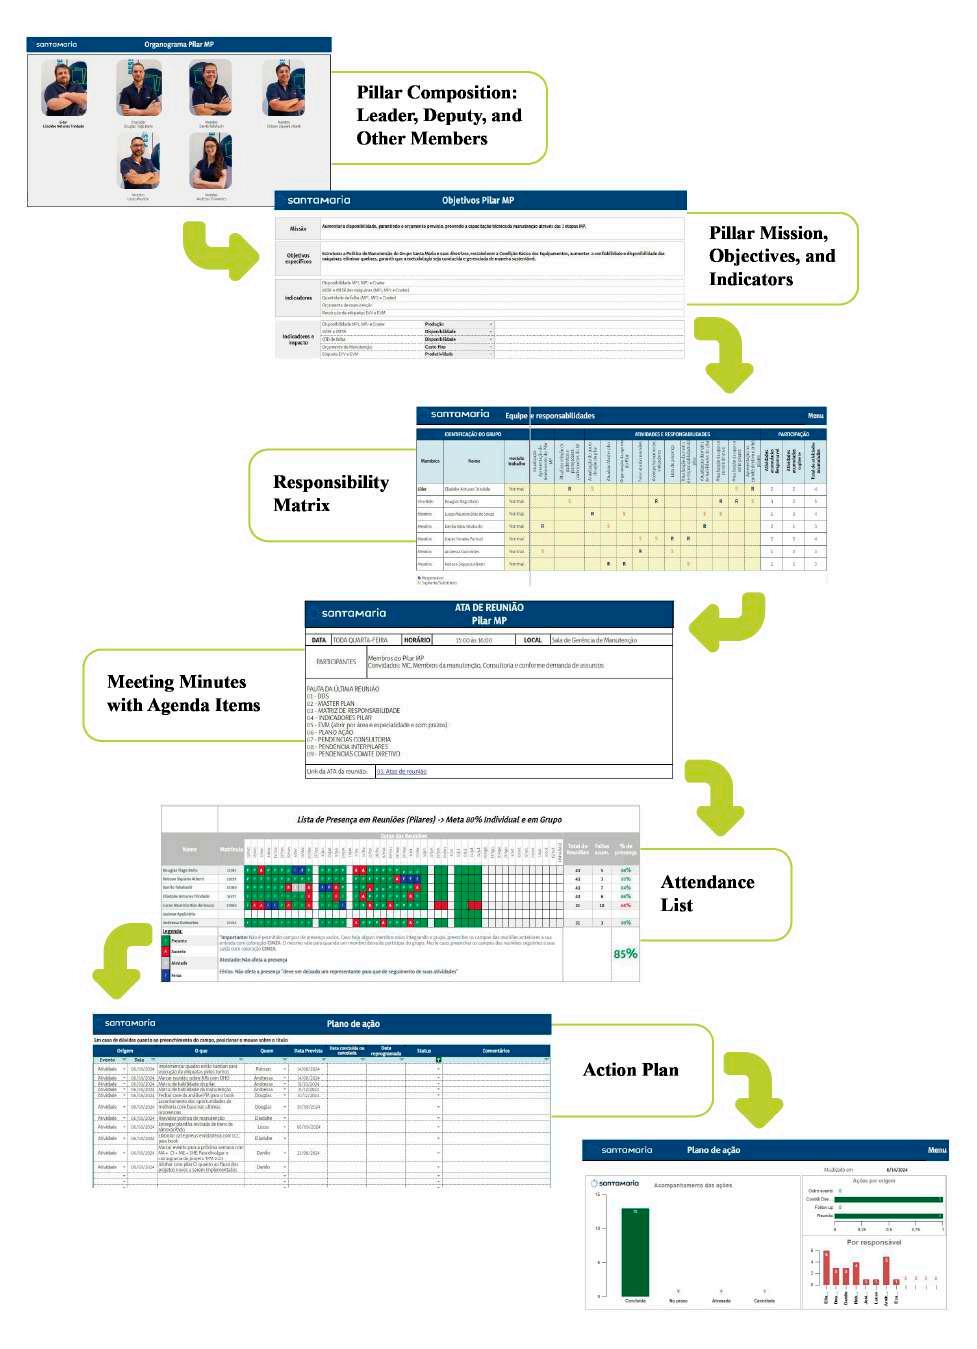
We standardized the pillar governance model, defining the main tools and controls that must be monitored and utilized by each pillar.
TPM PROGRAM PROMOTION
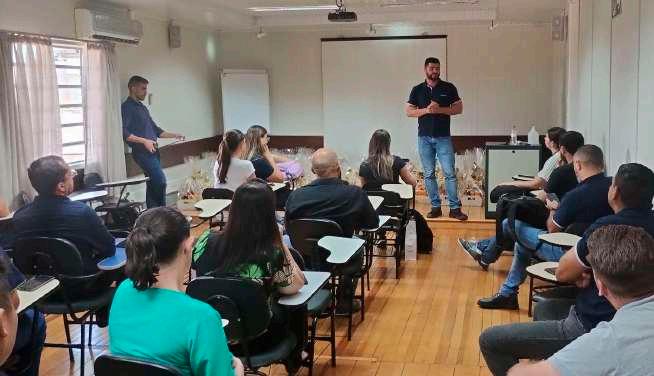
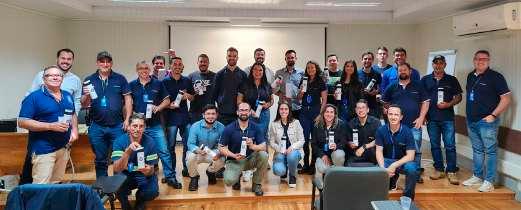
Currently, we use various channels to promote and communicate the TPM program, always celebrating our achievements. This includes events such as breakfast meetings, gift baskets for families, end-of-year celebrations, and other initiatives.
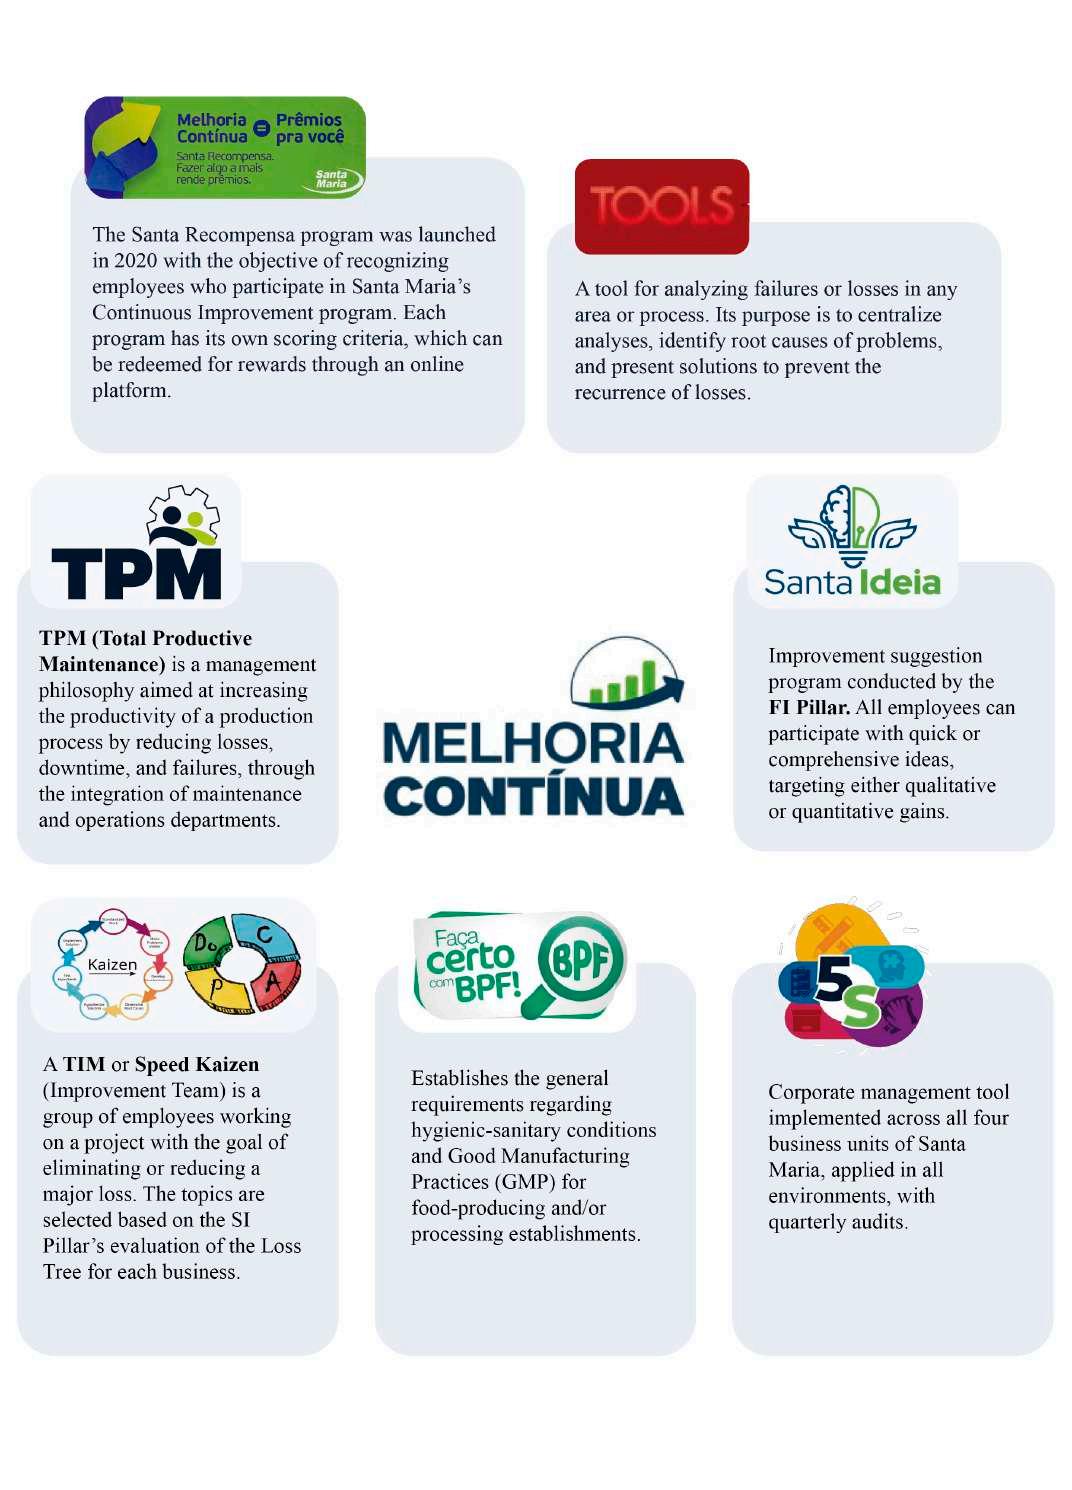
SANTA REWARD
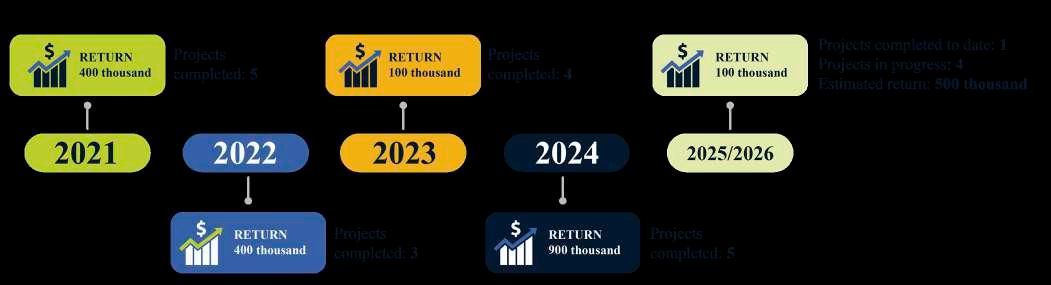
Currently, one of the main ways we promote engagement across all areas of the Continuous Improvement sector is the SANTA REWARD program. This program was developed to recognize employees who, in some way, participate in projects and generate value for the business. This version presents the concept more clearly and concisely, maintaining the focus on the program’s objective and its impact on employees.
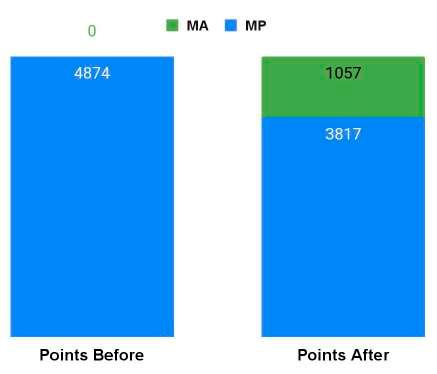
This recognition is divided into qualitative and quantitative factors. Qualitative activities do not generate financial gains but provide intangible benefits. Points for these activities are assigned according to their nature, ranging from 310 to 2,000 points. Quantitative activities, which generate financial returns, award 1 point for every 3 reais of return, with each point equivalent to 0.14 reais.
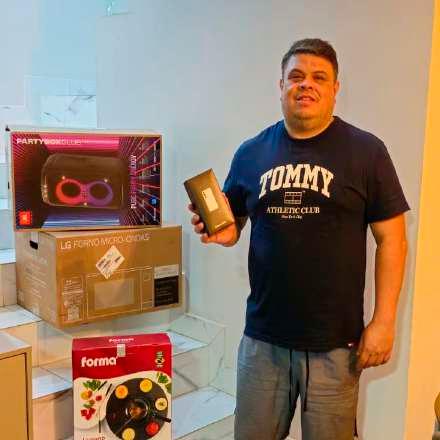
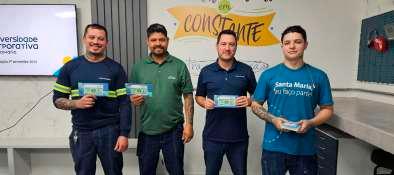
Some of the employees who accumulated points and redeemed them for amazing rewards!
BENCHMARKING FOR EXCHANGE KNOWLEDGE
We have adopted benchmarking as a strategy to compare our group’s processes, products, services, or practices with those of other leading organizations in the sector or in different industries. Some of the aspects we focus on during our visits include: Identification of Best Practices, Continuous Improvement, Competitiveness Gains, Innovation, Setting Realistic Goals, Performance Measurement, Cost Reduction, and Efficiency Improvement.
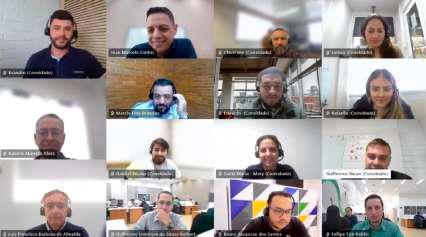
Benchmarking was conducted remotely with Klabin, focusing primarily on the activities of the Initial Control Pillar. This collaboration greatly helped us guide our activities and initiate the CI Pillar activities within the Santa Maria Group.
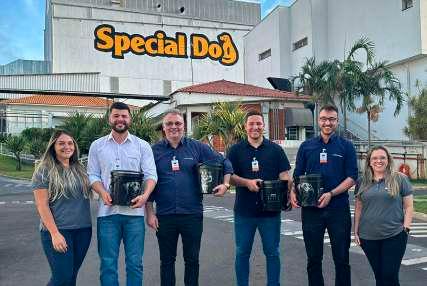
Benchmarking was conducted with Special Dog, a Brazilian company specializing in animal nutrition. The company welcomed us to showcase their best practices in manufacturing and management of GMP, TPM, and 5S programs. This visit allowed us to begin creating our own GMP manual and also brought valuable 5S and TPM practices to implement in our plant.
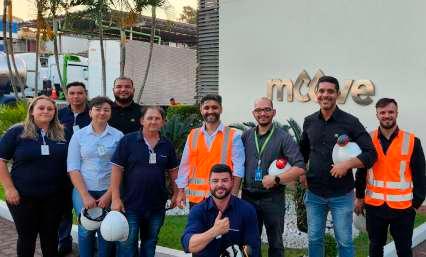
Benchmarking was conducted with MOOVE, a leading lubricants company and part of the COSAN Group. During this visit, we shared best practices in HSE, TPM, and 5S. The company inspired us with many valuable insights, particularly regarding safety and sustainability culture, boasting achievements such as 30 years without an accident and only one environmental incident since its founding in 1950
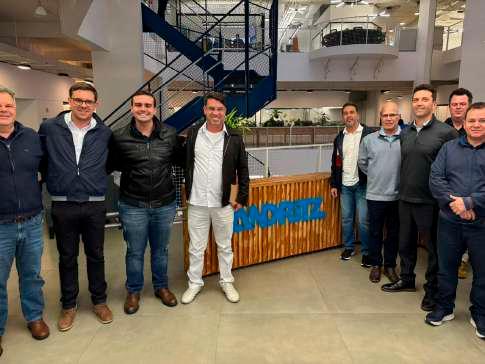
Just as several companies welcomed us and opened their doors, we have also warmly received many others to share our best practices, programs, and the results we have achieved. We are truly honored to host these visits, as they demonstrate that we are on the right path and reinforce our commitment to the group’s vision: “To be a group admired for its ability to deliver extraordinary results.” Moreover, this recognition contributes to achieving our TPM goal: “To become a reference in the TPM methodology in the Guarapuava region.”
Antilhas Embalagens was founded in 1986 and is a Brazilian company specializing in packaging manufacturing.
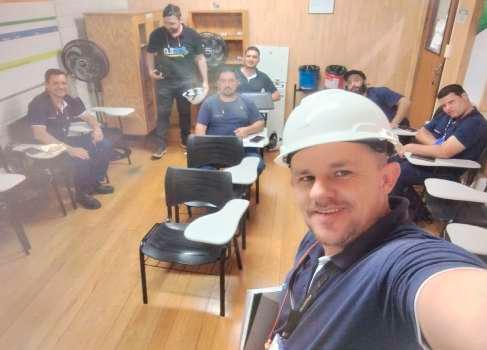
On this day, we shared how we manage our TPM program, with the company particularly interested in the AM Pillar and the Autonomous Groups.
Cooperativa Agrária is an agricultural cooperative located in Entre Rios, in the state of Paraná, Brazil. Founded in 1950, the cooperative operates in the agroindustrial sector.
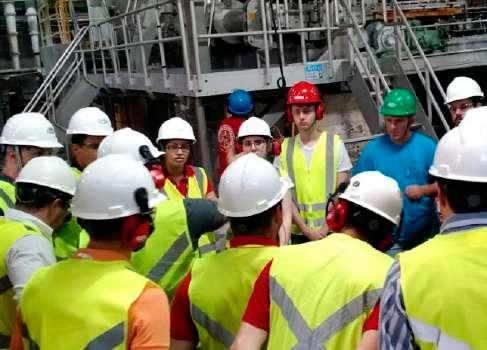
On this day, we shared the management of the TPM program, pillar governance, and conducted a GEMBA visit to observe TPM best practices.
Grupo Ibema operates in the paperboard, agriculture, energy generation, and logistics sectors, consolidated under the name “Grupo Ibema.” Founded in 1980, its headquarters are located in Turvo, PR. The company has been seeking to strengthen its culture of continuous improvement and has been using the TPM methodology to achieve excellence in its business operations.
3.12
COLLABORATION WITH
THIRD-PARTY COMPANIES
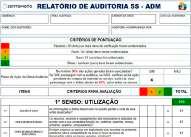
At Santa Maria, the Continuous Improvement Program also includes our third-party partners operating within the Group’s units. These companies participate in training on the methodology and have their areas of operation regularly evaluated through 5S audits.
3.12.1
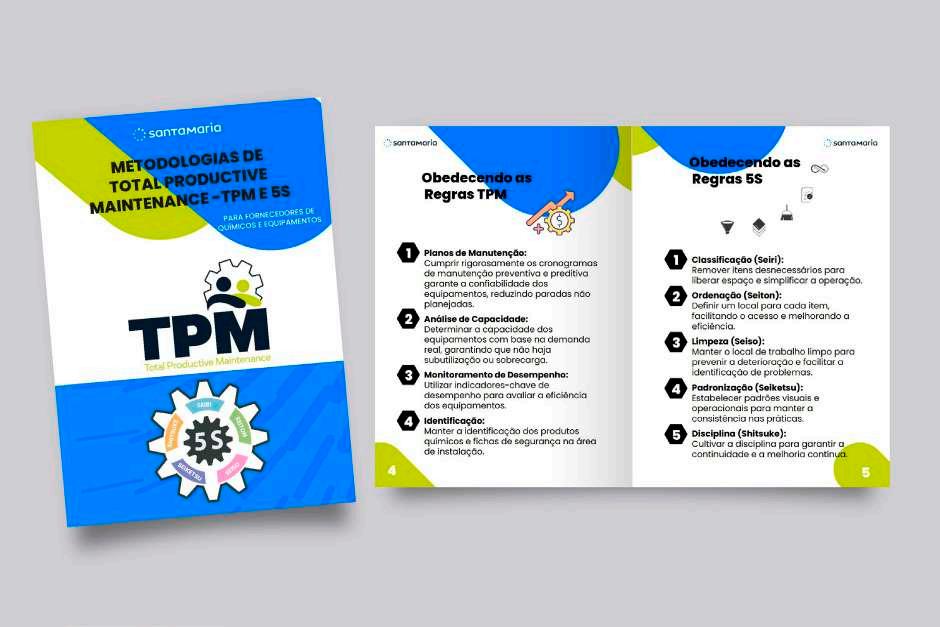
TPM AND 5S HANDBOOK FOR SUPPLIERS
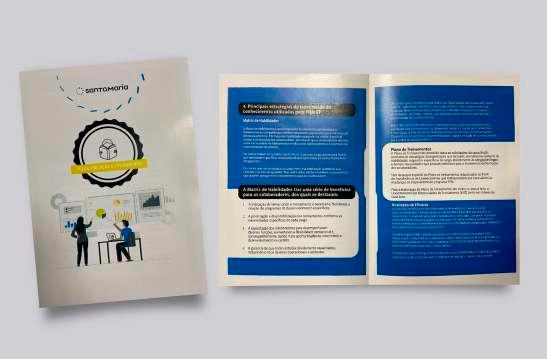
The TPM and 5S Handbook for Suppliers was developed to standardize and strengthen the culture of Continuous Improvement among the Santa Maria Group’s partners and service providers. The material clearly and didactically presents the fundamental concepts of the TPM (Total Productive Maintenance) and 5S methodologies, with practical guidance for application in day-to-day operations.
• 5S rules, reinforcing the importance of organization, cleanliness, standardization, and discipline in the workplace.
• Practical example of equipment sizing, ensuring that chemical installations and equipment follow safety and efficiency criteria.
• Expected benefits, such as increased equipment reliability, cost reduction, safety, and operational efficiency.
The handbook reinforces the Santa Maria Group’s commitment to quality, safety, and operational sustainability, extending the principles of Continuous Improvement across the entire value chain.
TPM AND 5S HANDBOOK FOR SUPPLIERS
Every year, Santa Maria conducts a structured schedule of training and development programs focused on the technical and behavioral growth of its professionals. These trainings are open to both internal employees and thirdparty partners, reinforcing the company’s commitment to knowledge dissemination and the standardization of best practices across all areas of operation.
We believe that every individual within the Group, regardless of their role or employment type, makes a significant contribution to our results. Therefore, we aim to provide
learning opportunities that encourage shared responsibility for quality, safety, and operational efficiency.
In addition to formal training, our events and continuous improvement initiatives are inclusive, promoting team integration, experience sharing, and strengthening the corporate culture. This collaborative approach enables us to evolve together, fostering a more productive, safe, and aligned work environment that upholds the principles sustaining our organizational purpose.
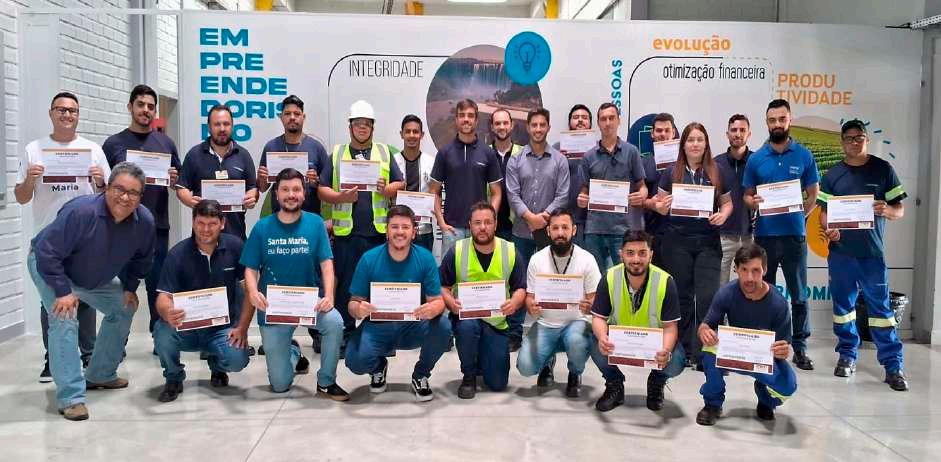
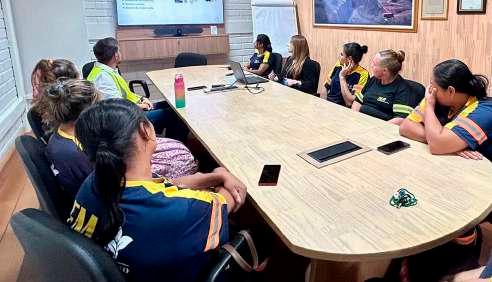
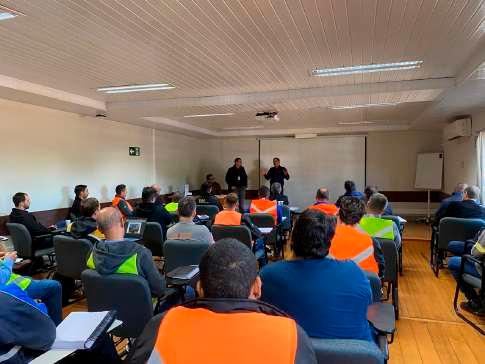
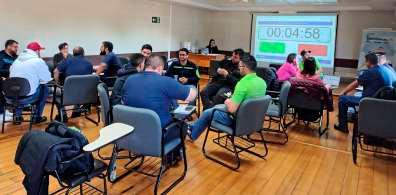
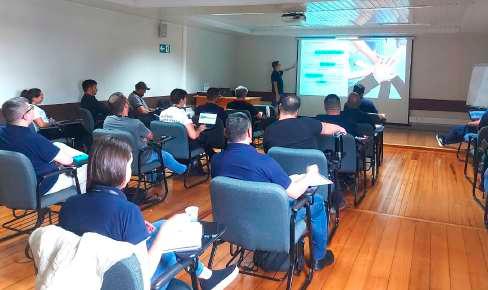
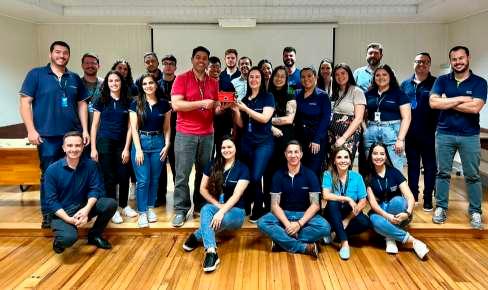
TPM Facilitator Training with the participation of employees from FM Maintenance. The objective was to train professionals in the methodology, strengthening the integration between internal and third-party teams. Currently, these employees serve as members of the TPM pillars, contributing to the standardization of practices and the advancement of continuous improvement within the unit.
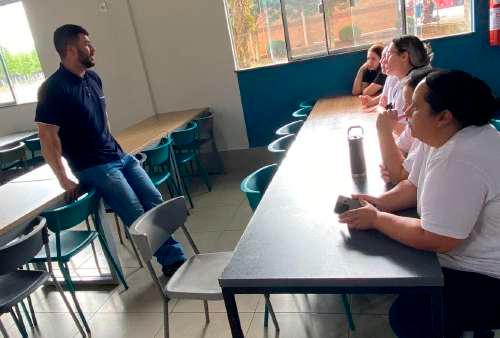
Practical training conducted in the restaurant area, focused on 5S and good hygiene practices in the kitchen, targeted at the Sapore team, responsible for providing over 400 meals daily. The initiative aimed to reinforce organization, cleanliness, and standardization of routines, ensuring food quality and safety in the environment.
5S Training Dedicated to the Cleaning Team
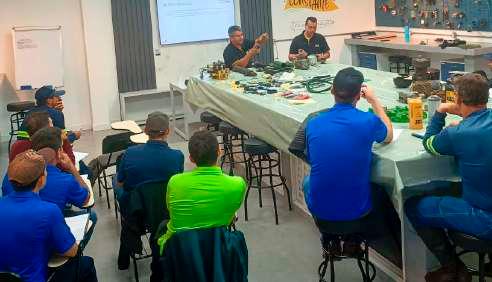
Mixed Maintenance Training for Santa Maria Team and FM Maintenance
PILLAR STRUCTURE
To identify losses and optimise processes through continuous improvement initiatives, with the objective of increasing the overall effectiveness of Santa Maria’s Paper Business Unit.
• To coordinate the execution of the 2023–2026 strategic planning cycle.
• To monitor and provide direction to the Paper Business Unit’s loss-reduction initiatives.
• To act as the custodian of improvement suggestions.
• To act as the custodian of continuous improvement tools
INDICATORS
Kaizens
SANTA MARIA STRATEGY PILLAR OBJECTIVES
Ensure operational efficiency
Achieve excellence in cost management
Strengthen innovation
Ensure the execution of process-oriented activities
Achieve EBITDA aligned with the business needs
Reduce Variable Costs by 3 MBRL
Increase OEE by 0.5%
Increase the implementation of improvement suggestions by 20%
Ensure the use of shelf tools in 100% of failure analyses.
4.1.6
INDICATOR CALCULATION MEMORANDUM
OEE - (Overall Equipment Effectiveness)
Budgeted Average Speed MIX (Gross Production) = Speed calculated using a weighted average, considering the budgeted gross production volumes of each paper and their respective budgeted speeds.
Actual Average Speed MIX (Gross Production) = Speed calculated using a weighted average, considering the actual gross production volumes of each paper and their respective actual speeds.
Sellable Production = Net production effectively available for sale and invoicing, after deducting losses, scraps, and internal consumption.
Gross Production = Total produced by the machine during the period, before any deductions, including sellable production, losses, scraps, and internal consumption.
Number of Improvements Generated
Number of Improvements Implemented
Number of Kaizen
MASTER PLAN 4.1.7
We developed and implemented quarterly plans from 2022 to 2025, focusing on the identification of losses, establishing criteria for measuring and valuing losses, defining the structure of the loss tree, and developing methodologies for loss elimination.
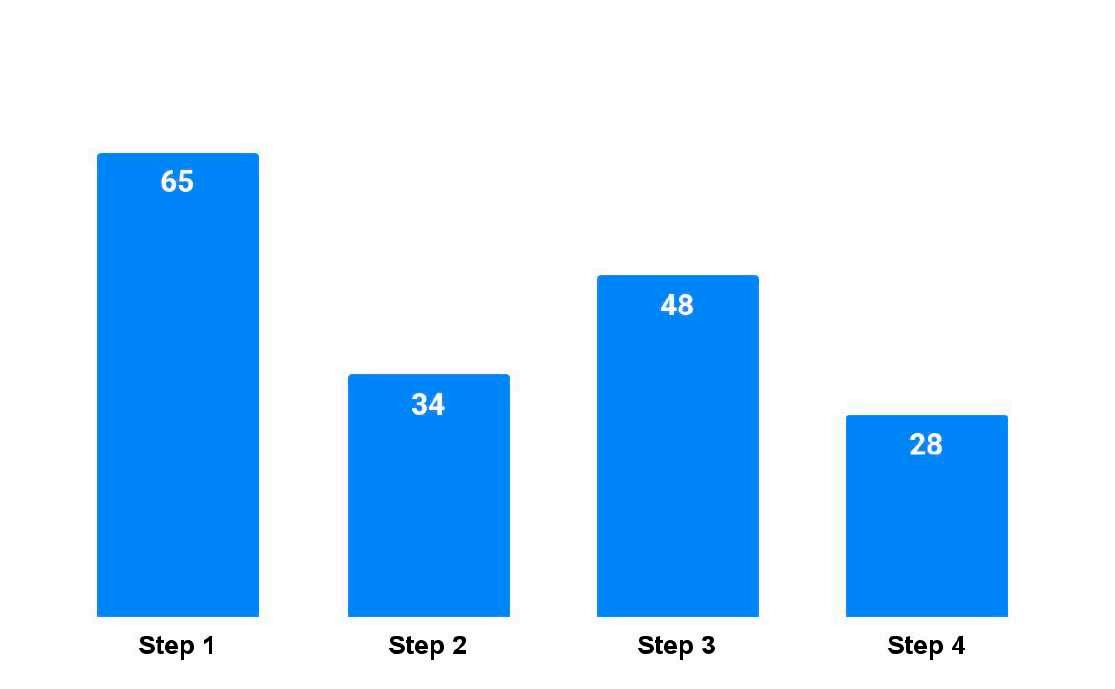
Step 1Determine the company’s losses
Step 2 - Define criteria for measuring and valuing losses
Identify the losses by hierarchy that will form the loss tree
Create a loss recording system
Structured loss tree with quantified losses
Structure the OEE calculation according to the dimensions: Availability, Performance, Quality
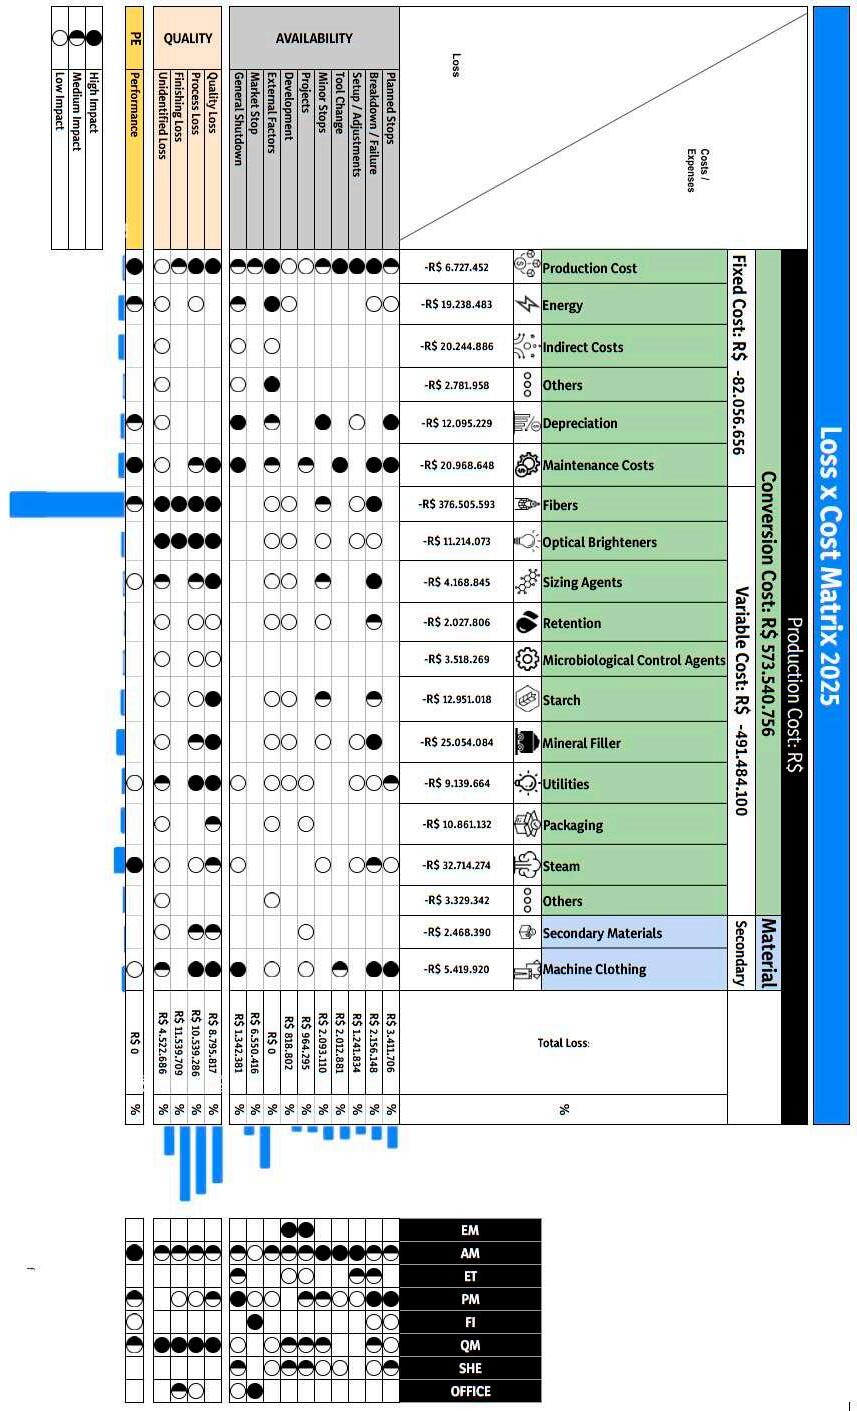
Establish the Loss vs. Cost Matrix
Seek and identify new losses, including measurement methods, valuation, and graphical representation in the loss tree
Define a data collection and monitoring system for the 3 biggest losses
Step 3 - Define the structure of the company’s loss tree
Step 4 - Develop methodologies for loss elimination
Train Area and Production Leaders in OEE management
Define the company’s analysis tools strategy
Determine criteria for using loss elimination tools
NEXT STEPS:
Loss reduction work
Improvement registration system
Validation and implementation of improvements / improvement groups
Insert a tracking dashboard for the Improvement Groups.
Create reports of expected return by project and actual return.
Return of projects reaching 90% of the expected.
Validation of VSM - Value Stream Mapping.
Define a tools template/model
Define the governance of improvement projects
Project management and governance
LOSS STRUCTURE AND ANALYSIS
DETERMINATION OF LOSSES 4.2.1
To define the losses in the plant, a study of the 8 significant losses was initiated, evaluating how these losses emerged throughout the production process. This helped internally establish a division of 12 Key Losses that better align with Governance, enabling better segregation and measurement of these losses..
Thus, it was possible to measure and identify that a large portion of the losses was associated with OEE (Overall Equipment Efficiency), with losses related to hours, product losses in tons, and cost management.
The 12 losses at Santa Maria are classified according to the definitions below
Scheduled Downtime for preventive maintenance, lubrication, and corrective actions (less than 10 hours in duration).
These failures/breakdowns are classified as losses that interrupt or deteriorate the equipment’s functions.
Machine stoppages that occur during product changeovers.
Downtime caused by equipment stoppages for tool changes and other devices that experience natural wear.
Downtimes resolved with simple and quick actions, not related to maintenance.
Downtimes caused by project execution time and/or failures after implementation.
Losses caused by development time or breakdowns/failures after the implementation of new product development.
Breakdowns/failures that occur due to external factors such as power fluctuations, logistical failures, weather conditions, and unavailability of utilities.
The performance rate compares the actual speed with the budgeted standard speed for each product and grammage.
Quality tells us how many items of acceptable quality were produced in relation to the total production.
Annual inspection of regulatory standard items, predictive and corrective maintenance of longer duration, as well as the implementation of improvements and projects.
Downtime due to lack of orders or suspension of operations for adjustments in the production plan due to supply and demand.
4.2.2
LOSSES VALUATION
In addition to a clear concept, clarity was also required in determining the financial value of each loss. For this, a calculation sheet was created that allows for determining the financial dimension of the loss, with the calculation base validated by the Controllership.
Losses
Scheduled Downtime
Emergency Maintenance
Setup
Tool Changeover
Minor Stoppage
Project Downtime
Development
External Factors
General Shutdown
Market-related Downtime
Performance
Calculation Report
Machine Downtime Hours *Loss Valuation Index
Quality Lost Tons * Opportunity Cost (Loss Valuation Index)
4.2.3
OEE LOSSES IMPLEMENTATION
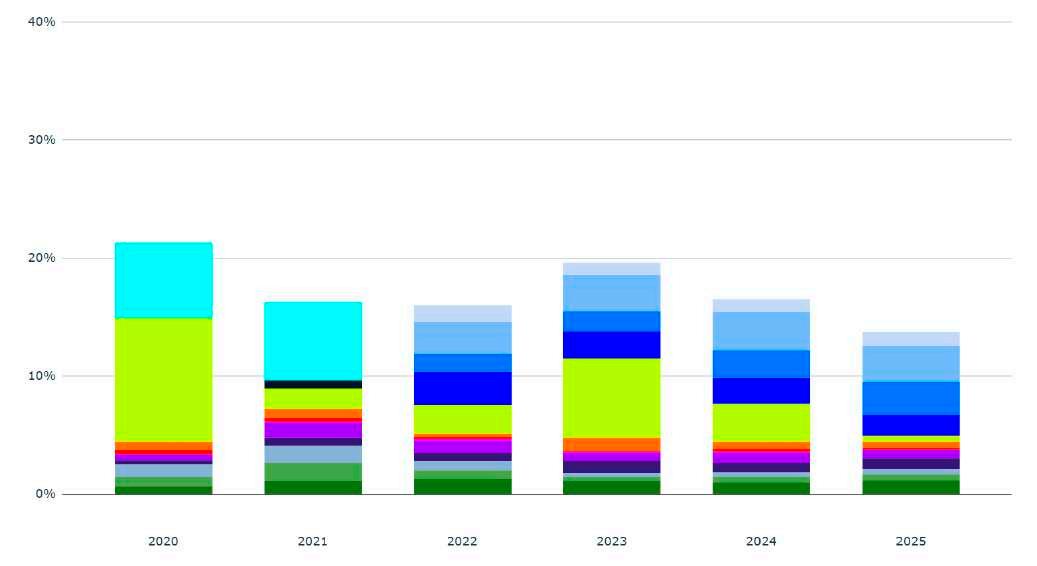
Based on the definition of significant losses, the results are monitored monthly for each machine group. This allows for the comparison and evaluation of significant losses over the months and years.
With the losses evaluated, we can direct improvement groups towards the most significant losses, prioritizing and focusing efforts throughout the year on the losses that have the greatest impact on OEE.
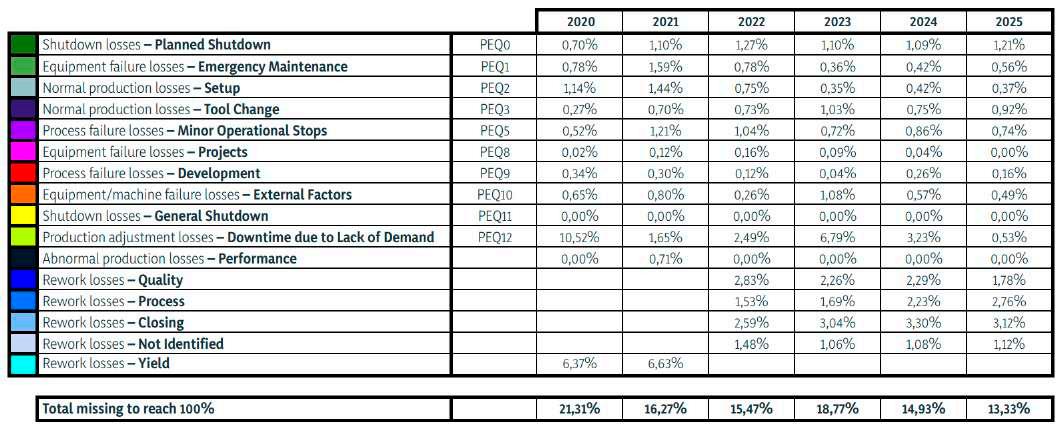
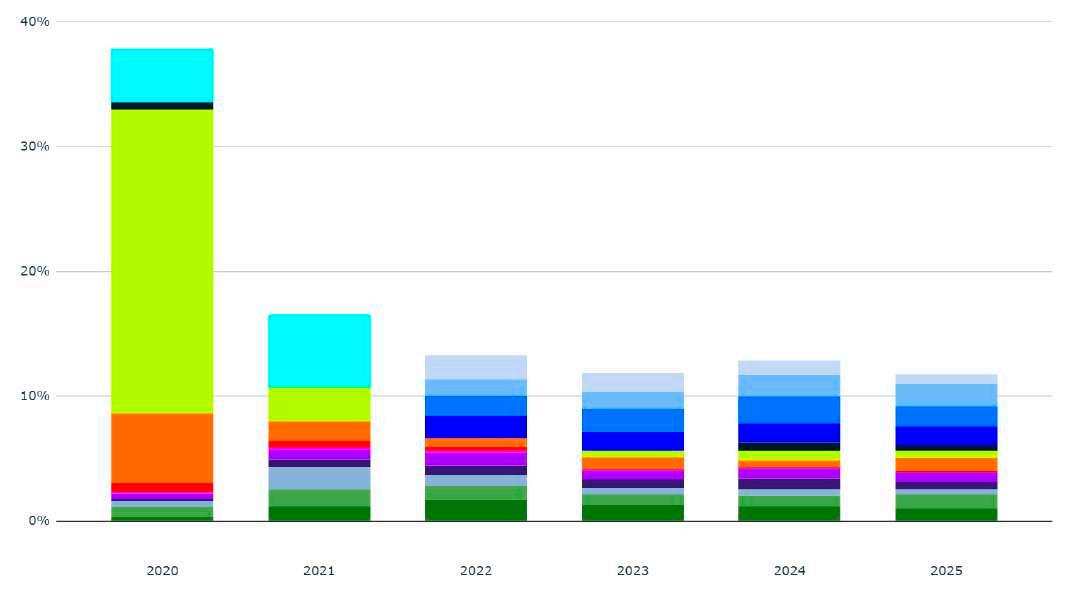
4.2.3.1 LOSS TREE PAPER MACHINE 1
OEE LOSS TREE - PAPER MACHINE 1
37,45% REDUCTION
COVID-19
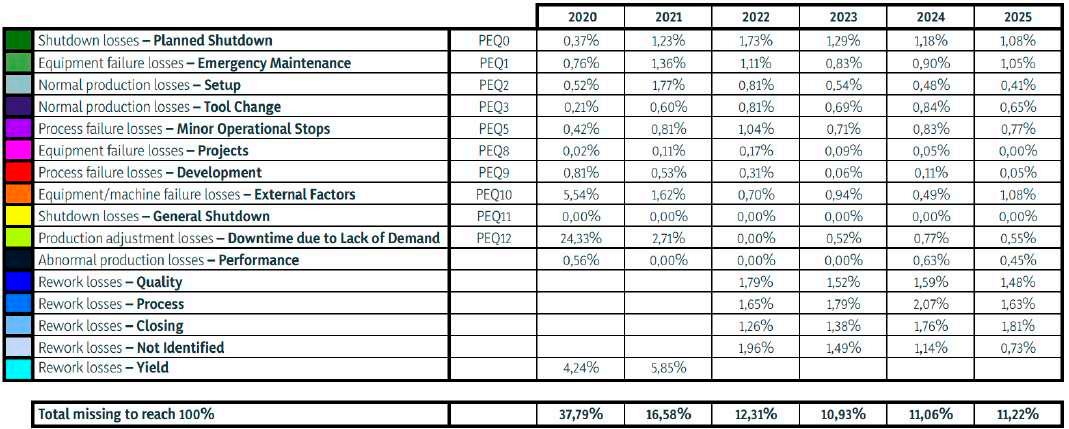
4.2.3.2 LOSS TREE PAPER MACHINE 2
OEE LOSS TREE - PAPER MACHINE 2
70,31% REDUCTION
COVID-19
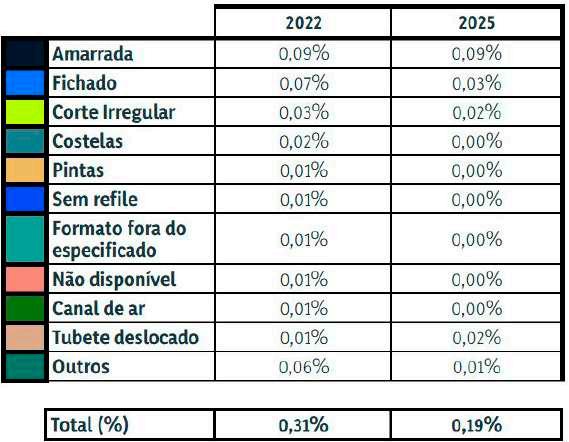
LOSS TREE - PILOT LINE (REWINDER MP2)
Tied
Clipped Irregular Cut
Ribs
Spots
IMPROVEMENT GROUPSPILOT LINE
Untrimmed Out of Spec Dimension Not Available
Air Channel
Core Misaligned
Others
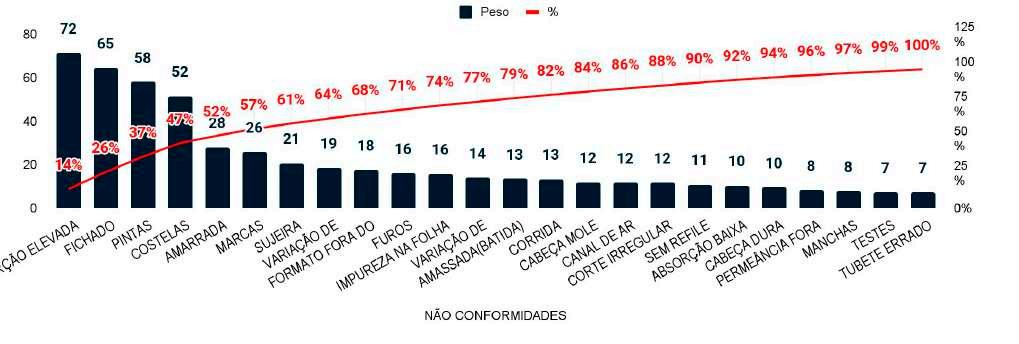
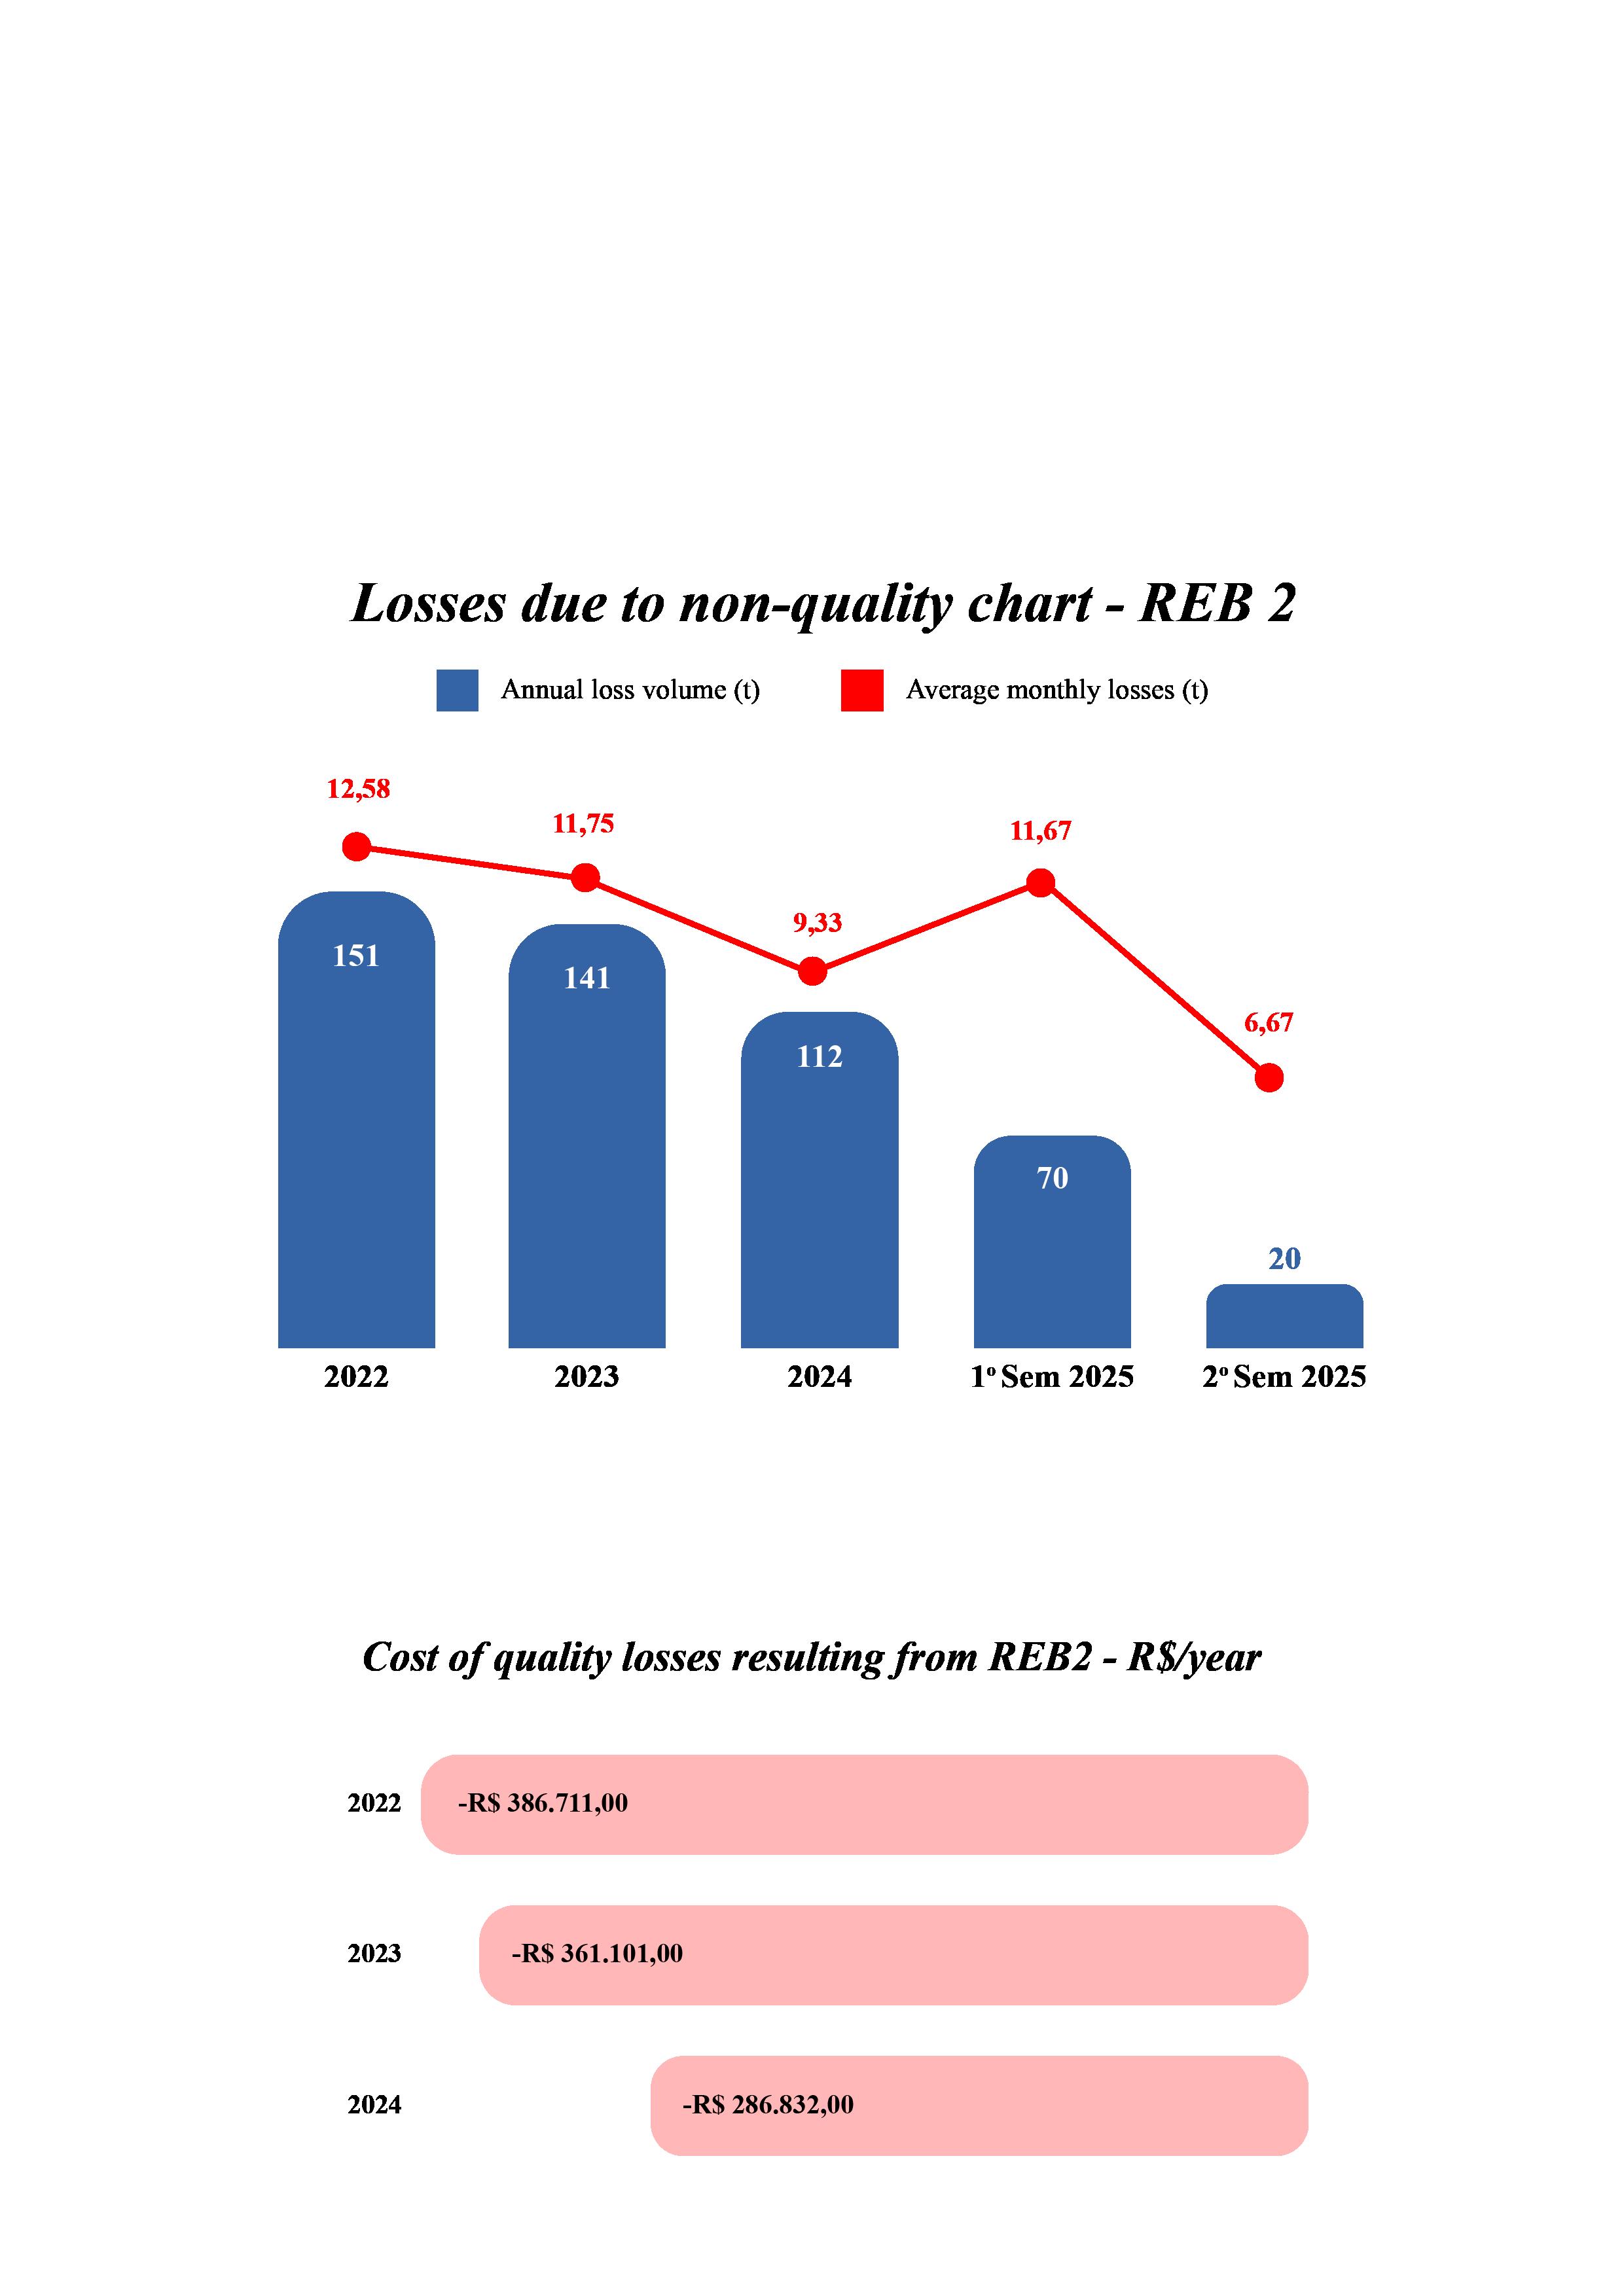
The Rewinder MP2 has only quality losses.
4.2.4
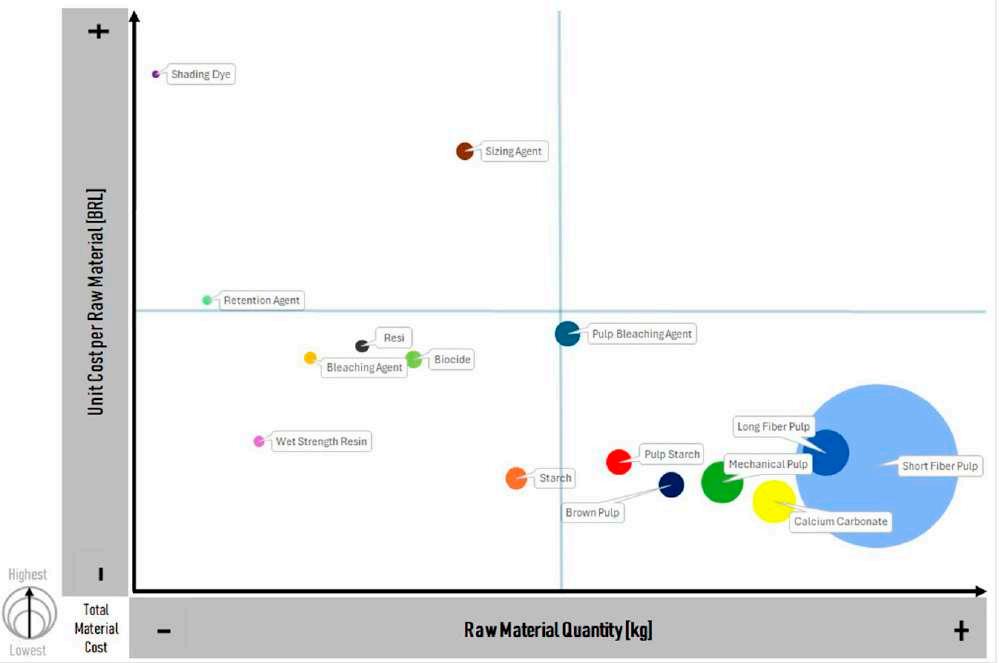
COST IMPACT MATRIX
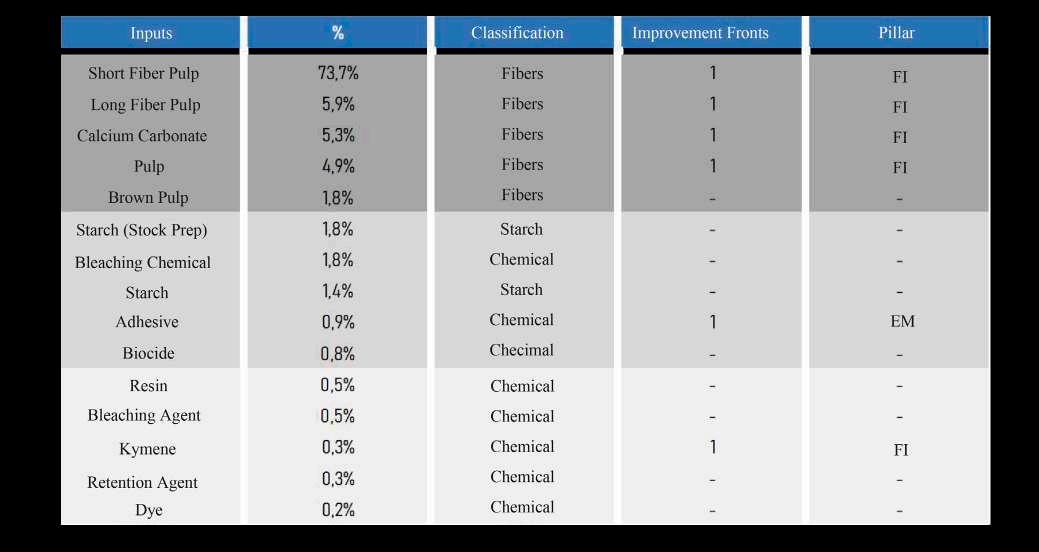
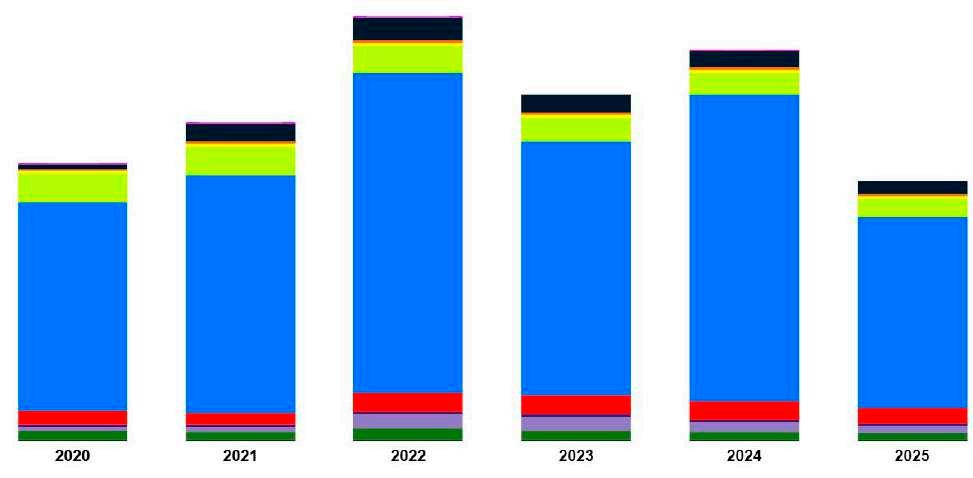
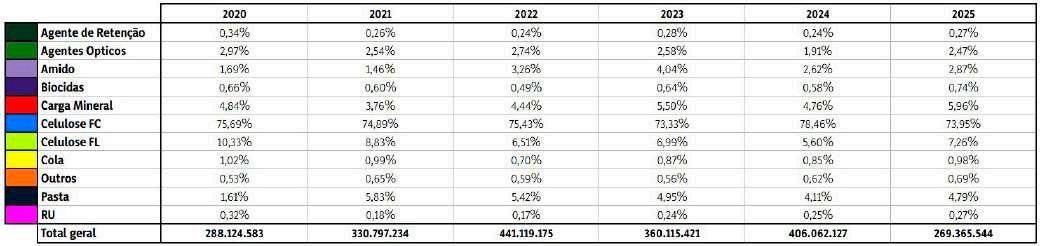
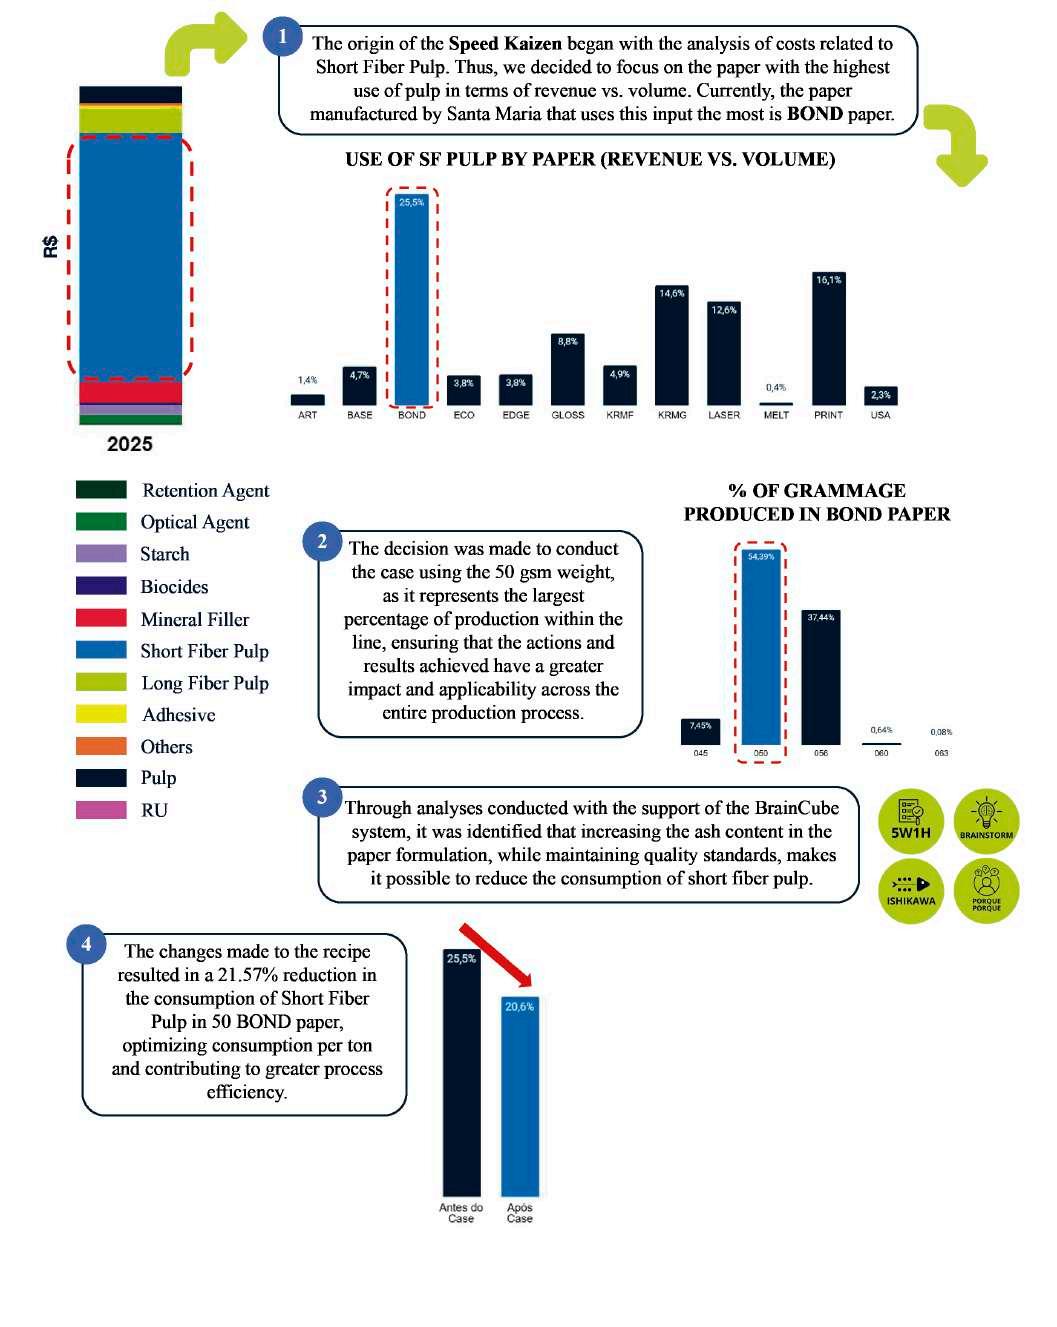
The following matrix demonstrates the behavior of Variable Costs in relation to the quantity of inputs used, highlighting the degree of impact of each item on the total cost of the production process.
4.2.7
VARIABLE COST
For better cost management, the ME Pillar established the monitoring of losses related to raw materials through the Variable Cost indicator.
Our strategy has been based on addressing the largest components of conversion costs in order to reduce both inflationary impacts and the effect of the dollar exchange rate on the plant’s costs.
In 2025, the Specific Improvement (ME) Pillar, in partnership with various areas, developed initiatives focused on improving control and reducing conversion costs. These initiatives range from working groups to strategic actions.
The Focused Improvement (FI) Pillar works in partnership with other Pillars, providing support through tools to reduce conversion costs. The FI identifies opportunities related to the conversion cost indicator, assists in prioritizing investments, sponsors improvements, and also provides methodology and governance for monitoring activities.
GOVERNANCE INDICATOR
4.3.1
LOSS ANALYSIS
FREQUENCY
The losses presented in the Loss Tree are discussed at various times throughout the day, week, or month, with a sequence of discussion levels shown below:
4.3.2
ROUTINE MANAGEMENT FLOW
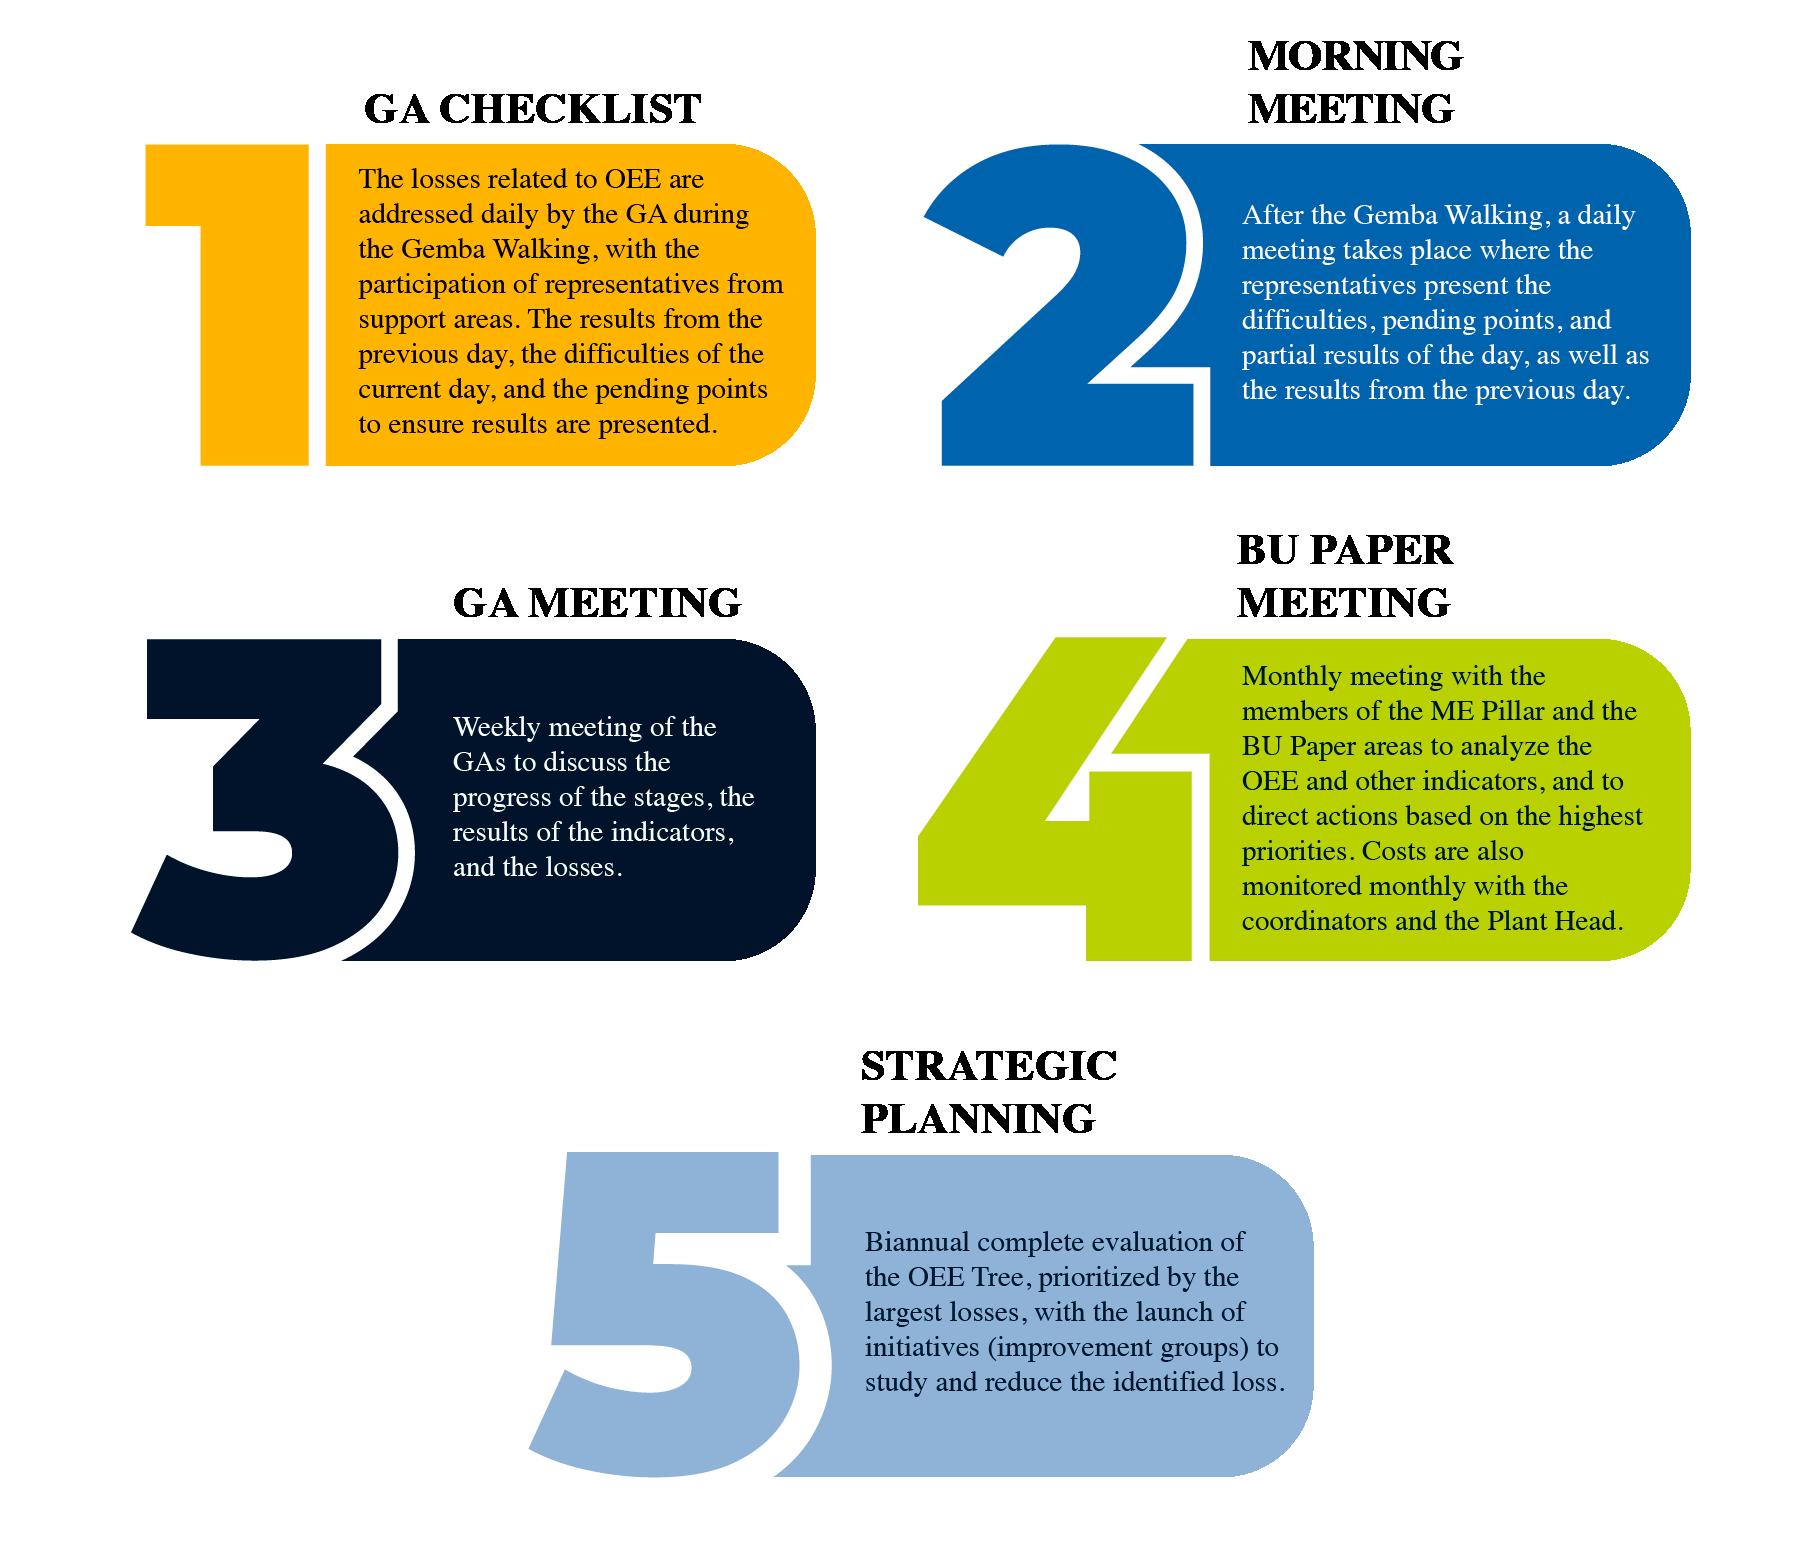
For more effective Routine Management, the Checklist is performed at the start of the day to identify the day’s needs aimed at achieving the indicators, as well as to discuss the results from the previous day. This is followed by the Morning Meeting, which has the main objective of daily alignment between the operational and support areas of the unit, promoting clear communication, quick identification of deviations, and the definition of effective corrective actions. Representatives from the Safety, MP1, MP2, Coater, Utilities, Maintenance, PCP, and Quality areas participate.
During the meeting, each area presents the following topics in a concise manner:
Summary of the previous shift and current status of the area
Critical or out-of-standard occurrences (anomalies)
Performance and productivity indicators
Support needs between areas
Ongoing action plans or new initiatives started
4.3.3
OEE GOVERNANCE TOOL
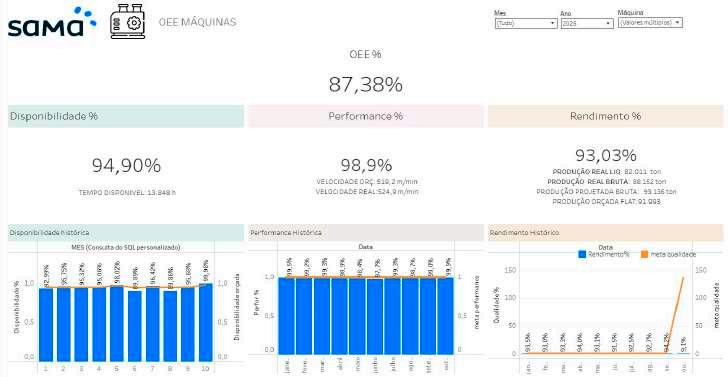
With the goal of ensuring Governance, OEE is managed through the Tableau system, enabling immediate verification of results and greater transparency in activity control.
CHECKLIST
MORNING MEETING
DEFINING METHODOLOGIES FOR LOSS ELIMINATION
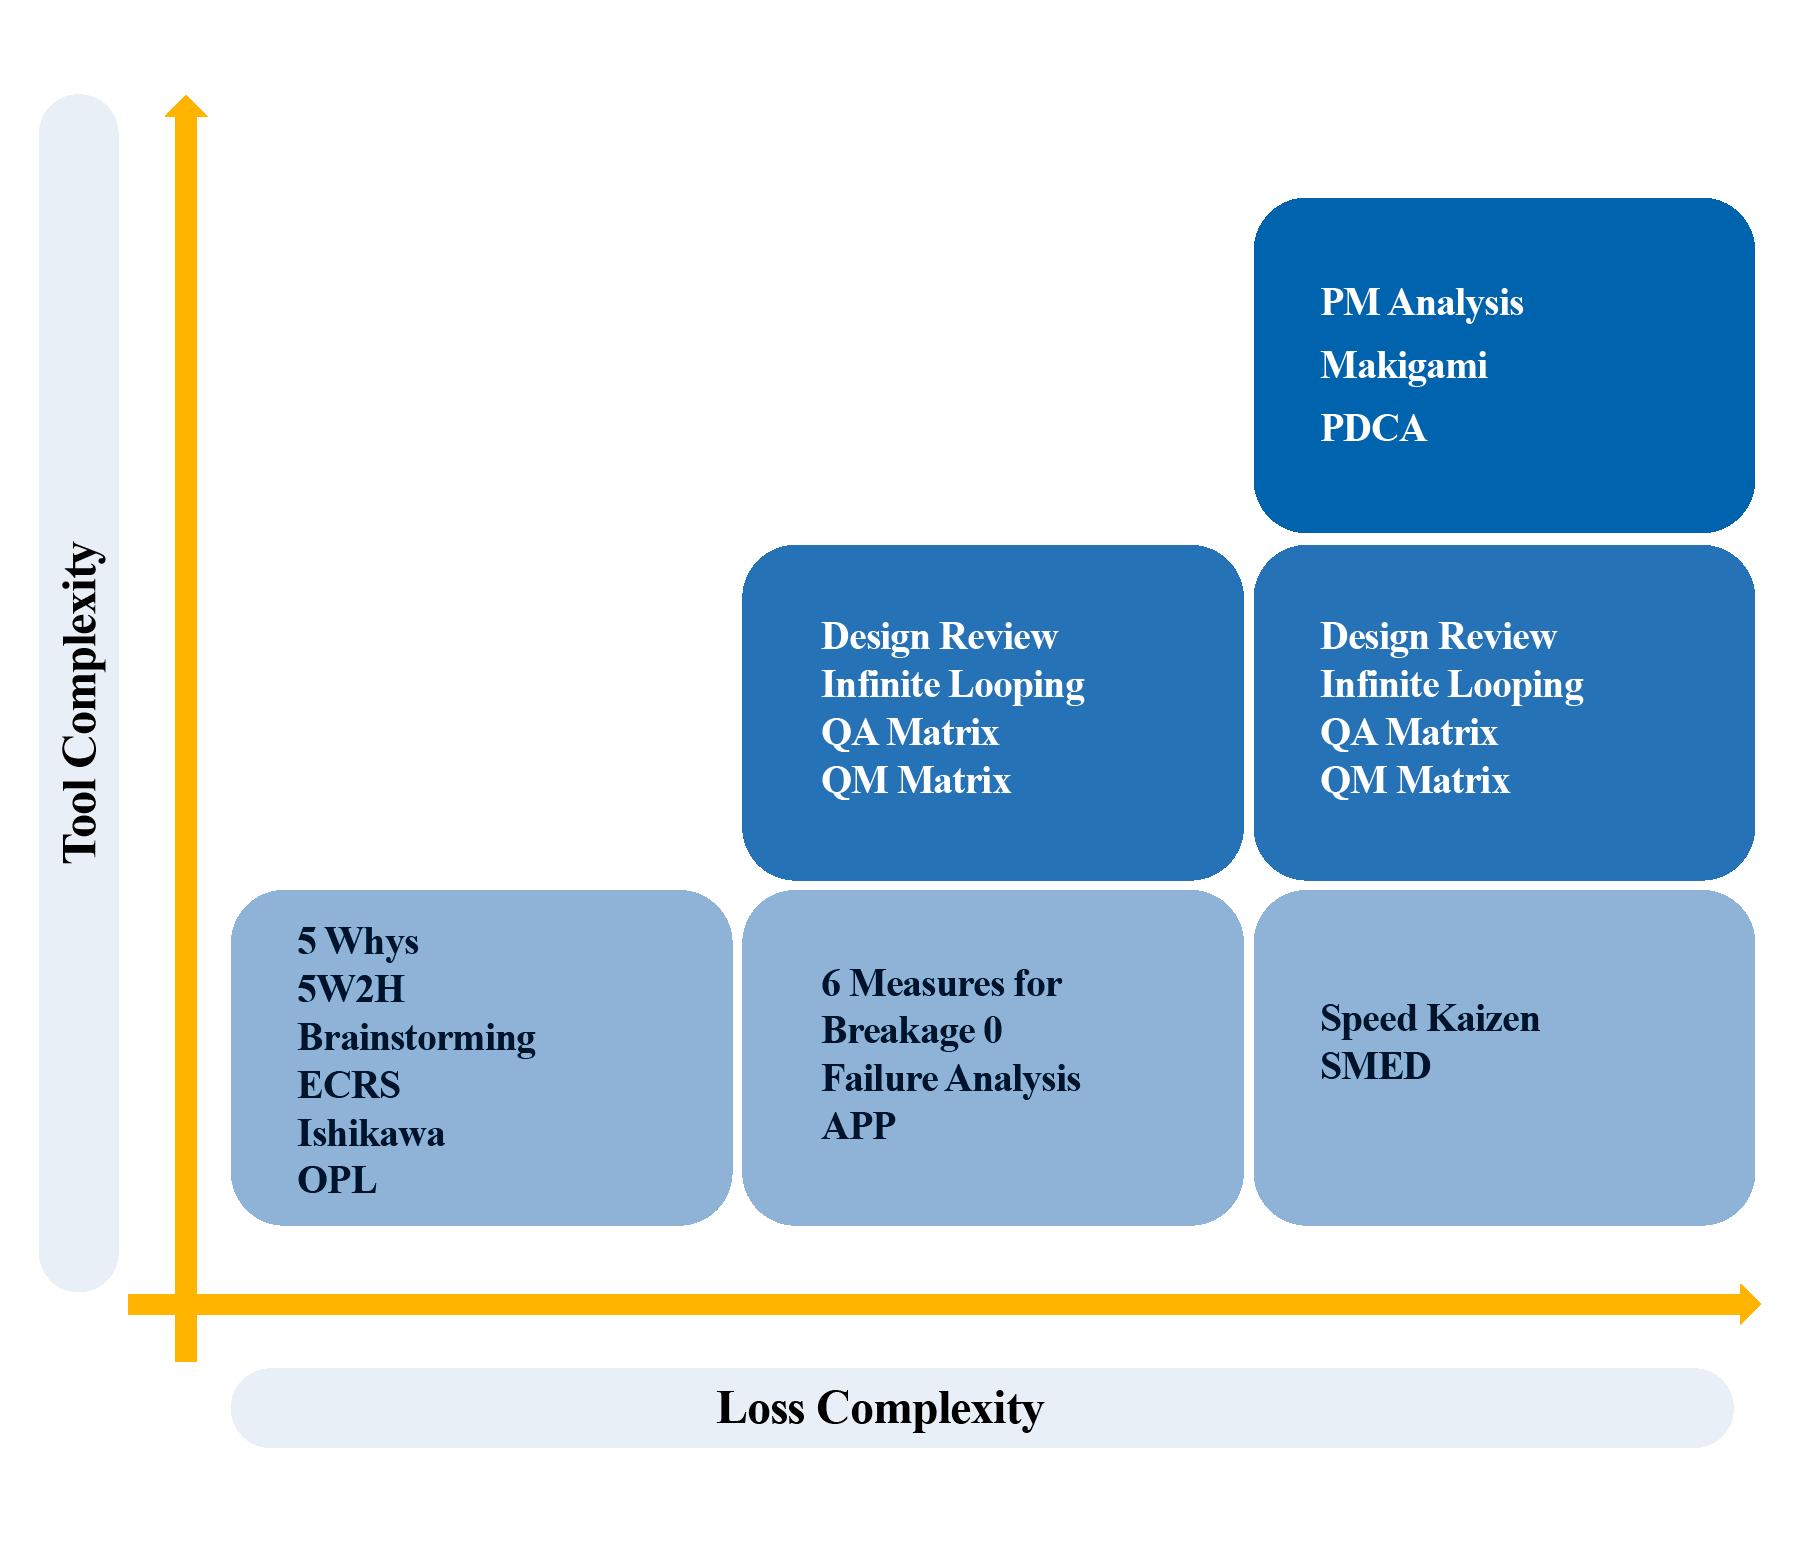
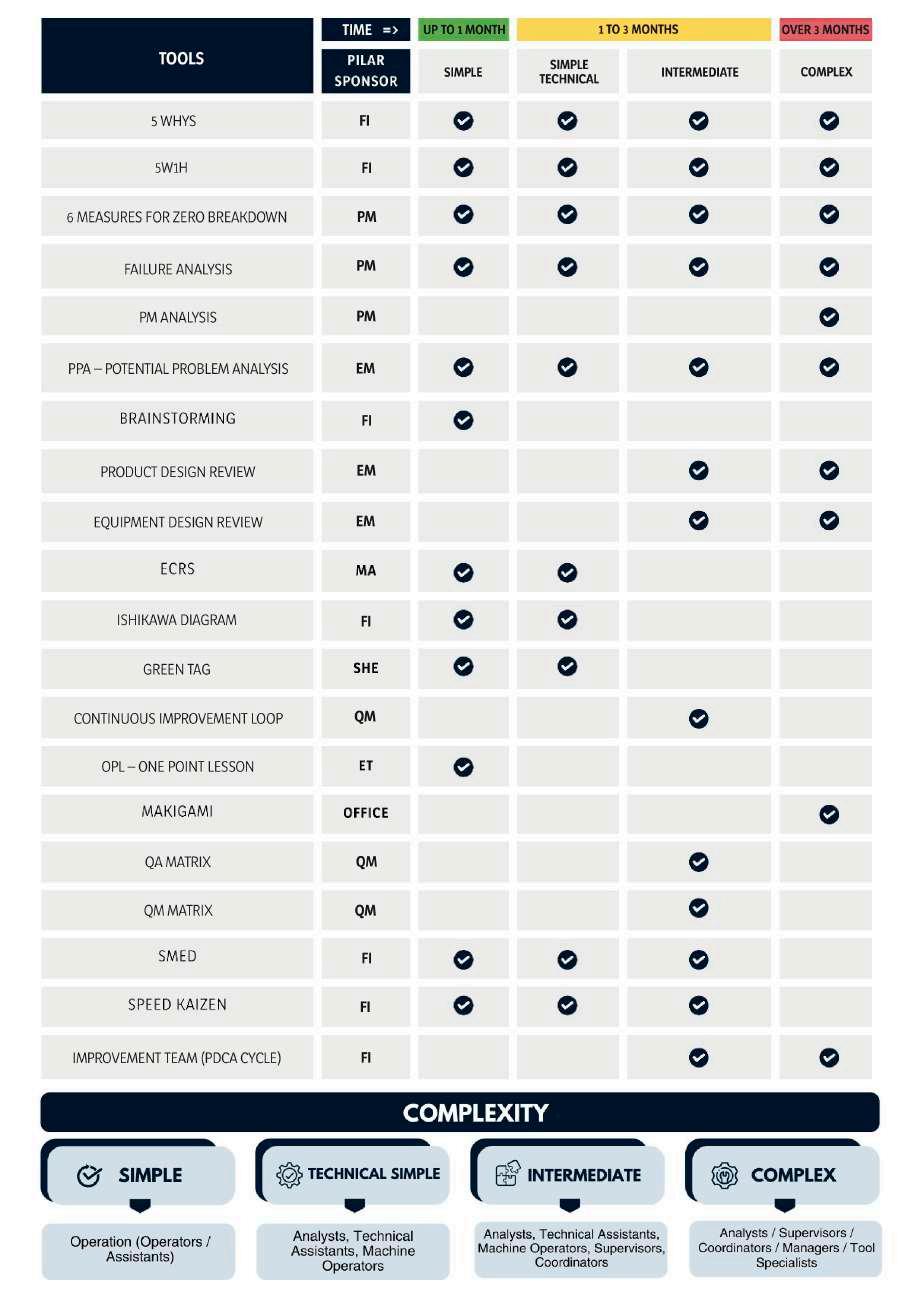
The losses identified through the Loss Tree or indicator analysis are addressed by launching improvement groups/initiatives, which may use tools ranging from simple and quick analysis methods to highly complex tools that evaluate unknown causes.
And to ensure greater accuracy in defining which tool should be used, there are diagrams and matrices that assist in this selection.
The diagram above shows, based on the tool complexity level in relation to the loss complexity, which tools would be most suitable to be used.
By cross-referencing this information with the following matrix, which shows the Significant Losses and the corresponding tools, the selection of the tool to be used for a specific loss becomes increasingly coherent.
In addition to the relationship between Significant Losses and tools, we also have a relationship between losses and Pillars, as all significant losses are related to costs and/or OEE, with stronger relationships in some areas and weaker ones in others, depending on each Pillar.
4.4.1
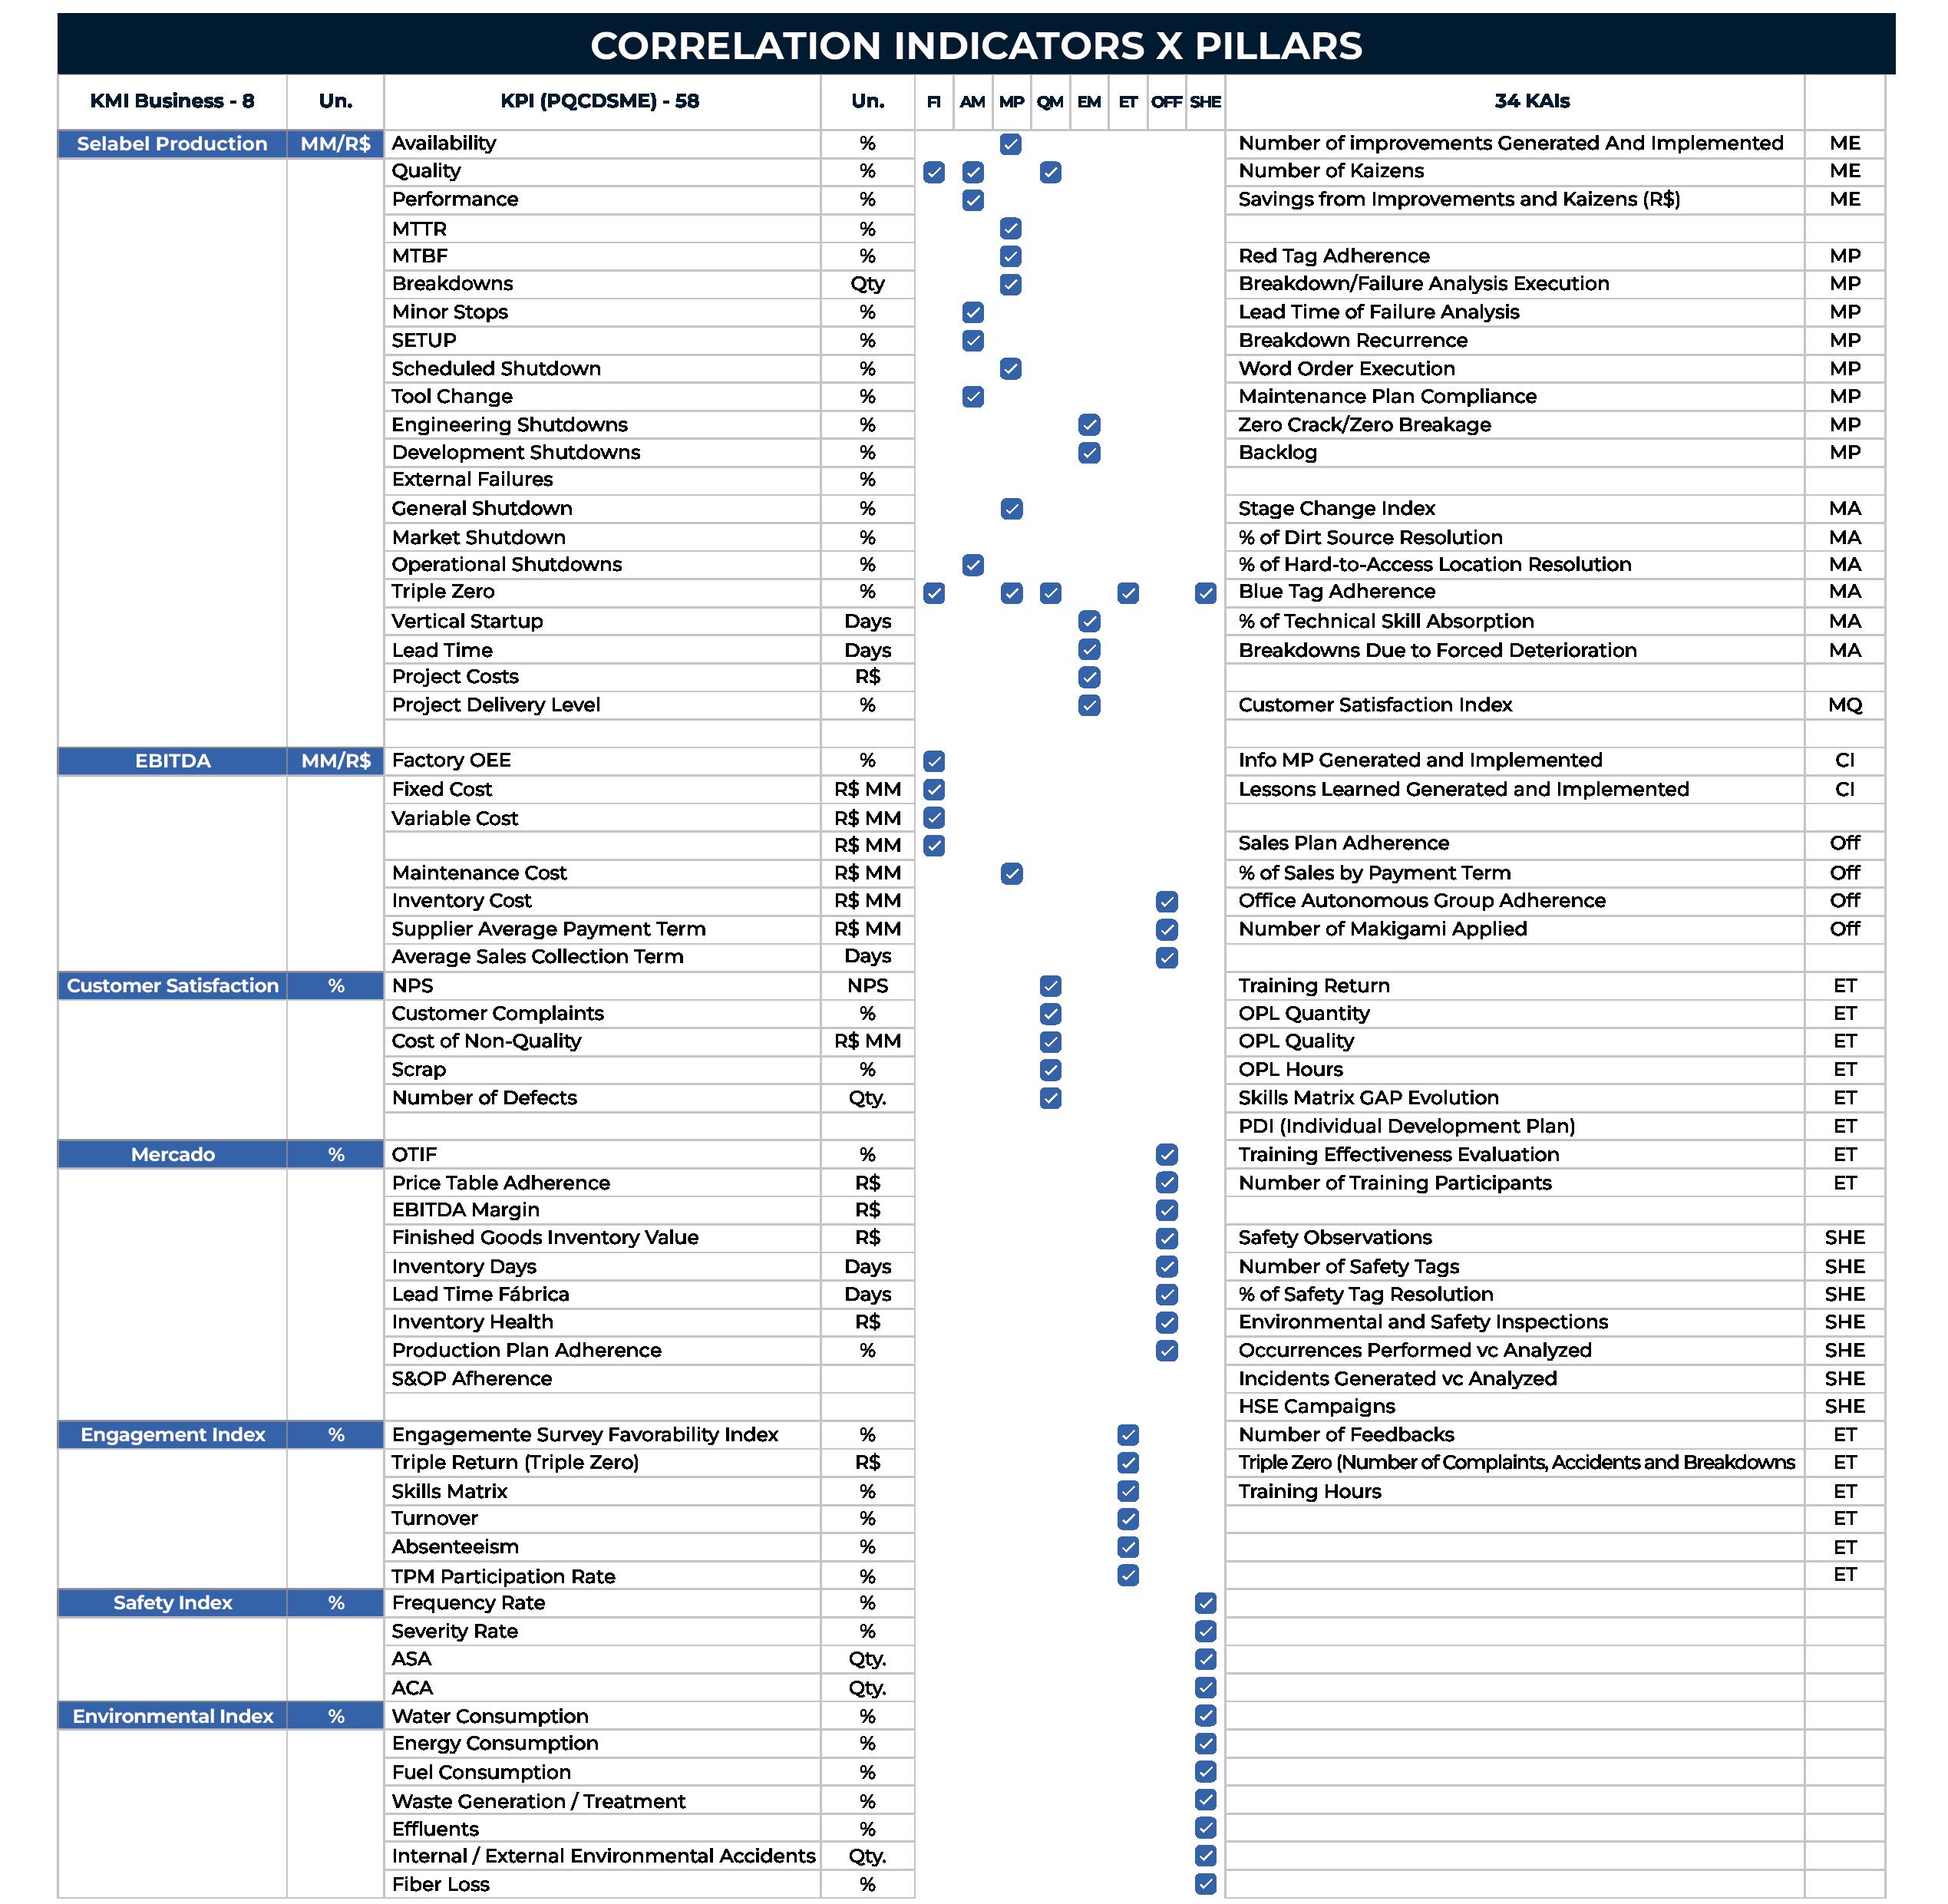
INDICATORS X PILLARS CORRELATION
(PQCDSME)
In addition to the fronts originated from the evaluation of the Loss Tree, there are fronts led by working and improvement groups promoted by the Pillars linked to indicators such as Safety and Market. All these initiatives are also managed through the Indicator X Pillar Correlation, being connected to their respective indicators to achieve better results.
Business Strategy
Indicators Pillars
CORRELATION INDICATORS X PILLARS
These indicators are linked to the company’s Strategic Planning, unfolding into actions in operations, maintenance, and other areas.
STRATEGIC PLANNING
The Strategic Planning of the Santa Maria Group is structured based on the Balanced Scorecard (BSC) methodology, which translates the organization’s strategy into clear and measurable objectives. These objectives are organized into four perspectives — financial, customer, internal processes, and learning and growth — ensuring a balanced and integrated view of business performance.
To ensure continuous monitoring of the strategy, monthly meetings are held with the leadership of the areas. During these meetings, performance indicators linked to the strategic objectives are presented, along with the progress of the action plans defined to achieve them. These meetings play a key role in strategy management, allowing for the evaluation of progress, adjustments to the course when necessary, and keeping everyone aligned with the Group’s direction.
4.4.2
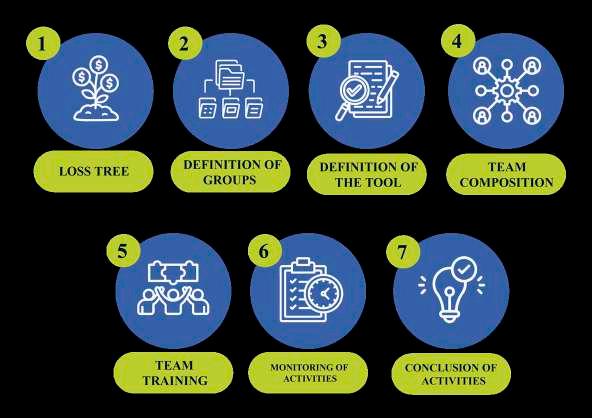
LAUNCH AND MONITORING OF IMPROVEMENT GROUPS/INITIATIVES
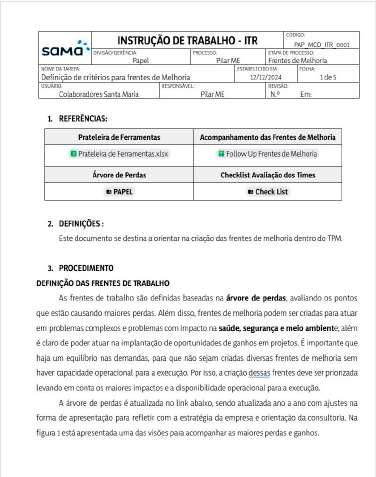
As mentioned in item 4.4, losses are identified through the Loss Tree and are addressed by launching improvement groups/initiatives. Before launching a group, the ITR ‘Definition of Criteria for Improvement Fronts’ is used for guidance on the correct procedure to begin the work. Items such as the following are addressed:
When an improvement group or initiative is launched, Follow-Up is used for breakdown and planning, where the scope, cause and impact analysis are determined, in order to compare and manage the groups/initiatives.
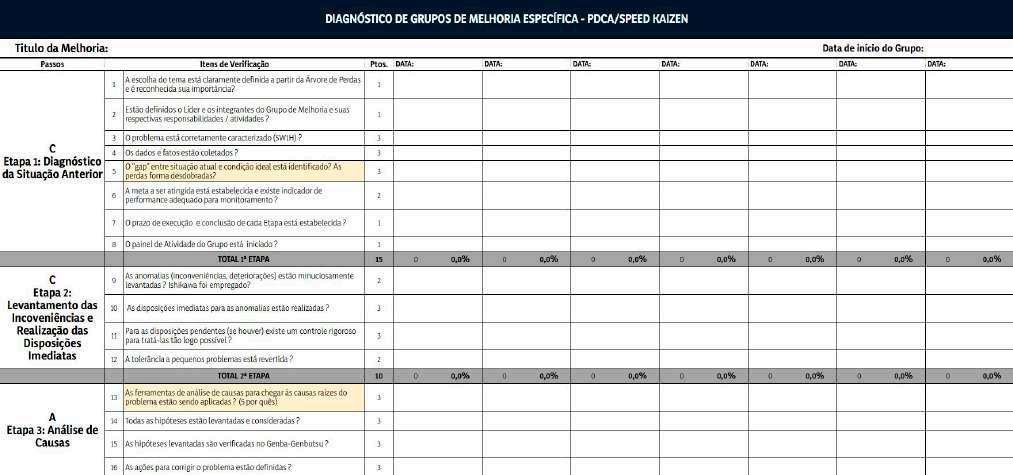
A monthly follow-up is also carried out through a structured checklist, containing questions that assess the current stage of the group at each step and identify any pending items necessary for progress.
Pillars
Tools
Steps
4.4.3
FOLLOW-UP OF THE RESULTS OF IMPROVEMENT GROUPS/INITIATIVES
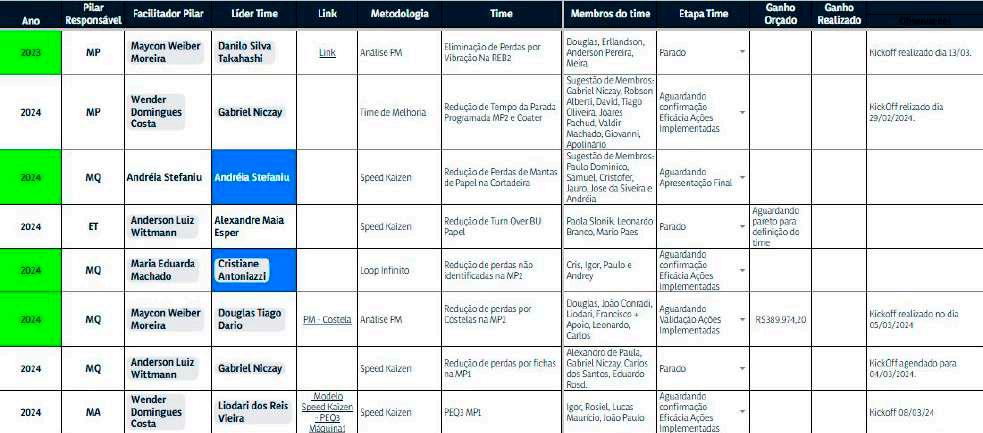
Each improvement group/initiative is monitored through the Follow-Up Improvement Fronts spreadsheet, where it is possible to track the indicators, as well as the financial return being captured throughout the development of the initiative.
To ensure the proper execution of the method applied in each improvement group, that progress is on track, and results are being collected, a monthly presentation is held with the presence of the ME Pillar team, Continuous Improvement team, and the improvement front team.
During this presentation, a checklist is used to evaluate the group, which includes all the items necessary for the correct progress of the team and the expected results.
In this way, all sponsors are present to provide the necessary support to each team, ensuring the success of the initiative.
EXISTING CHECKLIST FOR THE FOLLOWING TOOLS:
ENGAGEMENT
4.4.4
IMPROVEMENT GROUPS EVOLUTION
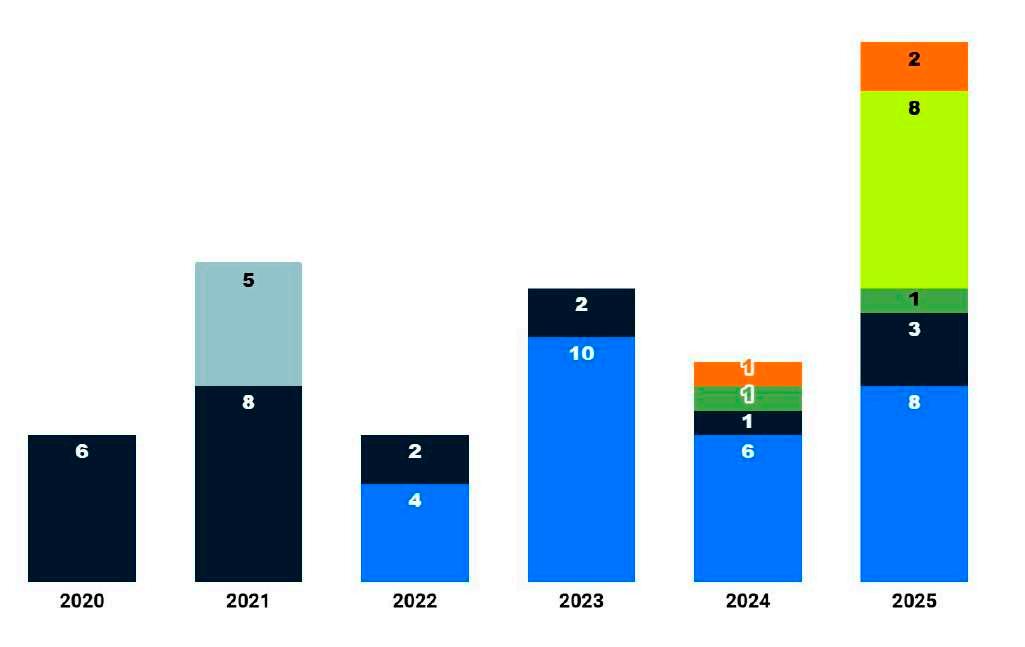
Improvement groups are defined based on the most significant losses from the Loss Tree.
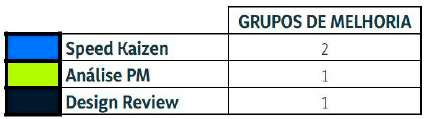
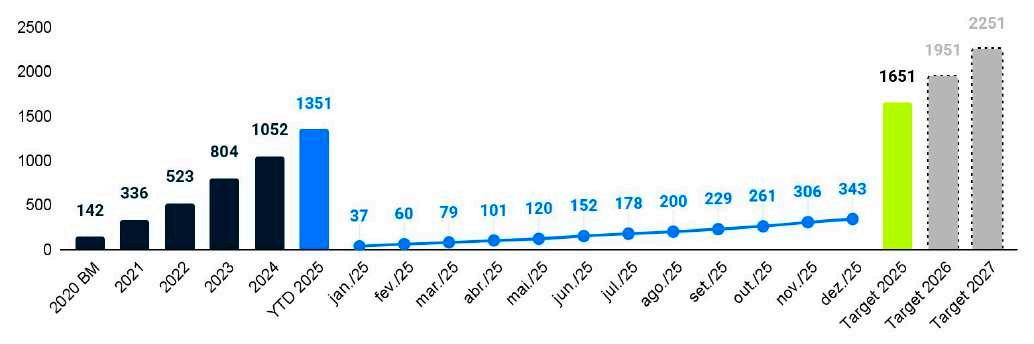
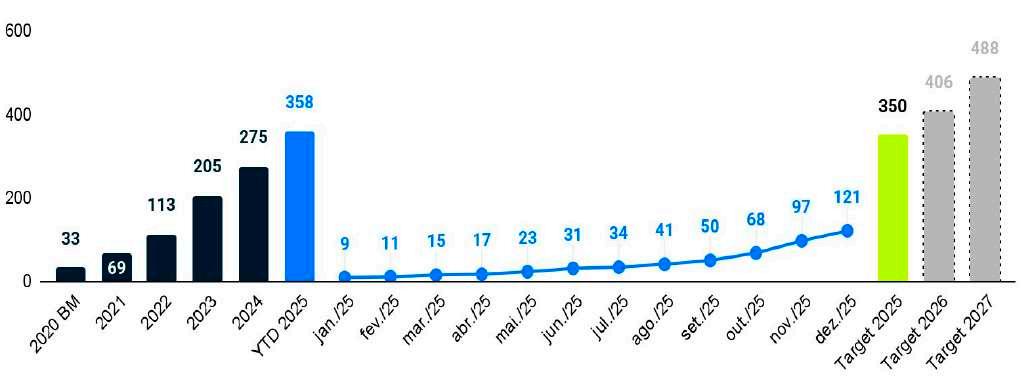
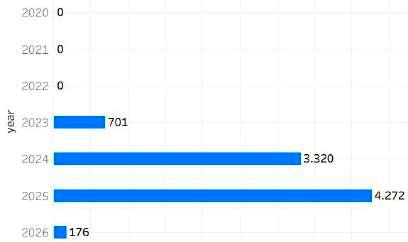
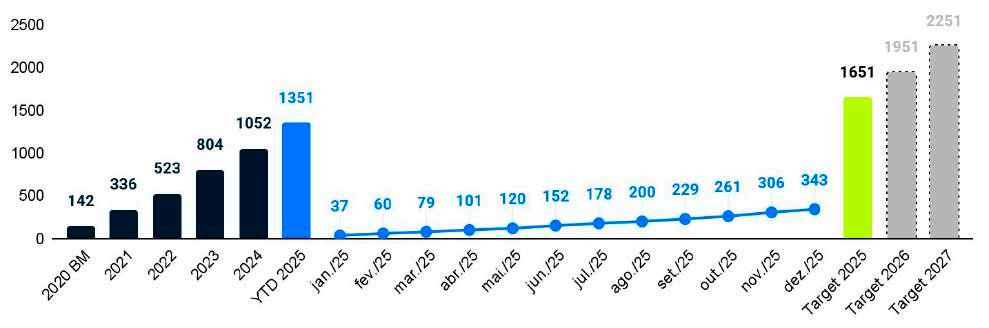
Below, we have the number of improvement groups related to the significant losses from the Loss Tree, where we can observe a 266% increase in the number of BM improvement groups compared to the forecast for improvement groups in 2020.
GROWTH IN THE USE OF IMPROVEMENT GROUPS OVER THE YEARS
IMPROVEMENT SUGGESTIONS
The “Santa Ideia” improvement suggestion platform, created in 2020, allows employees to submit their ideas for improvements within the company.
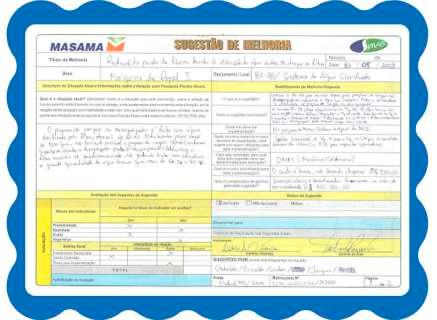
Before the automation of the improvement suggestion process, suggestions were submitted through a printed form, where all the details were manually filled in by the employees responsible for the submission.
IDEA
FLOW STANDARD FORM
APPROVAL
EXECUTION
Throughout the entire TPM implementation, at each stage, suggestions for improvement arise with the goal of benefiting employee safety, the production process, and product quality. These suggestions range from cost reduction, increased productivity, innovative ideas, and so on.
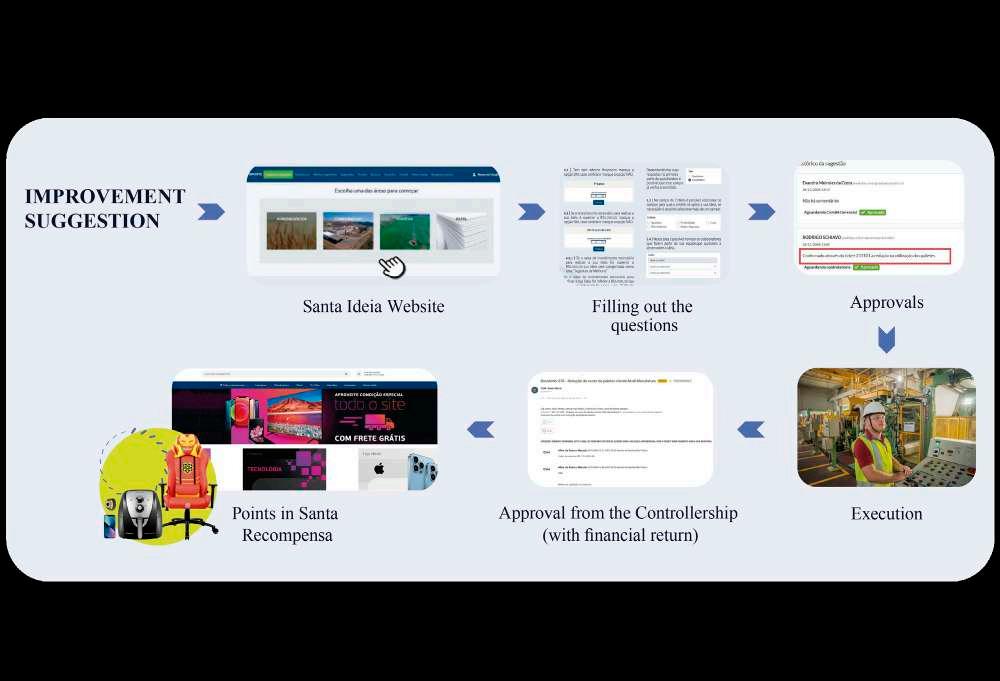
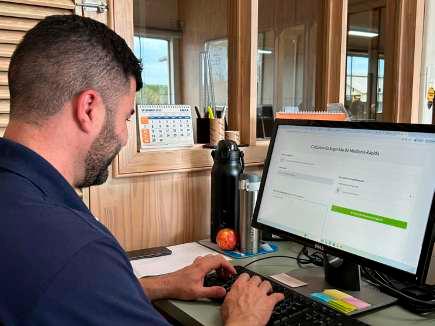
The method developed to capture these ideas was through a platform created for Santa Maria, called Santa Ideia.
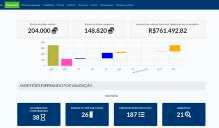
Santa Ideia involves filling out a standard electronic form in which the person who generated the idea can describe the suggested improvement, including photos and/or files related to the idea. It is also used to track the improvements that have been implemented.
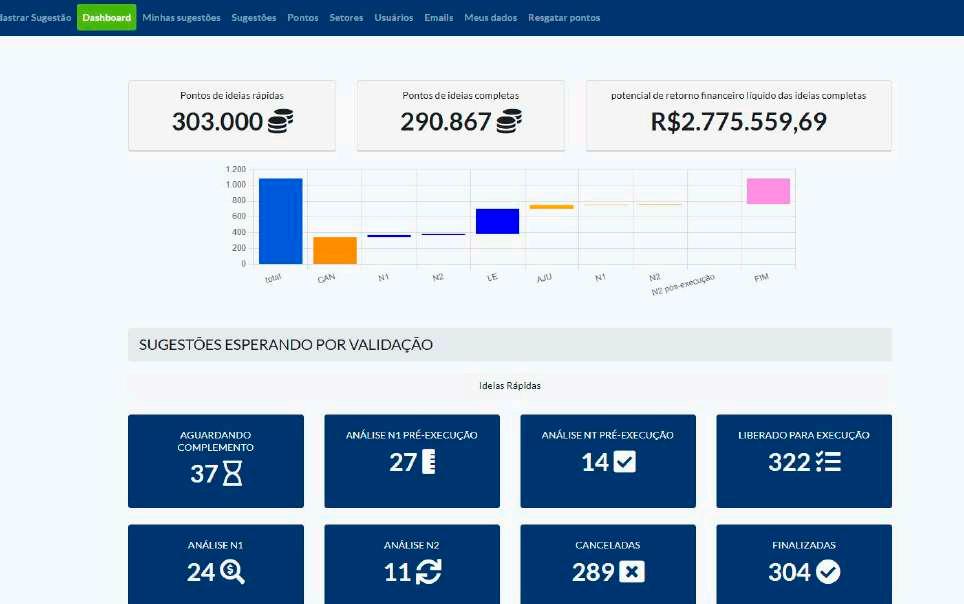
DASHBOARD
NUMBER
OF SUGGESTIONS IN EACH STATUS
Santa Ideia in Use
4.5.1
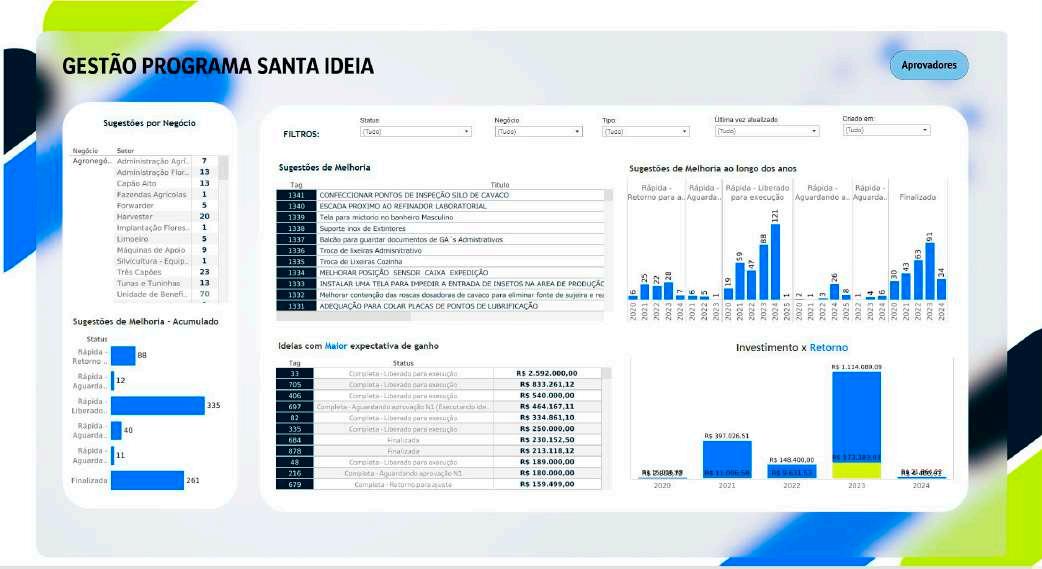
DEVELOPED IMPROVEMENT SUGGESTIONS
SANTA IDEIA PROGRAM DASHBOARD
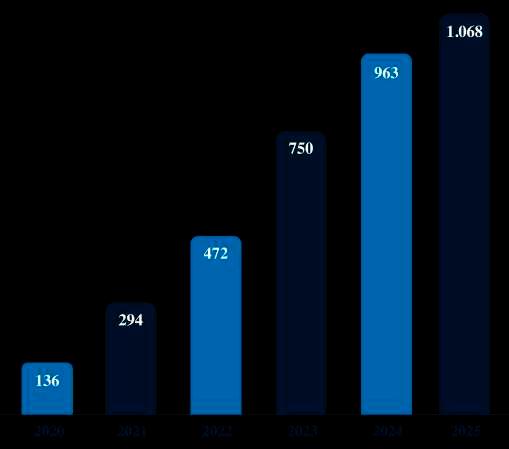
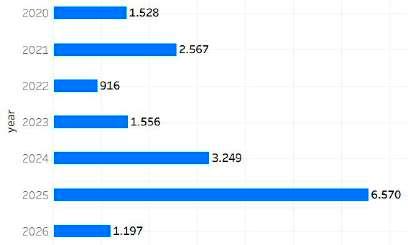
IMPROVEMENT SUGGESTIONS DEVELOPED FOR THE PAPER BUSINESS OVER THE YEARS (CUMULATIVE)
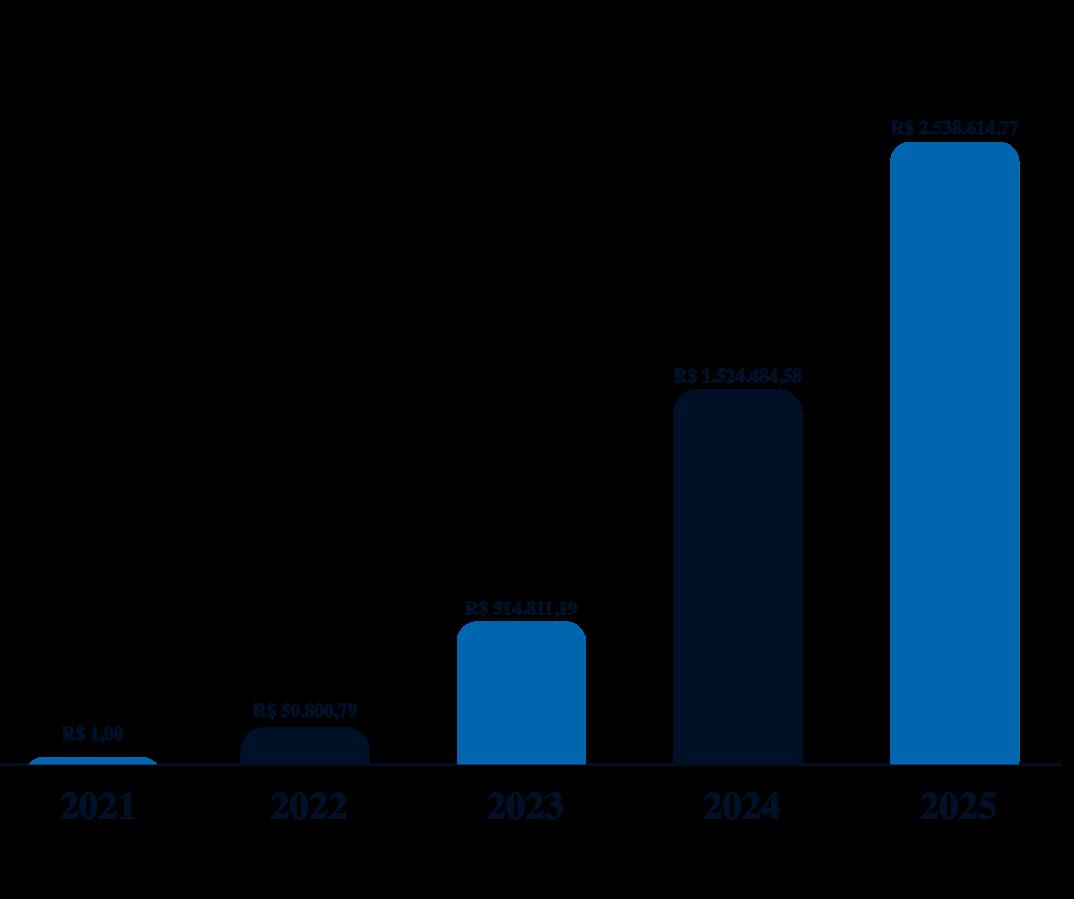
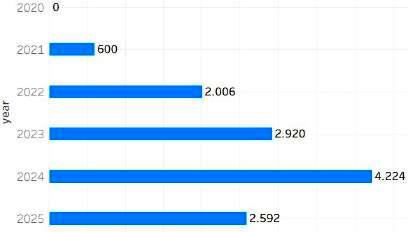
SAVING OF IMPLEMENTED SUGGESTIONS FOR THE PAPER BUSINESS OVER THE YEARS (CUMULATIVE)
IMPLEMENTED IMPROVEMENT SUGGESTIONS 4.5.2
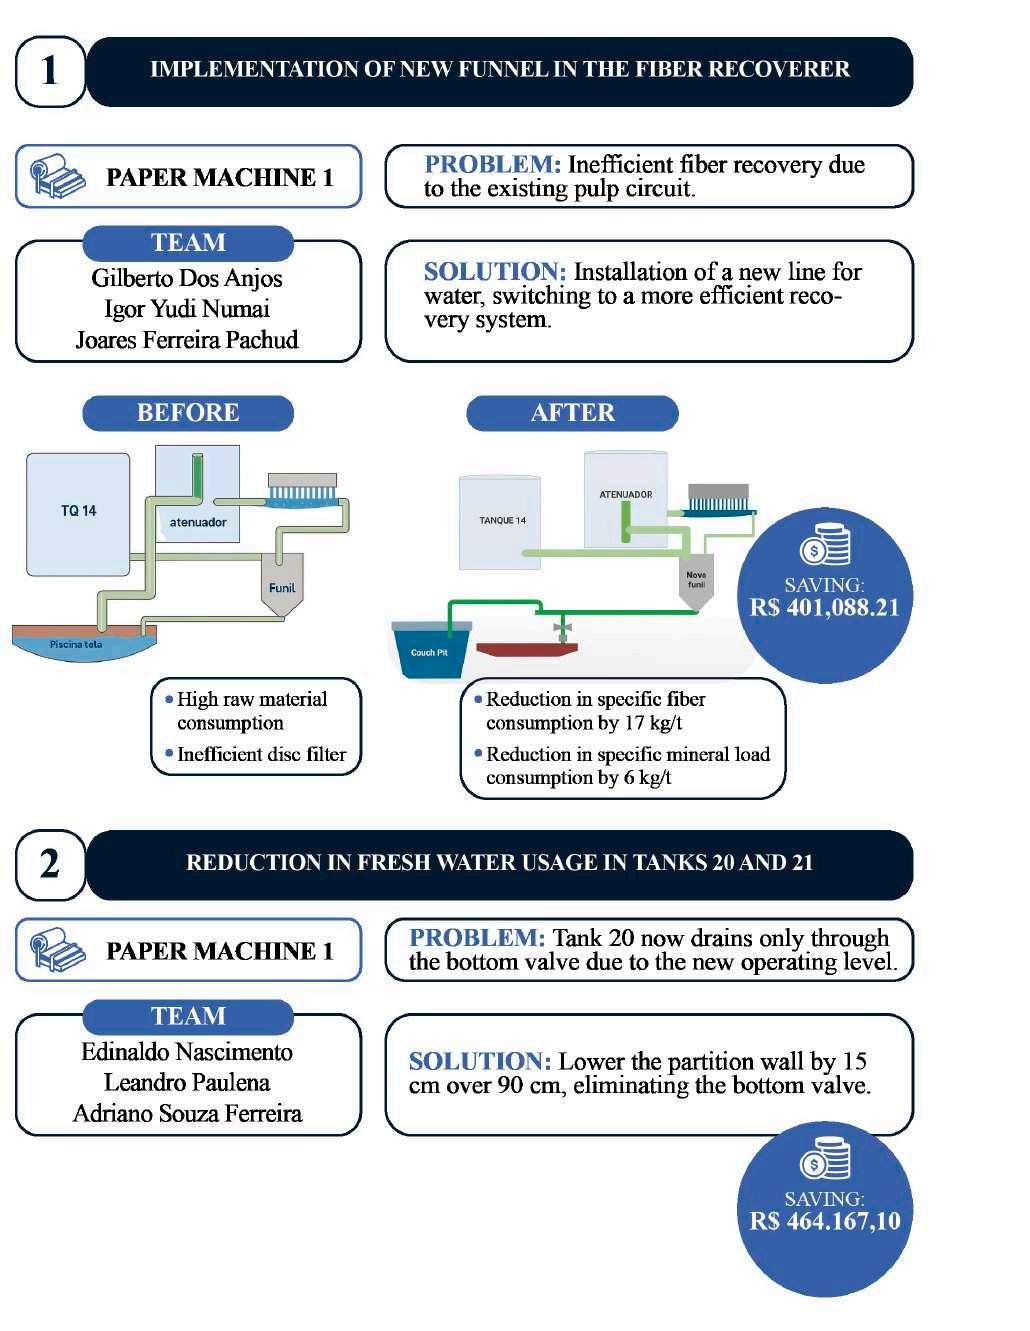
Whenever an improvement is implemented, we maintain a record of the before and after to showcase and make the changes resulting from the improvements visible.
EXAMPLES OF IMPLEMENTED IMPROVEMENTS
SCORING PROGRAM
SANTA REWARD
Santa Recompensa is our rewards program developed with the aim of rewarding employees who, in some way, participate in projects and generate returns for the business.
IT IS POSSIBLE TO REDEEM POINTS FOR AMAZING PRIZES WITHIN THE PLATFORM.
An improvement suggestion approved for execution (qualitative or quantitative) receives 1000 points per idea.
A quantitative improvement suggestion receives 1 point for every R$3.00 of net return, up to a maximum of 100,000 points.
Participation is through the programs.:
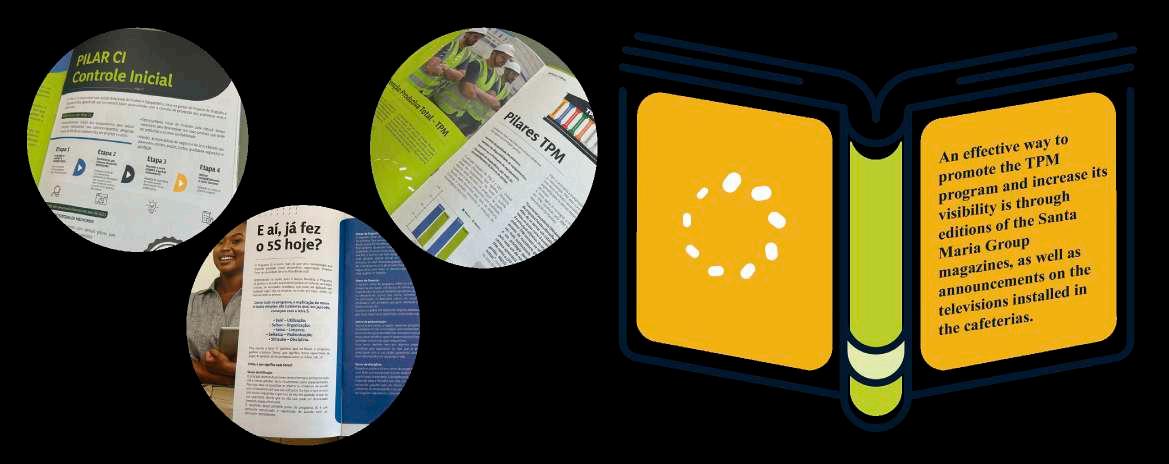
At Grupo Santa Maria, the sharing of best practices is done in a structured way to promote continuous improvement across departments. We use various internal communication channels to give visibility to successful initiatives:
Corporate TV: Displays short videos on best practices implemented in the units, facilitating quick and visual learning.
Internal Communications: Emails, bulletin boards, and official groups share initiatives with positive results.
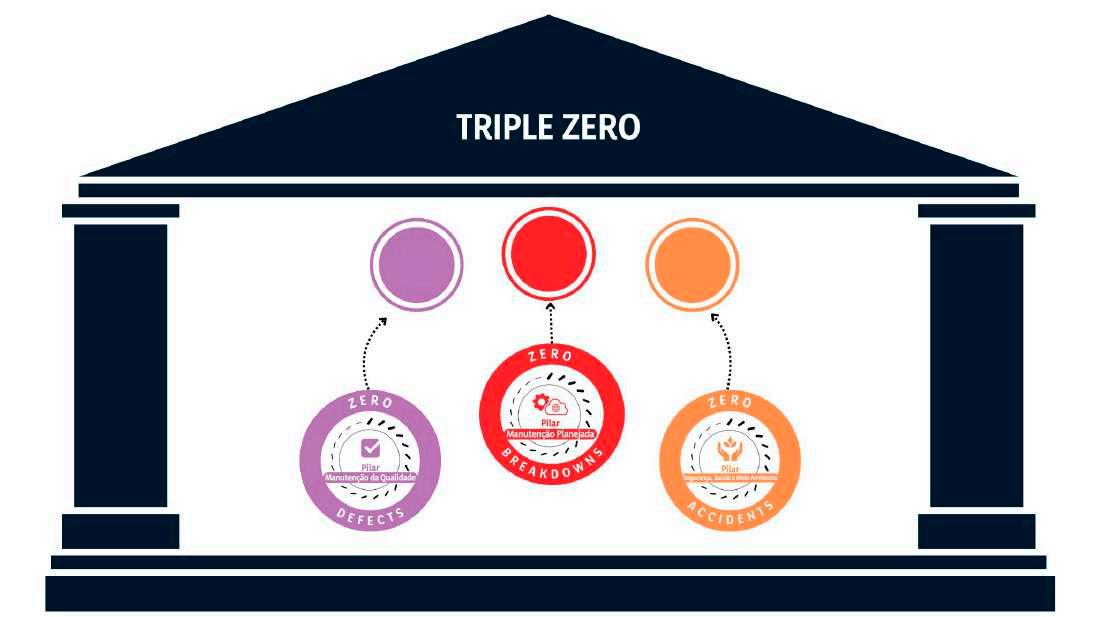
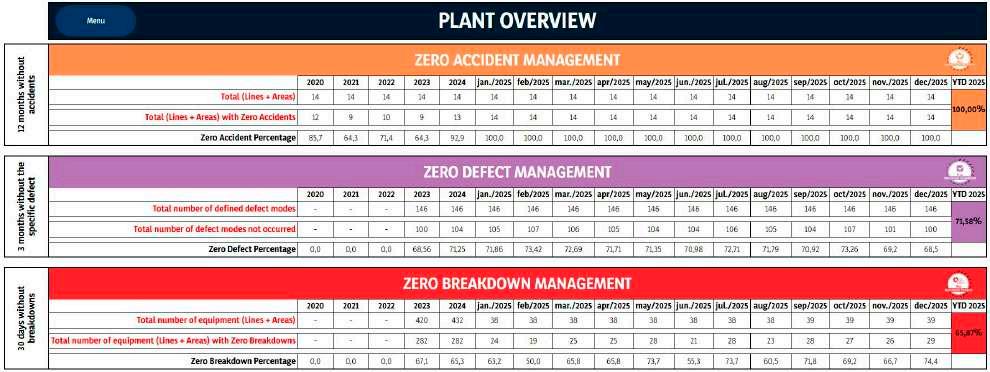
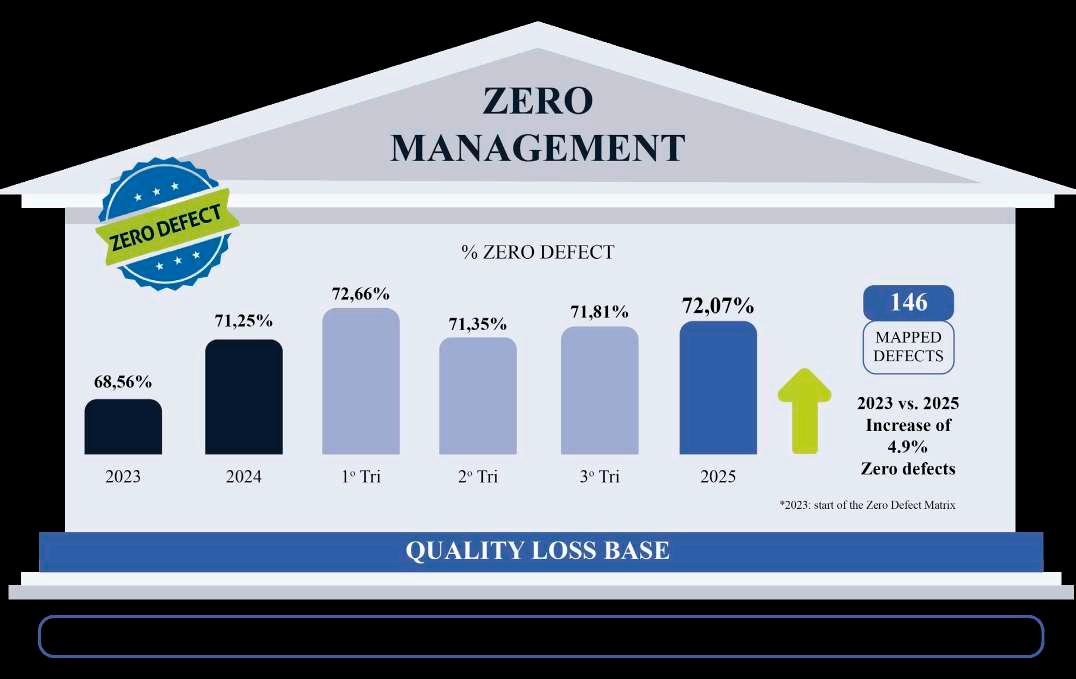
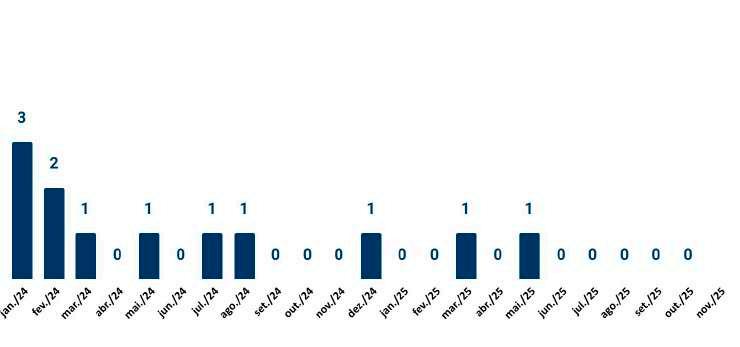
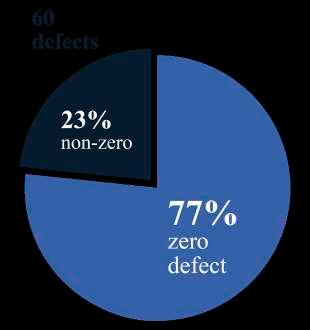
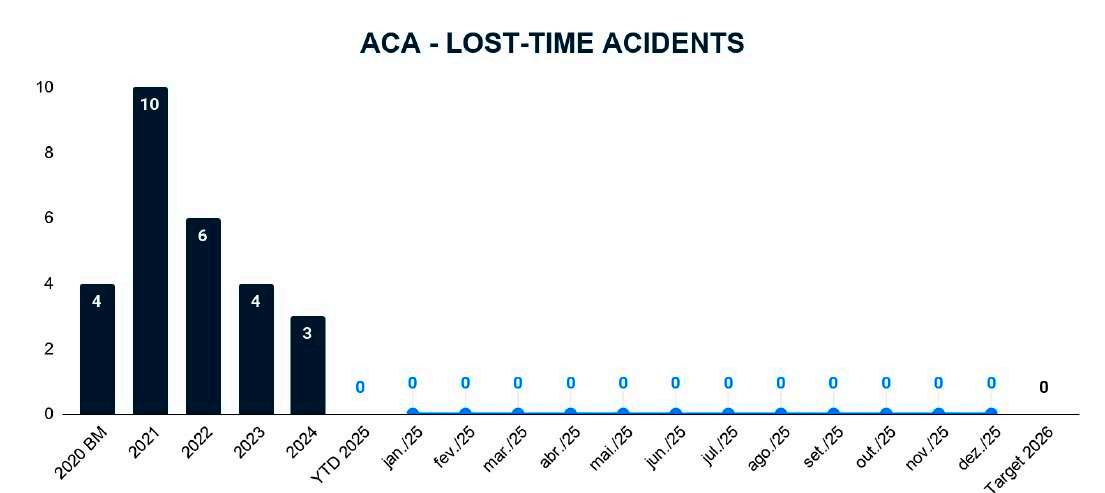
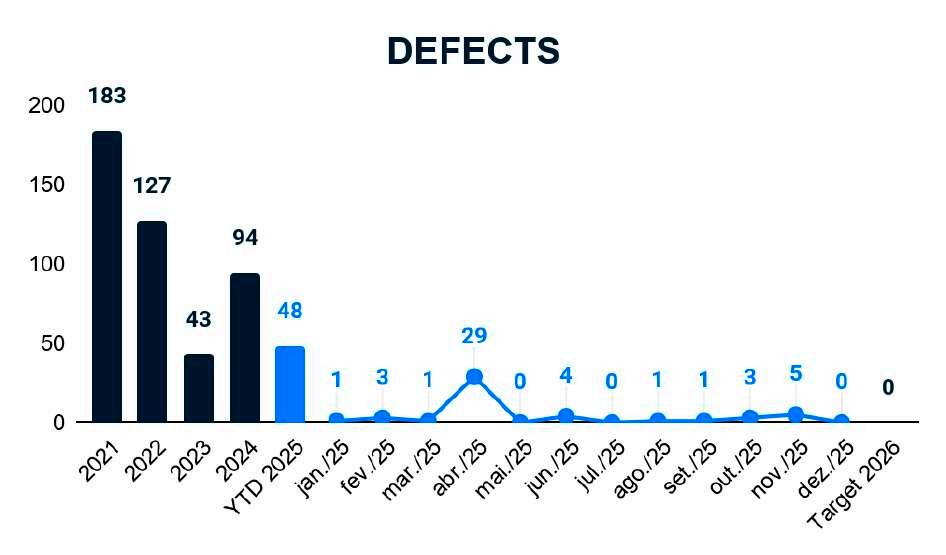
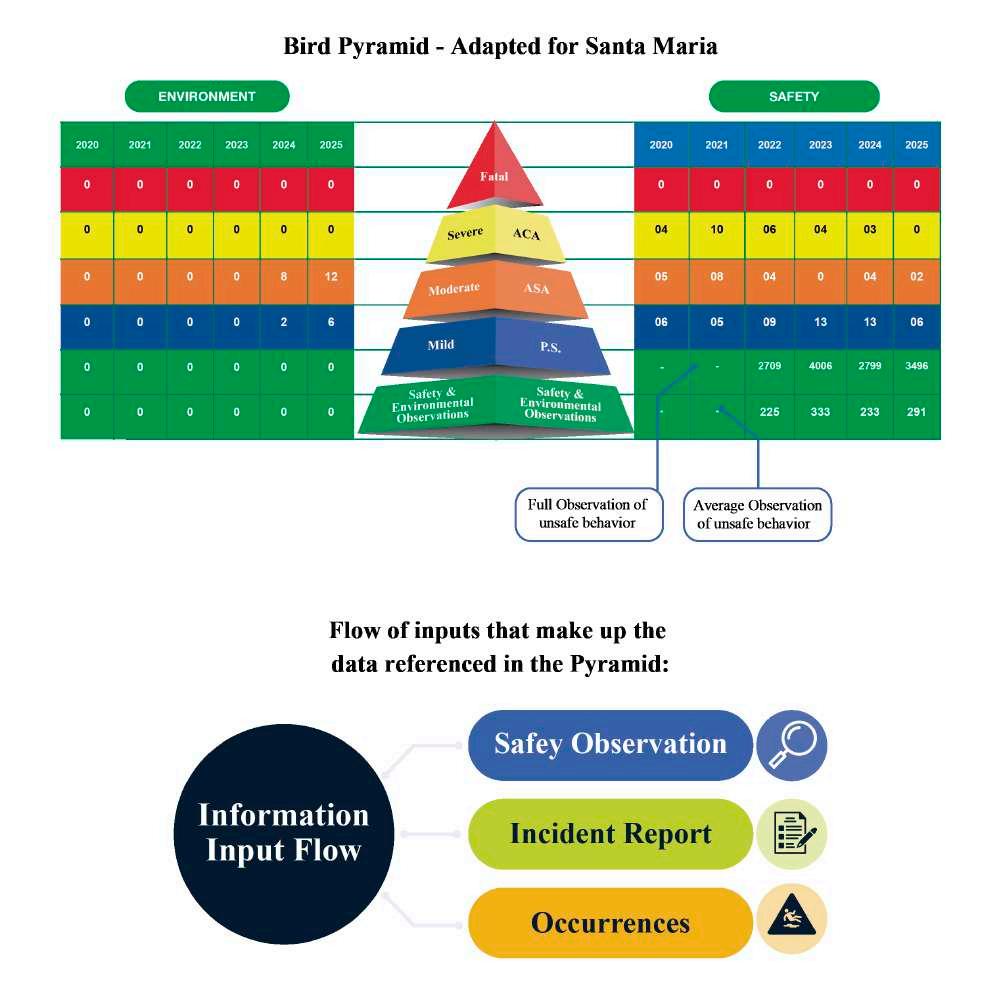
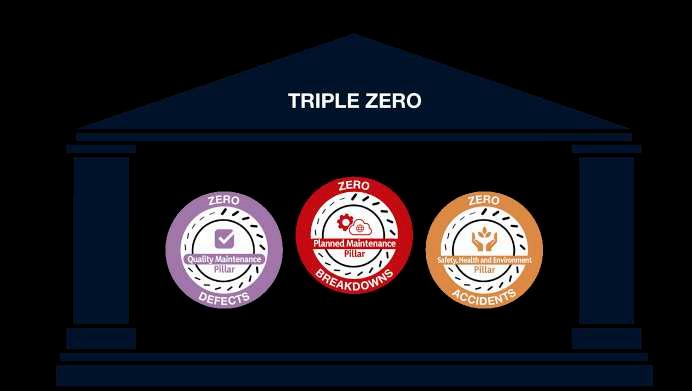
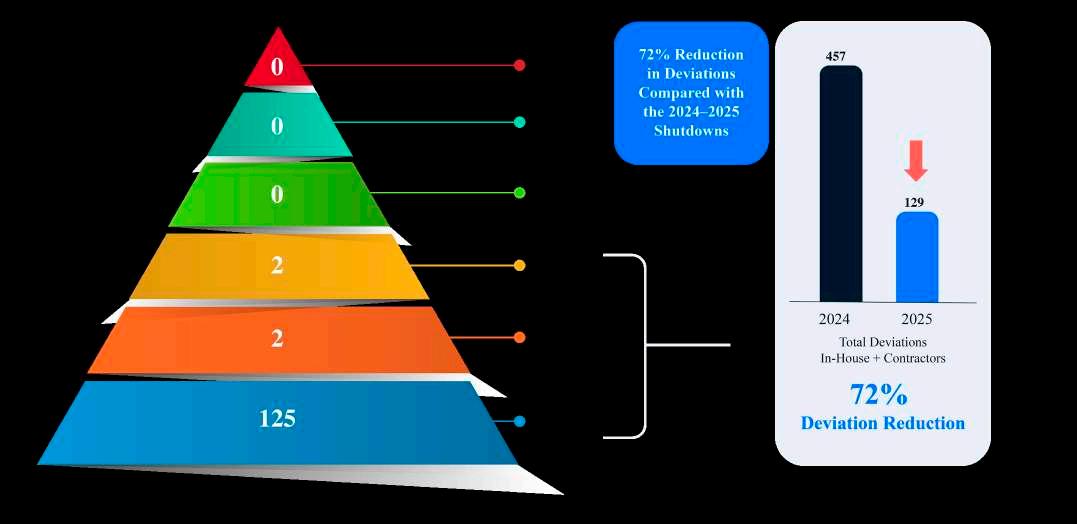
With the goal of consistently achieving zero accidents, zero defects, and zero breakdowns, we present the three main zeros of the factory, as illustrated in the image below:
The SHE pillar (Safety, Health, and Environment) is responsible for managing ZERO ACCIDENTS, the MQ pillar (Quality Maintenance) oversees ZERO DEFECTS, and the MP pillar (Planned Maintenance) supervises ZERO BREAKDOWNS. These three zeros are standardized to highlight and showcase the achievements related to each of them.
CAPTURE OF IMPROVEMENT GROUP
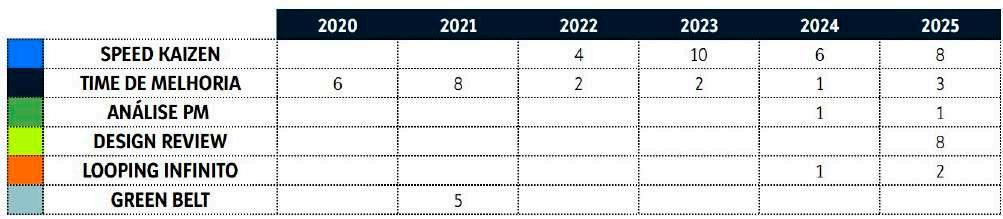
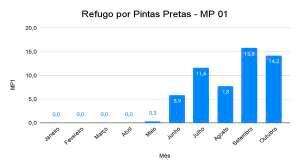
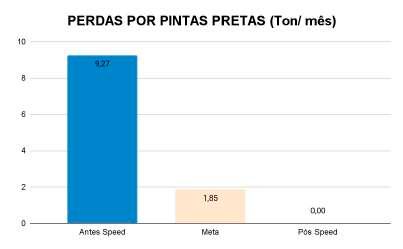
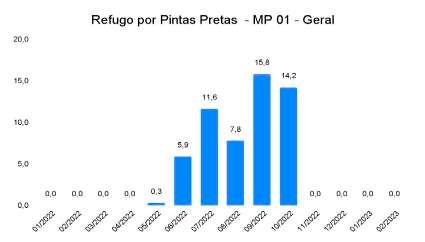
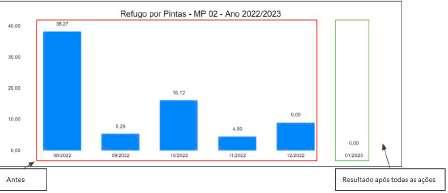
SPEED KAIZEN - REDUCTION OF PAPER WASTE DUE TO BLACK SPOTS
PROBLEM
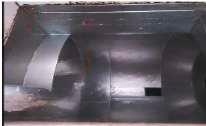
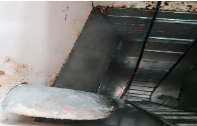
Black spots were identified on Gloss and KRMG papers, resulting from the burning of bales during the disaggregation process. An increase in the likelihood of these burn incidents is observed, especially during meal times or in moments of high machine demand, situations where water insufficiency in the storage tanks may occur.
ANALYSIS
Lack of basic protection conditions for the rotor assembly;
Outdated operational procedures; Lack of standardization of recipes; Lack of water in the storage tanks.
ACTIONS AND RESULTS
Restoration of the basic equipment condition
Updating of ITR 0091, highlighting the need to remove the covers and check the water level in the disaggregators.
After implementing the actions
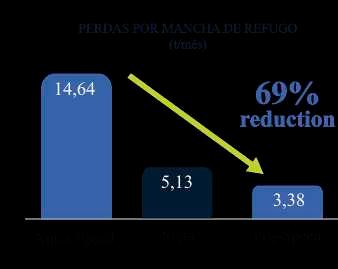
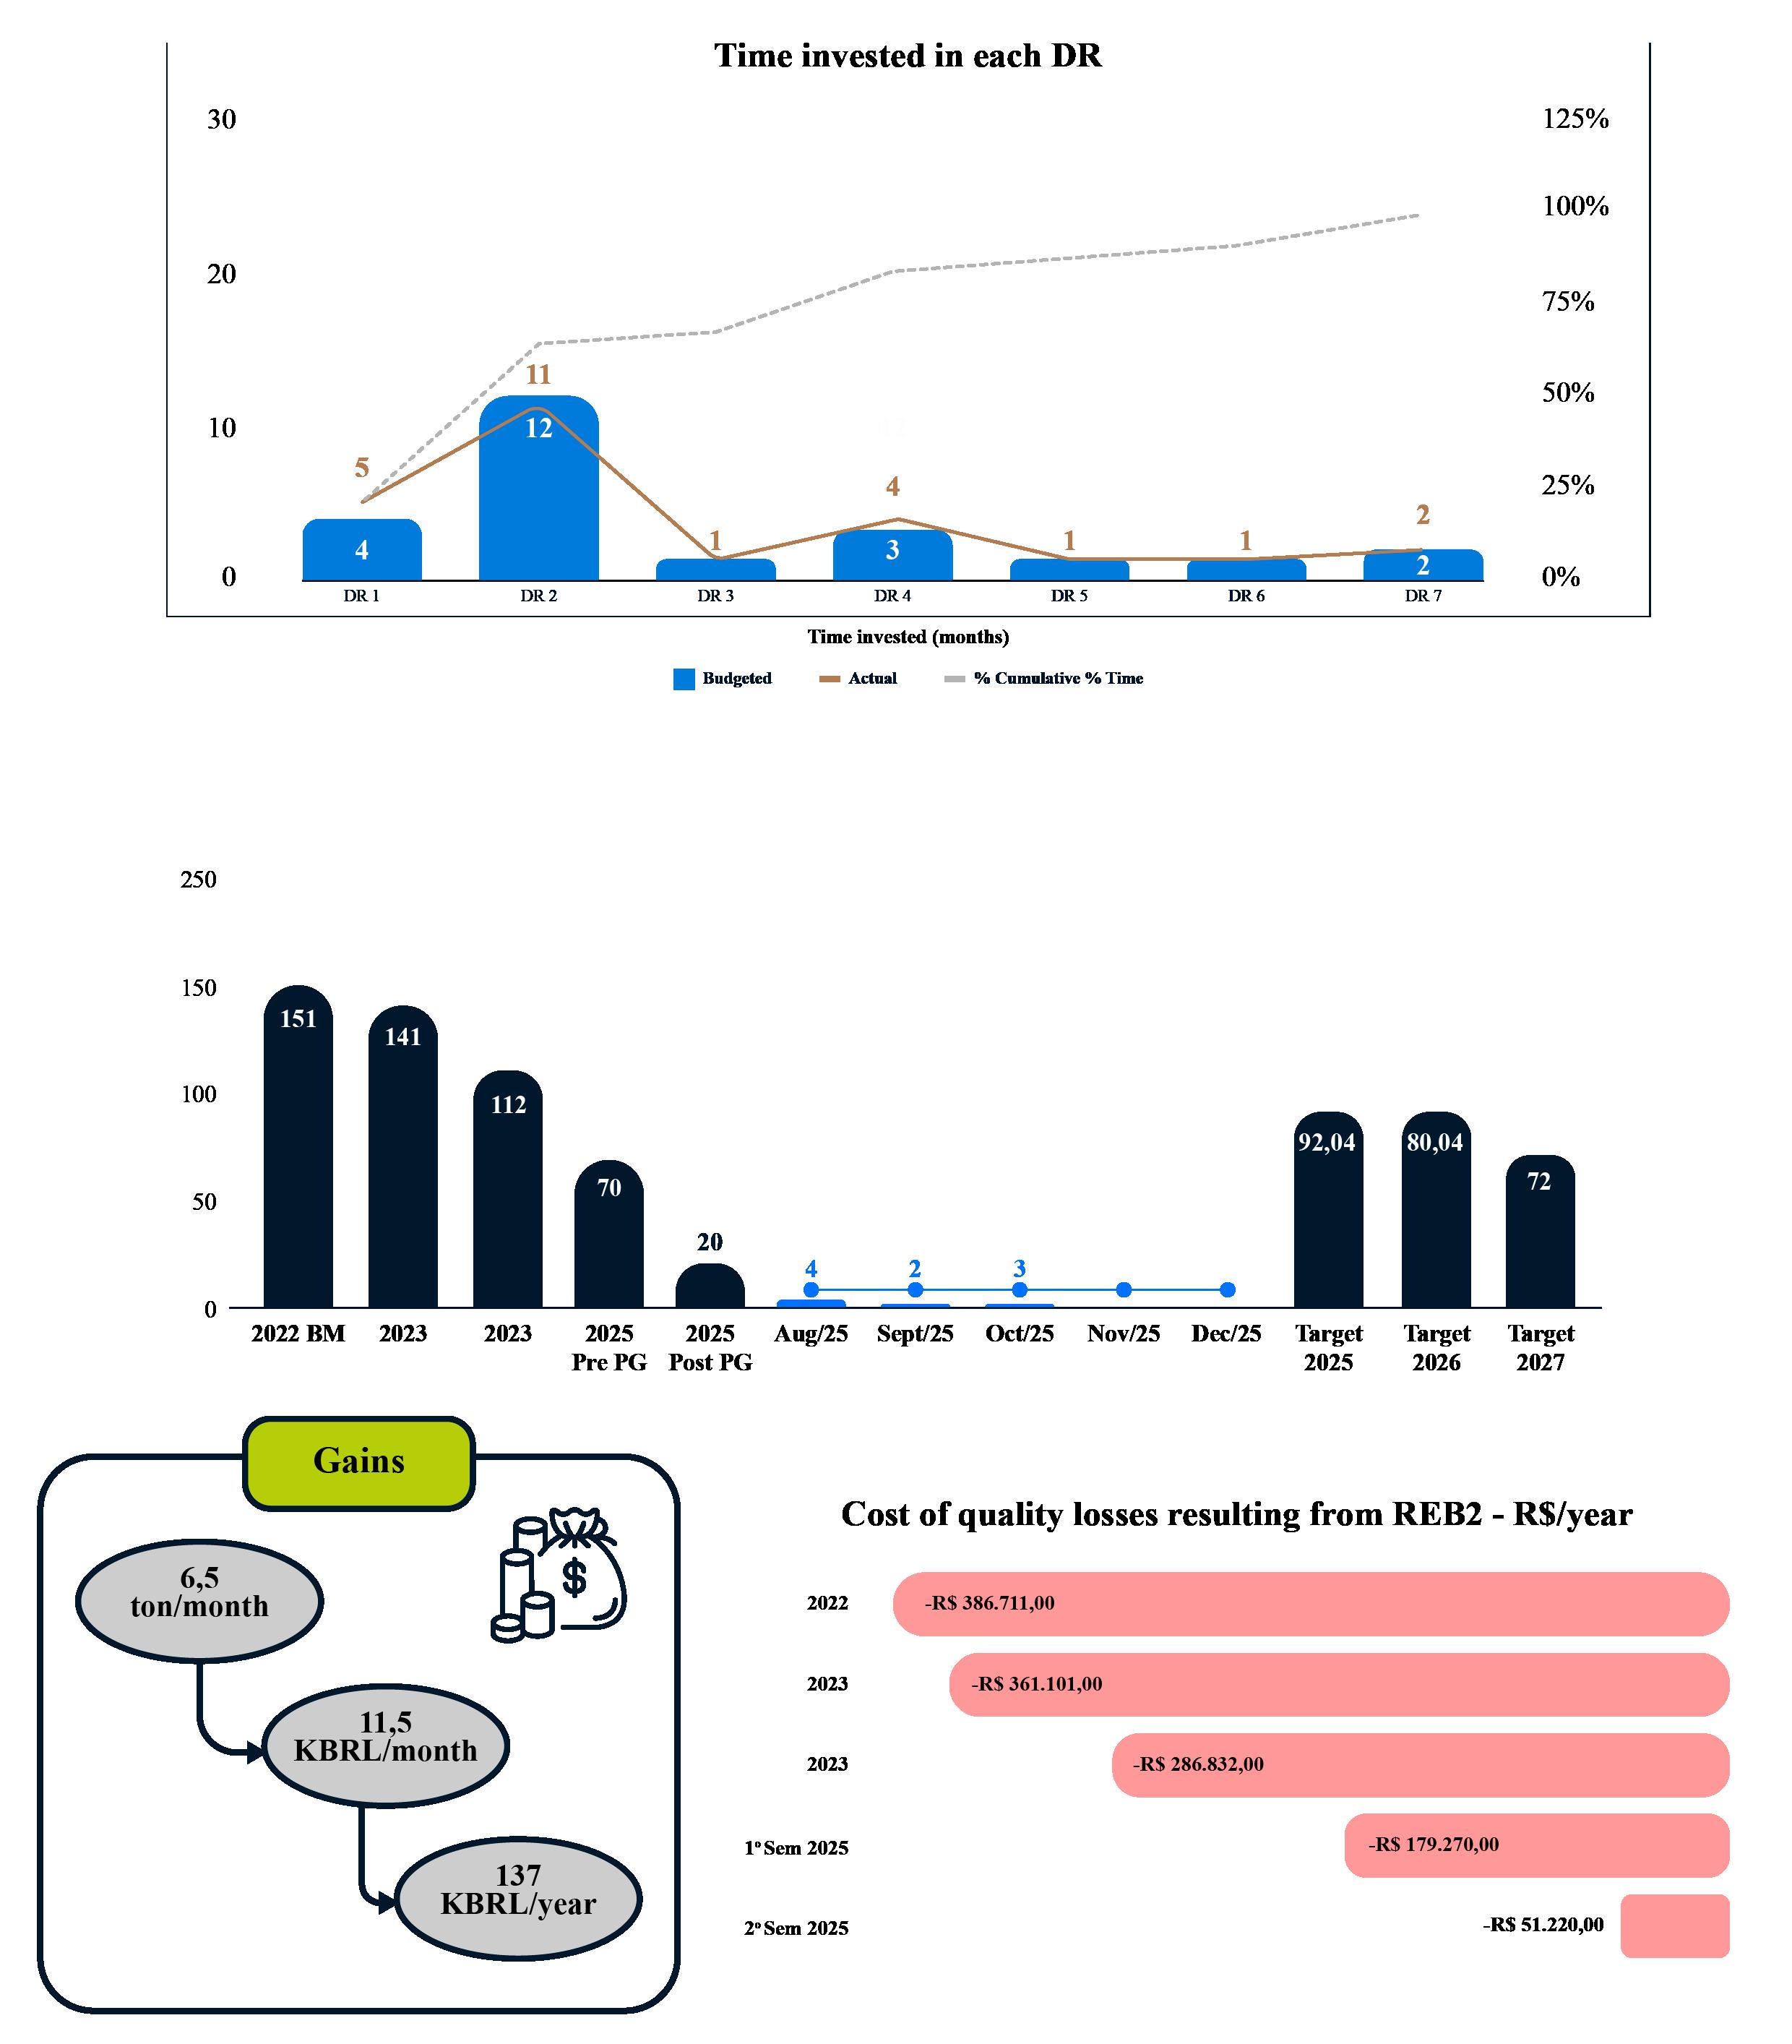
The goal was to reduce losses by 80%. However, the team exceeded this goal and achieved a 100% reduction in losses. An excellent result, demonstrating that the work and effort applied were even more effective than expected!
PM ANALYSIS - REDUCTION OF LOSSES DUE TO RIBS IN MP2
PROBLEM
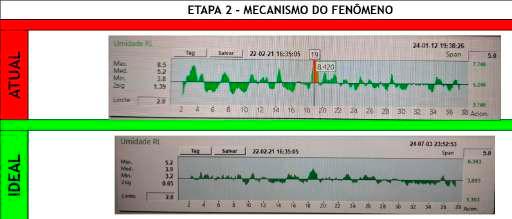
The appearance of channels and irregular moisture profiles causes waviness in the paper structure, revealing the issue during the winding process. The main sources of channel formation are the roll profiles, clothing conditions, and pronounced deformations in equipment that directly contacts the product.
ANALYSIS
Initial Reduction: 78.59%
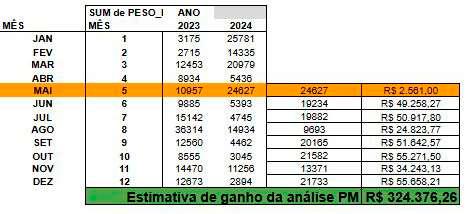
Estimated Annual Gain: R$ 389,974.20
Reduction (Challenge): 100%
Estimated Annual Gain: R$ 496,234.20
ACTIONS AND RESULTS
Installed a valve for drainage and cleaning of the lubrication shower for the entrance box lip.
Implemented a filter ina the water line of the shower to prevent clogging.
Monitored fluctuations in press scrapers.
Studied and implemented a new scraper system for the central roll to preserve the coating’s lifespan and improve the quality of surface highlighting and removal on the roll.
SAVING: R$ 324.376,26
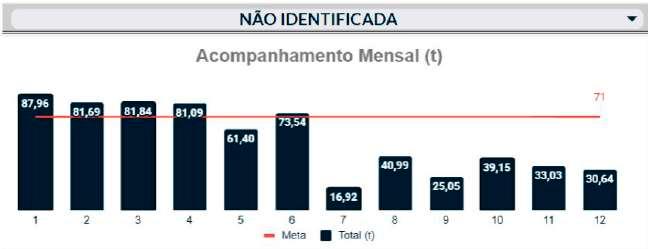
INFINITE LOOP - REDUCTION OF UNIDENTIFIED LOSSES IN MP2
PROBLEM
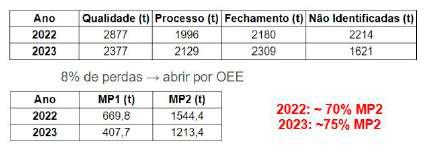
The deviation in the way paper loss is recorded as “unidentified” in MP2 occurs at the time of recording and depends on the operator’s experience after the rewinding process is completed.
ANALYSIS
98% No paper in the spool
2% Duplicate roll
ACTIONS
AND RESULTS
Defined action: change the location to update the density
→ Automatic update of paper density after weighing each batch on the scale. Reduction of 63% in unidentified losses due to spools without paper.
Suggestions for Improvements Implemented (Number) - TOTAL
FUTURE PLANS
Seek opportunities to improve the Quality item and maintain the OEE result.
Expand the use of advanced loss reduction tools through the Tool Shelf.
Encourage improvement suggestions with the goal of achieving the target of one implemented improvement per employee by 2027.
Intensify the initiation of improvement fronts through the Loss vs. Cost Matrix and the Loss Tree.
Consistently promote the use of the Speed Kaizen tool in the GAs to address losses.
Expand employee awareness about understanding losses and the importance of reducing them.
OEE
Santa Ideia Tools
Loss Vs. Cost Matrix
Speed Kaizen
Losses
AM PILLAR 5.1
Develop and qualify the operation to perform high-quality inspections, anticipating problems, following standards, and ensuring the capability to carry out inspections aimed at increasing equipment efficiency.
OBJECTIVES
• Manager the Step transition index, achieving 76% of GAs with Step 4 completed.
• Act with a focus on the operator, enabling and empowering them for autonomous management.
• Guide each GA to progress through the program Steps.
• Prepare the operator to take ownership of and care for the machine.
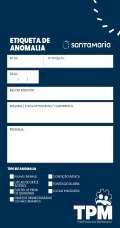
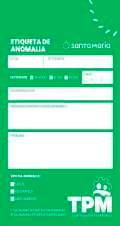
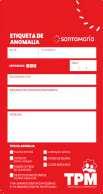
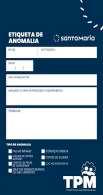
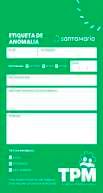
• Implement anomaly recording through tGAs: blue for operators, red for maintenance, and green for safety.
HISTORICAL CONTEXT
STRATEGIC INDICATORS
COVID-19 period, pandemic.
“MP1” machine operating at reduced speed (lack of orders, market-driven shutdown) and a 25% reduction in the operational workforce.
“MP2” machine remained idle for a large part of the year.
SANTA MARIA STRATEGY
Operational Efficiency through TPM
PILLAR OBJECTIVES
Prepare the operator to care for and take ownership of the machine.
Act with a focus on the operator, enabling and empowering them for autonomous management.
Manager the Step transition index. Engaged teams
Strengthen sustainable activities
Optimize costs and expenses
Ensure business growth and continuity
Guide the Autonomous Groups to achieve the program Steps.
Implement anomaly recording through tGAs: blue for operators, red for maintenance, and green for safety.
CALCULATION MEMORANDUM MA PILLAR INDICATORS
Support:
Actual Quantity of Paper Produced per Unit of Time Projected Potential Quantity of Paper per Unit of Time
Total Duration of Emergency Stops Caused by Operational Failures
Elapsed Time Between the Last Saleable Paper Before Changeover (A) and the First Saleable Paper After Changeover (B)
Time Spent on Tool Changeovers on the Paper Machine
Adherence to the Evolution Periods of Autonomous Groups at Each TPM Step
Number of ECRSs with Implemented Countermeasures Number of Open ECRSs
Total Number of Blue TAG´s
Total Number of TAG´s (Red + Blue)
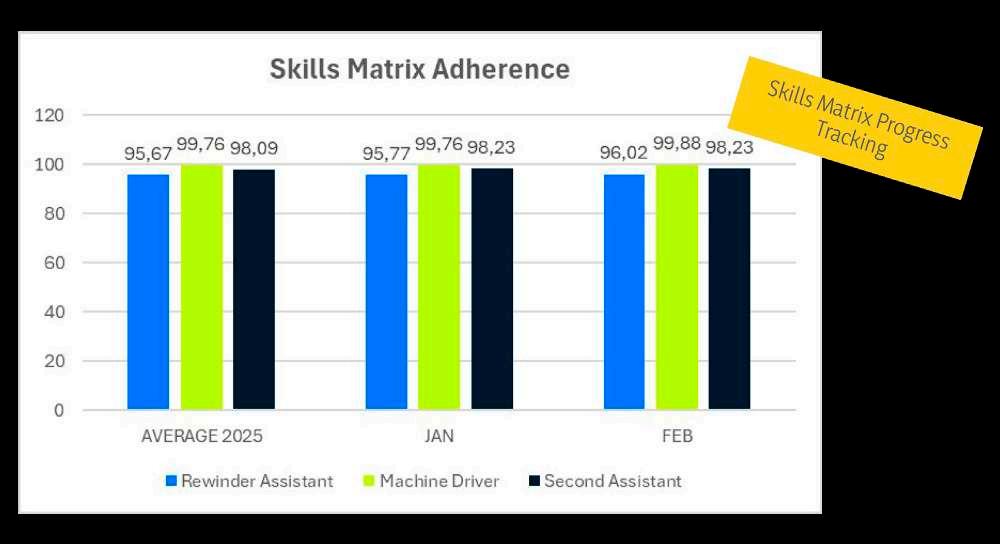
Required Skills for the Function in Which the Employee Was Trained Required Skills for the Employee’s Function
AUTONOMOUS GROUPS RANKING INITIALIZATION
Definition of TPM Pilot Areas 2020/2022 – Santa Maria Papéis
Criteria Considered
1. Safety:
a. Basic condition actions implemented have an impact on reducing accident risk conditions.
2. Losses:
a. Areas that, after basic conditions are restored, show a reduction in losses (products, water, raw materials, defects, complaints).
3. Culture:
a. Areas where implementation will have a positive impact on cultural change for TPM implementation.
4. Method Calibration:
a. Implementation difficulty related to the number of people, downtime duration, and involvement of pillars.
5. Investment:
a. Estimated financial resources required to restore the basic conditions of the areas.
Areas Involved
Directors, managers, and leaders from the MA, MP, CI, SHE, and MQ pillars were involved in the classification of the areas.
Methodology Used
Individual responses using the options “High,” “Medium,” or “Low,” based on perception of the impact on restoring basic conditions and eliminating risks related to people’s safety and the environment.
Note:
Except for loss areas, for which the loss history from Jan/2021 to Mar/2022 was considered.
Evaluation Criteria (Official Document)
Definição de pesos com base na Matriz de Ponderação:
Selected Pilot Areas
REB 2
Area selected due to its high representativeness in safety and loss indices. In addition to being a defect-generating area, it is the first filter to prevent paper manufacturing issues from being passed on to customers.
Wet End – MP1
Area selected due to its potential to demonstrate significant improvement in 5S and in the basic conditions of critical equipment. It stood out as the main area for losses related to equipment unavailability.
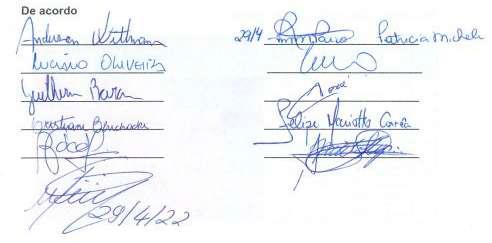
Validation Signatures
Final Overall Ranking
MASTER PLAN MA PILLAR
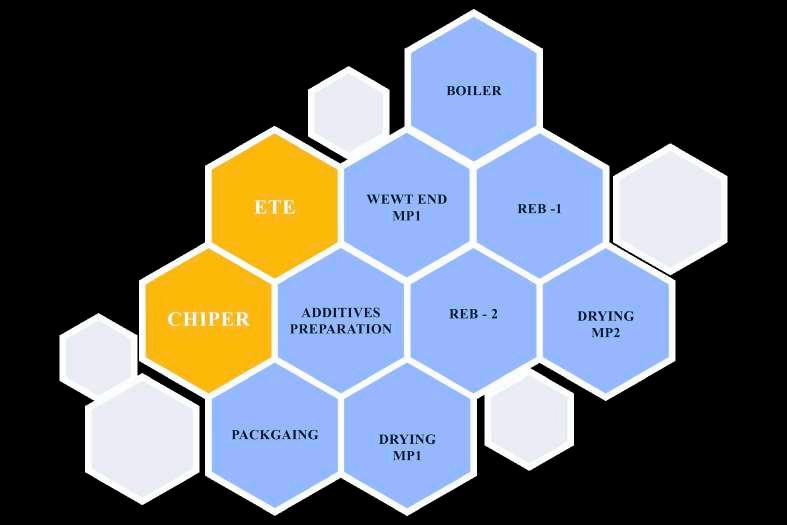
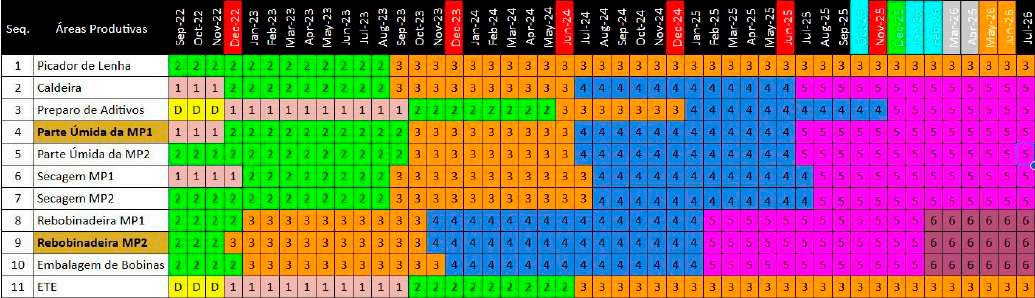
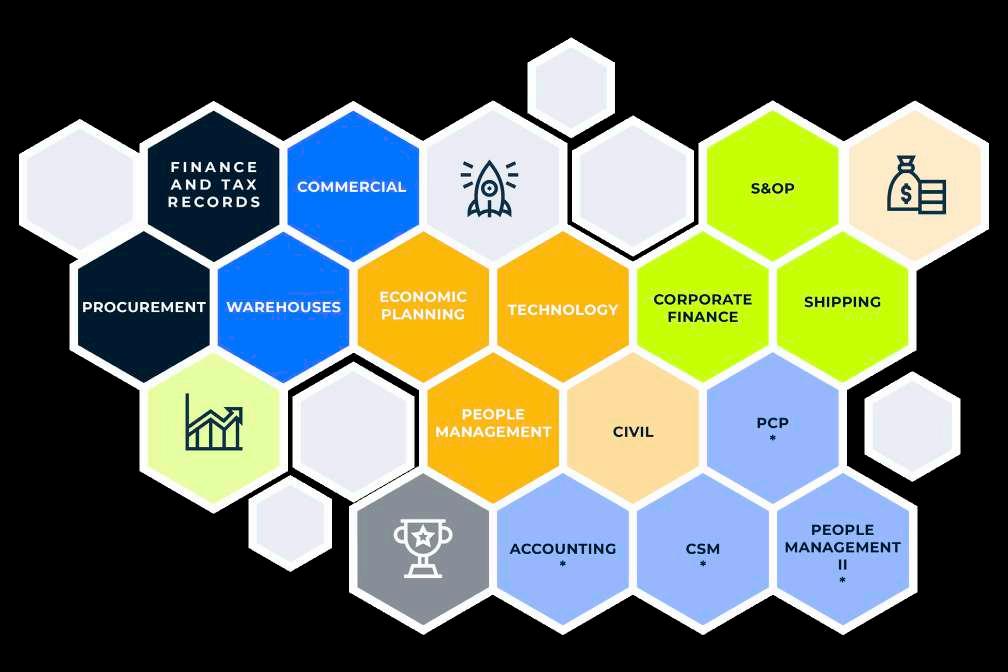
The Master Plan is our guiding framework for the development of the autonomous groups. Since the effective structuring of TPM in 2020, the evolution period and methodological advancement for each of the 11 Autonomous Groups (GAs) have been defined.
This view provides an overall picture of progress at each Step across all GAs. For example, by the end of the second quarter of 2023, we had planned for all groups to have surpassed Step 1.
It guides us comprehensively across all pillars, enabling better planning, control, and effectiveness. Currently, the master plan is 100% complete.
AUTONOMOUS GROUPS
EVOLUTION AND DISTRIBUTION
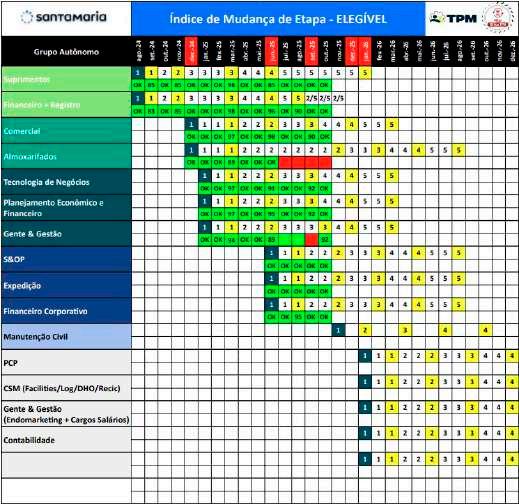
Below, it is more clearly shown the period in which each autonomous group developed and progressed through each specific Step of the methodology.
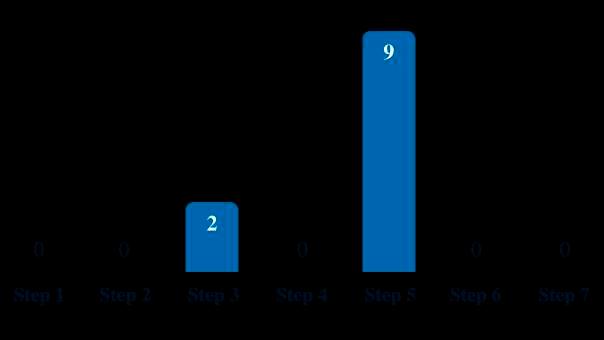
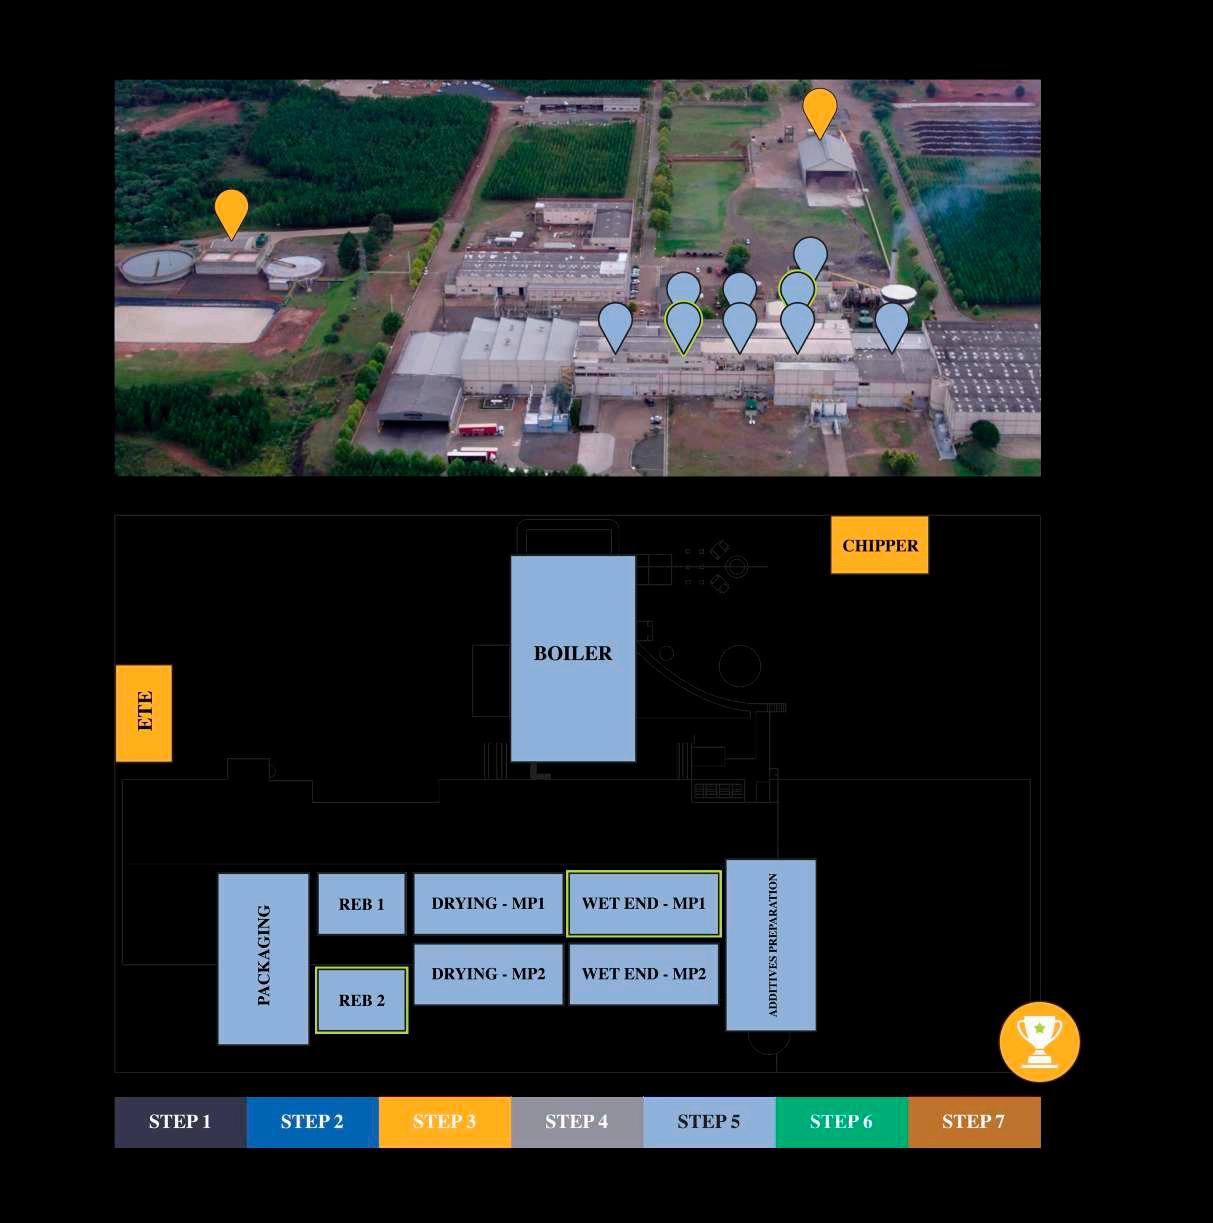
Our milestone for the award application is linked to having more than 76% of the eligible GAs with Step 4 completed.
In the segmented area, we identify which GAs are required to be at each specific Step.
The two images below show our plant and the layout of the autonomous groups within their respective areas. Each GA is also differentiated by color according to its current Step of development; those circled in green are the pilot groups. ACTIVITY LAYOUT OF OPERATIONAL GA 5.7.1
MA PILLAR TREASURES
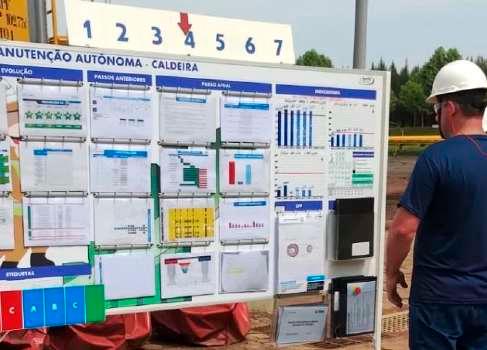
The Management board, a treasure of the MA Pillar, is used to represent the main indicators of the autonomous group. These indicators are filled in and periodically updated by the members themselves, directly on the indicators displayed on the board using colored pencils. It also allows for verification of follow-up with other pillars through documents specific to each responsibility.
We enhance the use of this information through periodic presentations of the board, internal routines with participant rotation during the presentations, and the consolidation of team information and action plans.
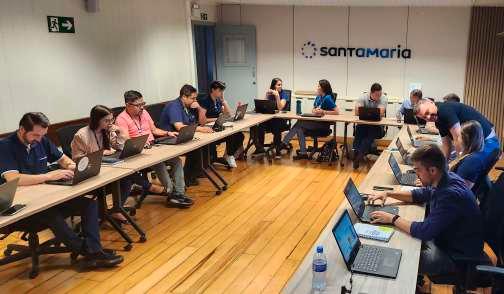
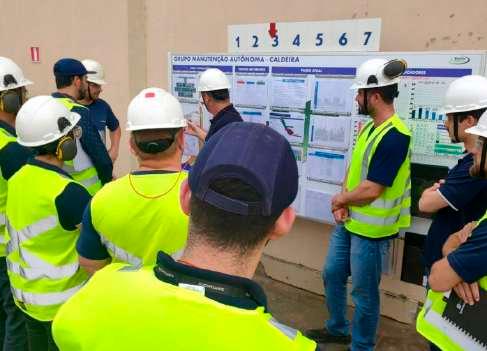
Autonomous group meetings connect the other pillars, aligning joint efforts to optimize opportunities, monitor standards, address area needs, and support team development.
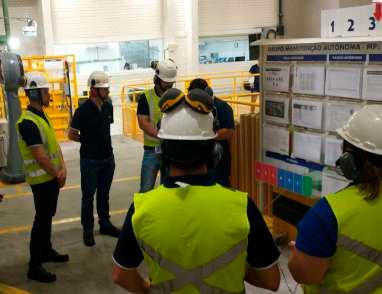
We strengthen these meetings with visits to the respective production areas, verifying in practice and in real conditions the status of the area and the equipment.
Reunião dos GA´s
Gemba nos GA´s
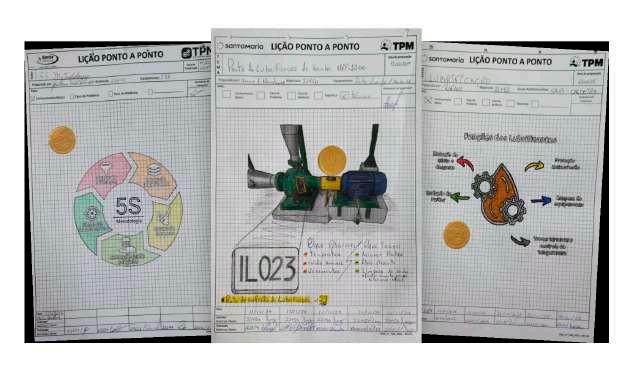
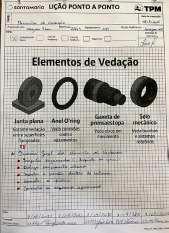
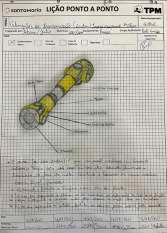
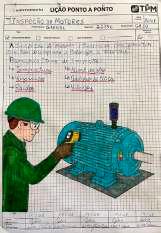
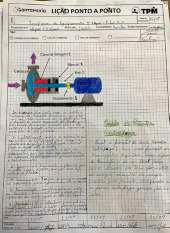
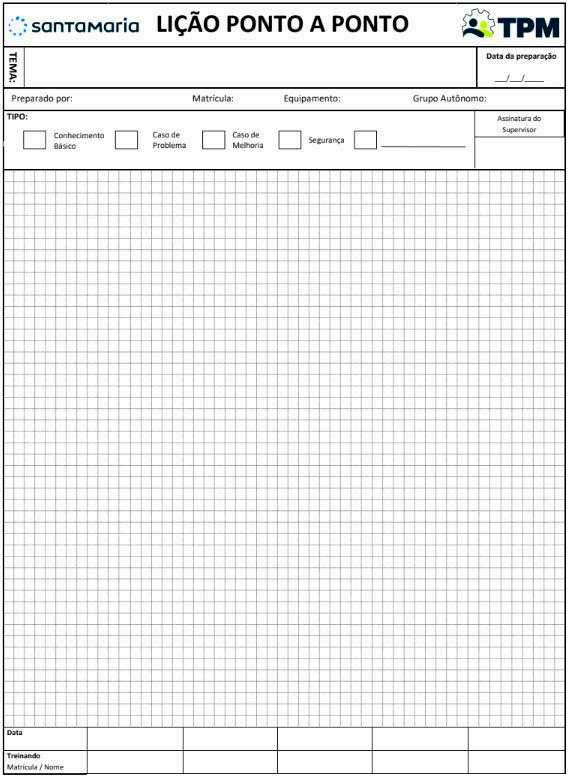
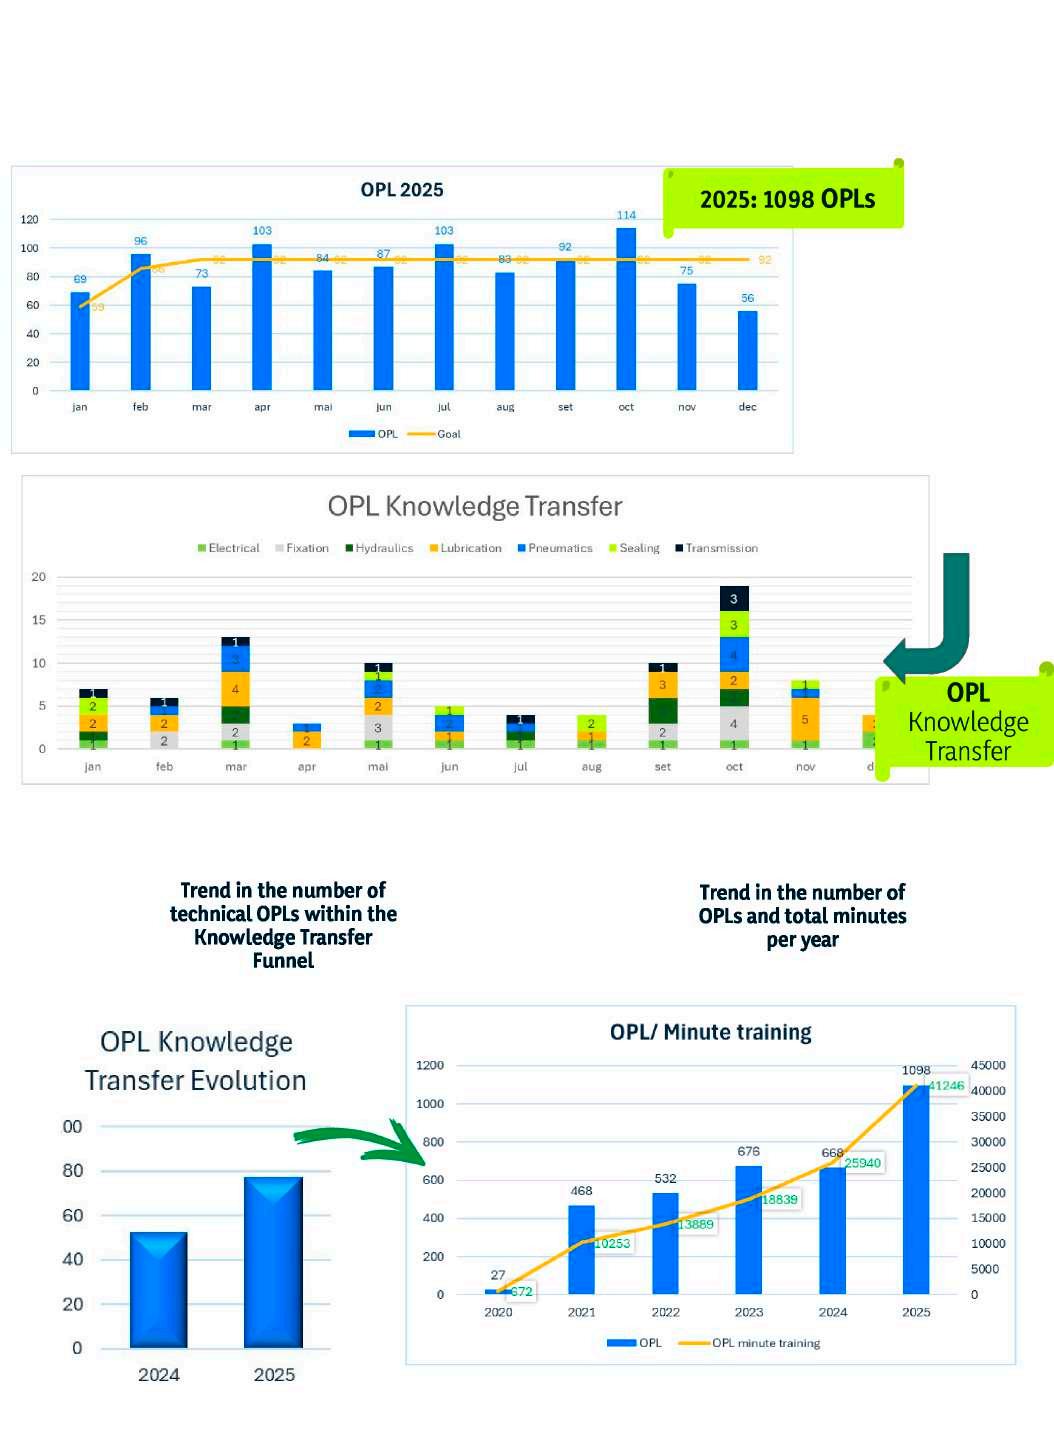
OPLs are used to train employees in specific work activities, methodological concepts, equipment, usGAe, processes, among others.
We enhance learning through OPLs by directly linking them to daily activities and recent events, such as failures, deviations, and improvements, among others.
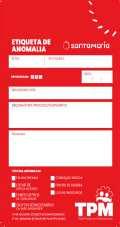
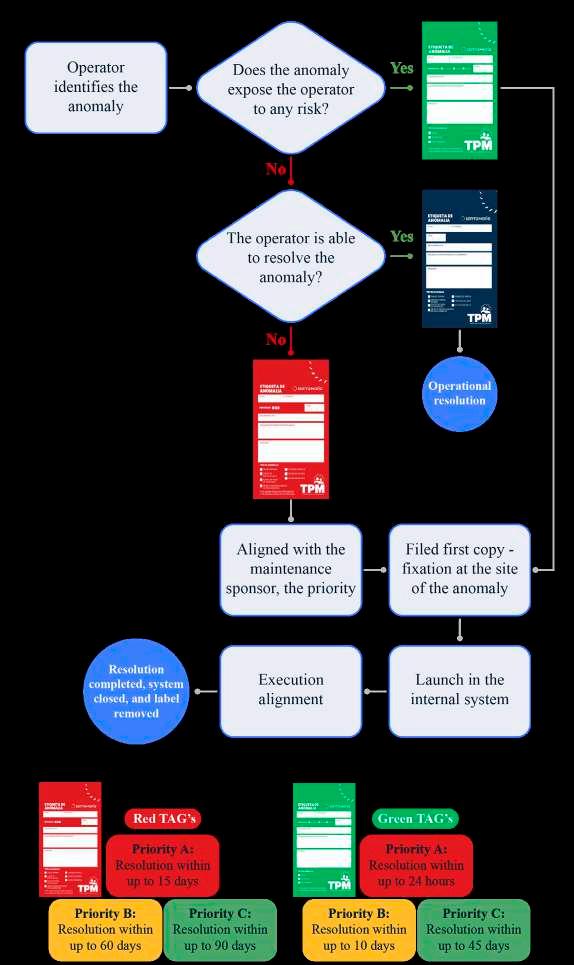
Red TAG´s: Opened for basic equipment condition anomalies, to be resolved by Maintenance.
Blue TAG´s: Opened for basic condition anomalies, resolved by Operations when operators are qualified and have the necessary tools to address them.
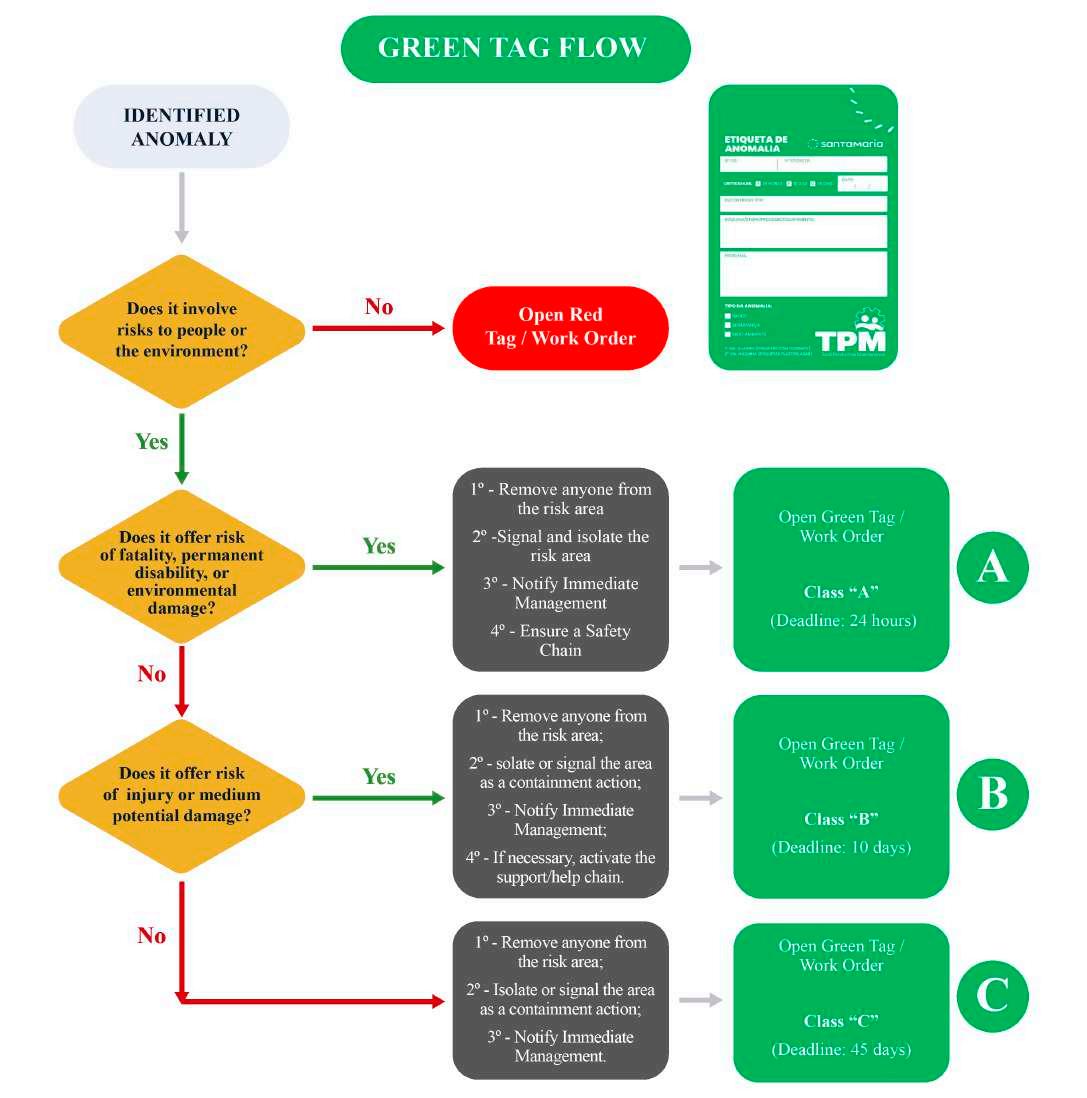
Green TAG´s: Opened whenever basic condition points are identified on equipment that are outside safety and environmental standards.
AUTONOMOUS GROUPS EVOLUTION STEPS
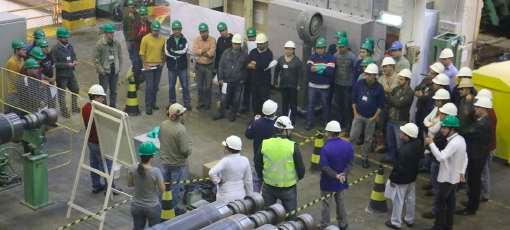
First activity of each GA to initiate TPM – Day D, with general cleaning and opening of tags to restore the equipment’s initial condition
Restoring Basic Equipment Conditions
Support: Day D → GA REB 2 (Pilot) Day D Events
Opening of maintenance and operation tags, identifying anomalies in the equipment
Basic Conditions Reestablished
Anomaly Identification
Participation of Executive Management and CEO
Involvement of All Teams
73 TAG´s opened on Day D (REB 2)
50 red tags
14 blue tags
9 green tags
General
STEP 1 – INITIAL CLEANING AND
Actions Performed During Step 1 in All Autonomous Groups.
Initial Training
Step 1 Concept
Equipment Understanding OPL´s
Safety
Detection and Identification of Anomalies
Inspection and Cleaning
Identification of Improvements to Restore Basic Conditions.
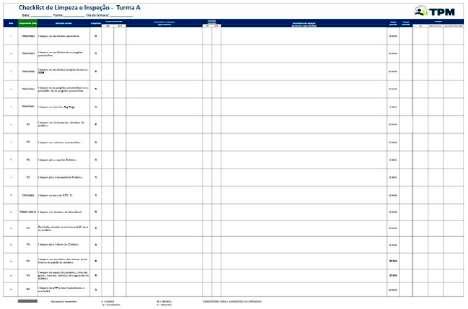
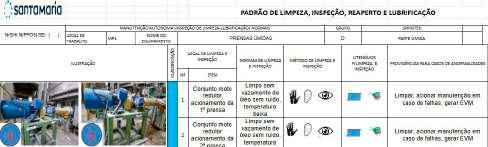
Creation of the Cleaning and Inspection Checklist
Cleaning prioritization, with defined frequency and responsibility (Document below: cleaning checklist).
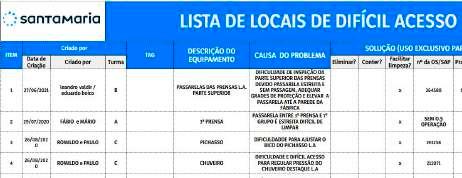
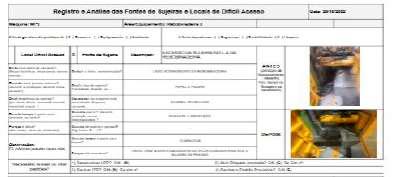
Mapping of Sources of Contamination (SC) and Hard-to-Access Locations (HAL)
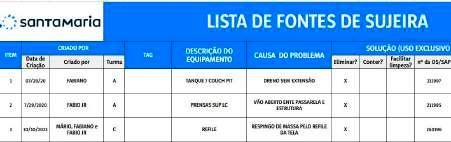
Identification of Improvements to Restore Basic Conditions (Document below used for listing).
5.9.1.1
RESTORATION OF BASIC CONDITIONS – 5S
5S APPLICATION BEFORE AFTER
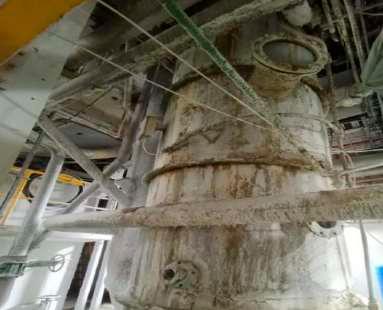
Tank 14 – Paper Machine 1
Restoration of the White Water Tank of Paper Machine 1
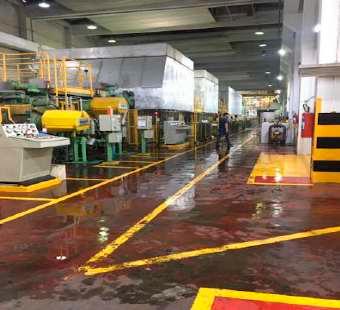
Paper Machine 1
Restoration of the floor, revitalization of structures, and implementation of NR12.
Restoration of the surface starch preparation area for application at the Size Press, identification of additive lines, and compliance with NR12.
Support:
STEP 2 – CONTAMINATION SOURCES AND HARD TO ACCESS AREAS
Actions Performed During Step 2.
Step 2 Concept ECRS Analysis
Expected Results
FS and LDA Analysis (Example of Internal Document)
Handling of Contamination Sources and Hard to Access Areas mapped and addressed in Steps 1 and 2.
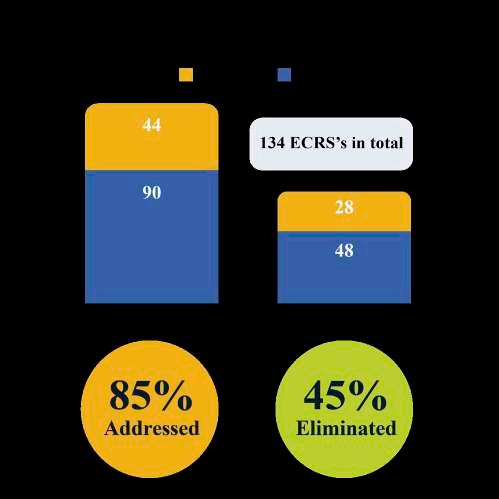
After the implementation and analysis of Contamination Sources and Hard to Access Areas, actions were implemented, with 85% of them addressed, reducing the time spent on these activities. This will be shown in detail in the MA Pillar results at the end.
ECRS IMPLEMENTATION
Identified Problem:
Brake soot generating external contamination on the equipment.
Description:
With multiple braking cycles, the volume of soot generated was harmful to the employee and contaminated the area.
Solution:
Enclosure of the braking system with the installation of an exhaust system.
Gains:
Reduction in cleaning time from 40 min to 10 min.
ECRS IMPLEMENTATION
Identified Problem:
Generation of contamination and material loss around the equipment.
Description:
During the raw material disintegration process, splashing is generated that contaminates the environment during operation.
Solution:
Enclosure of the disintegration system, preventing surrounding contamination.
Gains:
Reduction in cleaning time from 60 min to 15 min.
ECRS IMPLEMENTATION – GA DRY SECTION MP1
Identified Problem:
Difficulty in cleaning due to the grid being bolted in place.
Description:
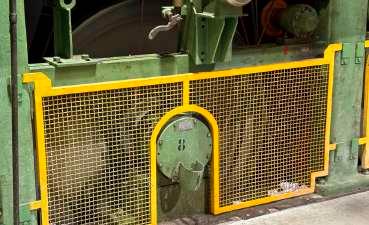
The NR12-compliant guard, bolted to the beam, made access for cleaning difficult.
Solution:
Interlocking fittings were implemented on the guards, facilitating their removal.
Gains:
Reduction in cleaning time from 60 min to 25 min.
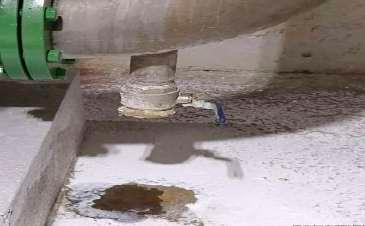
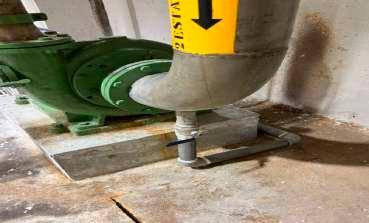
Identified Problem:
Pipeline drain discharging directly onto the floor.
Description:
During raw material purification, the process generates splashing.
Solution:
Drain alignment extended to the channel drain..
Gains:
20 min to eliminate the source; time previously spent on cleaning the area was removed from the checklist.
Component
– GA DRY SECTION
Component
General Safety TAGs:
General Operation TAGs:
Actions Performed During Step 3
General
STEP 3 – CREATE AND MAINTAIN CLEANING, INSPECTION, AND LUBRICATION STANDARDS
Step 3 Concept
Lubrication
Standards
Visual controls
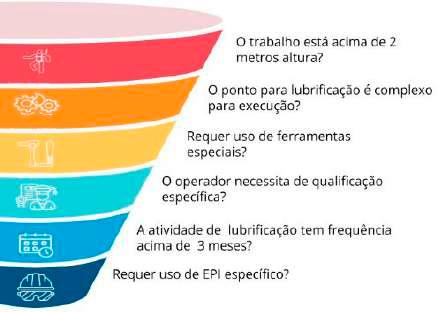
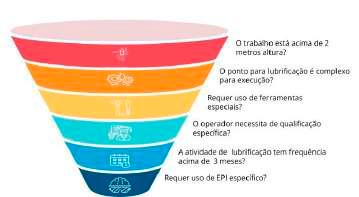
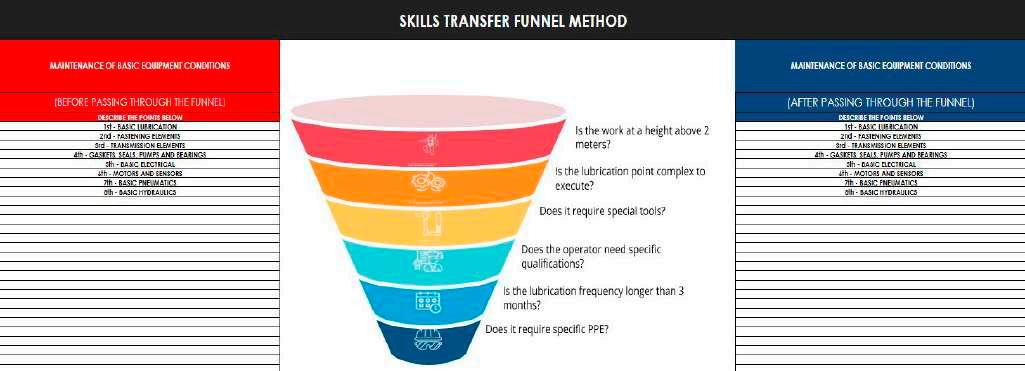
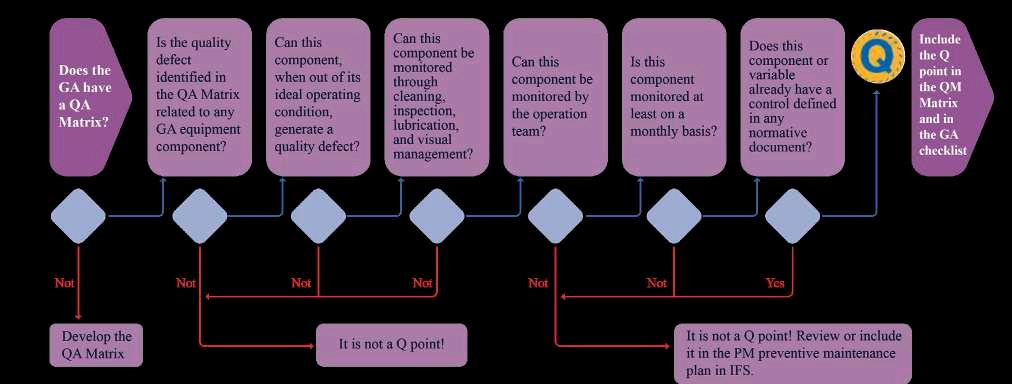
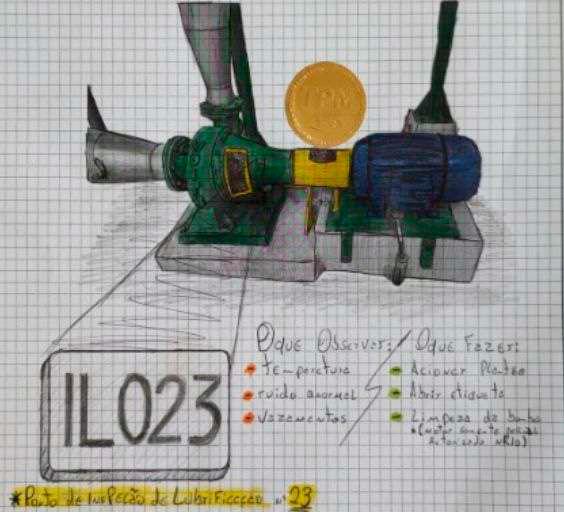
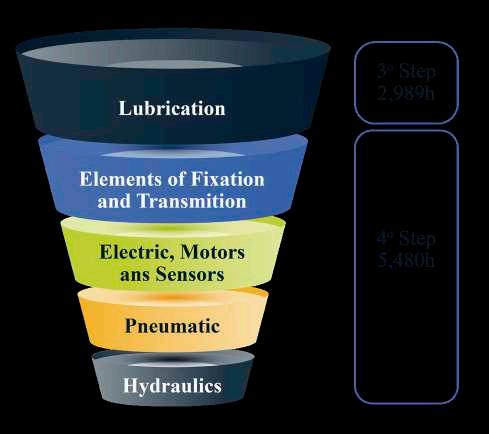
After analyzing the main lubrication points, each point was assessed through the transfer funnel, as illustrated above.
For each point, six questions are applied. If the answer to all questions regarding the execution of the activity is NO, the inspection point is transferred to Operations, as it presents no safety risks and operators have the capability and proper conditions to perform it.
Application of visual controls for inspection, numbers implemented
Review of provisional standards for cleaning/inspection and inclusion of lubrication points. Lubrication inspection points transferred before and after Step 3.
Lubrication inspection points involve multiple risks; therefore, only a few passed through the transfer funnel.
EXAMPLES OF VISUAL CONTROLS
Hydraulic Unit –MP1 Calender
Boiler Fan
Boiler compressed air
Refiner – Wet Section MP1
Wet Section MP2
Starch Kitchen
Starch Kitchen
General Safety TAGs: 366
General
STEP 4 – GENERAL INSPECTION
Actions Performed During Step 4.
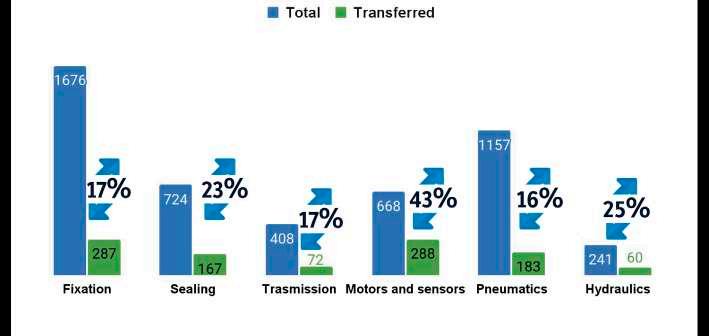
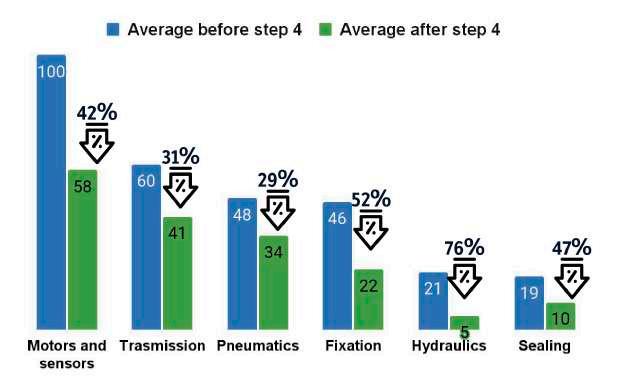
Number of failures by quantity, per category
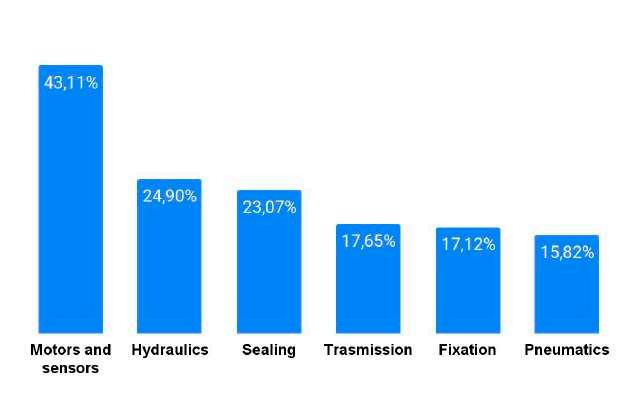
Brazilian standard NR-10 shows us points of attention for the transfer of activities related to motors and sensors due to electrical risks.
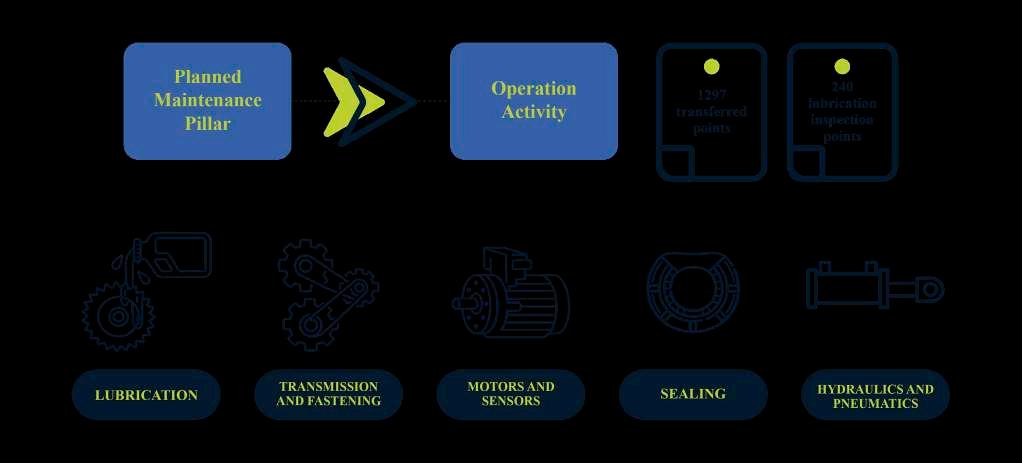
Therefore, Transmission was prioritized for transfer for inspection.
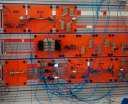
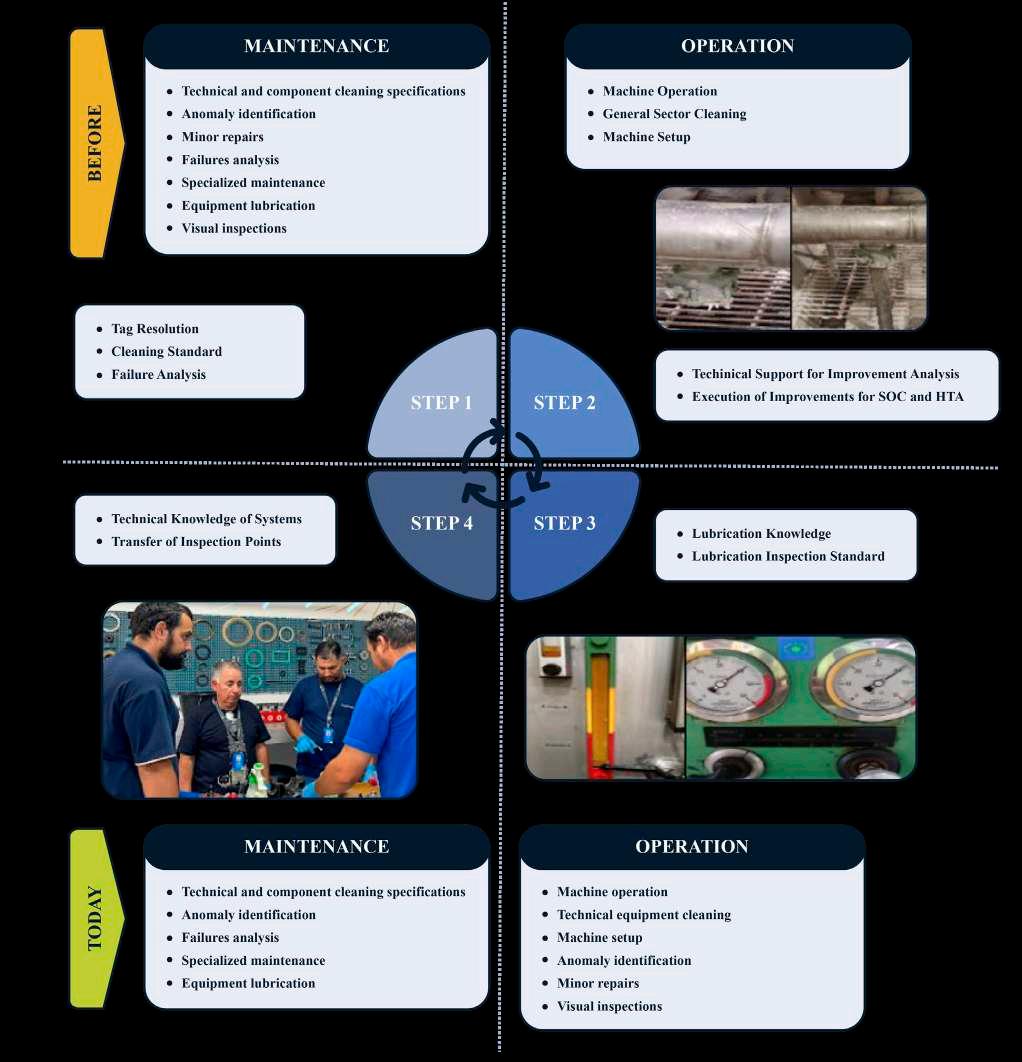
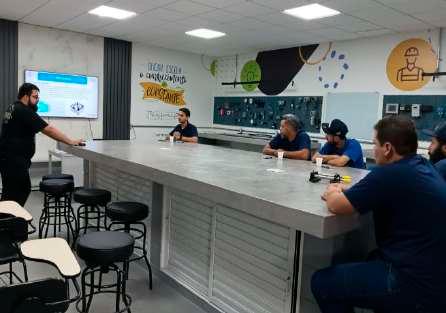
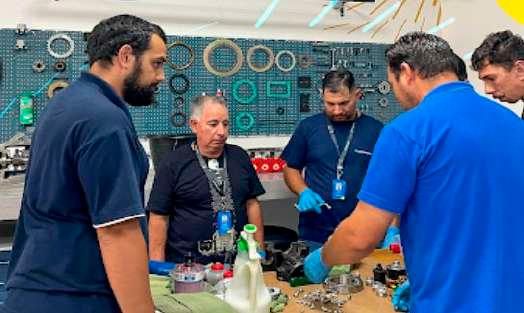
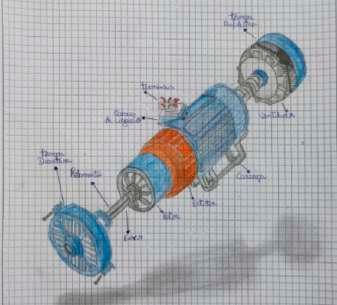
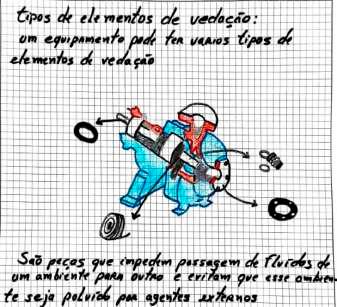
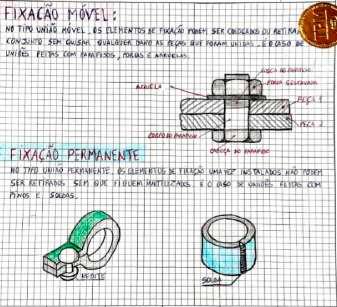
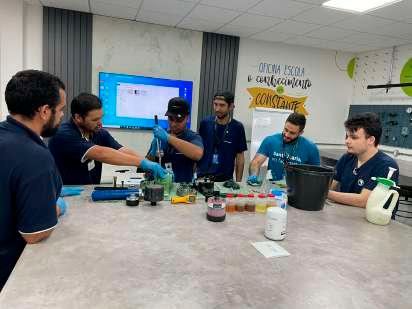
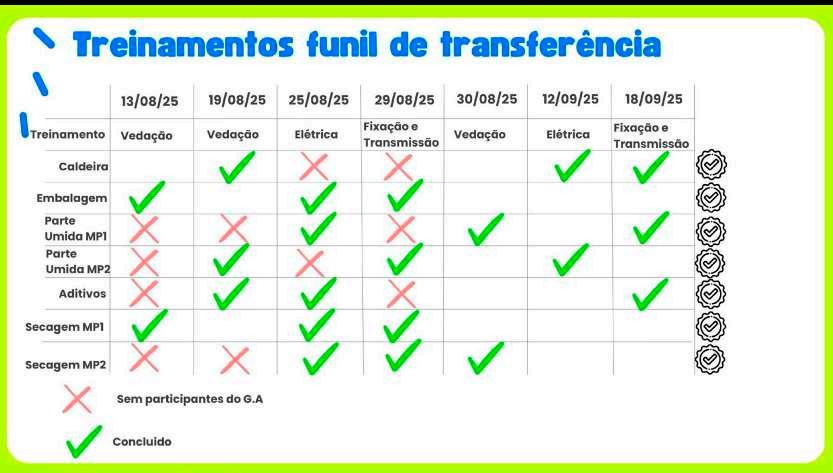
Training on all systems was conducted in our factory training workshop, using customized workbenches for each topic:
Lubrication, sealing, transmission, motors and sensors, hydraulics and pneumatics.
General
Total
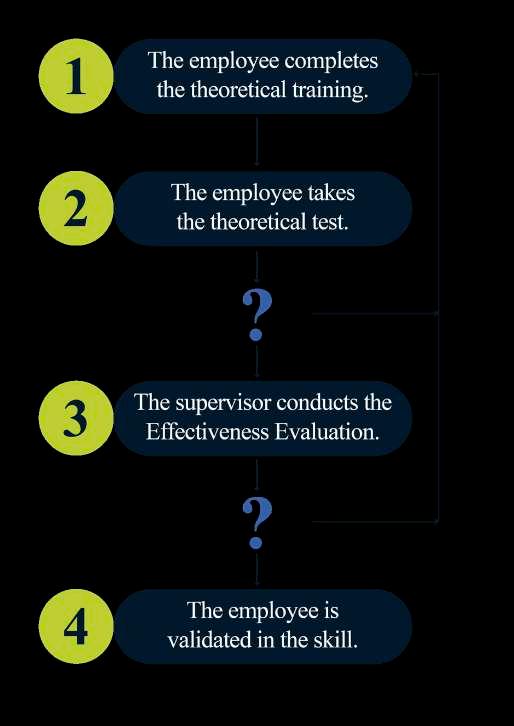
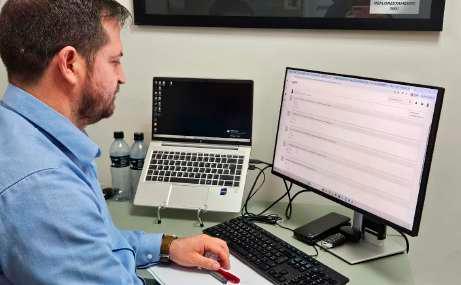
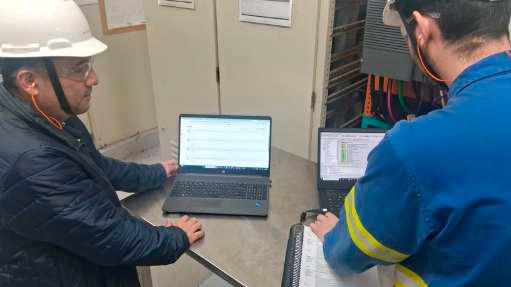
All employees receive theoretical training on the specific system and are then given practical training in our in-plant training workshop, using dedicated training benches. After that, they proceed with field training and validation. The illustrations are shown on the following pAGe, where we present our reality for the transfer of activities from MP → MA, always using OPLs related to the topic to reinforce learning and promote knowledge dissemination.
The transfer of points follows the same method shown in Step 3 after the training sessions.
Below is a reduced example of an inspection checklist used in our factory.
5.9.4.1 INSPECTION POINT TRANSFER PROCESS
Actions Performed in Step 4 – Activity Transfer Flow
Priority defined based on the number of failures per category
Start with theoretical training
Defined which inspection points and how many would be transferred, based on the transfer funnel
Theoretical and practical system training
Genba training and effectiveness assessment
4 Inspection effectiveness assessment
Creation of OPLs related to the topics to strengthen knowledge and routine
5.9.4.2 COSTS AVOIDED THROUGH OPERATIONAL INSPECTION
Operational
Analysis
The MP2 roller bearing showed an abnormal temperature during a routine operational inspection, and the anomaly was reported to Maintenance.
A spare unit was prepared to enable a quick machine shutdown in order to inspect the component and, if necessary, proceed immediately with replacement.
The need to replace the equipment was validated in order to prevent failure and more severe cascading damAGe.
Results
Shutdown planning for inspection;
Preparation of equipment in case of need;
Failure validation and prevention of further damAGe.
Preventive replacement time 1 h 30 min
Support:
Potential damage if not inspected: 36 hours of downtime and additional equipment affected
During the calender replacement, the oil flow inlet hose was mistakenly connected to the flow outlet instead of the inlet.
Solution:
The oil inlet and outlet connections were modified, with one changed to male and the other to female.
Gains:
No losses due to lack of calender crowning.
POKA-YOKE – REB2 – PREVENTION OF ROLL LOSS DUE TO CUTTING FAILURE
Identified Problem:
Loss of rolls due to lack of air pressure in the counter-knives.
Description:
Starting the rewinder operation without pressure on the counter-knives results in roll loss.
Solution:
Installation of an interlock that prevents rewinder operation without air pressure on the counterknives.
Gains:
Elimination of roll losses caused by cutting failures originating from the counter-knives.
Pilot GA
POKA YOKE
POKA YOKE
Female
Male
5.9.4.4
SUCCESS CASE – WET SECTION OF MACHINE 1
Problem
Inefficient fiber recovery through the existing stock circuit.
Objective
Reduction of carbonate and short fiber content in Kraft paper.
Methodology
Root Cause:
Inefficient disc filter
Solution
Installation of a new pipeline for the water supply, allowing for recovery through a more efficient system.
in
Results
Reduction in specific fiber consumption by 17 kg/t
Reduction in specific mineral filler consumption by 6 kg/t
Secondary gain by preventing tank overflows
Annual savings of R$ 401,088.21
Support:
Number of inspection points by category –total and transferred
Total number of inspection points before and after Step 4
Percentage of inspection points transferred by category
Average number of breaks by category – before and after Step 4
42%
Total reduction in average breaks
Total inspections transferred
Number of OPLs per step
Number of red tags per step
of blue tags per step
Total sources of dirt and hardto-reach areas, with quantities of each resolution
Time spent on cleaning and inspection routes (hours/month)
Average number of breaks per step
MP1 Performance (%)
5.10.1
PROGRESS
OF OBJECTIVES AND TARGETS
–
MA PILLAR
MP2 Performance (%)
hours per month)
Chokotei – MP1 (average
Chokotei – MP2 (average hours per month)
MP1 Setup Time (average hours per month)
MP2 Setup Time (average hours per month)
MP1 Tool Change Time (average hours per month)
MP2 Tool Change Time (average hours per month)
FUTURE VISION AND PLANS
Optimization of cleaning and inspection routines.
Increased
and
PILLAR COMPOSITION
6.1.1
PILLAR MISSION, OBJECTIVES AND GOALS
Increase availability while ensuring the planned budget, by providing technical training for maintenance through the three MP steps.
OBJECTIVES
• Structure the Santa Maria Group’s Maintenance Policy and its guidelines.
• Restore the Basic Condition of the equipment.
• Increase machine reliability and availability.
• Eliminate/mitigate breakdowns.
• Ensure the methodology is conducted and managed sustainably.
6.1.2
MAIN ACTIVITIES
6.1.3
6.1.4
KPIs Monitoring Transfer Funnel
AG’s Support
6.1.5
PILLAR VISION AND OBJECTIVES
Due to the pandemic, Scheduled Shutdowns (PPs) were classified as commercial downtime to capitalize on available operational windows. The indicator was not measured in 2020.
The indicators managed by the pillar, with a focus on reliability analysis and improvement, are:
MTBF (Mean Time Between Failures): average time, in hours, between the occurrence of one failure and the next. It is calculated using the formula:
Where TD is the available time (in hours), TR is the repair time (total downtime hours for repairs), and F is the number of failures occurring in the period.
MTTR (Mean Time to Repair): average time, in hours, required by the maintenance team to restore the process after a failure, i.e., the duration taken by the team to correct the failure and return the equipment to operation.
Where TR is the repair time (total downtime hours for repairs) and F is the number of failures occurring in the period.
Availability: percentage of time the equipment remained in operational condition.
Where TD is the available time (in hours) and TF is the failure time (total hours the equipment was down due to failure during the period). Multiply by 100 to obtain the percentage.
Number of Failures: Number of times the equipment failed, interrupting the process.
Scheduled Downtime: Total hours of scheduled shutdowns.
Maintenance Cost: Cost of repairs to maintain equipment in operational condition, including materials and external labor.
Work Order Execution: Percentage of scheduled work orders effectively completed on time by the maintenance team.
Maintenance Plan Compliance: Percentage of scheduled maintenance plans effectively completed on time by the maintenance team.
We developed and implemented quarterly plans from 2022 to 2025, focusing on equipment and condition optimization, improvement of weak points, creation of an information management system, implementation of periodic and predictive maintenance, and continuous evaluation of planned maintenance.
MASTER PLAN
MAINTENANCE STRUCTURE
6.2.1
MAINTENANCE MANAGEMENT AND PLANNED MAINTENANCE PILLAR
Daily Meeting: Daily report meeting with maintenance, production, quality, production planning & control (PCP), and process engineering team leaders to list the day’s difficulties and opportunities.
Weekly Planned Maintenance Pillar Meeting.
Weekly Maintenance Indicators Meeting: Weekly tracking of maintenance and Planned Maintenance (MP) pillar indicators, with supervisors and production control managers (PCM).
Monthly Maintenance Meeting: Monthly meeting with the entire technical maintenance team to discuss indicators and improvement points.
6.3.3
ABC CRITICALITY
Equipment is classified through an ABC criticality matrix, where impacts on safety and environment, quality, production, and cost are scored. This scoring defines the asset classification and, consequently, the maintenance policy applied to it.
6.3.4
MAINTENANCE STRATEGY DEFINITION
Our maintenance structure encompasses corrective, preventive, and predictive maintenance. All are controlled via the IFS system.
AM Basic Condition Restoration Anomalies Breakdowns
Scheduled shutdown to perform safety inspections, overhauls, and preventive maintenance of the plant or a production line. No production is scheduled during this period.
Scheduled shutdown for preventive maintenance on the machine in accordance with the annual maintenance schedule. No production is scheduled for this machine during this period.
Unscheduled downtime due to maintenance or operational delay in equipment release. It occurs exclusively after scheduled shutdowns; it is the additional time the machine remained down due to maintenance or operational activities.
Scheduled shutdown to perform corrective maintenance. This is a shutdown scheduled at least 24 hours in advance to prevent imminent equipment breakdown.
Equipment downtime caused by failures (maintenance), which can be sporadic or chronic, lasting longer than 15 minutes per event.
Emergency downtime (up to 15 minutes) due to failures/defects in equipment or facilities, where maintenance intervention occurs for adjustments or component replacement.
The process runs for 30 or more consecutive days without failure. (Average between scheduled shutdowns).
NO
NO
NO
YES
NO
6.3.6
MAINTENANCE PLANNING AND CONTROL
Maintenance Request Control
Maintenance Plan Control
Material Requisition
Work Order Control
Activity Detailing
Weekly Scheduling
Execution Control
Activity Prioritization
Activity Execution
Material Requisition
Inspection Recording
Verification of Inspection Records and Plan Execution
Planning of Activities Resulting from Inspections
Material Requisition
Consolidation and Prioritization of Scheduled Shutdowns
Planning, weekly scheduling, backlog, and budget indicators are controlled through dashboards with automatic updates every 1 hour.
Budget Tracking and Management
Monthly budgeted vs. actual spending is tracked, as well as the year-to-date accumulated total, considering all maintenance cost package accounts.
Maintenance Backlog Tracking and Management
The work order backlog is racked by discipline and classification, such as routine, red tags, emergency response, and scheduled shutdowns (PG).
RESTORATION OF DETERIORATION AND IMPROVEMENT OF WEAK POINTS
6.4.1
AM’s SUPPORT
Interaction between the planned maintenance pillar and the autonomous maintenance pillar, focusing on restoring the basic condition of equipment and technical training.
6.4.1.1 CONTROL OF FAILURE RECURRENCE
A failure is considered recurrent if it occurs in the same Installation Location, Component, and within a 90-day period! The flow below shows how recurrences should be handled:
6.4.1.2 EXAMPLES OF BREAKDOWN FAILURE ANALYSIS (AQF)PICK-UP (ENCODER FAILURE) MP2
Detailed Description of the Anomaly Title Failures on PM2 - Pick up and Speed Variation.
5W1H Work Definition
1) What / O que?
Where are you seeing the problem? (Failure, breakdown, loss)
2) Where / Onde?
Where are you seeing hte problem? (Line/ Machine/Location)
3) When / Quando? When are you seeing the problem? (Moment it occurs)
4) Who / Quem? Is the problem related to skill? (Does it depend on the operator’s skill?)
5) Which / Qual?
In what way is the trend developing? (Random or is there a pattern? Describe the pattern.)
PM2 Stop - Failures in PM2 Formation - Pick up and Speed Variation. Phenomenon
Technical Summary – Event from 06/25 to 06/27/2027
Pick up and Couch PM2
During the Breakdown/Failure and restart attempt of PM2 on 06/25/2025
Does not depend on operator skill.
Random failure with no trend.
6) How / Como? How did the problem occur? (How does it differ from the standard condition?)
Between the 25th and 27th, failures occurred in the PM2 production process, initially evaluated as started by failures in the vacuum circuit and Pick Up roll and low water pressure; subsequently, in the analysis, a speed difference between rolls was identified, and after failure analysis, slippage on the Encoder shaft was detected.
On 06/25 at 10:40, during a process breakdown, restoration attempts were made. During production resumption, a second event occurred at 11:40, with a record of low water pressure for the machines. In the analysis of possible causes, failures in the vacuum circuit, felt, and Pick Up roll vacuum were considered.
Therefore, equipment inspections were carried out. On 06/26, during the machine restart, speed differences were identified between the drive roll and the Pick Up. The LM Castela team was called to support the synchronization analysis and speed adjustment.
Until the specialized team arrived, the process was maintained with manual speed parameterizations by automation at each grammage change.
At the end of the day on 06/27, at 23:50, slippage was identified on the drive roll Encoder shaft, due to play in the coupling between the Encoder and the Encoder shaft (low interference), which caused speed reading failures.
The Encoder was replaced and installed with high-torque threadlocker on the fixing screw. Since then, the system remains under monitoring until new inspections at a stop opportunity to correct the interference, with no new failures recorded.
Failure Investigation
5 Whys (Root Cause Analysis):
Phenomenon
LOOSE BELT INADEQUATE TENSION BELT STRETCHING AFTER REPLACEMENT
LOSS OF VACUUM IN PICK UP HOLDING ZONE VACUUM VARIATION VERIFIED
LOSS OF VACUUM IN PICK UP HOLDING ZONE VACUUM VARIATION VERIFIED
LOSS OF VACUUM IN PICK UP HOLDING ZONE VACUUM VARIATION VERIFIED
MISSING INDUSTRIAL WATER PRESSURE TRANSMITTER AND VACUUM
CHECK PICK UP PENETRATION UNSTABLE TRIM DETACHMENT AT LC
LACK OR EXCESS OF PENETRATION IN THE PICK UP
PICK UP COUCH SPEED VARIATION MACHINE SYNCHRONIZATION FAILURE SPEED ADJUSTMENT
PICK UP COUCH SPEED VARIATION
SPEED MEASUREMENT FAILURE
SPEED DIVERGENCE WITHOUT INTERLOCK BETWEEN DRIVE AND COUCH (SPEEDS EQUALIZED)
DUE TO MIRRORING OF THE SCREEN DRIVE SPEED IN THE DCS AT THE COUCH SPEED POSITION LOGIC CHANGE
SPEED MEASUREMENT FAILURE BY THE ENCODER LOOSE ENCODER
Root Cause: Ishikawa:
FAILURE IN ENCODER SPECIFICATION FOR EXCHANGING G+ ENCODER TO
Action Plan:
1 PERFORM TENSIONING OF VACUUM PUMP 7 BELT DURING EQUIPMENT INSPECTION ROUTE
2 CHECK ENCODER SHAFT DIAMETER
3 PERFORM BENCH TEST ON THE REPLACED ENCODER
4 RE-ESTABLISH PROCEDURE FOR CHANGE AND FORCING IN ELECTRICAL, INSTRUMENTATION, AND AUTOMATION EQUIPMENT
5 INSTALL INDUSTRIAL WATER PRESSURE TRANSMITTERS FOR PM1, PM2, AND SEALING WATER
6 PERFORM PENETRATION CHECK AT THE NEXT SCHEDULED STOP, CREATE WORK ORDER
7 SPEED LOGIC CORRECTION
8 SCHEDULE PUMP AND CHECK VALVE INSPECTION
9 FLOW CHECK WITH ULTRASONIC METER
INSPECT ON ROUTE AND OPEN WO VACUUM PUMP 7
IDENTIFY POSSIBLE LOW BELT TENSION AND WEAR ON PULLEY AND BELT
CLEVERSON 28/06/2025 Completed
PERFORMED MEASUREMENT OF MOTOR SHAFT AND ENCODER ON THE SCREEN DRIVE MOTOR AND ENCODER
ASSEMBLE MOTOR DRIVE AND ENCODER ON BENCH ELECTRICAL WORKSHOP
ITR REVISION
OPEN SAP FOR INSTALLATION OF METERS
ITR FOR MODIFICATION AND LOGICAL/ PHYSICAL FORCING
TO IDENTIFY INTERFERENCE BETWEEN MOTOR AND ENCODER
VERIFY POSSIBLE ELECTRONIC FAILURE AND ENCODER INTERFERENCE
AVOID LOGIC CHANGES THAT CAUSE DISTURBANCES OR FAILURES IN PERSONNEL SAFETY, PROCESS, AND EQUIPMENT
PM1, PM2 AND SEALING WATER FOR ALARM GENERATION AND PRESSURE HISTORIAN
OPEN WO AND CONTRACT TOPOGRAPHY ALIGNMENT PICK UP X SCREEN
OPEN WO AND SCHEDULE WORKS INDIVIDUALIZATION OF COUCH AND PICK UP SPEED
OPEN WO AND SCHEDULE WORKS
OPEN WO AND SCHEDULE WORKS
10 CREATE OPL (ONE POINT LESSON) FOR OPENING WATER LINE FOR COATER 1 CREATE OPL
PM2 DRIVE
WTS PUMPS 10, 11 AND 12
WTS PUMPS 10, 11 AND 12
WATER SUPPLY VALVE FOR COATER 1
ENSURE PENETRATION BETWEEN PICK AND PULLING
ENSURE EQUIPMENT INTEGRITY
ENSURE BASIC CONDITION (ROTOR, PORT PLATE, PLATES, RINGS, ETC.) AND CHECK VALVES
VERIFY DESIGN VS. ACTUAL FLOW
EVANDRO 04/08/2025 On time
EVANDRO 01/07/2025 On time
MARCOS UENO 14/07/2025 On time
EVANDRO 04/07/2025 On time
CLEVERSON 01/07/2025 On time
EVANDRO 27/06/2025 On time
CLEVERSON 31/07/2025 Completed
EVANDRO 31/07/2025 On time
AVOID WATER HAMMER AND LINE RUPTURE TIAGO 14/07/2025 On time
REVITALIZATION OF INFRASTRUCTURE AND EQUIPMENT
More than 13.1 MBRL has been invested in the revitalization of infrastructure and equipment since 2021.
More than 13.1 MBRL has been invested in the revitalization of infrastructure and equipment since 2021.
Workshop Before
MP2 Refuse Tank Mixer Before
MP2 Refuse Tank Mixer After
Workshop After
Tube Cutting Before
Tube Cutting After
CREATION OF INFORMATION MANAGEMENT SYSTEM
6.6.1
TRACKING OF INDICATORS AND PLANNING AND MANAGEMENT SYSTEM
We record our portfolio information in the ERP IFS and track it through an interactive visual management dashboard with automatic updates every 1 hour. In addition to this main dashboard that directs to others when more details are needed, we monitor performance indicators through another dashboard.
6.6.2
TECHNICAL LIBRARY
Control of manuals and technical information for plant equipment. They are organized and available for team consultation, divided between mechanical, electrical, instrumentation, and automation disciplines.
KPI’s dashboard
ERP used: IFS
6.6.3
ACTIVITIES TRANSFER
The transfer of activities from maintenance to operations occurs after technical training and passing through the transfer funnel. The MP pillar listed 5 systems to train and transfer activities to operations.
CREATION OF A PERIODIC MAINTENANCE SYSTEM
6.7.1
MAINTENANCE PLANS
Maintenance plans are generated automatically on the 20th of every month through our ERP - IFS. Work orders are then distributed to each planner’s portfolio and scheduled in weekly programs, scheduled shutdowns, and general shutdowns.
We track weekly the scheduling and fulfillment of plans.
CREATION OF A PREDICTIVE MAINTENANCE SYSTEM
APPLIED PREDICTIVE TECHNIQUES 6.8.1
Through maintenance plans, we perform thermographic inspections, oil analyses (sent for external analysis), and vibration data collection. We also rely on online sensors for monitoring some assets.
External Analysis Report
41 Equipment Inspected
8 Abnormal conditions detected in 2025
Thermographic Inspection in Progress
R$
407.920,40 Savings from failure anticipation in 2025
451
Equipment Inspected
23 Hot spots detected in 2025
40 Equipment monitored with Dynamox
EVOLUTION OF PLANNED MAINTENANCE 6.9
6.9.1
EVIDENCE OF PREDICTIVE EQUIPMENT MONITORING
Fault identified through spectrum change, enabling the scheduling of a shutdown for cardan shaft replacement.
Cardan shaft after removal from the machine
Detail of the damaged yoke
6.9.2
MAINTENANCE COST
The strategy for utilizing maintenance resources applied to equipment is divided into preventive/ scheduled maintenance, corrective maintenance, and others (such as improvements, for example). Over the years, we can observe that investment in scheduled maintenance, combined with anticipating failures through inspections and measurements, has been increasing.
Reduction from 34% to 19%
From 2021 to 2025, we observe a trend of lower costs with corrective maintenance and higher costs with scheduled maintenance, also reflected in our availability and failure time indicators.
6.9.2.1 MAINTENANCE COST OPTIMIZATION
Rotor and pump plate of the disintegrator
Acquisition
Parts developed with the local supplier
Through the extraction of drawings for the rotor and plate of the disintegrator pump, it was possible to locally manufacture parts that were previously acquired exclusively from the original equipment manufacturer, achieving a 74.8% cost reduction.
A nationalization project was carried out for the Duo Shake Encoder, identifying a domestic supplier with the same specifications as the imported version. This resulted in a 92.2% cost reduction and a significant decrease in delivery time from 90 days to less than 10 days.
Imported Duo Shake Encoder
Duo Shake Encoder nationalized
6.9.2.2 MAINTENANCE STOCKROOM INVENTORY HEALTH
Indicator: Metric used in inventory management to assess efficiency, balance, and overall inventory performance. It analyzes various factors to indicate how healthy the stock is.
Target: Improve by 5 percentage points by the end of 2025 and reach 70% inventory health by the end of 2026.
We are on a growth trajectory with the item sanitization project actions.
Regular: Materials with recurring usage and appropriate turnover. These items align with actual maintenance demand, represent healthy and necessary stock for operations, and justify their presence in inventory.
Slow Moving: Items with low movement during the analyzed period. They are used but at very low frequency, posing a potential risk of becoming dead stock.
No Moving: Materials with no movement (inbound or outbound) during the analyzed period. They may be obsolete, out of use, or remnants from old projects.
Stockout: Represents unmet material needs from inventory. This can cause maintenance delays, equipment downtime, or increased emergency costs.
6.9.3
IMPROVEMENTS AND DAMAGE REDUCTION - POKA YOKE
Problem:
Deformation on the roll circumference, caused by calender closure, due to speed difference between the upper and lower rolls.
Effect:
Exponential increase in vibration and paper defects caused by roll impact, which became evident when exposed to pigments.
Solution:
Logical interlocking implemented, preventing nip closure when speed difference exceeds 1 m/min or when current of one motor is below 20 A between the rolls.
RESULTS AND NEXT STEPS
6.10.1
PAPER MACHINE 1 RESULTS
2020: Affected by the pandemic. Planned stops were performed during commercial stops.
6.10.3
MP2 RESULT ANALYSIS
Losses stratified by impact profile (hours) x occurrences (quantity).
It is possible to observe that one single occurrence accounted for 37.2 hours (43%) of impact on the breakdown failure indicator and, consequently, on availability.
Analysis using the Jack-Knife method, through the generation of a diagram based on frequency and MTTR.
This diagram aims to classify asset failures into four categories: minor failures, chronic failures, acute failures, and critical failures.
The diagram shows that one acute failure, a sporadic occurrence, had a major impact on equipment downtime.
The monthly history shows a positive trend evolution in breakdown failures over the last 12 months, with a standard deviation due to this acute failure in Jun/25.
Availability Indicators (%) and Breakdown Failures (h)
Cumulative Result as of Oct/25
Simulated result excluding the encoder event
6.10.4
FUTURE PLANS
Increase the installed base of online monitoring for Class “A” equipment.
Develop a prioritization plan and timeline for machine coverage.
Deploy a focused team for analysis and diagnosis of identified defects.
Implement visual management for online monitoring.
Integrate vibration data with other variables for better defect correlation and more assertive decision-making.
Conduct PDCA on plant maintenance plans, starting with MP2.
Map plans by type, discipline, and machine to define the action strategy.
Survey failures by equipment and specialty to prioritize assets for FMEA methodology application (MP2).
Restructure the predictive and lubrication team, focusing on execution of sensitive and instrumented plans.
Apply AI to analyze sensitive plans and revise based on resources and criticality.
Consolidate the PCCM team.
Standardize Reliability and PCM processes.
Develop the team toward strategic business objectives, optimize training, and enhance talent management.
Consolidate implemented KPIs and implement new KPIs.
Execute improvement fronts based on MP2 “Bad Actors.”
Conduct reliability studies using RGA (Reliability Growth Analysis) tools and Jack Knife (to prioritize critical, chronic, acute, or minor failures).
Develop Reliability.
Optimize the failure analysis process.
Advance technology (Adopt new technologies, tools, monitoring for data analysis).
Ensure the delivery of defect-free products to the customer through the systematic elimination of quality-related losses in the production process, promoting standardization, control of critical variables, technical assistance, and strengthening the quality culture at all levels of the organization.
• Reduce internal and external defects to zero through the continuous application of quality tools and root cause analysis of non-conforming products.
• Significantly reduce the number of external customer complaints by proactively addressing the root causes of defects and promoting sustainable corrective actions.
• Increase the “zero defect” rate in production by ensuring process standardization, strict control of critical variables, and team engagement in failure prevention.
Liodari Vieira
Guilherme Pavanello
Rocha
Cristiane Antoniazzi
Taciano Musiaki
Claudio Macedo
7 .1.2
The Quality Maintenance (QM) Pillar operates in a preventive and corrective manner, ensuring the maintenance of quality standards in the processes.
7 .1.3
DETAILING OF THE PILLAR ACTIVITIES
Zero Losses: Internal and External: The primary mission of the QM pillar is to eliminate quality losses, both internal (identified before the product reaches the customer) and external (identified after shipment to the customer).
QA Matrix: Map and relate quality parameters to the stages of the production process, aiming to identify critical points, establish preventive measures to avoid defects, and dynamically update the matrix based on improvements, changes, or deviations identified.
Interaction with GAs: Includes holding regular meetings with operational teams to analyze losses and quality results, encouraging active participation of operators in identifying anomalies and proposing improvements. Integration between the QM pillar and the ET (Education and Training), MP (Specific Improvement), and AM (Autonomous Maintenance) pillars, and fostering team autonomy in managing quality within their own process.
Quality Tools: Continuous training on quality tools such as: Ishikawa (cause and effect diagram), 5 Whys, Pareto, PDCA, FMEA, among others.
Quality Dialogues: Presentation of internal and external loss indicators for all shifts and areas of the factory, such as PMs, Cutter, Shipping, and Raw Materials, promoting a sense of ownership within the teams.
Loss
Interaction
QA Matrix Quality Training
7.1.5
7.1.6 7.1.4
HISTORICAL CONTEXT
KEY RESULTS
KEY QUALITY EVOLUTIONS
7 .1.7
LOSS TREE PAPER
MACHINE 1 AND 2
Within the OEE breakdown, the “Quality” item is equivalent to performance. At Santa Maria, the losses are broken down into: Losses due to poor quality (defects and out-of-spec products), process losses (rework due to trim removal or spool waste), and closure losses (rework of non-sellable parts of the usable core from the rewinder). The focus of the QM work is within the losses present in the loss tree under “Losses due to poor quality.”
.1.8
KPI’s
SANTA MARIA STRATEGY PILLAR OBJECTIVES
Reduce the rate of internal and external nonconformities
Ensure the customer satisfaction journey
Ensure a data-driven decision-making process
Ensure operational efficiency
Have engaged teams
Reduce internal defects
Reduce external complaints
Achieve zero defects
7 .1.9
INDICATOR CALCULATION MEMORANDUM (KPI)
Performance = Net Production (t) / Gross Production (t)
Internal Loss Rate Due to Poor Quality = Losses Due to Poor Quality (t) / Gross Production (t)
Complaint Rate = Number of Complaints / Revenue (t) x 1,000,000
% Complaint Cost = ( Invoice Value of Returns - ( Returned Weight × 0.8 × Average Pulp Price)) / Net Revenue
0.8: Fiber recovery factor (it assumes that 80% of the returned material can be reused in the process).
Quality Dialogues (QDs) = Number of quality dialogues conducted with the teams
Adherence to Laboratory Tests Within Specification = Number of Tests Within Specification / Total Number of Tests Conducted
MASTER PLAN 7.2
The members of the QM Pillar meet weekly to manage, plan, and monitor the activities defined in the Master Plan schedule, based on the ten steps of the pillar and the improvement initiatives proposed annually. Below is the master plan with a 4-year vision:
MASTER PLAN
Step 1 - QA MATRIX Quality Assurance
Step 2Analysis of the 4Ms (Machine, Method, Material and Manpower)
Step 3Quality Problem Board
Step 4 - Action Priorization
Step 5Infinite Loop
Step 6 - FMEA (Failure Mode and Effects Analysis)
Step 7Implementation of Improvements
Step 8Review of the 4Ms conditions
Step 9Determination of Critical Inspection Points (Q Points)
Step 10QM Matrix (Quality Monitoring Matrix)
7.3
PILLAR STRATEGY PLAN
Since the beginning of the QM pillar, the strategy has been to enhance preventive practices by strengthening quality maintenance concepts within the production lines
By maintaining corrective fronts, such as failure analysis by loss triggers and working on the immediate correction of out-of-spec parameters, it was possible to reduce defects due to poor quality by 18%.
Focal Points:
Develop a quality culture
Develop KPIs for loss monitoring
Improve service levels
Apply shelf analysis tools
Deepen the understanding of defect origins
Identify potential replications
Strengthen routine management
The details of these fronts will be addressed in the following topics.
In the focus strategy of the pillar, we establish a correlation between value generation for the business and the segments, correlating it with the complaints and defects generated by customers.
Main Client: MOSCHETTI (Represents 58% of the clients in the Sack segment of Santa Maria)
Moschetti Client Breakdown: Defect history
Main defects of the period Out of the
In this way, we have the consolidation of the pillar approach through proactive and reactive action fronts, aiming to contain defects when they occur, so that there is no impact on the end customer. New tools are increasingly being implemented, contributing to the results and customer satisfaction.
Proactive Activities
Quality Manual
Quality control and laboratory analysis of raw materials
Quality Dialogues with Production Teams
Anticipatory Controls
1 1 2 3 4 2 3 5
Pillar Steps
Reduction in the number of occurrences due to poor quality
Reactive Activities
Analysis of Internal and External Non-Conformities (PAC)
Defect analysis
Speed Kaizen
Reduction of costs due to poor quality and customer satisfaction
Zero Defects: no occurrence of a defect for at least 90 days
7.4
QM PILLAR ROADMAP
The activities developed by the Pillar will be demonstrated on the following pages, following the roadmap of the Pillar steps built with the PCM consulting team.
QA MATRIX (QUALITY ASSURANCE) 7.5
Determine, map, and document the current process flow.
After mapping the processes, the defects that may originate in these processes are then identified for the construction of the QA Matrix, relating them to the paper production stages based on internal loss records made by the operators themselves for each section of the paper machines, including Packaging.
Examples of defects that can be found at each stage of the paper manufacturing process. Additives
High absorption
Low absorption
Color out of standard
Without starch
Without r.U.
Low strength
Impurities in the sheet
Permeance out of standard
Moisture profile variation
Curling
Irregular tension
Static Crepe
Wet edge
Lumped
Ribbing
Tied
Air channel
Irregular cut
Hard head
Soft head
Grease on the side
Format outside specifications
Velvety finish
Dented (impact damage)
Packaging error
Damaged edge
Weighing error
Wrapped burst
Impact damage
Incorrect or insufficient identification
Press marks
SURVEY OF THE MAIN NON-CONFORMITIES
After mapping the defects, the next step consists of identifying and detailing the main non-conformities that affect product or process quality. These data were extracted from records originating from internal losses and external customer complaints. In line with the new strategy of acting on the largest losses, the QM Pillar chose to cascade the QA Matrix of all losses generated in the processes by G.A., in order to achieve greater accuracy in addressing the failure modes.
Indicators
The first step was to standardize the recording of losses in the input systems (Trim Paper and IFS) using the defect book. Subsequently, the data were stratified into internal and external losses, applying weightings in accordance with the methodology (severity, frequency, and cost).
8 QA Matrices applied in the GAs
146 possible defects mapped in the process and identification of the most critical equipment parts
The GAs were trained by the QM Pillar members on the QA Matrix.
QM MATRIX
With the consolidation of the QA Matrix, it became possible to structurally identify the critical quality points of the process and the product, as well as to establish the relationship between defects, causes, and control mechanisms. Subsequently, the team developed the QM Matrix, deepening the analysis of the quality characteristics identified in the QA Matrix.
This stage aimed to translate the critical points into controllable process conditions, ensuring quality stability and reproducibility. Thus, the QM Matrix acts as a natural deployment of the QA Matrix, strengthening quality management at the workplace and contributing to the systematic and sustainable prevention of anomalies.
Example of a QM Matrix for Rewinder GA 2.
CURRENT SITUATION ASSESSMENT AND ANALYSIS OF NON-QUALITY DEFECTS IN THE PM1 ROUTINE
Identification of the main defects occurring in the PM1 routine, based on internal loss records and external customer complaints, aiming to prioritize actions on the most critical issues.
ASSESSMENT OF THE CURRENT SITUATION AND ANALYSIS OF NON-QUALITY DEFECTS IN THE
2024 VS. 2025 COMPARISON – PM1
After developing several improvement fronts, it was possible to observe a reduction in the main defects targeted by the initiatives. Subsequently, a comparison of the Pareto charts of defects for PM1 and PM2 between the years 2024 and 2025 is presented.
PM1
Pareto PM1 (2024)
As indicated in the charts, it can be observed that some defects that had the highest impact in 2024 showed lower frequency and occurrence in 2025. For example, the Lumped paper defect, which previously had the highest occurrence, became the second most significant, with a 65% reduction in losses.
2024 VS. 2025 COMPARISON PM2
PM2: 59%
Pareto PM2 (2024)
In PM2, the ribbing defect decreased by 62%, dropping from the first to the third position. Other defects also showed a significant reduction when comparing lost volume (tons): Holes = −70% | Tied = −37% | Lumped = −12%
Pareto PM2 (2025)
DEFECT
ANALYSIS BY TRIGGER 7.5.5
The internal loss analysis flow is developed following a reactive logic, in which a trigger initiates the start of the analysis. Whenever a failure mode reaches the loss trigger (equal to or greater than 2 tons) for the same defect on the same date, the issue is addressed using quality tools.
1
2
DEFECT ANALYSIS: “WITHOUT STARCH” NON-CONFORMITY”
General information about the incident: Brief description of the event; Shift and responsible Supervisor; Impacts: losses (t) and Cost (KBRL).
Analysis Development: Brainstorming with the involved teams; Use of quality tools; Ishikawa and 5 Whys.
Root cause
3
Proposed actions
DEFECT: NO STARCH
4
Results follow-up
DEFECT: “NO
Between 2024 and 2025, five failure analyses were conducted for the “No Starch” defect, with the most recent one in April 2025, when two additional actions were proposed and implemented. As a result, we achieved ZERO DEFECT for this nonconformity, with no record of this occurrence for more than 90 days.
7.6.1
4M TOOL TRAINING
Through the QA Matrix developed for the GAs, it was possible to identify which areas are responsible for the highest generation of defects in the final product. Once the critical area is identified and the process that caused the defect mode(s) is examined, the members of each GA receive training on the 4M tool (Machine, Method, Material, and Manpower) to build the 4M Matrix together with the pillar members. In this way, process mapping was carried out and the ideal production conditions were defined.
Pillar members on-site with the GA developing the 4M Matrix.
7.6.2
4M TOOL APPLICATION
After the 4M Matrix was jointly developed with support from the pillar, it was consolidated with all members across all shifts and, finally, posted on the GA activity board for reference and use.
The Ideal Condition Table was developed for the largest losses identified in the QA Matrix. This table describes all ideal conditions for the 4Ms that, once met, prevent the occurrence of the identified defect modes. Below is an example of a 4M analysis carried out by the Rewinder 2 Autonomous Group.
4M Matrix – Rewinder 2 GA.
PROBLEM BOARD
7.7.1
DEVELOPMENT AND DEFINITION OF THE PROBLEM BOARD
At this stage, the table was completed, establishing the relationship between off-ideal conditions mapped in the 4M analysis and those that may impact the quality of the final product. Based on this assessment, the complexity of each problem was defined, considering the results obtained from the calculation matrix and classifying them as simple or complex. Based on this classification, the most appropriate investigation techniques were determined using the tool shelf of the Focused Improvement (FI) pillar. Finally, owners were assigned for each identified problem in order to ensure the definition and implementation of the necessary actions.
7.7.2
APPLICATION OF A COMPLEX INVESTIGATION TOOL
Perform a 5 Whys analysis for complex investigations; Develop an action plan based on the tool; Apply more advanced tools such as Infinite Looping, PM Analysis, among others, for causes where the 5 Whys analysis was not effective in identifying the root cause of the identified nonconformities.
Example of a 5 Whys analysis for the “Irregular Thickness Profile” nonconformity from the PM2 Dry End GA.
Problem Board – Additives GA.
ACTION PRIORITIZATION
OBJECTIVES:
Determine the tool for action prioritization
Apply the GUT tool (Gravity – Urgency – Trend)
Compile the scoring results from the GUT matrix
In Step 4, all recurring process defects and the actions identified through the 5 Whys analyses were selected, included, and prioritized in the Gravity, Urgency, and Trend (GUT) Matrix.
The GUT Matrix is a management tool used to prioritize tasks. By assessing the urgency, severity, and trend of the nonconformity’s behavior for the Rib defect, it helps the employee decide which items should be addressed first.
GUT
EXAMPLE
APPLICATION
GUT example in the PM2 Wet End and Dry End GA.
Based on the Loss Tree, a recurring failure module was identified that could not be eliminated using the simpler tools on the tool shelf. The Channel defect is a frequently occurring trigger and, between 2023 and 2025, has a history of approximately 15 failure analyses (stemming from customer complaints and internal failures), with multiple actions developed. Therefore, the strategy adopted was to develop a PM Analysis to address this nonconformity.
Reduction of Channel losses in the PM1 GLOSS family
The main objectives of this PM Analysis were to reduce Channel losses in papers from the GLOSS family and to eliminate customer complaints related to this nonconformity at PAPEX, which is one of Santa Maria’s key customers and a contributor to EBITDA.This work has been underway since April 2025, applying analytical decomposition tools with technical support from the PM1 Dry End and Wet End GA. The working group is multidisciplinary, with members from Maintenance, Production, and Quality.The Channel defect causes significant impacts for customers, as it leads to printing irregularities and defects in customers’ final products.
Channel Losses –PM1 GLOSS Family
Definition of basic standards;
Standardization of formation and drying profiles;
Comparative evaluation across production runs.
Main results:
Reduction of Channel losses; Zero Channel complaints from the customer PAPEX.
Data collection; Phenomenon clarification; Relationship analysis using the 4Ms; Ideal profile identification; Deviation and anomaly detection; Real vs. Ideal comparison
Improvement initiative in progress
Expected:
Reduction of Channel losses; Zero customer complaints related to Channel in the GLOSS family.
7.9.2
INFINITE LOOPING
REDUCTION OF UNIDENTIFIED LOSSES IN PM2
Defects classified as “Unidentified” are characterized by their frequency and trend; therefore, the Infinite Looping analysis tool was selected to help reduce this defect.
THEME
Deviation in recording paper losses as “Unidentified” in PM2; this issue occurs at the time of data entry in the production management system and is related to the operator’s experience.
ACTIONS
Reestablish the basic conditions for data entry and control;
Change where the paper’s calculated basis weight is updated;
Automatic update of the paper’s basis weight after weighing each batch on the scale.
ANALYSIS
Nonconformity directly related to manpower and method; Potential system improvements; Review the method for recording the paper’s calculated basis weight.
RESULTS
Data-entry conditions reviewed; Improved accuracy of data entries.
“Unidentified” losses
FMEA TOOL APPLICATION
Together with the ADDITIVES GA, the FMEA tool is being applied. The trigger for using this methodology was the recurrence of certain failure modules related to the dye-preparation kit, such as Color Variation, Specks, and Contamination. These nonconformities stand out due to their high impact and because they are linked to factors that become fragmented when each case is analyzed individually. Based on the QA Matrix and the GUT Matrix, the need to apply this tool was identified. Below is a summary of the work and some results:
THEME
Reduction of defects related to the dye preparation kit (ADDITIVES GA)
The main defect is related to issues with paper color, as well as specks originating from area-related problems.
ACTIONS
Review of basic conditions
Upgrade of the Dye Preparation System;
Review of the system cleaning standard;
Retrofit of the dosing system.
ANALYSIS
Definition of the item and its function
Identification of failure modes
Effects/Consequences of failure modes
Failure cause
Failure severity assessment
Failure occurrence (frequency)
Failure detection
RPN calculation – Risk Priority Number
Recommended actions
RESULTS
Reduction of “Off-Standard Color” and “Specks” defects
Improvement in the area’s 5S; Improved operational effectiveness and accuracy;
After developing the QA Matrix, the Problem Board, and the GUT Matrix, improvement actions were identified, such as the example below related to the pressure chamber reported in the 5W1H.
PROBLEM
The rewinder started operation with the air chamber without pressure.
Knife misalignment, resulting in irregular cutting.
ANALYSIS
There must be no rewinder start-up without air in the knife system;
Maintenance will evaluate the feasibility of a mistake-proofing system so the equipment cannot start without the required air condition.
ACTIONS AND RESULTS
A locking interlock system was created to prevent the equipment from starting without air pressure in the knives.
Poka-yoke:
The rewinder can only start once the air-pressure chamber is activated!
ACTION ON THE PM2 DRYING PROCESS
An example of improvement implementation involves actions on the ROSSJET equipment (responsible for cleaning the forming fabric), with the aim of improving system performance and reducing pinhole defects and web breaks.
This action is linked to the step of restoring basic conditions in the Infinite Looping “Reduction of pinhole defects in PM2.”
PROBLEM
Web breaks and pinhole formation in the paper;
ROSSJET system operating out of standard and with low efficiency.
ANALYSIS
The pinhole issue was defined as complex based on the QA Matrix, the GUT Matrix, and the Problem Board;
The ROSSJET system was operating misaligned, even though it is critical for continuous cleaning of the forming fabric;
Influence of the felt-conditioning kit temperature;
ACTIONS AND RESULTS
Alignment of the system guide and reconditioning with nozzle replacement;
Temperature adjusted from 80°C to 60°C.
ZERO DEFECT: BOND050 Family
Historically, the 6th main family with the highest pinhole losses in PM2!
4M CONDITIONS REVIEW
OBJECTIVES:
Review and execute Step 02 again to improve the process; List, quantify, and compare tables in Step 02 vs. Step 08
We assessed whether the actions were sufficient to eliminate the defect. It was observed that there were still opportunities for improvement; therefore, the process inputs were reviewed again. Below is an example of the review of the 4M “Manpower”:
PROBLEM
No structured control data;
No standardization of the system-checking process;
Lower accuracy in maintaining the process standards for the preparation system.
ANALYSIS
Fluctuations in process parameters lead to losses;
Providing better process-control conditions for Operations would mitigate deviations;
Operations should have access to data and KPIs for monitoring.
ACTIONS AND RESULTS
Purchase of a smartphone for Operations to record control data;
Creation of the database;
Development of KPIs so Operations can manage the data and track results.
DETERMINE CRITICAL INSPECTION POINTS
We used the results to consolidate the inspection items and prepare a component verification matrix on the pilot line in order to ensure quality through rigorous control of conditions.
Based on the analyses and correlations established in the QM Matrix (item 7.5.2), the decision flow was used to determine the process Q Points in a structured manner. This step made it possible to precisely identify the operating conditions and characteristics that have a direct influence on the final product’s performance. Applying the decision flow ensured consistency in defining the Q Points, directing the focus to the controls that are truly critical to quality. In this way, robust monitoring parameters were established at the workplace, ensuring the maintenance of quality standards and the prevention of anomalies at the source of the process.
7.13.1
DECISION FLOW FOR THE Q POINT OF QUALITY INSPECTION
The Critical Control Points were developed by completing the consensus sheet to determine each critical point. After the items are listed in the QM Matrix, they must go through a decision-making flow to assess the need to establish Q Points.
Decision flow for Q Points.
After mapping the process specifications that directly impact product quality, as well as the equipment operating and maintenance instructions, the points that can be verified by GA operators through inspection, cleaning, and lubrication activities were identified. Q POINTS 7.14
IMPROVEMENT PROJECTS
SPEED KAIZEN – REDUCTION OF PAPER LOSSES DUE TO OFF-GRADE SPOT DEFECTS
Due to the occurrences of losses caused by off-grade spot defects and their high potential impact, a Speed Kaizen tool was developed to mitigate risks and reduce losses associated with this failure module.
PROBLEM
Off-grade spots on the paper originating from edge paper on PM2, which downgrade the paper. This is more frequent outside administrative hours and depends on the operator’s skill.
ANALYSIS
The nonconformity is strongly correlated with operational skill;
Weakness in process control;
The need to restructure personnel in the process was identified, in addition to physical structure.
ACTIONS AND RESULTS
Update of ITR PAP_MP2_ITR_0150;
Training with Pulper operators;
Definition of the ideal consistency for edgepaper broke, with the target range of 3.5 to 5%;
Inclusion of Cs% testing in the lab technicians’ routine;
Designation of the operator responsible for AP12 operation outside administrative hours; Internal adjustments to AP12, eliminating areas of stagnant stock.
ZERO DEFECT MATRIX –GA FOLLOW-UPS
Based on the Loss Matrix and GA follow-ups, we developed the Zero Defect Matrix, which aims not only to serve as an overall performance KPI but also to highlight differences among work groups, indicating where more focused attention is needed.
KPIS 7.17
% Yield PM1 (Yield = Quality deployment of the OEE)
% Yield PM2 (Yield = Quality deployment of the OEE)
% losses due to Non-Quality
Customer Complaint Index (ppm)
% Complaint Cost (Complaint Cost / Net Revenue)
% of tests within specification
7.18
FUTURE PLANS
Yield
Seek opportunities to improve Quality and maintain the OEE result.
Customer PM
Increase the percentage of application of new tools with a focus on critical customers and reduce complaint costs.
Complete the PM Analysis application.
Deliverables for G.A.s
Greater understanding by the operating GAs of the QA Matrix (through GA-by-GA visual QA monitoring).
Increase the zero-defect percentage.
Expand employees’ awareness and the evolution of the Quality culture.
EARLY MANAGEMENT PILLAR COMPOSITION
To be a benchmark in delivering products and services, recognized for agile execution and start-up, ensuring product safety and quality at an appropriate cost.
• Create synergy between customers and suppliers so that projects are designed in line with end-user needs.
• Ensure project execution stays on schedule, while complying with safety standards and the approved budget.
• Lead the methodology for innovation and reengineering projects to build a diverse and competitive portfolio.
HISTORICAL CONTEXT
EVOLUTION OF THE MAIN INDICATORS
*For the Early Management Pillar, the BM year was defined as the year the pillar started, in 2022.
** The indicators began to be measured in 2024, when the DRs started to be implemented..
SANTA MARIA STRATEGY PILLAR OBJECTIVES
Ensure, execute, and monitor CAPEX.
Achieve excellence in cost management.
Expand the portfolio.
Reduce the rate of external and internal nonconformities.
Promote customer–supplier synergy aligned with the Company’s needs.
Ensure projects are executed on schedule, safely, and within budget.
Lead the methodology to build a diverse and competitive portfolio.
Deliver projects designed in line with end-user needs.
VERTICAL STARTUP
Represents the weighted average of a project’s schedule, cost, and scope (financial return, zero accidents/defects, customer satisfaction, and loss tree impact).
Represents the adherence rate between the number of days planned to execute a project and the number of days actually spent executing that project.
Represents the adherence rate between the project’s planned cost and the actual cost.
Represents the amount saved in the project cost.
Represents the total number of hours in the year in which Paper Machine 1 and/or 2 experienced downtime due to failures in engineering projects.
Represents the number of Raw Material Info items generated and implemented that are recorded in the Early Management Pillar reference database.
Represents the number of lessons learned recorded and included in the Early Management Pillar reference database.
MAIN PILLAR TOOLS
MASTER PLAN
The Master Plan guides the Early Management Pillar in tracking activities with their respective owners and deadlines. It serves as a strategic roadmap to monitor progress for each activity, identify deviations, and support decision-making, ensuring that each stage is executed in an integrated manner and within the planned schedule.
MASTER PLAN
Map existing Continuous Improvement (CI) processes, document the current workflow (e.g., Makigami), and identify gaps, issues, and improvement opportunities.
Step 1Investigate and analyze the current state
Step 2Establish an Early Management system
Step 3 - Debug the new system and deliver training
Step 4 - Fully deploy the new system
Define project eligibility and complexity criteria, integrate new ideas and DRs into the R&D/ Engineering workflow, and standardize Process Improvement information ensuring traceability across support functions.
Conduct on-site assessments to identify needs, define stakeholders and the workflow including the 7 DRs, establish a KPI review routine, and implement systematic reviews of CI processes to drive continuous improvement.
Develop a performance dashboard, ensure a success rate above 90% for eligible projects, and implement systematic reviews of CI processes to sustain continuous improvement.
Train the team on the new CI workflow, validate its implementation, identify gaps and improvement opportunities, monitor and analyze KPIs, refine the workflow, enhance the management of Process Improvement information, and update the supplier guidelines.
Deploy enhancements to the CI workflow integrating product and equipment DRA, review the project eligibility matrix, and ensure all plant projects are executed in accordance with this standardized model.
99%
Standardize the CI workflow within the management system, broaden Life Cycle Cost (LCC) analyses, train the team in Life Cycle Assessment (LCA) and implement it in a pilot project, develop projects incorporating DRA, and establish a structured process for best-practice sharing and project database management.
8.4.1
ELIGIBILITY MATRIX
In order to provide better clarity on which project or product to implement, an eligibility matrix was developed to create a scoring system that clarifies the choices and classifies them into projects A, B, and C.
The tool helps organizations avoid the initiation of unfeasible projects, facilitating the selection of the most relevant, viable, and aligned with objectives. Projects are scored based on the criteria outlined below.
PRODUCTS AND PROCESSES
Monthly Sales Volume (ton/month)
EBITDA Margin Increase (R$/ton)
Investment
Commercial Risk
Product Competitiveness
EBITDA Margin
Social and Environmental Impact
Implementation Time
EQUIPMENT
Legal Risks
Investment (R$)
Payback (years)
Social and Environmental Impact
Implementation Time
ROI Estimate
Obsolescence
Productivity
Safety
EQUIPMENT
Criticality A (High), B (Medium), and C (Low)
INFO MP - PREVENTIVE MAINTENANCE INFORMATION 8.4.2
PRODUCTS
Criticality A (High), B (Medium), and C (Low)
INFO MP These are the preventive maintenance information that need to be gathered, recorded, and standardized during the development or initial phase of equipment/processes.
Currently, the entry of INFO MP occurs through the Pillar website and the Santa Ideia platform, where, after data collection, it is registered in the database and then applied in the management of future projects.
Registration in the INFO MP database
Application in future project management
Total INFO MPs Generated
* Generated in 2025 based on the Santa
An example of a successful INFO MP is the replacement of encoders (used for measuring motor speed) in AC motor drives. Today, the Sensorless function of the inverter is used, resulting in savings of approximately R$ 15,000.00 per motor.
Santa Ideia
Pilar Website
173
Example of INFO MP
Ideia history
STEP 1 – RESEARCH AND ANALYSIS OF THE CURRENT SITUATION
8.5.1
EVALUATION OF EXISTING WORKFLOWS
Before the implementation of the CI Pillar (2022), a survey was conducted with Project Engineering, Process Engineering, as well as the Research and Development department, aimed at analyzing the workflows already implemented and determining the best way to adapt them to the Design Review methodology, leading to the following conclusion:
We have defined the execution of 6 Design Reviews (DRs) dedicated to product development and 7 Design Reviews (DRs) focused on equipment development.
This structure ensures a balanced approach between innovation and reliability, ensuring that new products reach the market with quality and safety, while new equipment is designed for high performance and operational availability.
With this, we have created the workflows below:
STEP 2 – ESTABLISH AN CI SYSTEM
The Vertical Startup was created to compile the indicators of time, cost, and scope adherence, thus forming the overall project satisfaction score, which is scored as follows: CREATION OF VERTICAL STARTUP - Indicators 8.6.1
8.6.2
DR WORKFLOW FOR NEW PRODUCTS AND EQUIPMENT
8.6.2.1 DR WORKFLOW
8.6.2.2 DR WORKFLOW
STEP 3 - DEBUGGING AND TRAINING OF THE NEW SYSTEM
TRAINING 8.7.1
After the Design Reviews (DRs) were defined, the documentation of the stages was completed, and training sessions were conducted for the Engineering and R&D teams to disseminate the tools on the plant floor.
Training on Pilar CI Tools for Engineering
100% Engineering & R&D trained
Training on DRs and Workflow for the R&D Team
Training of GAs in the new improvement workflow
Training for Engineering Areas on the New Workflow in Compliance with the CI Pillar
Following this, the DRs and Engineering project stages will be described through the pilot project (Case), where the tools were applied for each area.
8.7.2
VOITH REWINDER RETROFIT - MP2
The Voith Rewinder from MP2 was manufactured in 1981, with a design operating speed of 1600 m/min. After several studies, in order to increase competitiveness, it was necessary to increase the operating speed to 2000 m/min, as well as expand the paper mix to over 160 types. After the retrofit, the equipment became safer, more versatile, and more competitive.
VOITH REWINDER RETROFIT - MP2
The graph below shows the volume, in tons, of quality losses for the years 2022, 2023, and 2024 due to issues identified in REB 2.
Based on the data above, it was found that there was an opportunity cost in light of the losses, where this cost is represented in the graph below:
DR1 - PROJECT OPENING REQUEST
SAP Opening
SAP Presentation
In this form, the applicant describes the current situation (whether it’s a new project or an ongoing one), outlining the objectives to be achieved with the request, along with the investment and return estimates.
The SAP presentation is made to the engineering committee and the area leadership that will receive the SAP. If approved, it proceeds to the next stage.
Project Team Definition
In this step, the project team is defined, and the responsibility for the project is assigned to the appropriate area within the plant.
Technical, Safety, and Economic Analysis
Eligibility Matrix
At this stage, the formation of the Life Cycle Costing (LCC) analysis is carried out. Additionally, technical feasibility is assessed, and the safety analysis is performed by the SSMA team. Necessary corrections or recommendations are made based on this analysis.
After this, the project moves to the eligibility matrix for evaluation, which helps to structure the pillar for the project’s respective area.
The application of LCC in this project was crucial in determining the direction the company would take: evaluating the benefits of a retrofit versus the purchase of a new rewinder. In this stage, hypotheses were assessed to provide greater longevity, lower operational costs, and increased versatility. This approach allowed the project to be developed in phased stages, where the gains from each phase contributed to the overall project’s payback.
of a new rewinder from the Hergen brand would cost approximately BRL 25 million. Considering that the maintenance of a new equipment would be about 30% lower than the current one, and that its operational availability, including downtime, would reach 98%, factors such as actual working hours and the equipment’s lifespan were also evaluated. From these parameters, the values highlighted below were obtained.
DR2 - PROJECT OPENING REQUEST
Lessons Learned
Receiving Checklists
The idea is to repeat the aspects that led to success in the project and avoid repeating mistakes made during other initiatives.
Perform research on INFO MP and improvement suggestions to verify or register the information of the referenced project.
If changes are needed during the course of the project, use the prescribed form for documenting them with the necessary signatures.
Assess potential risks and problems that might arise during the project.
Define key indicators and measurable project goals.
Collect checklists for scope evaluation and validation.
Gather suppliers to discuss the project and define a Wish List for any necessary additions.
Submit the project for evaluation by the investment committee, ensuring approval for scope and resource allocation.
The project must be formally opened, with all permissions and scope definitions.
DR3 - PURCHASING
Material List
Quotation
Compile and register the material list.
Identify suppliers for the service and request quotations.
Purchasing Process
Open RC (Request for Quotation) and conduct a technical evaluation.
174
Involved Suppliers
Contract
Drafting
Purchase Order Submission
Draft the purchase contract (if applicable).
Send or formalize the purchase order via email to the supplier.
Detailed Project Schedule
Develop a detailed project schedule, including installation and procurement timelines.
Status Report
Conduct a presentation for the involved areas, presenting the project details.
DR4 - CONSTRUCTION
Kick Off Identification Board
Technical Detailing Site Visit Plan
Conduct a general presentation of the projects, inserting deadlines, schedules, and details of installation with clear objectives to be achieved during the project.
Insert the identification plate with Deadline, Layout, Investment, and Funding Source (Financial source), detailing the project’s objectives and leadership.
Carry out the technical detailing of the project with the suppliers, focusing on equipment specifications, technical discussions, and solutions to meet project goals.
Prepare a plan for technical site visits to monitor progress and ensure compliance with specifications.
Approved Layouts
Document
Approval
Status Report
Ensure the approval of the layout and necessary technical documents.
Perform a technical visit to the site to validate the functionality and performance of the system, ensuring that everything aligns with the approved plan.
Conduct a presentation for the involved areas, providing detailed project status updates.
DR5 - INSTALLATION
Equipment
Installation
Carry out the physical installation of the acquired equipment.
Status Report Vertical
Conduct a presentation for the involved areas, providing details and updates on the project.
Commissioning Plan
Verify, inspect, and test the systems and components of the equipment to ensure they are configured and functioning according to the necessary technical specifications and operational requirements.
Monitor the startup phase, tracking costs, schedules, and scope of the project.
DR6 - COMMISSIONING
Conduct a general project presentation, including timelines, goals, and details of installations with clear objectives to be achieved by the project.
Insert the identification plate with Project Deadline, Layout, Investment, Funding Source, and the project’s leadership.
Develop maintenance plans for the new equipment, including the handover of the equipment to the maintenance department.
Register the equipment in the ERP system (IFS) with the equipment details for operational control.
Perform registration of overdue tasks to ensure they are monitored during the commissioning phase.
Create the As Built documentation for the newly installed equipment, including system details and equipment configurations.
Tag the equipment in the field to link it to the ERP system for easier tracking.
Compile and finalize technical documents related to the equipment and systems installed.
Assess the project execution and review its alignment with initial goals.
Officially close the project and obtain final approval from the Operations and Maintenance department.
DR7 - PROJECT CLOSURE
Lessons Learned
TEP
Communication
Document Lessons Learned.
Document filing
Complete the TEP (Project Execution Term).
Update management documents and communicate via email, presentations, meetings, etc. The communication strategy should be defined in coordination with project stakeholders.
Archive all documentation according to the DR structure folders and finalize the project in the ERP system (IFS).
Acceptance of the DR
SUPPLIER ENGAGEMENT WITH THE TOOL - SUPPLIER HANDBOOK 8.7.3
This handbook is a practical guide that advises suppliers of chemicals and equipment on the application of TPM (Total Productive Maintenance) and 5S methodologies. The objective is to standardize processes, ensure safety, organization, and operational efficiency, as well as align the practices of partners with the Company’s requirements.
PRESENTATION AND ENGAGEMENT OF SUPPLIERS
CONCLUSION AND PROJECT SUMMARY
Results of the Retrofit Project for Rewinder 02, where the first graph represents the time invested per DR.
Financial results of the project, after its implementation in 06/25.
FULL UTILIZATION OF THE NEW SYSTEM
USE OF DRs IN ALL PROJECTS
2025
In the year 2025, DRs were used in all engineering projects at the plant. Below, we have the control of each project that followed the DRs with the methodology.
PROJECTS IN PROGRESS BY AREA
PROJECTS IN PROGRESS IN THE AUTONOMOUS GROUPS (GAS)
MAIN RESULTS OF THE PILLAR
Vertical Startup (%)
Lead Time (%)
Project Cost (%)
Delivery Level (%)
EBITDA Increase - Products (MBRL)
Volume of New Products (t)
Project Savings (KBRL)
Info MP Generated and Implemented
Lessons Learned Recorded
The chart below shows the impact on EBITDA after the implementation of the CI Pillar.
FUTURE OF THE INITIAL EARLY MANAGEMENT PILLAR
Methodology
Maintain consistency in the application of the methodology in product project management. Info MP
Enhance the application of MP Information in operations.
LCC / LCA
Expand the use of the LCC and LCA tools to all projects.
Supply
Consolidate the involvement of key raw material and service suppliers.
Continuously empower employees by developing their technical skills, operational knowledge, and basic equipment maintenance capabilities. The goal is to reduce errors, accidents, and failures while fostering an environment of continuous learning and growth within the company.
• Raise awareness and develop leaders regarding their role and responsibilities in accordance with the program’s established methodology.
• Provide support to all Pillars and Autonomous Groups in carrying out their activities related to each stage of the program methodology.
• Establish and make available tools and resources to advance capability development. PILLAR
HISTORICAL CONTEXT
EVOLUTION OF THE MAIN RESULTS 9.2.1
KEY INDICATORS EVOLUTION
SANTA MARIA STRATEGY PILLAR OBJECTIVES
Map and develop human capital.
Promote cultural alignment. Have engaged teams.
Develop leaders.
Have 90% of Autonomous Group employees trained in the stages.
Achieve 83% Favorability in the Engagement Survey.
Develop 100% of Leadership through the Leadership Development Program.
Pursue the Triple Zero: 0 accidents, 0 defects, and 0 breakdowns.
9.3.1
INDICATOR CALCULATION METHODOLOGY
FAVORABILITY INDEX
It represents the percentage of positive responses (“Always true” and “Mostly true”) to the statements in the Engagement Survey questionnaire. In aggregate, it reflects how positively (“favorable”) employees perceive the work environment.
Formula:
TRAINING RETURN ON INVESTMENT (ROI)
It represents the financial return on the amount invested in training in relation to the benefits generated (fewer accidents, fewer breakdowns, and fewer defects).
Formula:
ACA due to lack of training: Number of accidents (No. – monthly)
Breakdowns due to lack of training: Number of breakdowns (No. – monthly)
Defects due to lack of training: Number of defects (No. – monthly)
Represents the number of trainings completed in the Skills Matrix with verified effectiveness, compared to the number of trainings planned.
Formula:
It represents the employee turnover rate—that is, how frequently employees join and leave the company within a given period.
Formula:
ABSENTEEISM
Represents the frequency and duration of employees’ absences from work, whether due to absences, tardiness, or early departures. These absences may be justified—such as for health reasons or legally mandated leave—or unjustified, when there is no reason accepted by the company or by law
Formula:
Represents the number of structured feedbacks recorded on the People & Management platform, provided by the direct supervisor to the employee, to reinforce positive points related to performance/ behavior and to address any needed course corrections.
Formula:
Represents the number of One-Point Lesson forms developed for knowledge transfer among employees, mainly considering elements of the knowledge transfer funnel, occupational safety, and other topics relevant to the company.
Formula:
Number of One-Point Lessons developed (No. – monthly)
Represents the total training hours dedicated to employee development, whether technical or behavioral, linked to the needs to build knowledge, skills, and/or attitudes required for strong performance.
Formula:
PILLAR OPERATING STRUCTURE
The structuring of the ET Pillar within the Santa Maria Group follows the TPM methodological guidance, ensuring the progressive evolution in the complexity of its responsibilities, projects, and actions based on clearly defined STEPS, as shown in the figure below.
Step 1 - Stablishment of Policies and Guidelines
Step 2 - Development Program
Creation of an Education and Training Policy
Creation of an LPP Form
Definition of Indicators (KPIs and KAIs)
Creation of a Training Request Workflow
Review of job Descriptions
Review and Creation of Documents
Development of a Career and Succession Program
Creation of an Automated Skills Matrix
Creation of an Internal and Eternal Training Workflow
Step 3 - Skills Matrix Implementation
Step 4 - Development Plan
Step 5 - Self-Development Implementation
Step 6 - Assessment of the Current State and Future Planning
Training fot he Transfer of Inspection Skills to G.A.s MASTER PLAN STATUS 94%
Creation of a Tableau Dashboard
Implementation of the Matrices in the G.A.s Leadership Development Plan
Corporate University
Acquisition of Licensed Courses Corporate University Gamification Project (2025/2026)
The methodology implementation is monitored through a dedicated master plan, which details the key activities under the pillar’s responsibility.
9.4.1
STEP 1 - POLICIES AND GUIDELINES
The strategic guidance for delivering the Santa Maria Group’s educational programs is the basis for designing, organizing, delivering, and controlling the various actions carried out by the ET Pillar, in line with the required scope of capability development. Senior Management (Corporate) is responsible for these definitions, and the ET Pillar is structured based on them. Corporate
Defines, guides, and monitors the educational programs (Skills Matrix, IDP, Succession Plan).
Defines the behavioral competencies desired for the Santa Maria culture and monitors the educational programs for all employees.
Develops, delivers, provides partners, and monitors the execution of the educational programs.
Based on information from the Autonomous Maintenance (AM) pillar, defines capability development needs and manages the Training Plan.
Keeps the Skills Matrices up to date.
Based on the strategic guidance, defines and delivers capability development aligned with the Santa Maria Culture.
Development of Leaders and Potential Successors.
Technical and Operational Capability Development (Knowledge and Skills).
Behavioral Capability Development (Attitudes).
9.4.1.1 STRATEGIC DEPLOYMENT OF CAPABILITY DEVELOPMENT
The figure below provides a concise representation of the strategic importance of educational programs in ensuring employees are prepared for the business challenges. In this way, the Santa Maria Group ensures that its Human Development initiatives are continuously fed with information generated from the execution of activities within its core People Management programs.
9.4.1.2 POLICY COMMUNICATION
The ET Pillar provides access to the Training Policy through multiple channels starting from the onboarding of new employees.
During the Onboarding Program, the Policy is presented at a high level. At that time, everyone is invited to take the online course covering its content through the Santa Maria Corporate University.
At the Santa Maria Corporate University: Home > Catalog > Corporate > Education and Training Policy.
The ET Pillar developed and shared a handbook containing the key information related to the Education and Training Policy as applied to employees’ day-to-day work through the pillar’s operation.
This handbook is presented to employees during the Orientation Program upon hiring and again in formal meetings, as needed, to reinforce the concepts, clarify questions, and welcome suggestions.
Handbook
Team Meetings
STEP 2 - DEVELOPMENT PROGRAM
The Development Program is the phase that includes the planning stages for the Santa Maria Group’s capability development demand and the efforts to deliver it: training Internal Instructors, defining the event schedule, providing logistics, and developing instructional resources.
It is an annual cyclical process that includes: identifying gaps in the Skills Matrices, identifying specific needs (for example, the Loss Tree, successor preparation, and IDPs), and all information collected through interaction with the other Pillars—especially AM, PM, FI, and QM.
This information is consolidated into a Development Program that respects employees’ availability to participate in the various training actions, within a budget approved by Corporate.
INTERNAL INSTRUCTOR DEVELOPMENT AND PARTNER DEVELOPMENT
9.4.2.1 INTERNAL INSTRUCTOR DEVELOPMENT
One of the key gains delivered by the TPM methodology, enabled by the ET Pillar, was the development and use of INTERNAL INSTRUCTORS in delivering training.
A dedicated learning path for developing these employees was created in the Corporate University, covering class methodology, content delivery, and the planning and execution of training activities. Special emphasis was placed on Andragogy, which considers the characteristics of adult learning.
At the Santa Maria Corporate University: Home > Catalog > Corporate > Education and Training Policy
They are identified by a dedicated lab coat and receive an “Instructor Kit” with instructional resources to prepare for and deliver classes.
4-hour in-person training + 10 hours online.
Total learning path: 14 hours
In addition to delivering knowledge accurately—given their deep understanding of the company’s structure and operations—Internal Instructors are also responsible for significant savings in training costs.
9.4.2.2 PHYSICAL AND ONLINE TRAINING INFRASTRUCTURE
The ET Pillar has access to a robust infrastructure to deliver its Development Program. Investments in physical training spaces—especially the Training Workshop—and in a dedicated platform to support capability development efforts (the Santa Maria Corporate University) have always been a company priority.
When needed in specific cases, the company also rents venues in the city of Guarapuava to conduct educational activities.
Opened in June 2024
The company maintains a meeting room at the Commercial Association, used for training sessions and workshops (60 seats).
Partnerships:
The WOOD OFFICE, the company’s former administrative headquarters, was renovated and now provides three training rooms (60, 40, and 30 seats).
PULP AND PAPER TECHNICAL PROGRAM, in partnership with the FIEP system.
The 2025 cohort graduated 17 participants, totaling 20,400 training hours for the program.
Training is made available through each role’s dedicated learning paths and can also be accessed directly through the catalogs. In addition to the learning paths, other trainings are available, including behavioral courses.
The goal is to provide self-development opportunities, enabling everyone to strengthen their competencies and prepare to take on higher-level roles.
The Santa Maria Corporate University was created with the mission of expanding development opportunities for all employees by offering courses, training, and learning events across a wide range of areas, while promoting continuous education.
The Corporate University provides role-based courses for technical and behavioral capability development, making it quick and easy to access the content each person needs to perform their role well and prepare for future positions.
2025 AWARDS
Content is available on an ongoing, continuous basis—employees simply need an internet connection via computer or mobile phone.
1,818 courses accessed 9,217 enrollments
Numbers of 2025.
As a form of recognition, we held an awards initiative for the employees who completed the highest number of courses throughout the semester.
The images below record the 2025 awards. The prizes were BRL 250.00 in a gift card, a power bank, and a pizza voucher.
4th – Patrick de Jesus Meira Agricultural Dryer Operator I – 53 courses.
9.4.2.3 ONE-POINT LESSON (OPL)
The OPL is a powerful tool for knowledge transfer.
In addition to democratizing knowledge—in a simple, direct, and objective way—the OPL demonstrates employees’ effective engagement, enabling everyone to participate and showing commitment to TPM implementation.
The figure below shows the OPL form:
The OPL must include a title aligned with the selected topic.
Identification of the category the OPL falls under.
Space to develop the OPL illustration.
Identification details of the OPL author, as well as the equipment studied (if applicable).
Date the OPL was created.
Acknowledgment and approval signature from the direct manager. Identification details of the OPL author, as well as the equipment studied (if applicable).
Each month, the best OPLs are awarded points in the Santa Recompensa Program, and employees can redeem them for prizes of their choice.
The OPL above refers to a lubrication inspection point (IL023) and describes what should be observed and what actions to take in the event of a failure or abnormality in the equipment.
Lubrication
STEP 3 - OPERATIONAL AND MAINTENANCE SKILLS TRAINING
Employee capability development efforts begin with the creation of Learning Paths, which consolidate all the training required for the Operator to perform their work correctly and safely.
Content is available through the Corporate University and/or delivered by Internal Instructors. At the end of each session, the employee completes a Reaction Evaluation related to training quality. After a defined period, the participant’s direct supervisor completes an Effectiveness Evaluation to ensure the content is being properly applied in day-to-day work.
Reaction and Effectiveness Evaluations
Training completion is tracked through dashboards that consolidate, by Autonomous Group (GA), the percentage of completion of the Skills Matrix, breaking down results by employees’ completion and proficiency.
This panel identifies each employee’s level according to the legend ranging from 0 to 3 points.
The dashboard is available to all GAs.
9.4.3.1 SKILLS MATRIX: CONCEPTS
The Skills Matrix is the primary tool of the Education and Training (ET) Pillar and was adopted by Santa Maria to define the knowledge, skills, and attitudes required to perform each role.
With it, the company can manage and develop the competencies essential to operations by assessing employees’ proficiency levels. This mapping guides decisions on training needs and supports workforce movement processes, ensuring professionals are recognized and valued according to their competencies.
The matrix creation process takes place as follows:
This mapping is based on documents such as Policies, Work Instructions, Operating Manuals, APIRs, flowcharts, and other tools that guide task execution.
After the mapping and development of the skills content, employees are trained and assessed according to the scoring below:
Does not know / Not trained: the employee does not yet have knowledge or experience in the activity. They have not received formal training and are not qualified to perform it, requiring initial training.
Knows with restrictions: the employee has a basic understanding of the activity and can perform it with limitations. They still require supervision, guidance, or additional practice to ensure safe and quality execution.
Knows and is qualified: the employee has full command of the activity and performs it independently, following established standards. They deliver safely, consistently, and with quality, without requiring direct supervision.
Reference / Can teach: the employee has advanced mastery of the activity, becoming a technical reference for the team. In addition to performing with excellence, they can guide, train, and support other employees in developing the skill. 1 2 3 4
The ADHERENCE index is the ratio between how many trainings were completed and all trainings that should have been completed by all employees.
Each Skills Matrix is structured based on the employee’s ROLE.
The PROFICIENCY index corresponds to the average of all scores achieved by all employees across all trainings completed.
List of all employees who hold the role and therefore must complete the trainings in the Matrix.
Employee-specific ADHERENCE and PROFICIENCY indices.
Employee proficiency level for the respective skill, following the scale defined in the table below:
List of SKILLS that make up the matrix, corresponding to the knowledge required for strong performance of the activities.
9.4.3.2 SKILLS MATRIX MIGRATION
Situation BEFORE the Skills Matrix modernization (2022):
1. Information management and updates performed manually
2. Lack of data reliability due to the absence of traceability
3. Risk of information loss/manipulation or data changes
(Spreadsheets in Drive)
(Corporate University)
Migrating the Skills Matrices to the Santa Maria Corporate University digital platform provides greater control and security of information, while also delivering a much more user-friendly and accessible experience for employees.
In addition, it was an excellent opportunity to update the entire documentation framework that supports the company’s educational programs.
Review of Job Descriptions
4. Difficulty in visually managing the information Results AFTER
3. AG autonomy to access information 4. Dashboard-based visualization
9.4.4
STEP 4 - SKILLS DEVELOPMENT PLAN
9.4.4.1 COMPANY ONBOARDING
9.4.4.2 ONBOARDING IN THE DESTINATION AREA
After institutional onboarding, the employee is assigned to their work area, where they are welcomed by their supervisor, peers, and their “buddy.”It is the responsibility of the direct supervisor and the buddy to onboard the new employee, following the sequence of activities below.
Familiarization with the workplace; common areas; rules for good coexistence; technical and safety procedures On-the-job training, 5S routines, mandatory training.
The progress of the GAs in the methodology—especially from Step 4 onward—requires intensive training scheduling.
To meet this demand, trainings are scheduled to accommodate the availability of all employees, either through the Corporate University or through the Training Workshop and training rooms, as illustrated in the photos below.
The next figure illustrates the Knowledge Transfer Funnel used in the company, which serves as the basis for the methodology’s evolution.
Data consolidated from 2023 through february 2026.
9.4.4.3 SKILLS VALIDATION FLOWCHART
Considering knowledge transfer needs and the maturity stage of each AG, the ET Pillar develops the training schedule, as shown in the figure below.
Lubrication Training – Training Workshop: 2,989 hours
The flowchart alongside illustrates how the company validates employees’ skills.
Each employee may complete training through the Corporate University or in person, according to the Training Schedule.
Each skill is assessed through a written test taken after the training. The minimum passing score is 7.0. If the employee does not achieve this score, they must retake the training.
Once the minimum score is achieved, the direct supervisor monitors the employee’s performance so that, after 30 days, they can evaluate the effectiveness of the content addressed in the training—that is, the employee’s ability to apply what they learned on the job.
If the employee is deemed qualified, the skill is validated in the Training Matrix. Otherwise, the employee must repeat the learning process, restarting the flow.
EFFECTIVENESS EVALUATION MODEL
The Effectiveness Evaluation is always completed by the employee’s direct supervisor so that it can accurately reflect the results achieved in performing the activities being assessed.
At least 15 days after the end of the training, the evaluation is made available in the Corporate University for the direct supervisor to complete. In addition to the skill itself, other relevant learning aspects are also considered, such as Safety principles and the 5S Program.
At the end of the evaluation, based on the responses to the questions, the direct supervisor determines whether the training was effective and assigns the employee’s proficiency level. If the employee does not reach the minimum index required to be considered qualified, a new training is scheduled, ensuring a minimum period for the employee to properly prepare.
9.4.4.4 SKILLS MATRIX ADHERENCE TREND BY YEAR/MONTH
Skills Matrix adherence, considered together with the Proficiency index of the trainings completed, confirms the incorporation of the knowledge required for Operations to eliminate failures in the process/equipment or in environmental conditions that may lead to failures or errors.
In practice, this is a formal strategy to ensure the basic conditions for carrying out activities, eliminating potential human errors.
From the ET Pillar perspective, the health of this activity is also linked to the speed at which new learning paths are incorporated into the Corporate University, as well as to maintaining the relevance and continuous updating of their content.
The chart below shows the annual trend in Skills Matrix adherence, and the table that follows provides a detailed month-by-month breakdown by role.
The results of the investment in employee capability development can be seen, for example, in the significant reduction in equipment breakdowns, as shown below:
Fastening and Transmission Elements: 35% reduction from 2021 to 2024
Electrical and Motor Elements: 20% reduction from 2021 to 2024
Pneumatic Elements: 19% reduction from 2021 to 2024
Hydraulic Elements: 37% reduction from 2021 to 2024
9.4.5
SELF-DEVELOPMENT PROGRAM
9.4.5.1 SELF-DEVELOPMENT AS A GROWTH STRATEGY
At the Santa Maria Group, self-development is continuously encouraged. In particular, it is part of two highly relevant People Management processes: Attraction & Retention and Performance Management.
In the Attraction & Retention process, the company’s basic premise is to prioritize Internal Recruitment. For this strategy to work, employees must be prepared for opportunities as they arise. The company has always encouraged employees to take training for skills related to the “next-level role,” so that this qualification becomes a differentiator in internal selection processes. With the introduction of the Corporate University, this practice was strengthened and expanded to include topics such as Leadership, Safety, and Behavioral Skills.
The Performance Management process, in turn, aims to drive business results through the evaluation and follow-up of employees’ individual performance, with the purpose of boosting performance, recognizing and valuing top performers, and redirecting those considered below expectations. To support this, employees receive formal feedback sessions and are encouraged to propose learning events that can further enhance their development.
The figure below lists the competencies defined by the company that guide employee growth and development.
9.4.5.2 PERFORMANCE EVALUATION CYCLE
9.4.5.3 CAREER & SUCCESSION MANAGEMENT
Career and Succession Management at the Santa Maria Group includes a set of development actions designed for all audiences:
1. Talent Machine, for interns and apprentices;
2. Trainee Program, for talents who begin their careers in more complex positions;
3. Leadership Development Program, for Specialists, Potential Successors, and current employees in leadership roles.
All of these programs, aligned with the other Development Learning Paths available in the Corporate University, ensure a pipeline of skilled and engaged employees, sufficient to meet the business challenges.
The figure above represents the “Success Journey” of the Talent Machine Program, consisting of a sequence of activities designed to accelerate young participants’ cultural integration so they can take on permanent positions within the company.
EMPLOYEE ENGAGEMENT 9.5
For eight years, the Santa Maria Group has conducted an Engagement Survey to measure employees’ satisfaction levels.
Over this period, it has been possible to confirm an improvement in the positive assessment of working conditions, measured by the Favorability Index.
Dissemination through internal communication channels of the requests that were addressed.
Meetings with managers to present the overall results.
Of the 577 eligible employees, 557 responded voluntarily to the survey (97%), resulting in an 83% favorability score.
A booklet with a summary of the organization’s results, delivered to all employees.
Development of an Action Plan with organization-wide initiatives.
ABSENTEISM
Santa Maria Group believes that a high level of Engagement ensures low Absenteeism rates. Therefore, the ongoing monitoring of this indicator also serves as a “thermometer” of its organizational health.
Historically, the company’s rate has been low, especially when compared to companies in the same sector, which report an average of 2.3% (annual average).
This result is driven by several initiatives, with emphasis on:
a) the company’s continued investment in actions aimed at strengthening and valuing the organizational culture (Company Anniversary, Workers’ Day Celebration, Year-End Party, Family Saturday…),
b) the systematic follow-up of initiatives stemming from the Engagement Survey, whose Action Plans are cascaded down to the lowest organizational level, and
c) investment in health and well-being promotional campaigns (Vaccination, Tea with Them, Internal Prevention Campaigns…).
All these initiatives contribute to creating and sustaining a healthy work environment, including in mental and emotional terms.
CONNECTION WITH BUSINESS RESULT
9.6.1.1 ZERO ACCIDENTS 9.6.1
CONNECTION BETWEEN THE ET PILLAR AND THE “ZERO TRIO”
The tables below show the relationship between the decrease in the number of Lost-Time Accidents (ACA) and the expansion of employee training actions across the various topics related to the performance of their activities. In addition to formal training, a set of educational and preventive campaigns also contributed to the sharp reduction of this indicator.
It is also worth noting that the company has currently achieved almost 600 days without LostTime Accidents, its historical record.
Decision flow and point (S) - - - 4:00 72:00 9:00:00
Análise de acidente de segurança e ambiental - - - 34:00 21:00 24:00:00
The incident occurred on May 9, 2024, at approximately 7:40 a.m., in the Rewinder I area, at the end of the Shift A work period. The employee, who holds the position of Packer, was performing the task of wrapping rolls at the time of the occurrence.
During task execution, due to the large volume of rolls produced, the employee pushed one of them forward and, as he turned to pick up another, the roll that had been pushed moved back, pinning his left knee against another roll.
The employee was assisted by the Safety, Health, and Environment (SHE) team and referred to an orthopedic clinic for medical evaluation. The specialist exam found no fracture—only a mild contusion to the left knee—and there was no need for time away from work.
The incident was classified as a recordable accident without lost time, with the immediate cause identified as an unsafe condition related to moving rolls without proper chocking.
As corrective and preventive actions, the following were carried out: Daily Safety Dialogue (DDS) meetings with all shifts to reinforce awareness of the occurrence; revision of the Packaging Manual and the activity guidance DDS; and development of an OPL for employee training, highlighting the importance of using chocks on rolls.
DDS with the area teams.
62 hours of training on the incident and review of the Packaging Manual.
26 minutes of LPP training on the use of roll chocks.
On May 9, 2024, at approximately 7:40 a.m., an accident occurred in the Rewinder I area at the end of Shift A. The employee, who holds the position of Packer, was performing the task of wrapping rolls at the time of the occurrence. During task execution, due to the large volume of rolls produced, the employee pushed one of them forward and, as he turned to pick up another roll, the roll that had been pushed unexpectedly moved back, pinning his left knee against another roll.
The Safety, Health, and Environment (SHE) team provided initial assistance and referred the employee for evaluation at an orthopedic clinic. The examination identified no fracture, diagnosing only a mild contusion to the left knee. The accident was classified as a recordable incident without lost time, with the immediate cause identified as an unsafe condition related to moving rolls without proper chocking.
Safety Dialogues with Area Teams
Implementation of Safety Dialogues (DDS) across all shifts to discuss and reinforce awareness of the incident.
Document Review
62 hours of training conducted on the incident, along with a review of the Packaging manual.
Training Development and implementation of a Lesson Plan (LPP) to train employees, with a focus on the importance of using chocks for reels.
9.6.1.3 ZERO BREAKDOWNS
The table below shows the training effort carried out by the ET Pillar in recent years to prepare employees in the Autonomous Groups to assimilate the elements of the Knowledge Transfer Funnel.
This table is a consolidated view of the results being achieved through preparing Operators for the effective application of the TPM methodology, as they become capable not only of performing their activities correctly, but also of anticipating and preventing potential breakdowns.
The chart presented below consolidates the number of breakdowns for which the root cause identified human failure (Labor).
Santa Maria operates an industrial site with more than 700 installed electric motors, 510 of which are directly connected to the paper production process. The failure of a single motor can result in several hours of production downtime, significantly impacting operational efficiency. During scheduled maintenance shutdowns, operating teams perform water-jet cleaning in the paper machine areas. To prevent damage, the electric motors are covered with protective plastic sheeting, preventing direct contact with water. However, after cleaning, it is essential to remove these covers to ensure proper ventilation and avoid overheating during operation. On June 7, 2023, after an area cleaning, the team did not remove the protective plastic from the electric motor of the MP1 trim system. When the motor was energized, it overheated, resulting in a complete burnout. Following the failure analysis, one of the main corrective actions implemented was a specific training session for the operating team, reinforcing the importance of area checks and removing plastic protections before restarting the equipment. This measure contributed significantly to eliminating the recurrence of this type of failure and strengthening the culture of safety and operational reliability. This failure was recorded in the downtime system under number 1262106.
Containment Actions
Conduct training on protecting motors with plastic sheeting;
Disseminate knowledge about motors and how to protect them during cleaning;
Provide training on operational checklists after cleaning activities.
9.6.1.4 ZERO DEFECTS
The table below shows the number of hours dedicated to training employees in problem analysis and problem-solving techniques, especially Quality Tools and Speed Kaizen.
From that point on, a significant improvement was observed in the quality of applying tools for analyzing failures and defects. This resulted in more effective actions to minimize/neutralize the occurrence of human failures (Labor).
* Increase in the number of customer complaints due to trials conducted with a new roll wrapper supplier.
9.6.1.5
ZERO DEFECTS – CASE: INCORRECT LABEL (PACKAGING)
Since 2021, a high rate of paper roll returns had been recorded due to labeling errors.
IMPLEMENTATION OF THE ACTION PLAN
The Speed Kaizen concluded that the primary cause was a lack of training.
Interlocks on the Trim Paper system for label printing.
Training employees on the correct placement of internal tags.
Raising employee awareness through a monthly waste/loss report.
Creation of a group to record occurrences and drive actions.
RESULT: SIGNIFICANT REDUCTION IN THE NUMBER OF LABELING ERRORS
KEY PILLAR INDICATORS
FUTURE PLANS
Implement a versatility matrix.
Implement gamification in the corporate university, further encouraging the pursuit of self-development.
Train internal instructors in new technologies.
Implement Step 6 of the pillar — evaluation and future planning.
Implement actions to reduce losses and breakdowns within the pillar’s Zero Trio scope.
Create
PILLAR STRUCTURE
To promote the improvement of administrative processes through the reduction of losses, aiming to increase work effectiveness and optimize time utilization.
• To develop Continuous Improvement in Administrative Processes.
• To promote a Governance Culture across the areas.
• To foster a 5S Culture among employees.
HISTORICAL CONTEXT
10.1.3
KEY RESULTS
STRATEGIC INDICATORS
*Benchmarking
- OTIF 2024
- Inventory Health 2023
- OTD 2025
SANTA MARIA STRATEGY PILLAR OBJECTIVES
Achieve excellence in cost management
Strengthen innovation
Ensure the execution of process-oriented activities
Implement and reduce the Lead Time (OTD) indicator.
Ensure the use of Shelf tools in 100% of failure analyses.
INDICATOR CALCULATION METHODOLOGY
Inventory Health
Total Orders On time In Full Orders X 100
Required item quantity X 100
Closed item quantity
Order Lead Time - OTD* t = invoicing date and time - customer order date and time
5S Program Coverage N = |{ai : ai It’s an area with 5S implemented}|
No. of implemented GAs Office X 100
Adherence to Office GAs
de Makigami Aplicados
10.1.6
MASTER PLAN
Quarterly plans were developed and implemented from the second half of 2023 through 2025, with a focus on 5S implementation, structuring and establishment of Autonomous Groups (GAs), execution of stage cycles in pilot GAs, and actions related to the strategic fronts of the Office Pillar
MASTER PLAN
Mapping of the Administrative Areas
Review 5S Areas, Auditors and Facilitators
Step 1 - Workplace and Information Organization - 5S Application
Step 2Structuring and Formation of Autonomous Groups invoicing date and timecustomer order date and time
Document Management Policy
Application of the 5S Principles
Development of Metrics
Macro-Level Process Mapping
Develop a Criticality/ Risk Matrix for Priority Administrative Process
Definition of Pilot GAs Based on Processess
Develop a Execution Schedule for the Selected GAs in the Requistion-to-Pay Process
Define the Process Mapping Standard and Toolset
Step 3 - Pilot Autonomous Groups Cycle
Step 4 - Strategic Workstreams
Pending continuous activities:
OTIF improvement actions Expansion to 100% of administrative GAs
Development of the Lead Time (OTD) indicator Development of the loss tree
5S PROGRAM 10.2
HISTORY
The 5S Program at Santa Maria began in 2001, initially focusing on the first three senses: Utilization, Organization, and Cleaning. Over the years, it was expanded across the entire company through training, audits, and control mechanisms.
EVOLUTION
In 2022, a 5S Committee was established to review and modernize the guidelines, resulting in improvements such as incentives and new control mechanisms in 2023. In 2024, the program was further strengthened through the involvement of the Office Pillar and the participation of third parties.
STAKEHOLDERS ROLES
Auditors guide and identify improvements, facilitators monitor actions and promote the 5S principles, and operational and administrative areas apply the concepts in their daily activities.
PROGRAM MANAGEMENT
The 5S Program allows any employee to become an auditor through internal campaigns, during which they are trained and qualified for this role. The training ensures alignment with the program’s strategies, preparing participants to conduct audits in a standardized manner.
After the training, auditors are assessed based on their level of knowledge and are assigned strategic areas to audit. Beginners are supported by experienced auditors, which strengthens the team and ensures the continuous improvement of the program.
ASSESSMENT METHODS AND PML
AUDIT AND ASSESSMENT STANDARDS
Audits are conducted quarterly in the areas assigned to each Auditor. Standard documents are used to measure each area’s adherence to the 5S Program, ensuring consistency and enabling the monitoring of score progression over time.
Audit report: is the standard form used to conduct audits, in which each auditor has a standardized and uniform checklist to be applied across all areas.
At the end of the audits, signal indicators are generated, reflecting the scores of the audited area.
Area standard: enables the monitoring of score evolution related to the business area with respect to standardization.
Service Order Tracking: monitors open service orders within the area and displays their status according to the defined deadlines.
Maintenance and Cleaning Standard – PML: Defines the instructions to be carried out and their frequency, standardizing the format, with each employee being trained and properly recorded on an attendance list.
ENGAJAMENTO 5S DAY
TRAINING
TRAINED PEOPLE
TRAINING HOURS MORE THAN
THIRD-PARTY TRAINING – SERVICE PROVIDERS
DIA “D” NA FÁBRICA
5S PROGRAMME ACHIEVEMENTS
5S BEST PRACTICES
Examples of improvements implemented in the plant are visible across various areas of the company.
PUMP FLOOR – ETA
CIVIL WAREHOUSE
RECOGNITION
Auditors and facilitators earn points in the Santa Reward Program. The award criteria are related to the timely execution of audits in the defined locations and the submission of the action plan with completed actions.
The program also uses internal and external communication channels to disseminate information and performance data, in addition to promoting 5S best practices.
GMD
WHAT IS GMD
The Matrix-Based Expense Management Program (GMD) is a strategic initiative aimed at increasing efficiency in the use of company resources by encouraging conscious resource utilization, with a strong focus on cost control and spending efficiency. These expenses are organized into packages, which represent groups of accounts with similar characteristics, enabling collaborative management.
In addition to contributing to the company’s financial sustainability, GMD promotes the professional development of participants, who enhance their analytical and communication skills as well as their systemic business perspective. Participants are recognized as continuous improvement agents, expanding their influence and leadership within the organization. 10.3
MATÉRIA 5S REVISTA SANTA MARIA
SANTA REWARD WEBSITE
10.4
ADMINISTRATIVE GAs
PROCESS MAPPING AND CRITICALITY
In 2023, the Eligibility Matrix was conducted to identify and plan the implementation of Autonomous Groups, positioning and selecting administrative areas as either approved for implementation or deemed ineligible, as well as determining the cycle in which implementation would take place.
The pilot areas, Finance/Tax Records and Procurement, began the implementation process of the Autonomous Groups according to the definitions established in the Matrix.
Also in 2023, 304 administrative processes were identified. Through the application of the CREPS matrix, the Procurement and Finance/Tax Records processes were confirmed as the most critical and offering the greatest improvement opportunities, forming the foundation for and initiating new actions of the Pillar.
With the participation of the Santa Maria Group CEO, the Administrative Autonomous Groups reached their historic implementation milestone in 2024, initiating a sequence of areas gradually trained and expanding the methodology across the organization.
DIRECTION
With the support of Senior Management, the use of the Autonomous Groups methodology was established and prioritized for process standardization and improvement initiatives.
ADMINISTRATIVE AUTONOMOUS GROUPS
After organizing and validating the model, the pilot Administrative GAs were implemented in June 2024, covering the following areas:
Procurement
Finance and Tax Records
AUTONOMOUS GROUP TRAINING
TRAINING PEOPLE TRAINING HOURS MORE THAN
INTRODUCTION FOR NEW AUTONOMOUS GROUPS
EXPANSION
New areas were incorporated into the TPM methodology through the creation of additional Autonomous Groups, training personnel, and standardizing activities.
AUTONOMOUS GROUP IMPLEMENTATION
IMPLEMENTED GAs *2026 Implementation
Throughout the implementation process, additional areas were progressively included with the creation of new Autonomous Groups.
This planned expansion was carried out with the objective of covering the entire administrative environment of the company.
The engagement and results demonstrated by the Autonomous Groups were crucial to their success and expansion.
EXPANSION STRATEGY
The expansion planning is based on the areas eligible for method application.
Each new cycle is carefully aligned with the Business Strategy, aiming to meet the demands of Senior Management, with a schedule defined by the Office Pillar.
10.4.5
STAGE CHANGE AUDITS
The criterion for stage advancement in the Autonomous Groups is determined through the completion of three audits: the Self-Audit conducted by the GA Leader, weighted at 90%; the Pillar Audit, conducted by members of the Office Pillar, weighted at 85%; and the Consulting Audit, weighted at 80%. A cycle of audits is conducted for each stage submission.
AUTONOMOUS GROUP STAGES
CHECK LIST DE AUDITORIAS
At the completion of each Stage, the Administrative Autonomous Group undergoes the Audit cycle (Leader, Pillar, Consulting).
To generate audit scores, the Stage Change Checklist is used, evaluating the following topics:
SSMA – Integration with the Safety, Health, and Environment Pillar
TPM Office Pillar Policy and Strategy
GA Office Organization
GA Office Development – Integration with the Education and Training Pillar
Label Management – Integration with the Planned Maintenance, Autonomous Management, and HSE Pillars
Improvements – Integration with the Focused Improvement Pillar
5S Implementation
Process Mapping – Makigami Steps 1, 2, and 3
Process Improvements – Makigami Steps 4 and 5
GA Office Results
GA Office Self-Assessment and Knowledge
Physical workplace improvements
Mapping of the Current Process Situation Development of Improvements Implementation and Standardization
Autonomous Management
TPM TREASURES
TPM treasures are considered to include visual management boards, one-point lessons for knowledge transfer, and the regular meetings of the Autonomous Groups.
The Office Pillar also holds regular meetings to define standardization across the stages of the Autonomous Groups and to verify the criticality of the processes identified by the Autonomous Groups that will undergo mapping.
The visual management boards of the Supply GA and the Financial + Tax Records GA are displayed on screens in the CSM area, configured as digital visual management boards. Indicator updates are performed on a monthly basis, and each item is displayed in detail through automatic screen transitions.
The GAs have established meeting schedule routines, with meetings held at least once a week. During these meetings, governance topics are addressed, along with area- or processrelated improvements, the status of area and Autonomous Group indicators (KPIs), identified deviations, and action plans to keep indicators within the established targets.
All GAs develop One-Point Lessons with the objective of instructing other areas and/or employees on basic knowledge related to the Group’s area of operation, standards and procedures, implemented process improvements, problem cases, process flows, and internal campaigns of the Santa Maria Group.
GA SUPPLY WEEKLY MEETING
Physical workplace improvements Mapping of the Current Process Situation Development of Improvements Implementation and Standardization Autonomous Management
AUTONOMOUS GROUPS KICK-OFF
The implementation of the Autonomous Groups begins with team training through the practical and dynamic activity proposed by the Office Pillar.
GOVERNANCE
At this STAGE, the Autonomous Group establishes a routine focused on governance, improvements to the physical environment and organization, safety actions, and the consolidation of 5S.
TASK ORGANIZATION – STAGE I
Create a weekly meeting schedule, Define the responsibility matrix, Validate and monitor indicators, Prepare the visual management board, Describe the stage objectives, Conduct training sessions, Develop the skills matrix, Generate safety observations, Maintain the action plan.and the consolidation of 5S.
Physical workplace improvements
MEETINGS
Mapping of the Current Process Situation
The weekly meeting schedule enables the discussion of opportunities in each area, creating forums that support the generation of improvements.
Development of Improvements Implementation and Standardization Autonomous Management
TRAINING
The training sessions conducted in the first stage aim to disseminate 5S best practices and replicate knowledge through One-Point Lessons (LPPs).
SAFETY OBSERVATIONS
As a contribution to the effort of making safety occurrences visible, safety observations have become part of the Administrative GAs.
Physical workplace improvements Mapping of the Current Process Situation Development of Improvements Implementation and Standardization
PROCESS PRIORITIZATION
In Stage II, the groups develop the criticality matrix (CREPS), a tool that makes it possible to identify the most critical process, a fundamental step in selecting the process to be mapped using Makigami.
MAKIGAMI
PRIORITIZED PROCESS
PILOT 1 – FINANCIAL AND TAX RECORDS GA
PURCHASE ORDER x INVOICE ADJUSTMENT REQUEST
With the prioritized process defined, the group identifies potential improvements through the Makigami methodology, describing the process phases and all stakeholders involved.
MAKIGAMI INDICATORS
FINANCIAL AND TAX RECORDS GA
Service Deadline Compliance
Supply Response Time
FINANCIAL & TAX RECORDS GA 14 MAPPED PROCESSES
MAKIGAMI – FINANCIAL AND TAX RECORDS GA
PRIORITIZED PROCESS IN MAKIGAMI – FINANCIAL + TAX RECORDS
MAKIGAMI DEVELOPMENT
The development of the Makigami consists of initially mapping the areas through which the prioritized process flows or with which it has direct interaction, followed by defining the macro activities, which are the stages the process goes through until its completion. The initial mapping is drawn on a paper roll.
Description of the Activity Performed within the Stage
The micro-activities of the stage are described in the sequence in which they occur, using adhesive notes that are placed on the paper roll. In addition, average time measurements per activity and the tools used at each stage are recorded in footnotes. Physical workplace improvements Mapping of the Current Process Situation Development of Improvements Implementation and Standardization
AREAS AND PROCESSES
ACTIVITY MAPPING
Physical workplace improvements Mapping of the Current Process Situation
PRIORITIZED PROCESS
PILOT 2 – FINANCIAL PLANNING GA
PAPER COST CLOSING
MAKIGAMI
Development of Improvements Implementation and Standardization Autonomous Management
After the process prioritization, the group developed the Makigami, describing the stages and the areas involved, with the objective of optimizing and improving the flow.
FINANCIAL PLANNING GA 7 MAPPED PROCESSES
MAKIGAMI INDICATORS
FINANCIAL PLANNING GA
Accounting closings by the 4th business day; Publication of the results booklet by the 5th business day;
Submission of materials to CAD.
MAKIGAMI – COMMERCIAL AUTONOMOUS GROUP
CREPS – FINANCIAL PLANNING GA
STAGE 3 10.5.4
Physical workplace improvements Mapping of the Current Process Situation
IMPROVEMENTS
Development of Improvements Implementation and Standardization
The 83 completed improvements, along with those identified, provide reference points and indicate where efforts should be focused.
The Autonomous Groups generated improvements that impact their own processes as well as other areas of the company, creating agreements and aligning expectations through the use of quality tools.
Autonomous Management
AGREEMENTS
The Financial Planning Autonomous Group carried out actions with key areas that impact its processes, establishing service level agreements related to the completion of accounting entries and the filling of headcounts in the ERP system by the 1st business day.
INITIATIVES
Health and safety campaigns; Defensive driving training; Clothing donation campaign; In addition to several other actions to ensure the continuity of health, safety, and environmental topics.
Physical workplace improvements Mapping of the Current Process Situation Development of Improvements Implementation and Standardization Autonomous Management
In STAGE IV, the implementation of improvements focused on process changes aims to standardize the new workflow, ensuring the continuity and consolidation of gains.
SERVICE LEVEL AGREEMENTS (SLA)
At this stage, the group established service agreements to address the improvement identified during the development of the Makigami.
With the objective of optimizing performance and enhancing synergy among areas, we concluded recent meetings and alignments with important interdepartmental agreements, which were formally documented and signed (SLAs).
This initiative marks the beginning of the definition of new processes that are critical to the results to be achieved by the GA.
The expected positive changes will be closely monitored, and their success will be measured through specific indicators (KPIs), establishing a new benchmark for efficiency and collaboration.
SUPPLY x FINANCIAL AND TAX RECORDS GA - SLA SIGNING
Physical workplace improvements Mapping of the Current Process Situation Development of Improvements Implementation and Standardization Autonomous Management
In STAGE V, the groups demonstrate the effectiveness of the improvements by evidencing their impact on indicators (specific KPIs) over time.
IMPROVEMENT EVIDENCE
In the Financial and Tax Records GA, a clear piece of evidence of the impact of the improvement actions on the invoice recording process is the ELIMINATION of missing documentation as of the action implemented in March 2025.
Other indicators also demonstrate evidence of gains resulting from the GA’s actions.
Annual average payment scheduling time – days
Annual average service level compliance – % of total
10.6.1
STRATEGIC FRONTIERS
CUSTOMER SATISFACTION: FROM NPS TO OTIF
NPS (Net Promoter Score) is a customer satisfaction indicator used by the Santa Maria Group as a standard to measure customer satisfaction with the services provided and their perception of its products.
Until 2023, NPS was measured through 60 questions conducted with customers via telephone calls. The survey was applied in the following year and aimed to understand the level of customer satisfaction. In 2024, NPS began to be measured in a hybrid manner through forms and telephone contact, improving the effectiveness of the survey.
MAIN EVALUATION CRITERIA
Although it directly measures the Santa Maria Group’s commercial relationship with customers, NPS qualitatively evaluates the entire commercial relationship from the end customer’s perceptual perspective. As a result, the company’s internal logistics aspects are not included in the motivations or assessments.
CAUSAL RELATIONSHIP
NPS is complemented by another indicator that measures the percentage of shipments delivered on time (OnTime) and shipments delivered in full, without errors or damage (In-Full). This indicator is commonly referred to as OTIF. When its detractors are analyzed in detail, OTIF has a direct causal impact on NPS.
A high OTIF leads to a high NPS, while a low OTIF translates into an unsatisfactory customer experience, as it reflects delivery delays or shipments that may have been damaged or do not match the original order.
2024: 48%
2025: 53%*
INDICATOR IMPLEMENTATION HISTORY
* Indicator monitoring dashboard till October.
In April 2024, replacing process assessment based on NPS, studies were initiated to implement a more accurate indicator for the quantitative measurement of operational efficiency and the effectiveness of logistics results in customer service.
In December 2024, the first automatic measurements of this indicator began. Since its implementation, the OTIF indicator has been continuously reviewed to align the reasons internally associated with the efficiency and effectiveness of the customer sales process.
INDICATOR MONITORING DASHBOARD
The OTIF dashboard enables visualization of the reasons that represent the main bottlenecks in customer deliveries, allowing identification and treatment of different shipments for different customers.
In the most recent revision, version V3, the monitoring dashboard received updates and the removal of non-OTIF reasons that are outside the control of the Santa Maria Group.
The dashboard provides visibility of the Santa Maria Group’s top OTIF customers, enabling the creation of individual action plans for suppliers whose indicators deviate from expected levels.
To bring this metric closer to Santa Maria Group customers, the Commercial G.A. team, integrated with Customer Service (SAC), has been closely monitoring OTIF and the new NPS measurement approach. New chatbot automations are being developed to support order tracking.
MONITORING OF SALES OUTSIDE OTIF
OTIF PERCENTAGES BY CUSTOMER
OTIF (On-Time In-Full);
RESULTS
*strategic purchases are excluded
GA Adherence to the Office Pillar
Number of Makigamis Applied
10.8
NEXT STEPS
Our next steps outline the strategic vision of the Office Pillar, composed of five interdependent objectives that will guide our actions for 2026 and 2027. Our focus will be on operational optimization and efficiency improvement at all levels, striving for excellence.
EXPANSION TO 100% OF ADMINISTRATIVE AUTONOMOUS GROUPS
DEVELOPMENT OF LOSS TREE
IMPLEMENT THE LEAD TIME (OTD) INDICATOR
ENHANCE THE 5S METHODOLOGY
GRADUALLY IMPROVE THE OTIF INDICATOR
PILLAR STRUCTURE
Strengthening security, health, and the environment as a strategy aimed at sustainability, valuing the life and well-being of employees.
• Reduction of safety and environmental accident and incident rates, with a focus on achieving and maintaining zero accidents.
• Identify, reduce, eliminate, and manage risks, while promoting participation and motivation of all employees regarding Safety, Health, and the Environment. This should be done in compliance with applicable legal requirements, fostering a safe environment that preserves life and the environment.
STRATEGIC INDICATORS
* The environmental index was implemented in 2024, so there are no references from previous years.
** The record of Safety Observations started being computed from 2022.
SANTA MARIA STRATEGY
Maintain compliance with the Environmental Index
Maintain the zero target for accidents with absenteeism
Reduce the real number of accidents without absenteeism
Maintain the zero target for the Accident Gravity Rate (TG)
PILLAR OBJECTIVES
Increase the number of Safety Observations by 10% from 2025 to 2028
Maintain the resolution of green tags at 95%
Maintain the carbon monoxide (CO) indicator at ≤ 500 ppm
11.3.1
CALCULATION REPORT - INDICATORS
INDICATORS - KPIs and KAIs
Environmental Index
Real number of accidents with absenteeism - ACA
Real number of accidents without absenteeism - ASA
Accident Gravity Rate - TG
Safety Observations
Resolution of green tags
Zero accidents with absenteeism - GA’s
Carbon monoxide (CO) generation
CALCULATION REPORT
ACA= Number of accidents with ≥ 1 day of absenteeism
ASA= Number of accidents with < 1 day of absenteeism
Obs. Seg = ∑ Total Number of Observations per Year
% Green Tags= (Total Open tags/ Total Closed tags) * 100
Zero accident = Number of accidents with ≥ 1 day absenteeism per GA
Zero accident = Number of accidents with ≥ 1 day absenteeism per GA
MASTER PLAN
The Master Plan aims to list all the activities necessary to achieve zero occupational and environmental accidents, ensuring that each has a deadline, a responsible party, and an execution order.
MASTER PLAN
Step 1: Raising of Inconveniences
Step 2: Elimination of Inconveniences
Step 3: Development of the Provisional Safety and Environmental Standard
Step 4: Investigation of Accident and Pollution Causes
Step 5: Establishment of Conditions for Zero Accidents and Zero Pollution
The Master Plan’s advancement strategy consists of using tools and addressing inconveniences, aiming to act on the following actions:
11.5.1
POLICIES AND RULES
The Integrated SSMA Policy is the company’s commitment to values related to the Environment, Protection of Health, and the Safety of employees.
The SSMA Policy is made available in the UniversityCorporate and is also communicated in the areas through Campaigns, Quizzes, and OPLs
OPL Creation Contest SSMA POLICY - 2025
A total of 12 OPLs were submitted for the dissemination of the Policy, which reached 374 employees.
SSMA Policy - available on bulletin boards and internal communication networks - TVs, magazines, and the Corporate University.
Quiz Política de SSMA
Traduzir
11.5.2
GOLDEN RULES
The Golden Rules refer to the non-negotiable commitments in Health, with the main objective of ensuring the safety of employees through the establishment of guidelines and procedures focused on mitigating and anticipating potential risks, as well as directing the application of disciplinary sanctions for behavioral deviations or exposure to accident risks.
Training on the Golden Rules occurs through: Onboarding for SafetyEmployees;New Dialogues (DDS); Golden Rules Quiz.
The Golden Rules were widely disseminated across all work areas through Campaigns, Banners, Safety Dialogues (DDS), Magazines, and TVs.”
Onboarding Safety Dialogue Safety Quiz
Quiz
11.5.3
ADHERENCE TO THE GLOBAL COMPACT BRAZIL NETWORK
Since April 2022, Santa Maria has been a signatory of the Global Compact, an initiative by the UN (United Nations) that encourages companies worldwide to align their businesses with the Ten Universal Principles in the areas of Human Rights, Labor, Environment, and Anticorruption.
The goal of the Global Compact is to develop voluntary actions that effectively contribute to societal challenges, as well as provide guidelines for sustainable growth and citizenship.
11.5.4
INCORPORATION INTO THE SUSTAINABLE DEVELOPMENT GOALS
As a company committed to social and environmental responsibility and to building a more just, resilient, and sustainable future, we have incorporated the United Nations’ Sustainable Development Goals (ODSs) into our strategic guidelines, operational practices, and organizational culture.
We believe that the industrial sector plays a key role in promoting positive social and environmental transformations. Therefore, we integrate the SDGs as guiding principles in our projects, goals, and decision-making processes, aligning our economic growth with the wellbeing of people and the preservation of the planet. In the following sections, the ODSs related to the SSMA Pillar are highlighted through their respective icons, showcasing our actions aligned with global sustainability commitments.
The commitment is conveyed during the onboarding of new employees, with the goal of strengthening the culture of adherence to the Global Compact and the ODS.
CERTIFICATIONS AND LICENSES
Santa Maria has held FSC® Chain of Custody certification since 2009, ensuring the traceability of materials from responsible sources throughout its entire production process. In 2024, the company underwent the FSC® Recertification Audit, and after evaluation, its certification was renewed for another five years, reaffirming its commitment to social and environmental responsibility and the traceability of its production chain. This also reinforces the company’s dedication to transparency and the responsible management of forest resources.
In 2024, Santa Maria achieved the ESG Focus Seal, demonstrating the company’s commitment to sustainable practices, transparent governance, and social responsibility, highlighting its positive impact on the environment and society.
INCONVENIENCES IDENTIFICATION
BIRD PYRAMID
The Bird Pyramid relates serious incidents and accidents in a ratio of 1:10:30:600, indicating that for every 1 fatal accident, there were 10 accidents with injuries, 30 accidents with material damage, and 600 minor incidents. Based on this context, Santa Maria used this analogy to distribute safety and environmental events and classify them according to the severity of the occurrences.
ZERO SEVERE ACCIDENTS ENVIRONMENTAL
In the computed period
ZERO ACCIDENTS WITH ABSENTEEISM
Since February 2024
An important prevention tool used to identify anomalies related to workplace safety or the environment. The process involves opening the Green Tag to initiate the stages of registration, tracking, and addressing control actions.
The LPR (Preliminary Hazard Assessment) aims to identify and classify hazards and risks in the workplace to raise awareness of the risks among employees, as well as prioritize control actions according to the matrix below:
To reduce the risks, improvement projects were implemented for the MP2 end transition and training sessions were conducted regarding safety procedures.
LAIA - SURVEY OF ENVIRONMENTAL ASPECTS AND IMPACTS 11.7.4
The LAIA (Environmental Aspects and Impacts Assessment) aims to proactively identify, assess, and control environmental impacts, linking them to current legislation and enabling the implementation of preventive, corrective, or mitigatory measures. It allows the company to understand its interactions with the environment and plan ways to reduce negative impacts, contributing to sustainability and legal compliance.
Category of Impact
Negligible (D)
Moderate (M)
Critical (C)
Significance Filters
Unnecessary
Necessary
Necessary
There was a 15% reduction in the classification of Moderate Risk and an 8% increase in the classification of Negligible Risk, figures considered positive for overall risk control.
ADDRESSING INCONVENIENCES
An important prevention tool used to identify anomalies related to workplace safety or the environment, the process of which consists of opening the Green Tag to initiate the steps of recording, tracking and addressing control actions. GREEN LABEL RESOLUTION 11.8.1
11.8.2
OPL (ONE POINT LESSON )
The One Point Lesson (OPL) represents an important prevention tool, applied through drawings or interactive panels, where employees share knowledge and information about Safety, Health, and the Environment.
Between 2020 and 2025, more than 1,400 LPPs related to Safety and the Environment were generated.
The awarded OPLs are recognized by the “Santa Recompensa Program.”
OPL Awards
11.8.3
PROACTIVE TOOLS
Equipment Lockout
Prevent accidents during maintenance, adjustment, and cleaning activities.
Risk Work Permit (PTR)
Risk work permit to evaluate and prevent risks in non-routine activities. Non-routine risks are indicated with corrective measures.
Green Tag
Register, eliminate, and prevent unsafe work conditions, promoting health and environmental safety.
Emergency Action Plan (PAE)
Establish guidelines to prevent, control, or mitigate risks of chemical, fire, or other emergencies.
SSMA Integration
Process to guide employees on SSMA practices, aligning with company standards.
Raise awareness among employees through weekly meetings on specific SSMA topics.
Safety Observation
Perform safety interventions with a focus on behavior and unsafe actions. Records are made through the mobile app.
SSMA Campaigns
Campaigns focused on accident prevention, quality of life, and employee well-being.
SSMA Inspection
Perform inspections to identify and correct non-compliance with SSMA standards.
Mapping and monitoring of environmental conditions and actions for risk reduction.
DSS (Safety Dialog Sessions)
LPR/LAIA
REACTIVE TOOLS
Graphically communicate basic knowledge, a problem, or a lesson learned as a result of an event or occurrence.
OPL’s One Point Lessons Consequence Matrix
A set of rules and guidelines that govern the application of disciplinary sanctions in accordance with the violation of the Golden Rules or other company regulations.
Accident and Incident Analysis
Identify the root causes, prevent recurrences, improve safety processes, ensure compliance with standards and regulations, and provide a data foundation for the Communication Plan.
In 2025, 03 sanctionsdisciplinarywere applied for non- compliance with the Golden Rules.
11.8.5
WEEKLY SAFETY DIALOGUE
Safety Dialogues held weekly with work teams, focusing on topics identified in Safety Observations, Incident Reports, Maintenance Shutdowns, and other topics recommended by the SSMA (Safety, Health, and Environment) area.
Participation of Internal Employees, Third Parties, and Other Invited Guests.
It occurs at the beginning of shifts and during general Maintenance Shutdowns.
Result: An essential tool for strengthening the Safety Culture.
Disclosure of the Golden Rules.
Dialogue with various topics lasting 10 to 15 minutes.
Participation of Managers, SSMA, and other supervisors.
2024: 979 hours completed.
In 2025: 1,200 hours of DSS were completed.
11.8.6
SAFETY CAMPAIGNS
The Occupational Safety Management’s main objective is to protect the physical and mental integrity of employees, preventing accidents and occupational diseases, while also supporting the performance of operations.
Awareness on Eye Protection
Transportation Safety Awareness Campaign
Campaign for the Prevention of Hand Accidents Health and Safety Awareness Campaign
SIPATMA Internal Week for Accident Prevention at Work and the Environment
Training on Compliance with NR’s (Regulatory Standards)
Training Hours - NR (Regulatory Standards):
2025 = 6.570 h
2024 = 3.249 h
2023 = 1.556 h
2022 = 916 h
2021 = 2.567
2020 = 1.528
11.8.7
OCCUPATIONAL HEALTH CAMPAIGNS
Occupational Health Management aims to create a work environment that promotes the physical and mental well-being of workers through health promotion campaigns. Its goal is to prevent diseases, reduce health risks, promote quality of life, and ensure a safe and healthy work environment.
Prevention campaigns extend to employees and their dependents.
Influenza Vaccination Campaign
Health Campaigns
Blue November (Prostate Cancer Prevention)
Pink October (Breast Cancer Prevention)
MORE LIFE PROGRAM
The More Life Program consists of a set of health initiatives scheduled throughout the year, aimed at promoting the physical, mental, and social well-being of employees and their dependents.
Strategic Projects
11.8.9
ON-SITE MEDICAL PROGRAM
In addition to the Health Campaigns, the company also offers the services of a Medical Professional – General Practitioner, who has a fixed weekly schedule to attend to employees. Their role is focused on health guidance, conducting consultations, home visits, and validating health indicators.
This work aims to ensure that employees are fit for their roles and have their quality of life secured, as well as generate data that can contribute to health initiatives.
Through the data obtained, the company monitors and manages the main ICDs (International Classification of Diseases) related to absences, in addition to developing campaigns and programs focused on prevention and employee well-being.
11.8.10
ZERO ACCIDENT CAMPAIGN
Aiming to maintain constant alignment in the pursuit and maintenance of zero accidents, the SHE Pillar conducts awareness campaigns and celebrations for each milestone of days without accidents resulting in leave. On 02/20/2025, the company celebrated reaching 365 days without accidents, and on 07/07/2025, it surpassed the 500-day mark.
Campaign:
1 Year - 365 Days Without Accidents Resulting in Leave
Campaign:
500 Days Without Accidents Resulting in Leave
Next Challenge: 730 Days Campaign 2 Years Without Accidents Resulting in Leave
730 Days Challenge to be Overcome on 02/21/2026
ENVIRONMENTAL CAMPAIGNS 11.8.11
Environmental Management involves practices and strategies to minimize the environmental impact of industrial operations. These practices are essential to ensure compliance with environmental regulations and promote sustainability. In summary, the department conducts awareness campaigns, field inspections, provides guidance on regulatory compliance, analyzes environmental events, and supports other related actions.
Achievements: 20 overcampaigns two years, with 10 in 2024 and 10 in 2025.
11.8.13
PROACTIVE ACTIONS
SAFETY OBSERVATIONS
With the implementation of TPM, Santa Maria strengthened its focus on a proactive safety approach, placing greater emphasis on the recording of Positive Behaviors and/or Deviations. Starting in 2022, this process began to be tracked through a digital platform, enabling the collected data to be used for the development and execution of Prevention Campaigns, training topics, and other safety initiatives.
From 2022 to 2025, a total of 27,228 Safety Observations were conducted.
Tableau Dashboard Used for data analysis and to guide actions for deviation correction.
Safety Observations: They are recorded through the application.mobile
Through the graph, it is possible to observe an increase in Safe Behavior from 3,853 to 5,844. Period: 2024 to 2025.
Data Management – Tableau Dashboard Awareness Campaigns Focused on Deviations
11.8.14
ERGONOMIC ASSESSMENT
Ergonomics is the science that aims to adapt the work environment to the human being, seeking to optimize comfort and safety in order to increase human–machine efficiency. Based on this principle, the SSMA team prepared the Ergonomic Report, a document intended to map and classify the ergonomic risks present in operational and administrative areas, resulting in the following classification:
Main achievement: Reduction of Moderate Risk from 7% to 4% between 2024 and 2025.
MAIN ACHIEVEMENTS – IMPROVEMENT ACTIONS
Physical exertion and height difference when lifting the reams.
Physical exertion when moving the bins.
system enabling height adjustment between the tables.
A battery-powered mover was adapted to assist in the movement of the bins.
Hydraulic
NOISE ASSESSMENT
According to the Risk Management Program (PGR/2025), an Occupational Noise Assessment was conducted to identify and quantify noise levels in the work environments. Based on the data obtained, it was possible to develop a map indicating the points with the highest noise exposure:
For Sector 3, walls, doors, and windows with acoustic insulation were installed in order to mitigate the risk and provide greater acoustic comfort.
For Sectors 1, 2, 4, 5, and 6, the use of PPE was intensified, and administrative measures were reinforced, such as signage, procedures, and safety inspections.
and Windows with Acoustic Insulation
Operação
SSMA IN PROVISIONAL STANDARDS 11.9
Based on the LPR/LAIA surveys, the SHE Pillar began to support the other pillars in implementing the Provisional Standards, with a focus on identifying the S Points of the Autonomous Maintenance Groups (AM Groups) that present the highest criticality and greatest potential for accident occurrence, as follows: Paper Machines I and II, Roll Packaging, Rewinder I, II, and III. This also applies to environmental events, for example, the Raw Material Warehouse, Chemical Additives Preparation, Boiler, Painting, and the Effluent Treatment Plant (ETP).
Issuance and submission of the CIO (Initial Occurrence Communication).
Occurrence analysis Using the 5W2H and 5 Whys tools.
Action Plan – Qualyteam System.
Assignment of actions to the responsible parties.
Execution and follow-up of actions.
When an accident occurs, the SSMA area is activated to support the analysis of the occurrence.
When an Accident/Environmental Incident occurs, the actions must have a comprehensive scope in order to prevent similar occurrences.
AREA: STORAGE AND DISTRIBUTION – LOST-TIME ACCIDENT | ACA
AREA: PAPER MACHINE I BASEMENT – LOST-TIME ACCIDENT | ACA
AREA: PAPER CONVERTING – LOST-TIME ACCIDENT | ACA
ZERO-ACCIDENT ACTIONS
11.11.1
EMERGENCY RESPONSE
With the aim of improving prevention knowledge and practices, Santa Maria signed a contract with the specialized company BK Treinamentos to continue its prevention initiatives.
In 2025, the trainings focused on: first-aid response, use of prevention equipment (hydrants and fire extinguishers), and plant evacuation systems.
Facing area evacuation and firefighting scenarios, reinforcing the importance of preparedness for emergency situations, ensuring a safer environment for everyone.
Emergency Drill Safety
first!
We have completed another stage of the Fire Brigade Training, focusing on firefighting. The training included theoretical and practical activities, reinforcing our commitment to everyone’s protection.
TRAINING OF NEW EMERGENCY BRIGADE MEMBERS
BRIGADE TRAINING - FIREFIGHTING
CIPA (Internal Commission for Accident Prevention and Harassment) is a group made up of employee and employer representatives. The committee conducts area inspections, supports accident-prevention initiatives, and promotes safety and health campaigns. It also organizes awareness blitzes on the use of vehicle seat belts and supports the organization of the company’s SIPATMA (Internal Week for the Prevention of Workplace Accidents and the Environment). All activities are carried out jointly with the SSMA area, reinforcing the prevention culture.
11.11.4
TOP SSMA AWARD
A program to recognize and encourage Autonomous Groups (GA) that excel in safety, reinforcing the prevention culture.
The award is based on GA performance criteria and is granted to the Autonomous Group (GA) with the best performance during the evaluation period. The trophy is rotating and remains in the winning area for three months; then a new evaluation cycle begins, and the award may be transferred to another GA.
Main criteria for receiving the award:
Completion of SSMA LPPs
Opening Safety Observations
Issuance of Green Tags
No Safety and Environmental incidents
SAFETY DEVICES / POKA-YOKE
NR 12 refers to the set of safety procedures and devices aligned with the Poka-Yoke philosophy, ensuring that machines are installed, operated, and maintained in a way that prevents failures and human error.
SAFETY GATES
Zero accidents in 2024 and 2025 on machines and equipment with NR-12 safety devices
11.11.6
TECHNOLOGICAL INNOVATION APPLIED TO PREVENTION
Technological advances are transforming the way we approach Accident Prevention. Today, innovation is the key to creating safer, more efficient, and better-controlled work environments. We are moving beyond traditional classroom training and entering an era of immersion and precision through the integration of state-of-the-art solutions:
VIRTUAL REALITY GOGGLES APPLIED TO RISK AWARENESS
Virtual Reality (VR) allows employees to use VR goggles to experience immersive, high-risk simulations in a completely safe environment. This results in more hands-on, effective, and impactful learning, teaching teams to make the right decisions without real exposure to accidents.
DRONES FOR INSPECTING HIGH-RISK ACTIVITIES AND AREAS USE
The use of drones represents a major advancement in safety, especially for working-at-height risk activities (such as roof and structure inspections).
Recently, the company began using Synthesia—an AI solution designed to optimize training production. This technology enables the creation of dynamic, customized, and interactive safety training materials.
CASE – SAFETY DURING THE GENERAL SHUTDOWN 11.11.7
Over a 10-day period, from May 21 to 30, 2025, the General Maintenance Shutdown involved 320 contractor personnel and an additional 100 in-house employees. Throughout the shutdown, multiple maintenance and high-risk activities were carried out, such as working at height and confined space work, among others. As a prevention initiative, the SSMA area, together with the Maintenance department, launched several preventive actions that contributed to excellent OSH results.
Safety meetings across multiple work fronts
Key actions that leveraged this result: DDS
Focus on daily follow-up of deviations
Emphasis on Lockout/ Tagout (LOTO) and Work Permits (PTR)
CASE – FORKLIFT | ELECTRICAL ENERGY ZERO CARBON MONOXIDE (CO) EMISSIONS 11.11.8
We are in the process of replacing gas-powered forklifts with electric models—an initiative that is already underway. This change aims to drive continuous improvement in our operations, delivering benefits such as greater efficiency, reduced environmental impacts, and improved sustainability.
A gas-powered forklift, operating an average of 6 hours per day, generates an average annual LPG consumption of 5.5 tons and 16.6 tons per year of CO2 emissions.
Replacing a gas-powered forklift with an electric one has an environmental impact comparable to PRESERVING MORE THAN 750 MATURE TREES in terms of carbon absorption over one year.
ENVIRONMENTAL INDICATORS
Carbon Monoxide (CO) Generation – ppm
Carbon monoxide generation resulting from biomass combustion in the boiler.
Environmental Index
It represents the average of the following indicators: water consumption in the paper machines, energy consumption, treated effluent, serious environmental incidents, and solid-waste generation.
Note: Data for this indicator began to be recorded as of 2024.
ACA - Lost-Time Accidents
Total number of lost-time accidents
ASA - Non–Lost-Time Accidents
Total number of non–lost-time accidents
Severity Rate - TG
TG= Lost Days x 1.000.000 HHT
Total Safety Observations
Monthly/yearly average from 2022 to 2025 and the actual number of Safety Observations recorded from January to November 2025
Green Tag Closure Rate
Closure percentage comparing Green Tags opened versus closed.
FUTURE PLANS
Implement SSMA Gemba walks with leadership (Heads, Coordinators, and Supervisors).
Advance the Speed Kaizen - MP2 water consumption.
Encourage incident reporting.
Improve control and technical support for the GAs regarding Green Tags.
Advance iniciatives to enhance environmental indicators.
EFFECTS OF TPM ON PQCDSME INDICATORS
EFFECTS ON PRODUCTIVITY
OEE (Overall Equipment Efficiency) (MP1 %)
OEE (Overall Equipment Efficiency) (MP2 %)
Productivity for main products
Bette
Bette
Number of Breakdowns (Monthly average)
EFFECTS ON QUALITY
Number of Customer Complaints (PPM)
In-line defect rate (scrap) (%)
Cost Index (Cost/t)
Bette r
Frequency rate (Number of occupational accidents with leave for 1 000 000 worked hours)
Bette r
Bette r
EFFECTS ON SAFETY
Number of work-related accidents requiring days off work (Cases/Year)
Number of work-related accidents not requiring days off work (Cases/Year)