Industry
Outlook
·
Investor
Briefing
·
Q3
2026
Global Construction Market / Cross-Sector Outlook
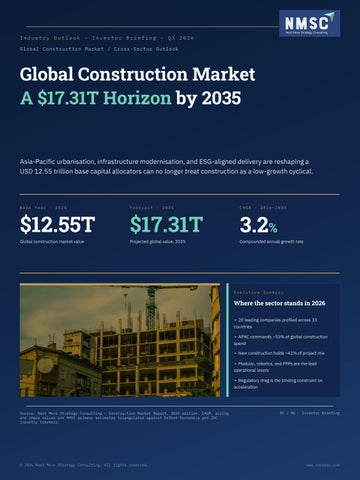
Global Construction Market A $17.31T Horizon by 2035
Asia-Pacific urbanisation, infrastructure modernisation, and ESG-aligned delivery are reshaping a USD 12.55 trillion base capital allocators can no longer treat construction as a low-growth cyclical.
Base Year
· 2025
$12.55T Global construction market value
Forecast
·
2035
$17.31T Projected global value, 2035
CAGR ·
2026–2035
3.2% Compounded annual growth rate
Executive
Summary
Where the sector stands in 2026 ▸ 20 leading companies profiled across 33 countries ▸ APAC commands ~55% of global construction spend ▸ New construction holds ~41% of project mix ▸ Modular, robotics, and PPPs are the lead operational levers ▸ Regulatory drag is the binding constraint on acceleration
Source: Next Move Strategy Consulting — Construction Market Report, 2026 edition. CAGR, sizing and share values are NMSC primary estimates triangulated against Oxford Economics and IDC industry trackers.
© 2026 Next Move Strategy Consulting. All rights reserved.
01 / 06 · Investor Briefing
www.nextmsc.com
02
/
06
·
Market
Landscape
A diversified sector reshaped by urbanisation and infrastructure spend Construction today is a meeting point of transport, housing, energy, and digital infrastructure civil and infrastructure work leads, new build dominates, and APAC sets the global growth cadence.
Regional
Distribution
·
2025
Project-Type
Mix ·
2025
New construction leads the book
Where the USD 12.55T book of work sits Asia-Pacific
~55%
North America
~20%
Europe
~22%
Middle East & Africa
~10%
Latin America
~2.8%
New
construction share
~41% Driven by housing, transport and industrial pipelines across emerging economies. Building
construction
share
~35%
APAC is the marginal growth engine — China, India, ASEAN drive demand; North America and
Residential + commercial demand underpins urban highdensity execution.
Europe deliver compensating margin and refinancing depth.
Construction
Method ·
share
of
work
On-site still dominates; off-site / modular is the fastestgrowing method, expanding fastest in APAC high-density residential and US industrial. ■ On-site dominant ■ Off-site / modular ■ Hybrid & 3D-printed (emerging)
Industry
Ecosystem
Map ·
2025
An interconnected stack where developers, EPCs, financiers and tech providers codeliver Developers
Public & private
›
EPCs & GCs
Integrated delivery
›
Tech & Materials
BIM, modular, robotics
›
Financiers
PPPs, infra bonds
›
Regulators
Codes & ESG
Insight. Stakeholder integration is now a margin lever: EPCs + GCs paired with construction-management firms outperform isolated generalists on cost, schedule, and ESG scores.
Source: Next Move Strategy Consulting; sector-share triangulation against Oxford Economics GCF and IDC Worldwide Construction Tracker (2025–2026 releases).
© 2026 Next Move Strategy Consulting. All rights reserved.
02 / 06 · Investor Briefing
www.nextmsc.com
03
/
06
·
Growth
Drivers
&
Opportunities
Three demand-side drivers one binding regulatory constraint Urbanisation, infrastructure modernisation, and green construction add ~10 pp of CAGR contribution. Permit friction and labour rules quietly shave ~3.5 pp off.
01
02
03
Rapid urbanisation
Infrastructure modernisation
Sustainable / green build
CAGR contribution
CAGR contribution
CAGR contribution
Geography: China, India, Southeast Asia,
Geography: China, India, Vietnam, Indonesia,
Geography: Japan, Korea, Australia, Singapore,
Australia
Thailand
China
Timeline: Medium to long (3–6 yrs)
Timeline: Medium (2–5 yrs)
Timeline: Medium to long (3–6 yrs)
Lever: High-density residential, smart-city
Lever: PPPs, transport & energy corridors
Lever: LEED-certified, low-carbon materials
+4.12%
+3.28%
+2.64%
capex
Restraint
Regulatory complexities approvals, zoning, environmental & labour mandates Multi-jurisdictional permitting and labour rules extend schedules, raise compliance costs, and deter smaller entrants — shaving approximately −3.51 pp from achievable CAGR across Asia-Pacific and Latin America.
High-Growth Operational
Levers
·
Where
the
next margin
and capacity
gains sit
Modular & Pre-fab
Robotics & Automation
Public-Private Partnerships
Off-site fabrication trims schedules, lifts cost
Automated bricklaying, surveying and drone monitoring
PPPs unlock transport, energy and urban regeneration
predictability, and confines material waste — fastest
reduce rework and labour exposure; deploy economics
pipelines that public budgets alone cannot finance; the
scale in dense urban APAC residential and US data-
strongest in industrial and large commercial.
dominant financing vehicle of the decade.
centre shells.
Strategic read. Capital allocators should underweight regions where regulatory drag is unfunded (-3.51 pp) and overweight operators pairing modular construction + PPPs in APAC and US.
Source: NMSC growth-catalyst matrix; impact figures represent decomposition of NMSC 2026–2035 base-case CAGR (~3.2%) across structural drivers.
© 2026 Next Move Strategy Consulting. All rights reserved.
03 / 06 · Investor Briefing
www.nextmsc.com
04
/
06
·
Competitive
Landscape
Scale, execution and PPP access the three axes that separate winners NMSC profiles 20 leading players across civil, building and industrial execution. EPC-integrated operators with strong digital and ESG credentials are absorbing share from legacy GCs.
Positioning Matrix
·
Scale
×
Digital
&
ESG
Maturity
Where each archetype sits in 2026
Leading
Players
·
NMSC Profile
20 profiled operators across 33 countries ▸ Vinci SA
Q1 · Niche Specialists Skanska
FR · EPC
Q2 · Future Winners
Vinci
CSCEC
ACS Group
Q3 · Legacy Volume
Q4 · At Risk
▸ ACS Group
ES · Civil Infra
▸ Bouygues Construction
FR · Building
▸ Hochtief
DE · PPP-led
▸ Skanska
SE · Green build
▸ China State Construction ▸ Bechtel
Bouygues L&T · Bechtel
CN · Mega-projects
Hochtief Strabag
US · Industrial
▸ Larsen & Toubro
IN · EPC
▸ Strabag
Scale & Project Pipeline →
AT · Transport
▸ +10 additional
Full report
Plot labels are illustrative company positions based on backlog depth, integration, and ESG-program score. Source: NMSC company-level assessment, 2026. Common Strategic Levers
• EPC expansion & modular / off-site scale-up • Public-private partnership pipeline build-out • M&A in digital-twin, ESG tech, cross-region (US + APAC) Three
Strategy
Patterns
Defining
the
2026–2030
Race
Geographic Expansion
Strategic Partnerships
M&A and Bolt-ons
Players are anchoring APAC hubs (India, Vietnam,
Technology alliances with BIM, robotics and green-
Acquisitions of modular fabricators, specialty trade
Indonesia) while keeping margin-rich US infra and MEA
materials providers compress project cycle time and lift
contractors and ESG-tech firms are reshaping the
premium-project desks.
ESG-program scores.
middle-tier consolidation map.
Investor read. Back operators with disclosed PPP pipelines, integrated EPC delivery, and modular / off-site scaling capacity — they capture both share and margin.
Source: NMSC competitive landscape study — 20 companies, 33 countries; illustrative positioning based on backlog depth, ESG-program score and integration breadth.
© 2026 Next Move Strategy Consulting. All rights reserved.
04 / 06 · Investor Briefing
www.nextmsc.com
05
/
06
·
Regional
Outlook
APAC carries the global book; capital deploys region-by-region Five regions, five different investment theses. APAC delivers volume and engineering pace; North America and Europe supply margin, refinancing and ESG credibility. 2025 Share Spend
of
Global
Construction
Asia-Pacific
~55%
Volume engine — large-scale urbanisation, industrialisation, infrastructure
Five regions, distinct theses APAC
~55%
Europe
~22%
China + India lead pipelines; Japan, Korea, Singapore lead ESG-compliant delivery. Easiest place in the world to deploy modular at scale — but most exposed to ≤ -3.51 pp regulatory drag.
~22%
Europe
N. America
~20%
Maturity + sustainability premium — Germany, UK, France, Spain, Nordics
MEA
~10%
ESG-anchored bids, BIM-first procurement, and EU climate mandates reshape the design-topermit path. Best margin pool on the globe.
LATAM
~2.8%
N. America
~20%
Federal stimulus + housing shortage — US + Canada infra & data-centre cycle Infrastructure renewal, multifamily housing, data-centre shells and a federal Project delivery push sustain the book through 2030.
GVA share in construction-led economies — Indonesia ~10%,
Vietnam ~7%, Spain/France ~5–6% — confirms APAC as the marginal demand driver.
APAC Construction GVA Share
~55% Strategic
~10%
MEA
LATAM
~2.8%
Premium mega-project desks
Selective industrial / verticals
UAE / Saudi smart-city & tourism; high unit revenue but constrained land & cost.
Brazil, Mexico, Colombia — land & macro volatility limit scale; pick verticals.
global spend
Imperatives
for
the 2026–2030
Cycle
What investors and B2B decision-makers should do now
01
02
03
04
Overweight APAC execution
Pair with EU ESG premium
Modular + PPP operators first
Capture volume and pace; sponsor integrated EPCs with disclosed APAC pipelines.
Deploy capital into green-build operators to harvest the sustainabilityled margin pool.
Underweight regulation-heavy picks Avoid operators concentrated in jurisdictions where −3.51 pp regulatory drag binds hardest.
Source: NMSC regional benchmarking; Oxford Economics GCF; share-by-region estimates triangulated against publicly reported country GDP and construction GVA series.
© 2026 Next Move Strategy Consulting. All rights reserved.
Stack marginal share with operators scaling off-site and PPP delivery through 2030.
05 / 06 · Investor Briefing
www.nextmsc.com
06
/
06
·
Connect
With
Us
Thank You For in-depth insights and strategic guidance on the global construction market, our industry analysts are ready to engage.
Contact
Next
Move
Strategy
Consulting
Official Website
Report Library
www.nextmsc.com
nextmsc.com/report/construction-market
Phone
+1 857 758 5017
info@nextmsc.com
Address
Next Move Strategy Consulting · Global Intelligence, On-Demand
Get
the
complete
construction
market
report
Request Custom Briefing
nextmsc.com · report library Follow
NMSC ·
in
f
Stay
Current
on Sector
Request Custom Briefing
Intelligence
YouTube X
◉
linkedin.com/company/next-move-strategy-consulting
linkedin.com/company/next-move-strategy-consulting facebook.com/Next-Move-Strategy-Consulting
facebook.com/Next-Move-Strategy-Consulting youtube.com/channel/UCJuVRxfBo-Dsog7BgDE4uPQ
youtube.com/channel/UCJuVRxfBo-Dsog7BgDE4uPQ
Industry briefing prepared for: Potential Investors · Internal Stakeholders · B2B Decision-Makers — Q3 2026 release.
© 2026 Next Move Strategy Consulting. All rights reserved.
twitter.com/nextmsc
twitter.com/nextmsc instagram.com/nextmsc
instagram.com/nextmsc 06 / 06 · Investor Briefing
www.nextmsc.com