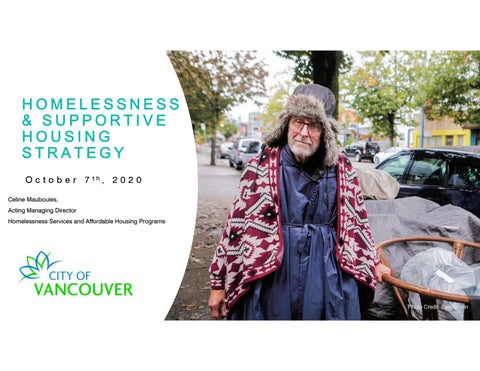
HOMELESSNESS & SUPPORTIVE HOUSING STRATEGY October 7
th
, 2020
Celine Mauboules, Acting Managing Director Homelessness Services and Affordable Housing Programs
Photo Credit: Lani Brunn
We acknowledge we are on the unceded territories of the xʷməθkʷəy̓əm (Musqueam), Sḵwx̱wú7mesh (Squamish), and Sel̓íl̓witulh (Tsleil-Waututh) Nations. Art by Jordan Gallie, from Tsleil-Waututh Nation
• O v e r v i e w o f H o m e l e s sn e s s i n Va n c o u v e r
PRESENTATION
(2020 Count) • W ha t We H a v e Le ar n ed • A Systems-Based Approach • Our Strategy
A n
O v e r v i e w
HOMELESSNESS IN VANCOUVER
Photo Credit: Lani Brunn
2020 METRO VANCOUVER HOMELESS COUNT MARCH 3,4 •
24-hour Point-in-Time snapshot of people who are experiencing homelessness
•
2020 is the first time all the counts aligned – federal, provincial & regional in the same year
•
Over 500 trained volunteers in Vancouver alone
•
Provides a basic demographic profile & tracks trends over time
•
Considered an undercount
•
Took place before the provincial government declared a state of emergency on March 18th and related restrictions
2020 METRO VANCOUVER HOMELESS COUNT PARTNERS This project is funded in part by the Government of Canada’s Reaching Home: Canada’s Homelessness Strategy: With support from:
2020 Homeless Count Indigenous Partners Lu’ma Native Housing Society & The Indigenous Homelessness Steering Committee (IHSC) 7
2020 Homeless Count Results
2,095
PEOPLE IDENTIFIED AS HOMELESS IN VANCOUVER ON MARCH 4, 2020
547 UNSHELTERED 1,548 SHELTERED
Slight decrease from last year (-5%) This is partly attributed to survey fatigue – only those who were approached and who gave consent were enumerated.
UNSHELTERED INDIVIDUALS BY HOMELESS COUNT AREAS
Note: The areas represent Count areas, which may not always match with known neighbourhood borders.
2020 HOMELESS COUNT: HOMELESSNESS IN METRO VANCOUVER
+21%
2017-2020 Change -2%
+80%
-8%
-26% -8%
+21% -28%
+7% +1% -28%
84%
from Vancouver
MAJORITY OF PEOPLE WERE LIVING IN VANCOUVER when they found themselves without a home.
2020 HOMELESS COUNT: CAUSE OF LOSING HOUSING 80% 70%
69%
multiple responses possible
60% 50% 39%
40%
39%
30% 19%
20% 10% 0% Housing & financial issues
Interpersonal & family issues
Health or corrections
Other (n=1,054)
2020 HOMELESS COUNT: LENGTH OF TIME HOMELESS 450
39%
400 350 300
Almost half of the respondents reported being homeless less than a year.
29%
250 17%
200 150
8%
100
7%
50 0 Up to 6 months
6 months to 1 1 - 5 years year
5 - 10 years More than 10 years (n=1,077)
70% OF PEOPLE ARE EXPERIENCING CHRONIC HOMELESSNESS. They have been homeless for 6 months or more in the last 12 months.
Photo Credit: Lani Brunn Photo Credit: Lani Brunn
84%
from Vancouver
MAJORITY OF PEOPLE WERE LIVING IN VANCOUVER when they found themselves without a home. (n=1,027) Photo Credit: BCNPHA
2020 HOMELESS COUNT: AGE Youth (<25) 9%
Seniors (55+) 23%
Adults (25-54) 68%
(n=1,096)
AGE TREND: 2005-2020 The number of Seniors 55+ experiencing homelessness is growing. 100% 90% 80% 70% 60%
Seniors (55+)
50%
Adults (25-54)
40%
Youth (Under 25)
30% 20% 10% 0% 2005
2008
2010
2011
2012
2013
2014
2015
2016
2017
2018
2019
2020
36% ARE/WERE IN THE CARE OF THE MINISTRY AS A CHILD OR YOUTH. This shows the gaps in supports for youth aging out of care and the on-going impacts of systemic racism.
Photo Credit: Lani Brunn
2020 HOMELESS COUNT: FIRST TIME HOMELESSNESS
Senior 55+ 10%
The chart shows the age when respondents first experienced homelessness.
Child <18 32%
48% under 25 years
Adult 25-54 42% Youth 19-24 16%
(n=1,033)
21% identified as women. It is believed that women are undercounted in the Point-InTime count and are often living in unsafe situations where they are not encountered by count volunteers.
Photo Credit: Lani Brunn, used with permission for this slide.
2020 HOMELESS COUNT: TRANS EXPERIENCE
Senior 55+ 14%
Youth <25 18%
5% identified as having transgender experience. The chart shows the age profile of respondents with Trans experience. Adult 25-54 68%
(n=53)
2020 HOMELESS COUNT: SEXUAL ORIENTATION
2020 HOMELESS COUNT: INCIDENCE OF HEALTH CONDITIONS
Five health concerns
6%
Four health concerns
Over half the respondents report one or two health concerns.
12%
Three health concerns
19%
Two health concerns
23%
One health concern
26%
No health concerns
14% 0%
5%
10% 15% 20% 25% 30% (n=1,089)
2020 HOMELESS COUNT: TYPES OF HEALTH CONDITIONS multiple responses possible Learning disability or cognitive impairment
People who are homeless Consistently report a range of health issues.
23%
Physical disability
35%
Medical condition/illness
44%
Mental health issue
45%
Addiction
60% 0%
10%
20%
30%
40%
50%
60%
70%
(n=1,089)
26% of respondents reported having an acquired brain injury. Brain injuries have cognitive, psychological and physical impacts including trouble concentrating, feeling confused, problems with words and speech, depression, balance issues, etc.
Photo Credit: Lani Brunn
2020 HOMELESS COUNT: SOURCES OF INCOME
80%
multiple responses possible
70% 60%
76%
50% 40% 44%
30% 20%
26%
10% 7%
0% Income assistance
Binning, panhandling, vending
FT/PT/casual employment
No income
(n=1,074)
2020 HOMELESS COUNT: INDIGENOUS PEOPLE ARE OVERREPRESENTED % Indigenous in population experiencing homelessness
% Indigenous/Aboriginal in General Population 2%
39%
Indigenous/ Aboriginal Non-Indigenous/ Non-Aboriginal
2020 HOMLESS COUNT: RACIAL IDENTITY PROFILE
BLACK PEOPLE ARE SIGNIFICANTLY OVERREPRESENTED IN THE POPULATION EXPERIENCING HOMELESSNESS. They are 3.7 times more likely to experience homelessness compared to their presence in the general population would predict. Arabs are 1.7 times and Hispanics and Latin Americans are 1.4 times more likely to experience homelessness.
29
2020 HOMLESS COUNT: RACIAL IDENTITY PROFILE
This is the first-time race-based data has been collected in Metro Vancouver. 79% of respondents identified as white.
Note: Our data indicates that due to the sequence of questions, some respondents may not be adequately represented in this question.
10.0% 9.0% 8.0% 7.0% 6.0% 5.0% 4.0% 3.0% 2.0% 1.0% 0.0%
multiple responses possible
9.3%
6.0%
3.0%
2.7%
2.2%
1.5%
1.1%
1.0%
(n=788)
O u r
S t r a t e g y
WHAT WE HAVE LEARNED
Photo Credit: Lani Brunn
2020 HOMELESS COUNT: SERVICES ACCESSED IN THE PAST 12 MONTHS 70% 60%
These services come at not only a public cost, But using this number of services is distressing and exhausting for the person experiencing homelessness.
50% 40% 30% 20% 10%
61%
60%
56%
multiple responses possible 52%
50%
48%
44% 33%
31%
29%
28%
24% 9%
0%
(n=1,011)
The solution to homelessness is housing. Affordable, safe and stable housing with the appropriate supports and services will keep people housed.
Photo Credit: Ben Nelms/CBC
THE COST OF HOMELESSNESS VS SUPPORTIVE HOUSING
BC Housing: Community Benefits of Supportive Housing
THE DEMONSTRATED BENEFITS OF SUPPORTIVE HOUSING
City of Vancouver & BC Housing: Modular Supportive Housing Research
2021 HOMELESS COUNT
We recommend an alternative approach to collecting data on homelessness next year. The Point-In-Time homeless count may not be the best method for 2021.
• Respondents are experiencing survey fatigue • Overall consistent results between consecutive years • Methodology has limitations in capturing hidden homelessness • Public health concerns with COVID-19 pandemic
A BETTER APPROACH FOR 2021 Aligning with triennial regional count (2023) Sources of data on homelessness: • HIFIS Database used by shelters and outreach • Outreach office meets with 80 to 100 clients each day • DTESWC survey on hidden homelessness • We are evaluating additional options
Photo Credit: Lani Brunn
O U R
S T R A T E G Y
A SYSTEMS BASED APPROACH
Photo Credit: Lani Brunn
Outreach teams & peers are key to supporting people to find housing, keeping homelessness brief.
OUR STRATEGY
Photo Credit: Lani Brunn
THE INTERSECTING CRISES
Recognizing the historical and contemporary impacts of colonialism and structural racism on systems and practices within the City We are listening, unlearning, and moving towards changing systems to be more equitable for groups who experience the most barriers. Photo Credit: Lani Brunn
Photo Credit: Lani Brunn
We need to do this together. • The City • The Provincial and Federal governments • Vancouver Coastal Health • Non-profit societies and advocates • Vancouver citizens
Photo Credit: Lani Brunn
The role of the City. • Land use Regulation and Policy • Providing land for social and supportive housing • Granting programs • Advocating for partnerships • Providing outreach services • Managing housing
The role of other levels of government. • A variety of funding programs for capital and operational assistance for non-market housing and shelters • National Housing Strategy • Rent supplements and income supplement (COVID-19) programs • Housing, health and social supports • Funding for health programs and outreach programs
“Over 11 years I was sleeping on the streets. The (outreach) staff knew me and helped me get a place.” - To d d , Supportive Housing Resident Photo Credit: Lani Brunn
Photo Credit: Lani Brunn
Photo Credit: Lani Brunn
Photo Credit: Rafal Gerszak/Globe & Mail
QUESTIONS?
Photo Credit: Lani Brunn
END
“I am proud of who I am. But on the street, I am invisible.”
- Jeff, First Nations and sleeping on the street for two years Photo Credit: Lani Brunn