DASHBOARD

The Road to Prosperity Dashboard tracks Utah’s economic outlook. The Dashboard, which is updated monthly, provides essential insights, tracks timely and leading measures, and shares salient indicators.
1
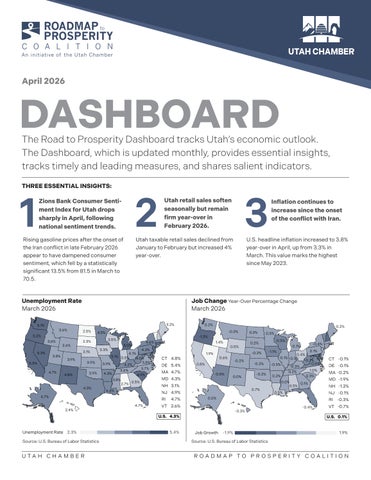
Zions Bank Consumer Sentiment Index for Utah drops sharply in April, following national sentiment trends.
Rising gasoline prices after the onset of the Iran conflict in late February 2026 appear to have dampened consumer sentiment, which fell by a statistically significant 13.5% from 81.5 in March to 70.5.
Unemployment Rate
2
Utah retail sales soften seasonally but remain firm year-over in February 2026.
Utah taxable retail sales declined from January to February but increased 4% year-over.
3
Inflation continues to increase since the onset of the conflict with Iran.
U.S. headline inflation increased to 3.8% year-over in April, up from 3.3% in March. This value marks the highest since May 2023.
Job Change Year-Over Percentage Change March 2026 March 2026
Source: U.S. Bureau of Labor Statistics
Source: U.S. Bureau of Labor Statistics
Utah Job Change by Industry Year-Over Percent Change
March 2026 January 2000 – March 2026
Note: From March to December 2021, a 2-year change is used due to the drastic changes in employment beginning March 2020.
Source: U.S. Bureau of Labor Statistics
Utah Unemployment Rate February 2026
October 2020 – April 2026
January 2000 - April 2026
Source: University of
Utah Bankruptcy Cases
January 2020 - March 2026