1.5% 1.5%
Total Total
2.3% 2.3%
Construction Construction -0.3% -0.3%
Manufacturing Manufacturing Information Information
-2.6% -2.6%
Financial Activities Activities Financial
2.5% 2.5%
Other Services Services Other
2.8% 2.8% -0.1% -0.1%
Government Government
2.4% 2.4%
Education/Health Services Services Education/Health
1.4% 1.4%
Leisure/Hospitality Services Services Leisure/Hospitality
July 2026
-2.7% Natural Resources Resources -2.7% Natural 4.7% 4.7%
Professional/Business Services Services Professional/Business
DASHBOARD Trade/Transportation/Utilities Trade/Transportation/Utilities
12% 12% 10% 10% 8% 8% 6% 6% 4% 4% 2% 2% 0% 0% -2% -2% -4% -4% -6% -6% -8% -8% -10% -10% -12% -12% THREE ESSENTIAL INSIGHTS: -14% -14% 2000 2004 2008 2012 2000 2004 2008 2012
0.4% 0.4%
1.5% 1.5% The Road to Prosperity Dashboard tracks Utah’s economic outlook. 0.3% The Dashboard, which is updated0.3% monthly, provides essential insights, tracks timely and leading measures, and shares salient indicators.
1
2016 2016
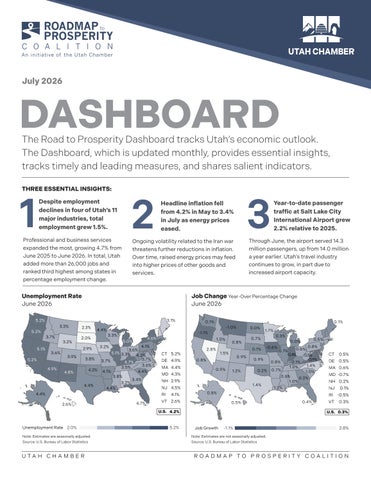
U.S. Utah U.S. Utah Despite employment declines in four of Utah’s 11 major industries, total employment grew 1.5%.
Professional and business services expanded the most, growing 4.7% from June 2025 to June 2026. In total, Utah added more than 26,000 jobs and ranked third highest among states in percentage employment change.
2 2020 2020
Headline inflation fell from 4.2% in May to 3.4% in July as energy prices eased.
Job Change Year-Over Percentage Change June 2026
5.2% 5.2%
3.1% 3.1%
5.2% 5.2% 3.7% 3.7% 5.1% 5.1%
3.6% 3.6%
5.2% 5.2% 4.9% 4.9%
3.2% 3.2%
2.3% 2.3% 2.0% 2.0% 2.9% 2.9%
3.9% 3.9% 4.8% 4.8%
Year-to-date passenger traffic at Salt Lake City International Airport grew 2.2% relative to 2025.
Through June, the airport served 14.3 million passengers, up from 14.0 million a year earlier. Utah’s travel industry continues to grow, in part due to increased airport capacity.
Ongoing volatility related to the Iran war threatens further reductions in inflation. Over time, raised energy prices may feed into higher prices of other goods and services.
Unemployment Rate June 2026
3.3% 3.3%
3
2024 2024
0.1% 0.1%
-1.1% -1.1%
3.3% 3.3% 5.0% 5.0% 3.2% 3.2%
4.6% 4.6%
1.0% 1.0%
4.1% 4.1%
3.6% 3.6% 5.1% 3.3% 5.1% 3.3% 4.2% 4.2% 3.8% 3.7% 3.8% 3.7% 3.7% 3.7% 4.7% 4.7% 3.6% 3.6% 3.5% 3.5% 4.2% 4.1% 4.2% 4.1% 4.4% 4.4% 3.8% 3.8% 3.4% 3.4% 3.2% 3.2% 4.4% 4.4% 4.4% 4.4%
4.4% 4.4% 2.6% 2.6%
0.1% 0.1% -1.0% -1.0%
4.4% 4.4%
4.7% 4.7%
CT 5.2% 5.2% CT DE 4.9% 4.9% DE MA 4.4% 4.4% MA MD 4.3% 4.3% MD NH 2.9% 2.9% NH NJ 4.5% 4.5% NJ RI 4.1% 4.1% RI VT 2.6% 2.6% VT
2.8% 2.8%
0.8% 0.8%
1.5% 1.5%
0.9% 0.9%
0.8% 0.8% 0.9% 0.9%
1.2% 1.2%
0.0% 0.0%
1.7% 1.7%
0.7% 0.7%
0.5% 0.5% 0.0% 0.0% 0.8% 0.8% -0.6% -0.6% 0.6% 0.1% 0.6% 0.1% 0.1% 0.1% -0.4% -0.4% 0.5% 0.5% 0.9% -0.9% 0.9% -0.9% 0.8% -0.1% 0.8% -0.1% 1.4% 1.4% 1.0% 1.0% 0.7% 0.2% 0.7% 0.2% 1.0% 1.0% 0.8% 0.8% 0.2% 0.2% 1.0% 1.0% 1.4% 1.4% 1.2% 1.2%
0.8% 0.8% 0.5% 0.5%
U.S. 4.2% 4.2% U.S. UnemploymentRate Rate 2.0% 2.0% Unemployment Note: Estimates are seasonally adjusted. Source: U.S. Bureau of Labor Statistics
U TA H C H A M B E R
5.2% 5.2%
0.3% 0.3%
0.4% 0.4%
CT 0.5% 0.5% CT DE 0.5% 0.5% DE MA 0.6% 0.6% MA MD -0.7% -0.7% MD NH 0.2% 0.2% NH NJ 0.1% 0.1% NJ RI -0.5% -0.5% RI VT 0.3% 0.3% VT U.S. 0.3% 0.3% U.S.
JobGrowth Growth Job
-1.1% -1.1%
2.8% 2.8%
Note: Estimates are not seasonally adjusted. Source: U.S. Bureau of Labor Statistics
ROADMAP TO PROSPERITY COALITION
Le
Utah Job Change by Industry Year-Over Percent Change June 2026 1.5%
Total
2.3%
Construction
12% 10% 8% 6% 4% 2% 0% -2% -4% -6% -8% -10% -12% -14%
-0.3%
Manufacturing Information
-2.6%
Financial Activities
2.5%
Other Services
2.8% -0.1%
Government
2.4%
Education/Health Services
1.4%
Leisure/Hospitality Services -2.7%
Natural Resources
4.7%
Professional/Business Services
0.3%
2000
2004
2008
U.S.
3.3% Cache 3.9% Rich 3.9% Weber 3.3% Davis 3.4% Morgan 3.6% Daggett
2024
Utah
3.2% Wasatch 3.8% Utah
3.9% Duchesne
Non-residential
$1,500
$1,000
$500
4.0% Uintah
5.2%
$0
3.7% 2020
2021 3.2%
4.1% Emery
$1,500
3.1%
3.4% 0.1% Iron
$ Millions
6.9% Non-residential Piute
-1.0%
0.0%
-1.1% 1.0%
$1,0003.6%
Washington
0.8%
0.7%
4.4% Grand
8.0% Garfield
5.2% 0.8% $500
3.0%
0.3%
0.5%
0.0%
0.8%
8.0%
0.8%
2.6%
0.5%
CT
0.5%
DE
0.5%
MA 0.6%
2026
3.2%
CT 5.2% DE 4.9% MD 4.3% NH 2.9%
60%
$526,000 RI 4.1% VT 2.6% U.S. 66.4% 4.2% 5.2%
2024
0.1% 2025NJ 2026
61.5% 60.2% 2020
$0
2021
RI
-0.5%
2020
2021
VT
0.3%
Source: Utah Association of Realtors
900
NJ 4.5%
$200
61%
0.8
MA 4.4%
62%
NH 0.2%
0.4%
4.6%2025
65% Unemployment Rate 2.0% 64% 63.4% 63%
MD -0.7%
$
-1
2024 5.0%
66% $400
0.8% 0.2% 1.0%
Note: Estimates are seasonally adjusted. 1.4% $0Utah Department of Workforce Source: Services 1.2% 2020 2021 2022 2023
4.1%
4.7% 0.1% San Juan
1.7%
0.6% 0.1% 1.5% -0.4% 0.5% 0.9% 0.9% -0.9% 0.8% -0.1% Unemployment Rate 1.0% 1.4% 0.9% 0.2% 0.7% 1.2% 1.0%
2.8%
4.3%
5.9% Add/Alt/Repairs Wayne
3.9% Kane -0.6% 0.1%
3.3% 2023
2.0% 2022
4.1% 3.6% 5.1% 3.3% 4.2% 3.9% 3.8% 3.7% 5.2% 3.7% 4.7% 3.6% 3.5% 4.9% Home Sales 4.2%Price Utah Median 4.1% 4.4% 4.8% 3.8% January 2020 – June 2026 3.4% 70% 3.2% 4.4% 4.4% $600 69% 68.3% 4.4% 68% 4.7% 2.6% 67% 67.4%
Sales Price ($ Thousands)
3.0% Beaver Residential
4.4%
Source: Kem C. Gardner 3.6% Policy Institute
4.4% Sevier $2,000
2.3%
2.9%
5.1%
3.9% Sanpete
$
3.1%
5.2%
5.3% Carbon
3.7% Millard
$
Add/Alt/Repairs Sales Price ($ Thousands)
Residential
$ Millions
3.6% Salt Lake
$2,000
3.5% Summit
3.5% Juab
2022
2023
2024
2025
‘26
U.S. 2022
Utah 2024 2023
2025
‘26
800
600
Job 400
200
0
U.S. 0.3%
4.2%
5.2%
2020
Value of Construction in Utah March 2020 – May 2026
3.3%
4.5%
2016
Utah Unemployment Rate June 2026
3.7% Tooele
2.9%
2012
Note: Estimates are not seasonally adjusted. Large year-over job change in April 2021 is inflated due to the high job losses in April 2020. Source: U.S. Bureau of Labor Statistics
3.4% Box Elder
4.4%
Trad
Note: Estimates are not seasonally adjusted. From March to December 2021, a 2-year change is used due to the drastic changes in employment beginning March 2020. Source: U.S. Bureau of Labor Statistics
0.3%
4.9%
Profe
1.5%
0.4%
Trade/Transportation/Utilities
1.5%
Job Change Year-Over Percent Change January 2000 – June 2026
U TA H C H A M B E R Job Growth 70%
69%
68.3%
-1.1%
2.8%
ROADMAP TO PROSPERITY COALITION
$6 900
$5
2.
2.
0
2020
2021
2022
2023
U.S.
2024
2025
Consumer Sentiment
U.S. Headline Inflation Consumer Price Index
October 2020 – July 2026
January 2000 – July 2026
Year-Over Percent Change
100
10%
$2,000 $2,000
$2,000 $2,000 $1,500
$600
Residential Residential
Non-residential Non-residential
Add/Alt/Repairs Add/Alt/Repairs
72.8
Residential Residential
Non-residential Non-residential
Add/Alt/Repairs Add/Alt/Repairs
55.2
$600 8%
$526,000 $526,000
Sales Price Price ($ Thousands) Thousands) Sales Price Sales ($ Sales Price($ ($Thousands) Thousands)
80
6%
60$1,500 Millions$$Millions $$ Millions Millions
2026
Utah
$600 $600
$526,000 $526,000
$400 4% $400
$1,500 40$1,500 $1,000 $1,000
3.4%
2%
$400 $400
20
0% $200
$200
$1,000 $1,000 $500 $500
-2%
0
2020
$500 $500 $0 $0
2021
2020 2020
2022
2023
2022U.S.
2021 2021
2022
2024
Utah 2023
2023
2024 2024
2025 2025 2025
Source: University of Michigan Surveys of Consumers and Zions Bank Consumer Sentiment Survey $0 $0
2020 2020
2021 2021
2022 2022
2023 2023
2024 2024
2025 2025
2026 2026 2026
2026 2026
$200 $200 2000 $0 $0
2005
2020 2020
2010
2021 2021
$0 $0
70% 70% 8%
900 900
U.S. U.S.
Utah Utah
2023 2023
2024 2024
2025 2025 ‘26 ‘26
800 900 900 800 600 600 800 800 400 400 600 600 200 200 400 400 00 200 200
00
2020 2020
2021 2021
2022 2022
2023 2023
2024 2024
2025 ‘26 ‘26 2025
2020 2020
2021 2021
2022 2022
2023 2023
2024 2024
2025 2025 ‘26 ‘26
Source: United States Bankruptcy Court
SLC 2.5International Airport Passengers 2.5 January 2020 – June 2026
$5 $5 $6 $6
2.0 2.0 2.5 2.5
$4 $4 $5 $5
1.5 1.5 2.0 2.0
$3 $3 $4 $4
1.0 1.0 1.5 1.5
$2 $2 $3 $3
0.5 0.5 1.0 1.0
$1 $1 $2 $2 00 $1 $1
2025 ‘26 ‘26 2025
MillionsMillions Millions Millions
Retail Sales Sales ($ Billions) Billions) Retail Sales Retail ($ Retail Sales($ ($Billions) Billions)
Utah $6Taxable Retail Sales $6 January 2020 – May 2026
2024 2024
Recession 2022 2023 2022 2023
2020 2021 2020 2021 2022 Utah Bankruptcy Cases2022 January 2020 – June 2026
Source: U.S. Bureau of Labor Statistics
2025
Note: Estimates are not seasonally adjusted. Source: U.S. Bureau of Labor Statistics
Labor Force Participation Rate 10% January 2020 – June 2026 69% 69% 68.3% 6% 68.3% 68% 68% 70% 70% 67.4% 67% 67.4% 67% 69% 69% 4% 68.3% 68.3% 66.4% 66.4% 66% 66% 68% 68% 3.4% 2% 67.4% 65% 65% 67% 67% 67.4% 66.4% 64% 66.4% 64% 66% 66% 0% 63.4% 63.4% 63% 63% 65% 65% -2% 62% 62% 64% 64% 61.5% 63.4% 63.4% 61%2000 2005 202561.5% 2015 2020 2010 61% 63% 63% 60.2% 60.2% 60% Recession 60% 62% 62% 2020 2021 2022 2023 2024 2025 ‘26 ‘26 2020 2021 2022 2023 2024 2025 61.5% 61.5% 61% 61% U.S. Utah U.S. Utah 60.2% 60.2% 60% Note: 60%Estimates are seasonally adjusted. The y-axis starts at 60% to better illustrate changes in the 2020 2021 2022 2023 2024 2025 ‘26 2020 2021 2022 2023 due to 2024 2025 ‘26 labor force participation rate. October 2025 data were unavailable a lapse in BLS appropriations.
2020
2015
2020 2020
2021 2021
2022 2022
2023 2023
2024 2024
2025 2025
’26 ’26
2020 2020
2021 2021
2022 2022
2023 2023
2024 2024
2025 2025
’26 ’26
00
Source: Utah State Tax Commission
U TA H C H A M B E R
00 0.5 0.5 00
2020 2020
2021 2021
2022 2022
2023 2023
2024 2024
2025 2025
2026 2026
2020 2020
2021 2021
2022 2022
2023 2023
2024 2024
2025 2025
2026 2026
Source: Salt Lake City International Airport
ROADMAP TO PROSPERITY COALITION