Total Total
1.4% 1.4%
Construction Construction
3.5% 3.5%
Manufacturing Manufacturing
1.1% 1.1%
-4.0% Information -4.0% Information
Financial Activities Activities Financial
1.4% 1.4%
Other Services Services Other
1.9% 1.9%
Government Government
-0.5% -0.5%
Education/Health Services Services Education/Health
3.5% 3.5%
Leisure/Hospitality Services Services Leisure/Hospitality
September 2026
1.0% 1.0%
Natural Resources Resources Natural
0.0% 0.0%
Professional/Business Services Services Professional/Business
DASHBOARD
2.3% 2.3%
Trade/Transportation/Utilities Trade/Transportation/Utilities
12% 12% 10% 10% 8% 8% 6% 6% 4% 4% 2% 2% 0% 0% -2% -2% -4% -4% -6% -6% -8% -8% -10% -10% -12% -12% THREE ESSENTIAL INSIGHTS: -14% -14% 2000 2004 2008 2012 2000 2004 2008 2012
0.9% 0.9%
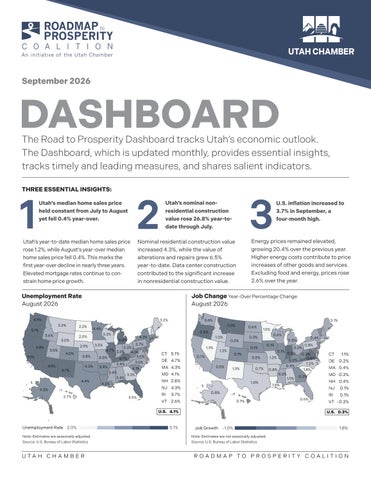
1.4% The Road to Prosperity Dashboard1.4% tracks Utah’s economic outlook. 0.3% The Dashboard, which is updated0.3% monthly, provides essential insights, tracks timely and leading measures, and shares salient indicators.
1
2016 2016
U.S. Utah U.S. Utah Utah’s median home sales price
held constant from July to August yet fell 0.4% year-over.
Utah’s year-to-date median home sales price rose 1.2%, while August’s year-over median home sales price fell 0.4%. This marks the first year-over decline in nearly three years. Elevated mortgage rates continue to constrain home price growth.
2020 2020
2
Utah’s nominal nonresidential construction value rose 26.8% year-todate through July.
Job Change Year-Over Percentage Change August 2026
4.9% 4.9%
0.6% 0.6%
3.2% 3.2%
5.1% 5.1% 3.6% 3.6% 3.0% 3.0% 4.8% 4.8%
3.5% 3.5%
5.1% 5.1% 4.9% 4.9%
2.2% 2.2%
4.7% 4.7%
3.8% 3.8% 4.3% 4.3%
4.4% 4.4%
5.0% 5.0% 3.2% 3.2%
0.6% 0.6%
-0.5% -0.5%
3.2% 3.2%
1.0% 1.0%
4.3% 4.3% 3.7% 3.7%
3.3% 3.3% 4.7% 3.3% 4.7% 4.0% 3.3% 4.0% 3.6% 3.6% 3.5% 3.5% 4.7% 4.7% 3.5% 3.5% 3.4% 3.4% 3.9% 3.9% 4.1% 4.1% 3.4% 3.4% 3.2% 3.2% 3.4% 3.4% 4.2% 4.2%
4.3% 4.3% 2.7% 2.7%
0.1% 0.1% -1.0% -1.0%
4.4% 4.4%
2.0% 2.0% 2.9% 2.9%
4.0% 4.0%
U.S. inflation increased to 3.7% in September, a four-month high.
Energy prices remained elevated, growing 20.4% over the previous year. Higher energy costs contribute to price increases of other goods and services. Excluding food and energy, prices rose 2.6% over the year.
Nominal residential construction value increased 4.3%, while the value of alterations and repairs grew 6.5% year-to-date. Data center construction contributed to the significant increase in nonresidential construction value.
Unemployment Rate August 2026
3.2% 3.2%
3
2024 2024
4.5% 4.5%
1.3% 1.3%
CT 5.1% 5.1% CT DE 4.7% 4.7% DE MA 4.3% 4.3% MA MD 4.1% 4.1% MD NH 2.8% 2.8% NH NJ 4.3% 4.3% NJ RI 3.7% 3.7% RI VT 2.6% 2.6% VT
0.2% 0.2%
0.1% 0.1%
1.2% 1.2%
0.1% 0.1%
0.7% 0.7% 0.5% 0.5%
1.5% 1.5%
1.3% 1.3%
0.6% 0.6%
0.3% 0.3%
0.5% 0.5% 0.7% 0.7%
1.0% 1.0%
Note: Estimates are seasonally adjusted. Source: U.S. Bureau of Labor Statistics
U TA H C H A M B E R
5.1% 5.1%
0.8% 0.8%
0.2% 0.2% 0.1% 0.1% -0.5% -0.2% -0.5% -0.2% 1.2% 1.2% -0.8% -0.8% 0.0% 0.0% 1.2% 1.2% 0.4% 0.4% 1.8% 0.8% 1.8% 0.8% 0.2% 0.2% -0.2% 1.0% -0.2% 1.0% 1.5% 1.5%
0.8% 0.8% 0.1% 0.1%
U.S. 4.1% 4.1% U.S. UnemploymentRate Rate 2.0% 2.0% Unemployment
0.4% 0.4%
0.3% 0.3% -0.1% -0.1%
0.6% 0.6%
CT 1.1% 1.1% CT DE 0.2% 0.2% DE MA 0.4% 0.4% MA MD -0.2% -0.2% MD NH 0.4% 0.4% NH NJ NJ RI RI
0.1% 0.1% 0.1% 0.1%
VT -0.2% -0.2% VT U.S. 0.3% 0.3% U.S.
JobGrowth Growth -1.0% -1.0% Job
1.8% 1.8%
Note: Estimates are not seasonally adjusted. Source: U.S. Bureau of Labor Statistics
ROADMAP TO PROSPERITY COALITION
Le
Job Change Year-Over Percent Change January 2000 – September 2026
Utah Job Change by Industry Year-Over Percent Change September 2026 Total
1.4%
Construction
3.5%
Manufacturing
12% 10% 8% 6% 4% 2% 0% -2% -4% -6% -8% -10% -12% -14%
1.1%
Information -4.0% Financial Activities
1.4%
Other Services
1.9%
Government
-0.5%
Education/Health Services
3.5%
Leisure/Hospitality Services
1.0%
Natural Resources
0.0%
Professional/Business Services
2.3%
Trade/Transportation/Utilities
1.4% 0.3%
2000
2004
2008
3.1% Cache 3.3% Rich 3.5% Weber 3.3% Davis 3.0% Morgan 3.4% Daggett
$2,000
Residential
$ Millions
2.9% Wasatch
3.7% Duchesne
$1,000
$500
3.7% Uintah
4.9% 2.2%
5.1% $0
3.6%
2020
2021
3.0%
4.3% Emery
3.9% Grand
3.9% Sevier 6.5% 5.2% Beaver Residential Piute Non-residential Wayne Add/Alt/Repairs
-1.0%
$ Millions
Iron
0.6%
7.5% Garfield
-0.5% 1.0%
$1,000 3.3% Washington 1.3%
0.2%
1.2%
0.1%
0.7% $500
0.5%
2.6%
0.3%
0.6%
3.5% -0.1% 0.1% Kane 0.5%
0.1%
1.2%
0.2% -0.5% 0.0%
Unemployment Rate 0.4%
1.3%
0.7%
0.8%
1.8%
7.5% 0.2% -0.2% 1.0% 2024
0.8% 0.1%
2.6%
0.6%
5.0%
2024 4.3% 2025
2026
3.7% 3.3% 4.7% 3.3% 4.0% 3.6% 3.5% 4.7% 3.5% 3.4% 3.9% 4.1%
4.3%
CT 5.1% DE 4.7% MA 4.3%
69% $600 4.3% 68.3% 68%
NJ 4.3%
MD 4.1% NH 2.8%
4.2%
2.7%
4.5%
$525,000 RI 3.7% VT 2.6% U.S. 66.3% 4.1%
$400
0.7
900
800
600
65%
Unemployment Rate 2.0% 64%
0.8%
-0.2% -0.8% 1.2%
2023
4.7% Utah Median Home Sales Price 3.4% 3.2% 3.4% January 2020 – August 2026 70% 4.4%
66%
0.4%
0.3%
Note: Estimates 1.0% $0 are seasonally adjusted. 2020 of Workforce 2021 2022 1.5% 2023 Source: Utah Department Services
3.7%
CT
1.1%
63%
DE
0.2%
62%
MA 0.4%
61%
MD -0.2% NH 0.4% 2026 2025 NJ 0.1% RI
$200
60%
61.6%
60.2% 2020
$0
0.1%
VT -0.2%
5.1%
63.4%
2020
2021
2021
2022
U.S. 2022
2023
2024
2025
2026
Utah 2024 2023
2025
2026
Job 400
200
0
Source: Utah Association of Realtors
U.S. 0.3%
4.1%
U TA H C H A M B E R Job70% Growth 69% 68%
-1.0%
1.8%
R$6 OADMAP TO PROSPERITY COALITION 900
$5
68.3%
)
5.1%
0.1%
1.5%
-0
3.2%
67% 67.4%
4.3% San Juan
$2
3.2%
2.9%
4.9%
$2,000 2.6%
$1,500 0.6% 3.2%
4.4%
2.0% 2022
3.5% Source: Kem C. Gardner Policy 4.0% Institute 3.8% 5.1%
Sales Price ($ Thousands)
3.6% Sanpete
$4
3.2% 3.2%
4.7% Carbon
3.1% Millard
$6
Add/Alt/Repairs
$1,500
2.8% Summit
3.7% Salt Lake
Non-residential
4.8%
4.3%
Utah
Value of Construction in Utah March 2020 – July 2026
3.2% Juab
2.8%
2024
Utah Unemployment Rate August 2026
3.4% Utah
4.1%
2020
Note: Estimates are not seasonally adjusted. Large year-over job change in April 2021 is inflated due to the high job losses in April 2020. Source: U.S. Bureau of Labor Statistics
3.6% Tooele
4.3%
2016
Note: Estimates are not seasonally adjusted. From March to December 2021, a 2-year change is used due to the drastic changes in employment beginning March 2020. Source: U.S. Bureau of Labor Statistics
3.4% Box Elder
4.7%
2012
U.S.
0.9%
0.3%
5.1%
Trad
Sales Price ($ Thousands)
1.4%
Profe
800
3.0
2.5
0
2020
2021
2022
2023
U.S.
2024
2025
2026
Utah
Consumer Sentiment
U.S. Headline Inflation Consumer Price Index
October 2020 – September 2026
January 2000 – September 2026
Year-Over Percent Change
100
10% 80
$2,000 $2,000
8%$600 $600
Residential Residential Non-residential Non-residential Add/Alt/Repairs Add/Alt/Repairs
71.3 $2,000 $1,500
$ Millions $ Millions $ Millions $ Millions
Residential Non-residential Add/Alt/Repairs Residential Non-residential Add/Alt/Repairs
48.1
40
$1,500 $1,000 $1,500 $1,000
-2%
2020
2021
$500 $500 $0 $02020
2020
2022
2023
U.S.
20212021
2024
Utah
2022 2022
2023 2023
2025
2020
2021
2022
2023
2020 2021 2022 2023 Labor Force Participation Rate 10% January 2020 – August 2026
2024 2024
2026
2025 2025
2024 2024
Source: University of Michigan Surveys of Consumers and Zions Bank Consumer Sentiment Survey $0
$525,0003.7% $525,000
$400 $400 0% $200 $200
$1,000 $500 $1,000 $500
$0
$600 $600 4% $400 $400 2%
20
0
Sales Price ($ Thousands) Price ($ Thousands) Sales PriceSales ($ Thousands) Sales Price ($ Thousands)
$2,000 60 $1,500
$525,000 $525,000
6%
2025 2025
2026 2026
2000 2005 2025 2015 2020 2010 $200 $200 $0 $0 Recession 2020 2021 2022 Note: Estimates are not seasonally 2020 2021 adjusted. 2022 2023 2023 2024 2024 2025 2025 2026 2026 Source: U.S. Bureau of Labor Statistics
2026 2026
$0
$0 Bankruptcy Utah Cases 2020 2021 2022 2023 2024 2025 2026 2020 2021 2022 2023 2024 2025 2026 January 2020 – August 2026
900900 70%70% 8% 69%69% 68.3% 68.3% 6% 68% 800800 68% 900 70% 900 67.4% 70% 67%67% 67.4% 3.7% 69% 4% 68.3% 69% 66.3% 66%66% 68.3% 66.3% 600600 68% 800 68% 800 65% 2%65%67.4% 67%67.4% 67% 64%64% 400400 66.3% 66% 63.4% 600 66.3% 63.4% 0% 66% 600 63%63% 65% 61.6% 65% 61.6% 62%62% 200200 -2% 64% 400 64% 63.4% 400 61%61% 63.4% 63% 2000 60.2% 2005 2025 2015 2020 2010 63% 60.2% 0 0 60% 61.6% 60% 2020 61.6% 20212021 2022 2023 2024 62% 2020 2020 2022Recession 2023 2024 2025 2025 2026 2026 200200 2020 2021 2021 2022 2022 2023 2023 2024 2024 2025 2025 2026 2026 62% U.S. Utah 61% U.S. Utah 61% 60.2% 0 60% 60.2% Note: are seasonally adjusted. The y-axis starts at 60% to better illustrate2025 changes in2026 the 0 60% Estimates 2020 2021 2022 2023 2024 2020 2021 2022 2023 2024 2025 2026 2020 2021October 2025 2022data were 2023 2024 2026 labor force participation rate. unavailable due to a lapse2025 in BLS appropriations. 2020 2021 2022 2023 2024 2025 2026 Source: U.S. Bureau of Labor Statistics
U.S. U.S.
Source: United States Bankruptcy Court
Utah Utah
$6Taxable Utah Retail Sales $6 January 2020 – July 2026
3.03.0 SLC International Airport Passengers January 2020 – August 2026
$5 $5
2.5 2.5 3.0 3.0 2.02.0
$5 $5 $3 $3
Millions
2.5 2.5 1.5 1.5
$4 $4 $2 $2 $3
$1 $1 $2 $2 0 0 $1 0
2.0 2.0 1.0 1.0
$1
1.5 1.5 0.50.5
Millions Millions
$3
Millions
Retail Sales ($ Billions) Retail Sales ($ Billions) Retail Sales ($ Billions) Retail Sales ($ Billions)
$6 $6 $4 $4
1.0
2020 2020
20212021
2022 2022
2023 2023
2024 2024
2026 2025 2026 2025
2021 2021
2022 2022
Source: Utah State Tax Commission
U TA H C H A M B E R
2023 2023
2024 2024
2026 2025 2026 2025
0 0 2020 2020
0.5 0.5
0 2020 2020
1.0
0
0
2020 2020
2021 2021
2021 2021
2022 2022
2022 2022
2023 2023
2023 2023
2026 2024 2026 2024 2025 2025
2026 2024 2025 2026 2024 2025
Source: Salt Lake City International Airport
ROADMAP TO PROSPERITY COALITION