The Effects of Caloric Restriction on Aging and Metabolic Memory in S. Cerevisiae
L.M. (Teresa C.)
Taste the Rainbow: Investigating Synesthesia in Different Age Groups
Zoe O. (Leah K.)
Public Knowledge and Ethical Perspectives on CRISPR: The Role of Education in Shaping Attitudes Towards Gene Editing
Maayan M. & Evie T (Nicholas H.)...
Sweet Dreams: An Assessment of Diet-Induced Cognitive Decline in D. Melanogaster
Testing Alternative Leaching Solutions for Hydrometallurgy
Holistic Adjunctive Approaches to Breast Cancer Care: Effects on Morbidity and Mortality: A Focus on Metastatic Disease
The Muskrats of New York City: A Study of the Factors Influencing Muskrat Populations at Jamaica Bay Wildlife Refuge and Comparative Urban Wetlands
Manus C. (Jessica Z.).....................................................................................................................59
The Shape of Sound: An Exploration of Associations Between Melody and Phonetic Features
Anjali
Is Your Brain on Ads
The Effects of Sensory Inputs on Brain Waves
Asha M. (Justin
Oh Em GMO! A study on the correlation between price points/marketing and genetically modified foods Grace A. & Katerina L.
The Effects of Caloric Restriction on Aging and
Metabolic
Memory in S. Cerevisiae
Alice L.M.
Mentor: Teresa C.
Abstract
Aging in humans is a complex biological process defined by the accumulation of metabolic waste and decline in cellular function. Autophagy is one of the mechanisms that cells use to mitigate waste accumulation; by recycling old proteins and organelles, debris that once physically and chemically disrupted cell function can now be used to build new cellular components or be converted into energy. Autophagy is often triggered by nutrient-scarce or calorie-restricted environments, where recycled materials may be crucial for survival. This paper uses S. cerevisiae as a model organism to investigate how caloric restriction affects both the chronological and replicative lifespans of yeast. The preliminary test, in which yeast were grown in either 2% glucose or no added glucose, showed that the difference in the rate of growth between the two groups was measurable with a spectrophotometer and a spotting assay. Next, yeast were grown under standard glucose conditions (2% media) and restrictive glucose conditions (0.2% media) with absorbance measurements taken daily, and 1mL of each sample was stored in the refrigerator afterwards. At the end of 7 days, a spotting assay was performed in order to test the living population of yeast in each media. Combined with data from the absorbance measurements, these results suggest that while yeast in restrictive media reach the same population size as yeast in standard media, they do so more slowly than the yeast grown in standard media; this means that yeast in caloric restriction will have the same RLS as yeast under standard glucose conditions, but an extended CLS. We also tested the lasting effects of caloric restriction in yeast through observing their metabolic memory. While metabolic memory in humans is well documented and acknowledged, as exemplified by our understanding of type-2 diabetes, it is not yet determined whether or not yeast exhibit the same type of phenomenon. We grew yeast under caloric restriction and standard media, then transferred them into a different media to observe their growth rate. There was no evidence that yeast retained the effects of their previous glucose environment after transfer.
Introduction
Aging in Humans
Aging in humans is a complex biological process characterized by the progressive decline of cellular function and efficiency. At its core, aging is driven by the accumulation of metabolic waste byproducts and molecular damage, coupled with a reduced capacity for cellular repair.1 With each cell division, telomeres shorten, increasing susceptibility to DNA damage and producing misfolded proteins that accumulate as cellular waste.1 Over time, this accumulation overwhelms cellular repair and maintenance mechanisms by blocking cell function, both physically and chemically, and driving functional decline. However, aging is not entirely unregulated. Autophagy, a cellular recycling process in which damaged proteins and organelles are broken down into reusable components or energy, serves as a critical mechanism that
counteracts this aggregation.1 Caloric restriction is known to induce autophagy, effectively clearing molecular debris and slowing the progression of cellular decline.2
Yeast as a Model Organism
Baker’s yeast (Saccharomyces cerevisiae) is a simple eukaryotic organism widely used as a model for studying aging due to its short lifespan and significant number of cellular pathways that it shares with human cells.3 Key pathways such as cell cycle control, nutrient sensing, and autophagy serve similar basic purposes in both yeast and humans. This means that findings in yeast are frequently translatable to more complex organisms, allowing yeast to serve as a model organism for things like aging.3
Aging in yeast is measured in two ways: chronological lifespan (CLS) and replicative lifespan (RLS). CLS is defined as the length of time non-dividing (senesced) cells in a stationary phase culture remain viable.3 This is comparable to aging in human tissues, where non-dividing cells still accumulate damage over time. RLS is defined as the number of daughter cells a mother cell produces before senescence, meaning it is not capable of any more divisions.3 Together, CLS and RLS measure two distinct aspects of aging: how long a cell survives, and how many times it can divide.
The Target of Rapamycin (TOR) pathway is a nutrient-sensing pathway present in both yeast and human cells that regulates cell growth and autophagy in response to nutrient availability. When there is an abundance of nutrients, the TOR pathway is activated, suppressing autophagy; since the cell has sufficient resources, there is no need to break down its own components for energy. As a result, damaged proteins and organelles accumulate as cellular waste. When nutrients are scarce, the TOR pathway is inhibited, triggering autophagy to degrade and recycle this accumulated debris, and ultimately slowing the progression of aging and extending lifespan. Caloric restriction could potentially extend yeast lifespan through exactly this mechanism; by limiting nutrient availability, it suppresses TOR activity and keeps autophagy chronically elevated, effectively slowing the accumulation of molecular damage.4
A second mechanism through which caloric restriction can extend lifespan in yeast involves the Crabtree effect. Under high glucose conditions, yeast cells preferentially metabolizes glucose through fermentation instead of aerobic respiration.5 This is thought to be a competitive strategy; fermentation allows them to rapidly divide and produce ethanol, creating a toxic environment that kills surrounding competing microorganisms and leaving them with exclusive access to the available nutrients. While effective as a survival strategy, fermentation is far less ATP-efficient than aerobic respiration and the fermentation byproducts accumulate in the growth medium over time and, at high concentrations, can begin to disrupt the yeast's own cellular function, shortening its chronological lifespan.6 By limiting glucose availability, caloric restriction reduces fermentation activity and therefore limits the buildup of harmful byproducts, extending chronological lifespan through a pathway entirely separate from the TOR pathway.
Together, these two mechanisms explain why caloric restriction could extend lifespan in yeast, and why S. cerevisiae serves as an effective model for studying the effects of nutrient availability in aging.
Metabolic Memory
Metabolic memory is the persistence of epigenetic changes caused by a prior nutrient environment, even after conditions return to normal. In humans, this has been most extensively documented in the context of diabetes, where prolonged high blood glucose induces chronic complications that persist and progress even after glycemic control is restored.7 The underlying mechanism involves lasting epigenetic changes including DNA methylation and histone modifications that sustain altered gene expression even after the original metabolic stimulus is removed.8 In other words, the cell does not simply reset when conditions change; it carries a molecular imprint of its prior nutritional state.
Whether this phenomenon extends to simpler eukaryotes like S. cerevisiae is less established. Since caloric restriction is known to induce significant changes in yeast metabolism, it is plausible that yeast transferred out of caloric restriction into nutrient-rich conditions may retain some characteristics they developed in their previous environment, at least temporarily. If yeast do exhibit metabolic memory, it would not only deepen our understanding of how caloric restriction extends lifespan, but it would also strengthen the case for yeast as a model for studying the durability of diet-induced changes in humans, allowing for complex experiments to be carried out on a smaller scale and in a more timely manner.
Research Questions
This paper investigates two related questions. First, how does caloric restriction affect the CLS and RLS of S. cerevisiae? Based on the mechanisms described above, such as the suppression of the TOR pathway, upregulation of autophagy and reduced ethanol accumulation, we hypothesize that yeast grown under caloric restriction will exhibit an extended CLS relative to yeast grown in standard glucose conditions, and will replicate at a slower but more sustained rate, reflecting a shift toward cellular maintenance over rapid growth.
Second, does prior exposure to caloric restriction produce lasting changes in how yeast grow after being returned to nutrient-rich environments? We hypothesize that yeast previously grown under caloric restriction will exhibit measurably different growth patterns compared to yeast with no prior caloric restriction exposure if they retain the metabolic adaptations induced by nutrient limitation.
Methods
Preparing Culture Media
500 mL of YEP broth was prepared by adding 5g yeast extract and 10g tryptone to distilled water. To prepare YEP agar, 10g of agar powder was added to the same formulation prior to autoclaving. All media were sterilized by autoclave for 40 minutes. YEPD broth and agar were prepared identically to their YEP counterparts, with 10g of syringe-filtered dextrose (2%) added after autoclaving to prevent degradation. For caloric restriction media, 1g of dextrose (0.2%) was added instead. Dextrose and glucose are chemically and functionally identical, so they will be used interchangeably throughout this paper.
Measuring Total Yeast Population (OD600)
The OD600 of each sample (1 mL) was measured, with either YEP or YEPD used to blank the spectrophotometer. Tubes with samples were vortexed in order to ensure an even mix of yeast throughout the media. Absorbance was measured for the duration of the experiment (multiple days). 1 mL of sample from each day was saved for a subsequent spotting assay.
Measuring Living Yeast Population (Spotting Assay)
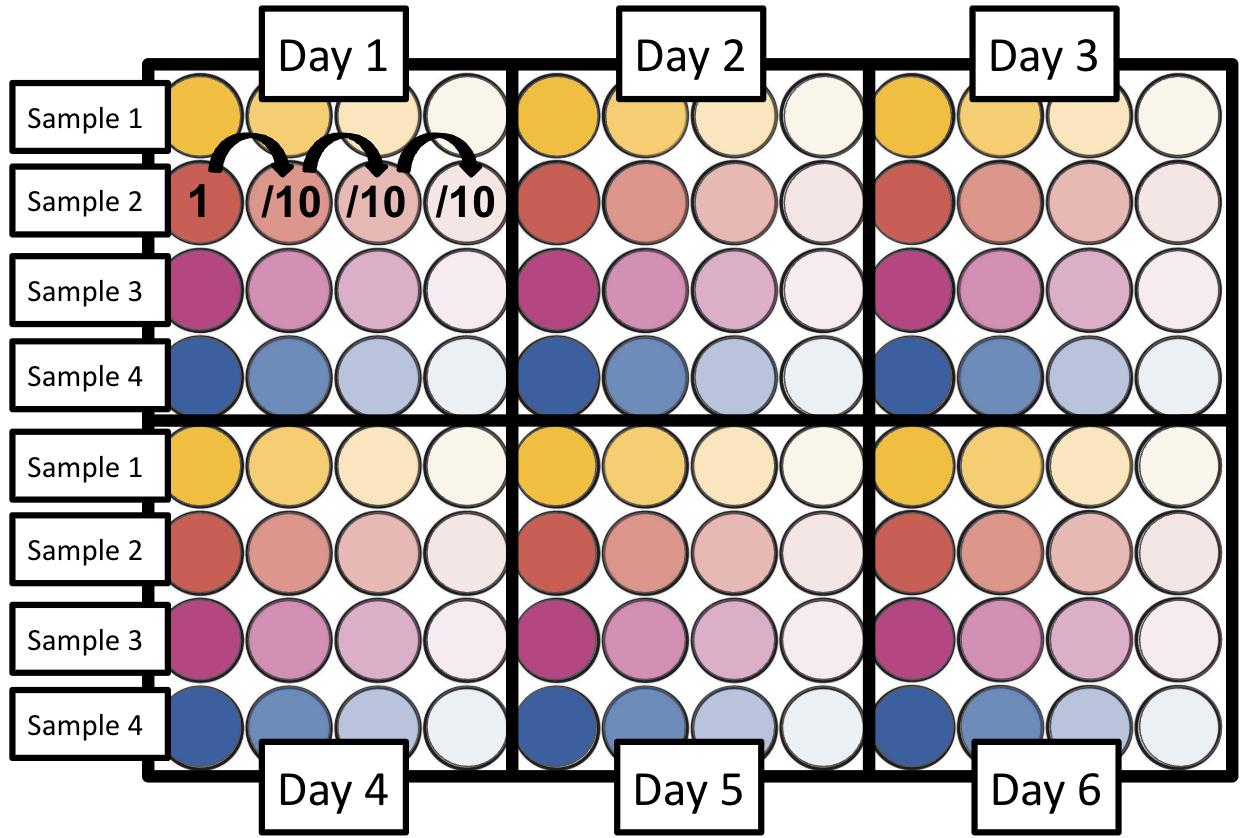
To assess the viability of the yeast population over time, samples from every day were transferred and stored in a 96-well plate. At the end of the entire experiment, serial dilutions (from 100 to 10-3) were performed on all samples at the same time, of which 10µL was placed onto a YEPD nutrient-rich agar plate and incubated at 300C overnight.
Fig 1. Plate Setup of Serial Dilution. Serial dilutions of each day’s samples were performed in a 96-well plate. The darker shade shows a stronger concentration, while the lighter shade indicates a more diluted sample.
Control Experiment
Four tubes were set up, each containing 20mL of media: two with YEP broth and two with YEPD broth. A starter sample was prepared by transferring a single colony of S. cerevisiae from a wild-type master plate into 5mL of YEP broth using a sterile toothpick. 100µL of this starter sample was added to one YEP tube and one YEPD tube, resulting in four experimental tubes: YEP, YYEP (YEP media with yeast), YEPD, and YYEPD (YEPD with yeast). The tubes were incubated at 30°C, with daily OD600 measurements and samples collected for a spotting assay at the end of the experiment. After Day 4, the samples were left undisturbed in the incubator
until Day 8, when final absorbance readings and samples for the spotting assay were taken after a period of undisturbed growth.
Caloric Restriction Experiment
Four tubes were set up, each containing 20mL of YEP media: two tubes with no added glucose, one tube with 0.2% glucose, and one tube with 2% glucose. A starter yeast sample was prepared by transferring a single colony of S. cerevisiae from a wild type master plate into 5mL of YEP broth using a sterile toothpick. 1000µL of this solution was added to three tubes, creating YEP, YYEP, YYEPD 0.2, and YYEPD2. The tubes were incubated at 30°C for 7 days, with daily OD600 measurements and samples collected for a spotting assay at the end of the experiment.
Uninterrupted Caloric Restriction Experiment
Four tubes were set up exactly the same way as in the Caloric Restriction Experiment. The tubes were incubated for 11 days, with absorbance values taken only at the start and end of the experiment, in order to let the samples grow for an extended period of time and to reduce contamination.
Metabolic Memory experiment
Two initial tubes were set up, each containing 20mL of media: YEPD with either 0.2% glucose or 2% glucose. After yeast was added, both tubes were incubated at 30°C. After one week, the tubes were removed from the incubator and vortexed to ensure that yeast cells were evenly distributed throughout the media. OD600 was measured using 1mL of each sample (“standard” and “restricted”). Then, the sample with the higher absorbance was diluted with distilled water until both samples had approximately equal absorbance values, within an error margin of 0.05AU.
Four new tubes were then set up, containing YEPD with either 0.2% glucose or 2% glucose. 600µL of the “restricted” yeast were added into a new control 0.2% glucose tube and into a new 2% glucose tube. 600µL of “standard” yeast was added into a new 0.2% glucose tube and into a new control 2% glucose tube. The final tubes are labeled as follows: R-R (yeast from 0.2% transferred to a new 0.2% tube), R-S (0.2% → 2% glucose), S-S (2% → 2% glucose), and S-R (2% → 0.2% glucose). Tubes were grown at 30°C. Daily absorbance values were taken, but a spotting assay was not conducted.
Results
Control Experiment
We established a protocol to separately measure the two lifespans by using a spectrophotometer to measure daily absorbance (RLS) and a spotting assay to determine how many yeast in the culture remain viable (CLS). As expected, the groups with no organisms showed no growth; levels from the control groups, YEP and YEPD, remained practically constant over the first four days (Table 1). However, from Day 4 to Day 8, absorbance values for YEP and YEPD jumped drastically, indicating sample contamination (see note in Discussion about contamination).
The YYEP group (yeast without glucose) showed a slow , steady growth, but as expected, the yeast are not able to increase their population size effectively without glucose. As expected, the YYEPD group showed the strongest increase in absorbance, indicating that the yeast grew most effectively when glucose was available (sharp increases in population size over the first three days). In the final days (day 4-8), the increase slowed down, showing that the yeast in YEPD media are unable to divide anymore, perhaps because they deplete available resources at a faster rate.
Table 1. Daily Absorbance Values (AU) Across 8 Days. The groups are YEP, YYEP (YEP media with yeast), YEPD, and YYEPD (YEPD with yeast). Contaminated samples are marked in red.
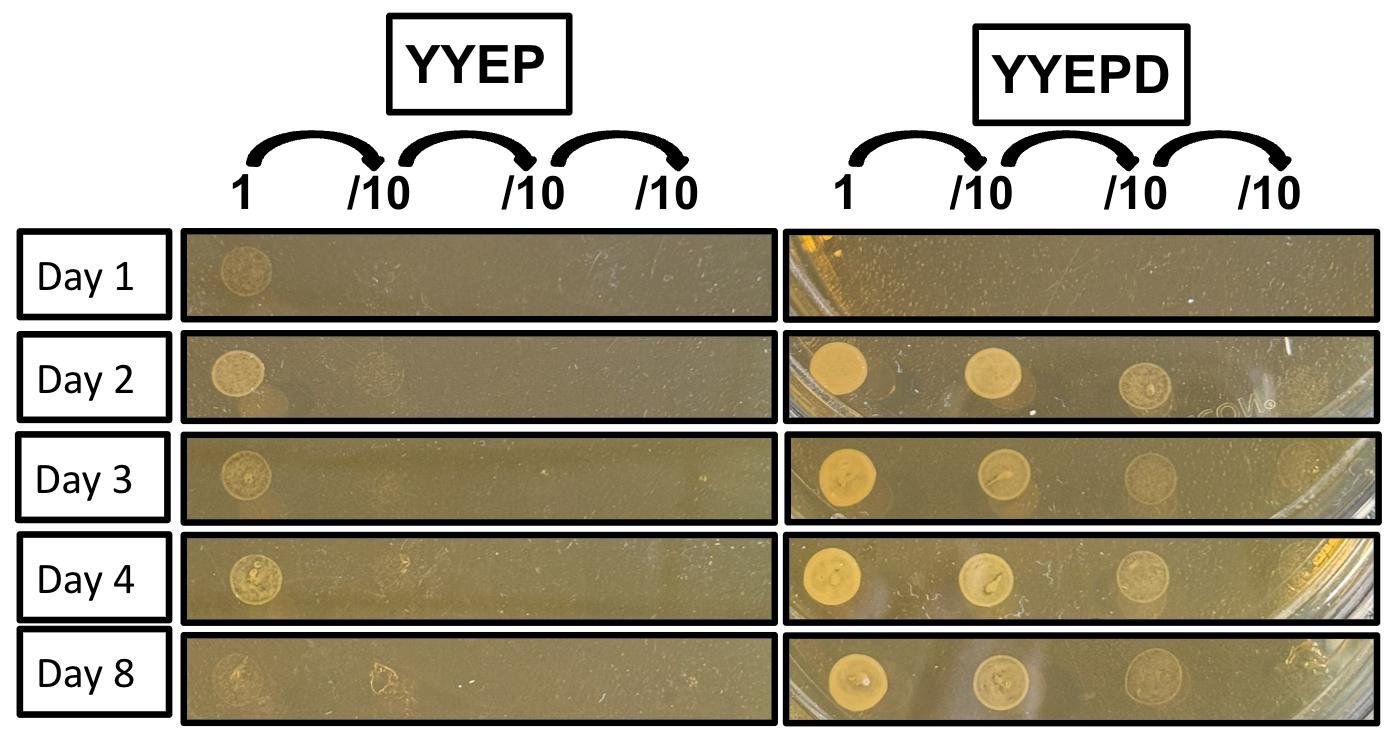
After absorbance data was collected, a spotting assay was conducted. All samples were plated at the same time. From all 5 days, yeast from the YYEP group barely show up, and are only visible in the most concentrated column (Fig. 2). The yeast from YYEPD do not show up on the first day (Day 1 samples were stored the longest), but appear prominently on Days 2, 3, 4, and 8, seen across almost all dilutions. This shows that the yeast in YYEPD have a strong living population. The yeast in YEP, however, die out around Day 8, likely because they have no resources at all to keep themselves alive.
Fig 2. Spotting Assay Comparing YYEP and YYEPD Groups Across 8 Days. The leftmost column of each group shows the most concentrated sample, and the rightmost column shows the most diluted sample.
The experiment demonstrated that glucose availability strongly affects yeast population growth and we confirmed that the experimental setup (using OD600 readings and spotting assays) could be used to compare yeast growth and viability across conditions.
Caloric Restriction Experiment
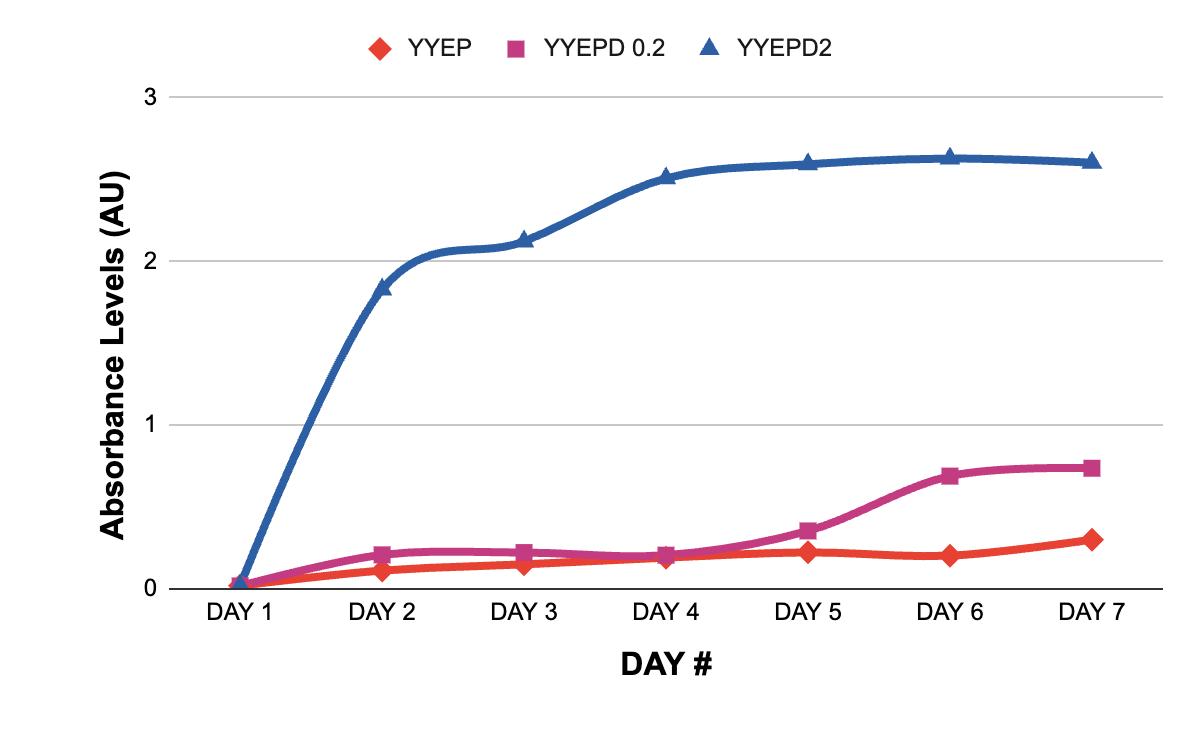
Table 2. Daily Absorbance Values Representing Both Living and Dead Yeast Cells. This table shows absorbance values (AU) for groups YEP (no yeast, no sugar), YYEP (yeast, no sugar), YYEPD0.2 (yeast in caloric restriction), and YYEPD2 (yeast in standard media). Contaminated samples are marked in red.
YYEPD 0.2, and YYEPD2 over 7 days.
When we compared yeast growth under standard (2% glucose, YYEPD2 in Table 2) and restrictive (0.2% glucose, YYEPD0.2 in Table 2) conditions, we saw that yeast in standard media see a sharp growth, followed by a plateau around Day 4. Yeast in restrictive media show a slower but more consistent growth, suggesting a more controlled approach to division, triggered by the nutrient scarcity of the media. As expected, yeast in YYEP with no glucose show virtually no growth. It is important to note the contamination of the YEP group. It is evident that some sort of growth appears in the YEP group by the end of the seven days, because the original sterile media would not increase in absorbance by itself.
The YYEPD2 group shows a steep climb, reaching maximum population size before plateauing. YYEPD 0.2 shows a much more gradual climb, and a slower growth speed. YYEP shows barely any growth, which aligns with the fact that they did not have resources. The YEP group shows signs of contamination, with a sharp jump from Day 5 to Day 6, and the trend continuing into Day 7.
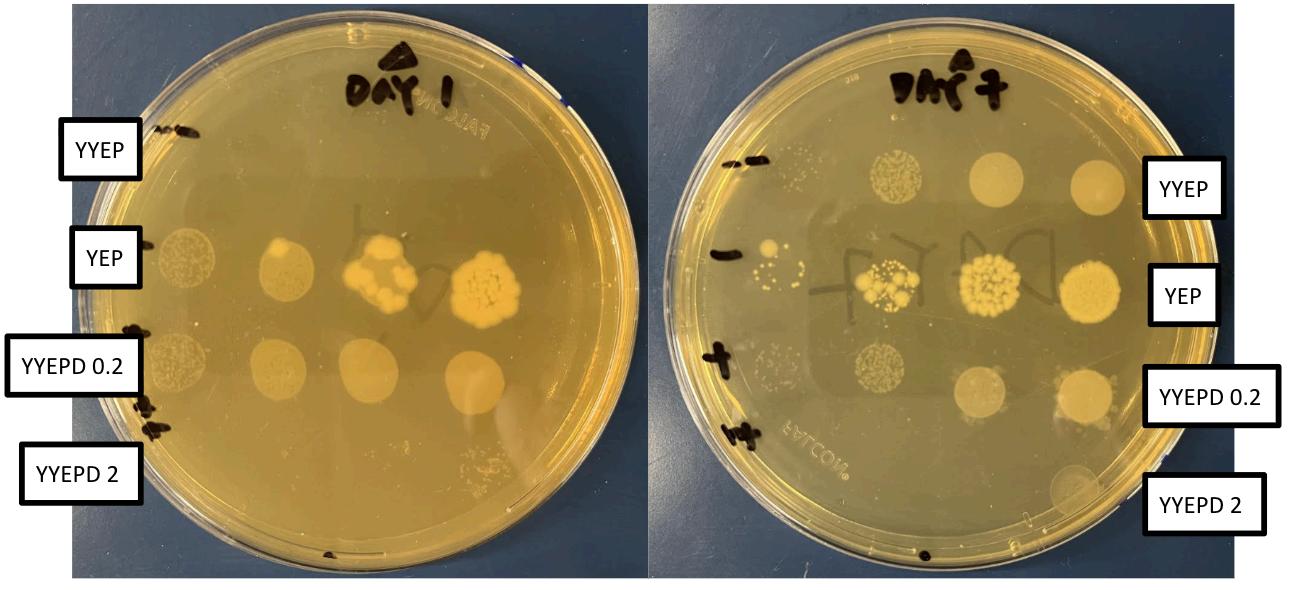
In the spotting assay, there is bacterial contamination in the YEP group (Fig. 4; see note on contamination in Discussion). The yeast grown under caloric restriction appeared more prominently than the yeast grown in standard media on both days, revealing that they have a higher living population; this lets us conclude that more cells remained alive.
Fig 4. Spotting Assay Representing the Living Population of Yeast Cells. The rightmost column is the most dense concentration, and the leftmost column is the most diluted concentration. Note: bacterial contamination in the YEP group.
Uninterrupted Caloric Restriction
Yeast were grown uninterrupted for 11 days to give yeast under caloric restriction more time to grow The YYEPD2 group and the YYEPD0.2 group reach the same absorbance after 11 days, meaning that they reached the same population size. This should have also reduced contamination, but the YEP group still showed evidence of contamination (see note in Discussion).
Table 3. Absorbance Values at the Start and End of 11 Days. Contaminated samples are marked in red.
Metabolic Memory
To test metabolic memory, we transferred yeast out of caloric restriction into nutrient-rich conditions to see if they retain characteristics of growth they developed in their previous environment. The R-R and S-S groups served as controls for this experiment. Comparing the S-R group against its control S-S group, we can see that they do not follow the same growth pattern. The S-R growth trajectory is closer to the R-R growth trajectory, suggesting that the S-R group is following the caloric restriction growth rate. The R-S group does not follow the growth trajectory of the group in caloric restriction, but is closer to the control group in standard media.
Table 4. Absorbance Levels over Four Days, Excluding Day 3. The groups include R-R (0.2 to 0.2), R-S (0.2 to 2), S-S (2 to 2), and S-R (2 to 0.2). The first letter (R for “Restricted” or S for “Standard”) represents what the yeast were “trained” on, and the second letter represents what media they were transferred to.
Discussion
Caloric Restriction
Overall, the caloric restriction experiment suggests that yeast grown in 0.2% glucose (YYEPD 0.2) grew more slowly than yeast grown in standard 2% glucose media (YYEPD2), but were still able to reach a similar final population size over a longer period of time. YYEPD2 showed rapid early growth followed by a plateau, while YEPD 0.2 showed slower, more gradual growth. By the uninterrupted day 11 measurement, however, both groups reached nearly the same absorbance level, suggesting that caloric restriction did not prevent yeast from reaching a similar total population size. This indicates that division is slowed, but RLS is not necessarily reduced overall.
The spotting assay lets us compare the groups’ CLS. Although the standard media yeast reached a higher absorbance earlier, the yeast in caloric restriction were more visible on the
spotting assay, indicating a larger living population. This suggests that yeast grown under caloric restriction survive better over time, supporting the idea that caloric restriction extends CLS. CLS is usually defined as the period of time that yeast survives after senescence. However, this experiment did not test whether or not the yeast were in senescence. So, it’s possible that the yeast in caloric restriction simply live longer by growing slower than the yeast in standard media.
Metabolic Memory
There was no evidence that yeast retained the effects of their previous glucose environment after transfer. If metabolic memory were present, the R-S group would be expected to continue showing a growth pattern similar to the R-R group, and the S-R group would be expected to remain closer to the S-S group. Instead, the R-S group showed a sharp increase in absorbance after being transferred into 2% glucose media, making it more similar to the S-S group than to the R-R group. Similarly, the S-R group showed slower growth after being transferred into the 0.2% glucose media, making it closer to the R-R group than to the S-S group. This suggests that yeast growth is more determined by the current glucose concentration than by previous nutrient conditions. Therefore, this experiment does not support the presence of metabolic memory in yeast.
Note About Contamination
Contamination of the YEP group was evident throughout all experiments. Bactopeptone, which is included in all sterile media for this experiment, contains proteins that may support bacterial growth. Where yeast growth is absent, other organisms may be able to take over. We saw this in our experiments; there was only contamination in tubes where there was no yeast present. Plates in Fig 4. also support this, as the contamination in YEP looks like bacterial growth. In the future, we could add antibiotics to the media, in order to prevent bacterial growth without suppressing yeast.
References
1. López-Otín, C., Blasco, M. A., Partridge, L., Serrano, M. & Kroemer, G. The Hallmarks of Aging. Cell 153, 1194–1217 (2013).
2. Heydari, A R., Unnikrishnan, A., Lucente, L. V & Richardson, A Caloric restriction and genomic stability Nucleic Acids Research 35, 7485–7496 (2007).
3. Liu, W. et al. From Saccharomyces cerevisiae to human: The important gene co-expression modules. Biomedical Reports 7, 153–158 (2017).
4. Bitterman, K. J., Medvedik, O & Sinclair, D A Longevity Regulation in Saccharomyces cerevisiae: Linking Metabolism, Genome Stability, and Heterochromatin. Microbiology and Molecular Biology Reviews 67, 376–399 (2003).
5. Hagman, A., Säll, T & Piškur, J Analysis of the yeast short-term Crabtree effect and its origin. The FEBS Journal 281, 4805–4814 (2014).
6. Ludovico, P., Sousa, M. J., Silva, M. T., Leão, C. & Côrte-Real, M. Saccharomyces cerevisiae commits to a programmed cell death process in response to acetic acid. Microbiology 147, 2409–2415 (2001).
7. Intine, R. V. & Sarras, M. P. Metabolic Memory and Chronic Diabetes Complications: Potential Role for Epigenetic Mechanisms. Current Diabetes Reports 12, 551–559 (2012).
8. Dong, H. et al. Metabolic memory: mechanisms and diseases. Signal Transduction and Targeted Therapy 9, (2024).
9. Zhai, J et al. Caloric restriction induced epigenetic effects on aging. Frontiers in Cell and Developmental Biology 10, (2023).
Taste the Rainbow: Investigating Synesthesia in
Zoe O Mentor: Leah K.
Different Age Groups
Abstract
Grapheme-color synesthesia, a phenomenon in which presentation of a printed text triggers the visual portion of the brain, is commonly identified through a patterned-based, multiple-trial behavioral test called the Revised Test of Genuineness (TOG-R). In this experiment, we created a shortened, modified version of the TOG-R to possibly discover a case of synesthesia. Knowing that the likelihood of this would be extremely rare, we also decided to examine all degrees of cross-sensory associations across age groups. Two classes (fourth and twelfth graders) completed a color-matching task involving visual and auditory stimuli, administered again after a four-week period. We expected to see a higher consistency rate in the younger age group after two trials as synesthesia has been shown to be more prominent at a younger age, as well as consistent associations between certain easily visualizable stimuli and certain colors across all participants. We were also interested in investigating the difference in consistency between the auditory and visual stimuli. As for our findings we found no evidence of synesthesia which was not surprising due to the low number of participants in this experiment. Between age groups, consistency rates were similar for “words heard” and “words seen”, but the older age group had a slightly higher consistency rate for the “sounds heard” stimuli. In addition to the control stimuli, we saw consistent associations with stimuli that have a somewhat universal color attached to them when visualized. In addition to the stimuli discussed above, we found that the stimuli “happy” also showed a consistent association across both age groups. Overall, we found that the easiest stimuli to associate with a certain color were the ones that individuals already had a mental picture of and could visualize easily.
Introduction
The term synesthesia originates from a Greek word meaning a "union of the senses." Over sixty types of synesthesia have been formally identified, with the most prevalent type being "grapheme-color synesthesia," where a grapheme— being the smallest functioning unit of a writing system (a visual phenome) will trigger the visual sensation of a color.
Grapheme-color synesthesia has a 64.4%1 prevalence among the many types of synesthesia, with chromesthesia (sounds inducing colors) and spatial sequence synesthesia (visualizing sequences in physical spaces) being the second and third most common respectively. Other, less common types include auditory-tactile synesthesia (sounds inducing certain sensations in parts of the body), lexical-gustatory synesthesia (certain words triggering phantom tastes), and
ordinal-linguistic synesthesia (certain ordered sequences being associated with certain personalities). If an individual has one type of synesthesia, there is a much higher probability that they will have another, with each synesthete having an average of 2.3 types at once.2
It is possible that these multi-sensory sensations and associations that are a result of synesthesia greatly resemble the multi-sensory associations that are commonly formed as a young child and are strengthened throughout development. Several similar associations like these are formed across many individuals who do not have synesthesia, yet the question arises. Is this a type of synesthesia? Or simply symbolic association that has been deeply ingrained in our memories?
Memory has shown to be enhanced in grapheme-color synesthesia, such as in the free recall of several lists of words. For spoken words, these words may be encoded in the brain as both a visual and a verbal code. In 2012, a study4 suggested that grapheme-color synesthetes have enhanced visual processing methods extending to both auditory and visual stimuli, a correlation potentially linked to the parvo-cellular system and the ventral visual stream pathways in the brain related to visual processing. Grapheme-color synesthetes showed enhanced memory across all stimuli, while this result was not found in non-visual types of synesthesia. This advantage was most prominent for fractal stimuli, which are hard to decode semantically and verbally, making it difficult to attach meaning to them. The strongest data was found for abstract visual images and stimuli where color could be used to discriminate old from new, without attaching meaning. This study was primary in allowing researchers to conclude that visual memory plays an important role in visual types of synesthesia.
Research has also sought to identify whether there is a distinct behavioral profile associated with synesthesia. A behavior profile is a structured assessment of the brain to identify unique biomarkers associated with a particular condition. In one study3 thirteen different biomarkers were observed in an attempt to classify synesthetes through behavioral assessments and neuroimaging. The most consistent biomarkers found were related to intra-cortical myelin a substance found in the cerebral cortex's gray matter which insulates and speeds up the transmission of electrical impulses between neurons.
These neuroanatomical findings connect naturally to the two leading hypotheses for the cause of synesthesia. The first, which we will refer to as the "hyperconnectivity theory,"3 is centered around the phenomenon of synaptic pruning. In early childhood, the brain contains many more connections between neurons than is truly necessary, so that as many connections may be established as possible. Over time, the brain undergoes synaptic pruning, where frequently used connections are kept and strengthened while unnecessary connections are eliminated, causing the brain to become more efficient and specialized. The hyperconnectivity theory is that individuals with synesthesia had a lack of synaptic pruning, causing several regions of the brain to remain overly connected. Instead of these regions becoming entirely separate, they stay highly interconnected, causing linkages between different senses. This
theory suggests that synesthesia may be more common in young children, as most individuals are born with the potential for synesthesia, but these impulses are pruned away as the brain begins to strengthen its most-used connections.5,7,8
Research into the relationship between synesthesia and age reveals that the condition is neither static nor uniform across the lifespan being incredibly inconsistent. Synesthesia manifests behavioral markers as young as age 6, and its onset can be detected in young grapheme-color synesthetes, though it develops as an acquired trait with a protracted timeline.9 Longitudinal tracking has shown that only 34% of synesthetic associations are established by ages 6–7, rising to 48% by ages 7–8, and reaching 71% by ages 10–11.10 Importantly, not all childhood cases stay the same– a longitudinal study tracking children from ages 6 through 11 found that some children who previously qualified as synesthetes no longer met the criteria at later testing, suggesting that the true prevalence of synesthesia in young children could be higher than in adults, with some cases naturally fading during development.7 This is consistent with the hyperconnectivity theory discussed above, which proposes that synaptic pruning over time eliminates cross-sensory connections in most individuals. At the other end of the lifespan, synesthesia also appears to change in older age. Research has found proportionally fewer older than younger synesthetes, not only because fewer older people self-report the condition, but because fewer also pass the objective diagnostic test; the internal mental colors of synesthetes become less saturated with age, and low-saturated colors are linked with test failure.9 Rather than simply fading, however, synesthesia appears to undergo more comprehensive changes with age, with a decline in vivid colors and a shift toward brown and achromatic tones in older age.10
The second hypothesis, known as the "disinhibited feedback theory," proposes that all brains have similar connections between senses and areas of the brain, but that in those with synesthesia, these connections are not properly suppressed. This weaker inhibition causes multiple areas of the brain to be stimulated when only one is triggered a sort of "spilling over" of the senses. Unlike the hyperconnectivity theory, disinhibited feedback attributes the stimulation of multiple senses to reduced filtering or control of existing connections, rather than extra wiring.9
A study from the National Library of Medicine8 collected DNA samples of individuals with synesthesia and analyzed 410 microsatellites dispersed on chromosomes, identifying four chromosome regions where genes were most commonly linked to synesthesia. These regions were also found to contain genes linked to autism, dyslexia, and epilepsy. The strongest specific linkage was a gene involved in the regulation of reelin, a protein that controls neuron migration processes in the developing brain. These results additionally demonstrated that auditory-visual synesthesia is possibly an oligogenic condition, meaning that is it subject to multiple modes of inheritance. Additionally, it has locus heterogeneity meaning mutations in different genes can cause the same condition.
Given both the neurological and genetic complexity of synesthesia, a key question emerges: can synesthesia be formally identified? The first scientifically recognized procedure was a "Test of Genuineness" conducted by Baron-Cohen et al. in 1987.11 Considered by Baron-Cohen to be an objective diagnostic, the results were clear: those who claimed to have synesthesia had a 100% consistency rate of matching color to stimuli when tested twice ten weeks apart, while the control group had a 17% consistency rate. This original Test of Genuineness was thereafter considered the "gold standard" diagnostic test for synesthesia by much of the scientific community. However, it had significant limitations it relied on verbal descriptions of synesthesia, which were fairly subjective and produced unreliable results, especially from young children, in whom synesthesia has been found to be most prevalent. It was also very difficult to connect a verbal description of a color to a color chart. Noticing these limitations, Asher and his team created a TOG-R, a revised version of the original test, designed to more objectively and reliably identify auditory-visual synesthesia by replacing verbal color descriptions with direct color selection from a standardized guide the Pantone-based Cambridge Synaesthesia Charts. The study recruited 26 synesthetes (5 male, 21 female) and 23 control subjects (4 male, 19 female), all with auditory-visual synesthesia — a notably female-skewed sample consistent with broader patterns of synesthesia prevalence reported in the literature. Using a CD, 99 unique sounds were presented: 51 word-based and 48 non-word-based. Word stimuli included days of the week, months of the year, Christian names, numbers, letters, and articles, while non-word stimuli included musical instrument sounds, natural environment sounds, and man-made environment sounds. Each sound was embedded within an 8-second audio track, playing for 1–3 seconds followed by silence, and all recordings were made using a single voice to ensure consistency across stimuli. Color selection was drawn from a Pantone color guide offering 241 distinct choices, with neutral tones included, given their reported prevalence in previous accounts of synesthetes. Testing was conducted in a room lit solely by artificial light, with color charts laid flat on a surface, and no headphones were used during playback.
The procedures differed between groups to account for the different nature of their color associations. Synesthetes were permitted to select up to two colors per sound, recording each selection's numbered Pantone code on a response sheet, or entering a dash if no color was experienced. Control subjects were instructed to choose a single color swatch per sound and to try to remember the color itself rather than the numerical code associated with it a distinction intended to minimize the likelihood that control subjects could simply memorize code numbers across sessions. To further reduce the chance of recall, synesthetes faced a one-month delay between their initial test and retest and were not informed in advance that a retest would occur. Control subjects were retested one week later after the initial test.
The results validated the hope that the TOG-R could be used as a true diagnostic. Synesthetes scored significantly higher than controls (mean = 71.3% vs. mean = 33%),
confirming that “the TOG-R is equally accurate in the diagnosis of synesthesia as the original test, while providing greater precision in quantifying the closeness of color matches.”9 Beyond simply confirming or denying synesthesia, the TOG-R also allowed researchers to have a more nuanced view of participants, rather than simply identifying whether they had synesthesia or not.This was a change from the original TOG, and allowed researchers to have a more nuanced view of a synesthete, as the original TOG only produced binary results– synesthete or non-synesthete.
As a culmination of our research, we decided to create our own version of the TOG-R, or rather, a Revised- Revised Test of Genuineness:
Experimental Design & Procedure
Participants consisted of two classes: a high school class of 12th graders with fifteen participants, and a 4th grade class with twelve participants. These ages were included to allow for developmental comparisons across age groups. All participants completed the same task under identical conditions. The assessment was administered twice to the same participants, with a four-week interval between sessions to evaluate the consistency of responses over time.
Our shortened version of the TOG-R consisted of 26 stimuli divided into the following categories:
10 spoken words (auditory verbal stimuli)
10 visually presented words (written stimuli)
5 non-verbal sounds (human-created or instrumental stimuli)
Stimuli were selected to represent a range of tangible to abstract concepts. All 20 spoken and visually presented words were common English words. Spoken words were administered through pre-recorded audio files with the same human voice each time - with as minimal accent as possible, to ensure consistent pronunciation and timing. Non-verbal sounds were by pasting a YouTube link into the corresponding slides, then clicking on the link and playing the subsequent clip when the time came. All 26 stimuli were presented via a projected slideshow on Google Slides.
Participants were provided with:
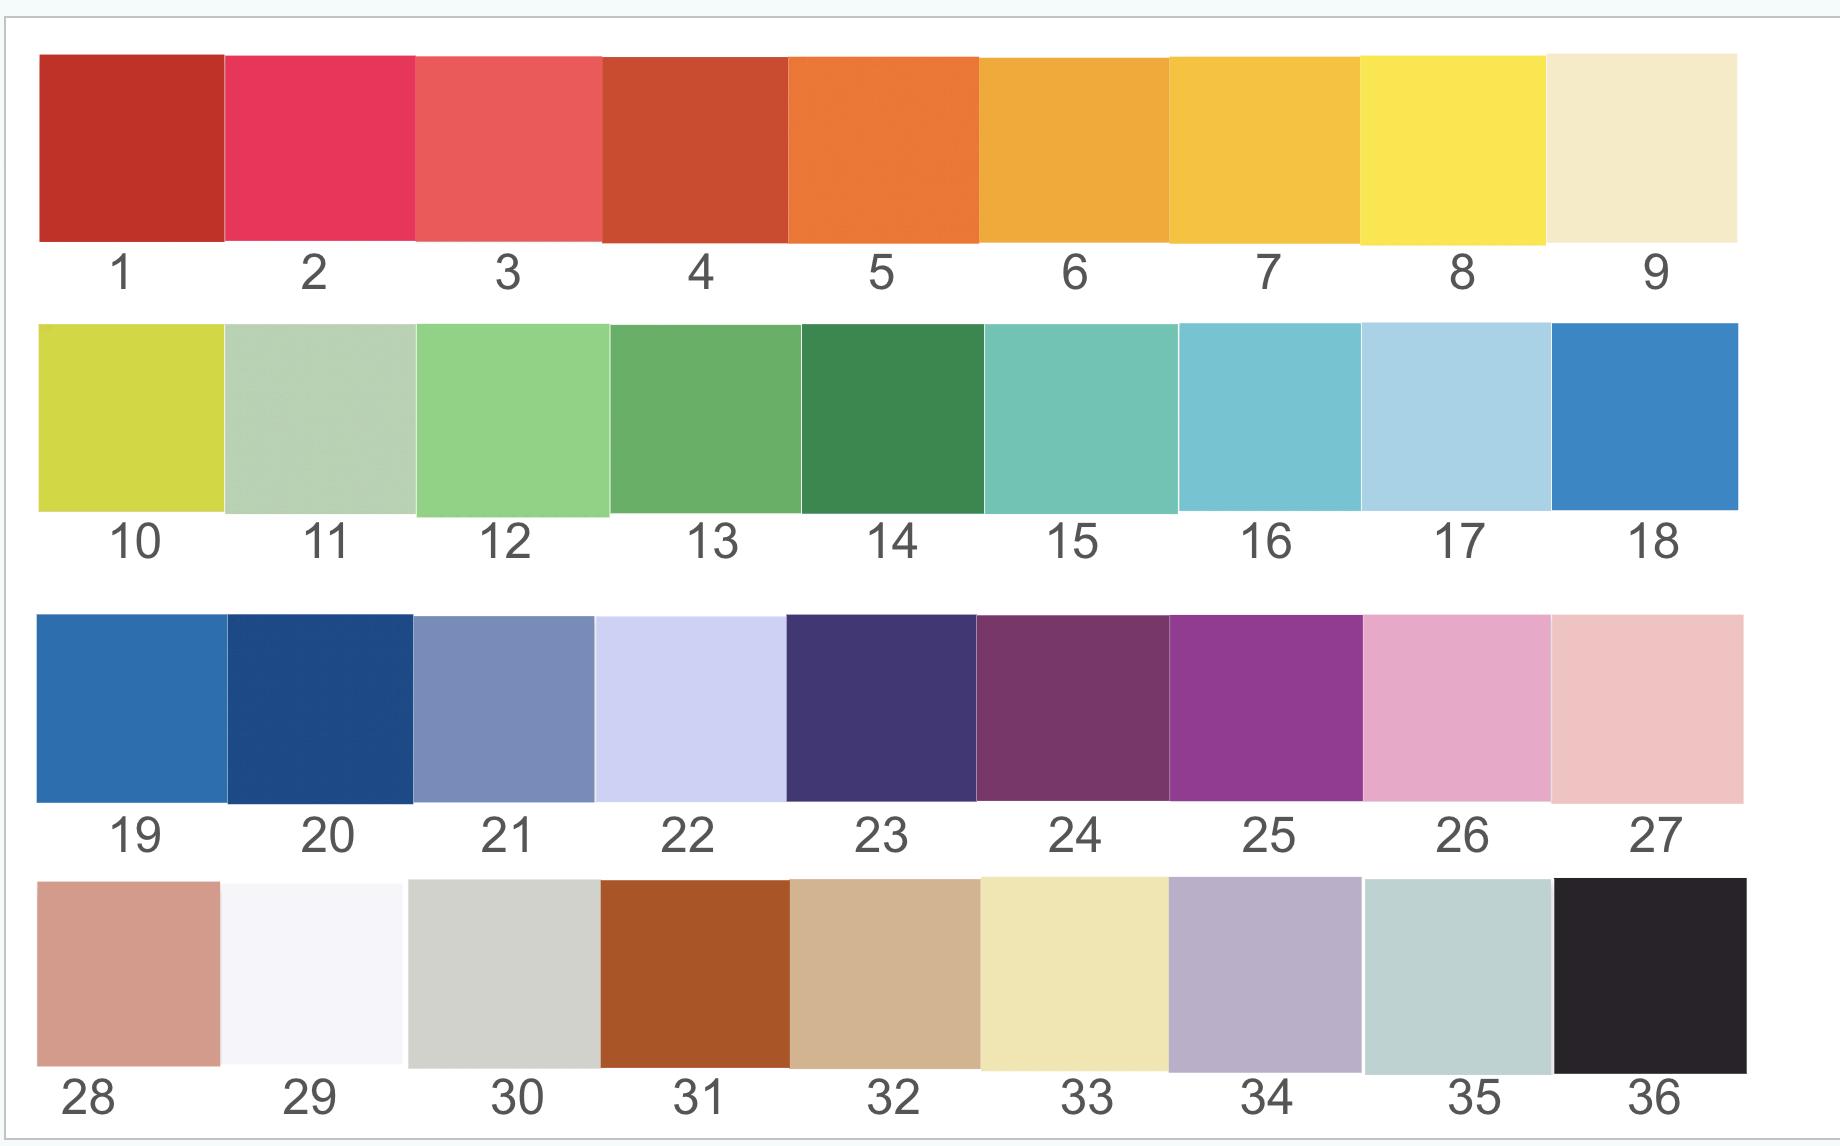
1. A printed color guide consisting of 36 distinct colors, including both neutral and highly saturated colors (Figure 1).
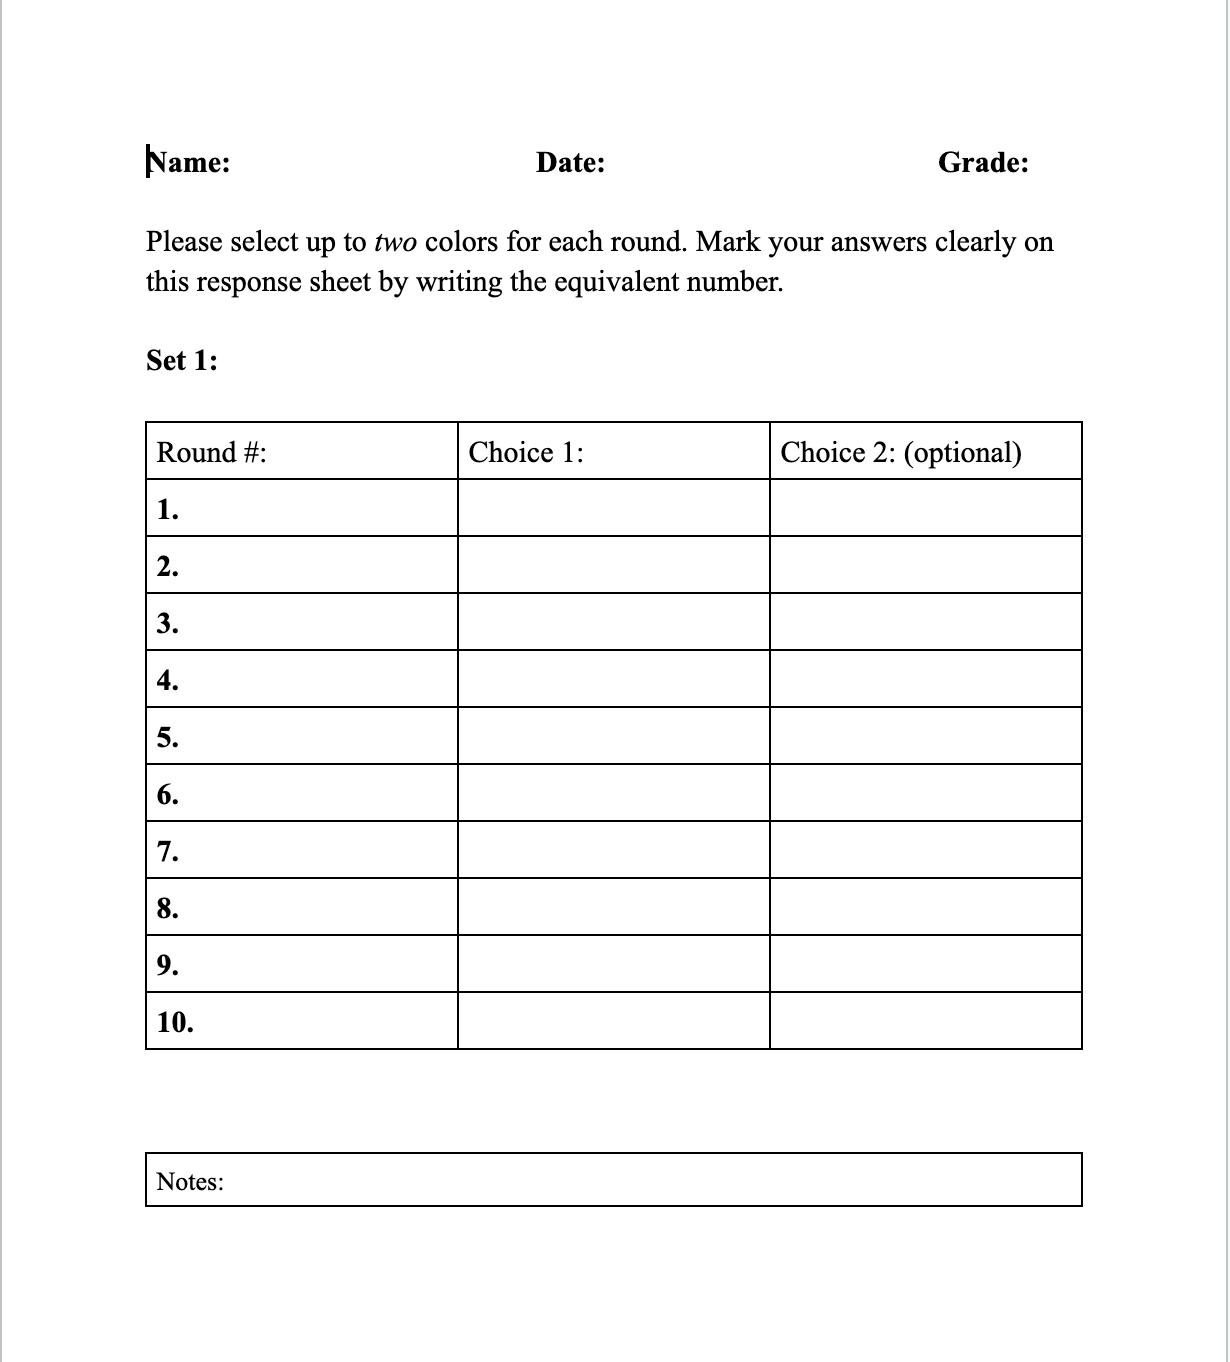
2. A response sheet listing each stimulus with space to record answers (Figure 2).
3. Participants were asked to provide their own writing utensil.
Participants were instructed to select up to two colors from the provided color guide that best matched each stimulus. The first choice of color was mandatory, while the second one was optional.
The experiment was divided into three sections:
1. “Words heard”: Participants listened to 10 words presented one at a time. Each word was played for about 10 seconds. During this time, participants recorded the number(s) corresponding to their chosen color(s) on their response sheet.
2. “Words seen”: Directly after completing the “words heard” set, participants were shown 10 written words presented one at a time. Each word was displayed for approximately 10 seconds. During this time, participants recorded the number(s) corresponding to their chosen color(s) on their response sheet.
3. “Sounds heard”: Directly after completing the “words seen” set, participants were shown 6 non-verbal sounds. Each sound was played for approximately 5 seconds. During this time, participants recorded the number(s) corresponding to their chosen color(s) on their response sheet.
All materials were collected from participants immediately after the completion of the third set. Participants were not provided with further information.
Set 3 (sounds heard): Human Scream, Piano, Drums, Clarinet, Violin, Trumpet
It is worth mentioning that the order of the stimuli in each set was scrambled in the second trial, while the order of each set was kept the same from trial to trial.
Results:
Exact matches after 4 week interval for all sets:
Set 1:Words Heard Words Heard
Mean of exact matches (12th)
Mean of exact matches (4th)
2.42/10 stimuli
2.27/10 stimuli
Set 2: Words Seen Words Seen
Mean of exact matches (12th)
Mean of exact matches (4th)
2.5/10 stimuli
2.9/10 stimuli
Set 3: Sounds Heard Sounds Heard
Mean of exact matches (12th)
Mean of exact matches (4th)
1.5/6 stimuli
0.6/6 stimuli - some had 0 exact matches
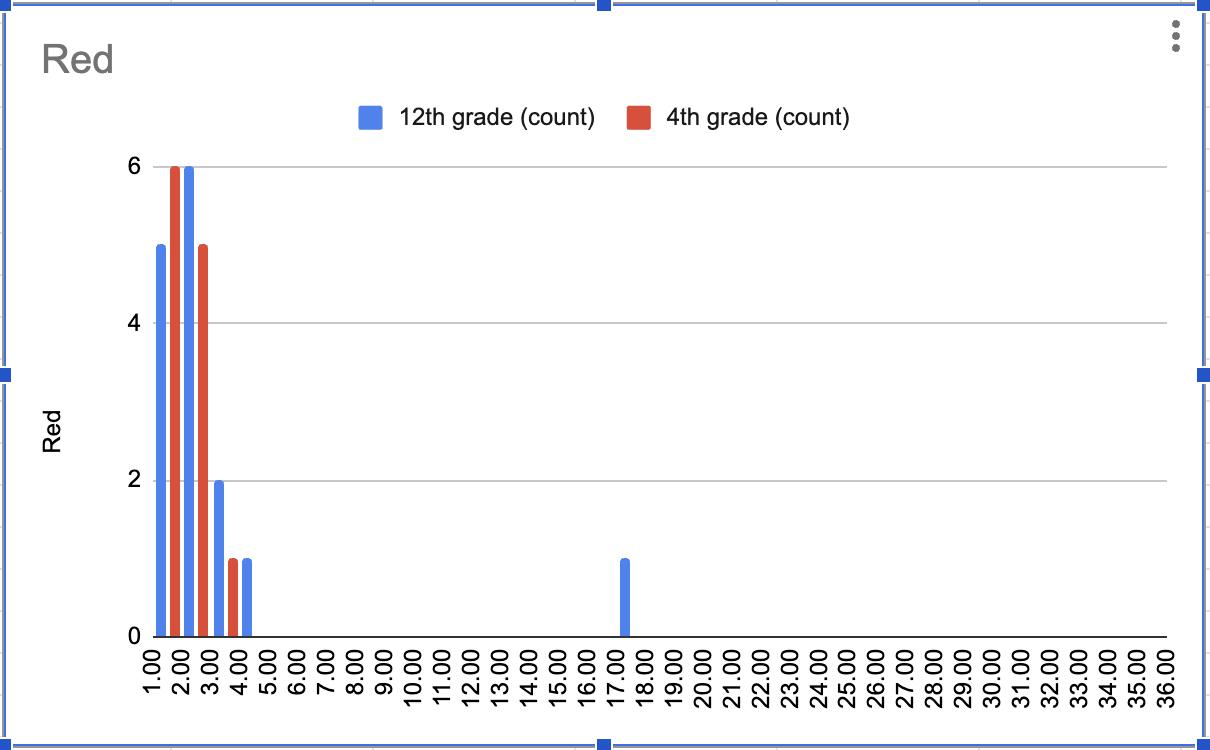
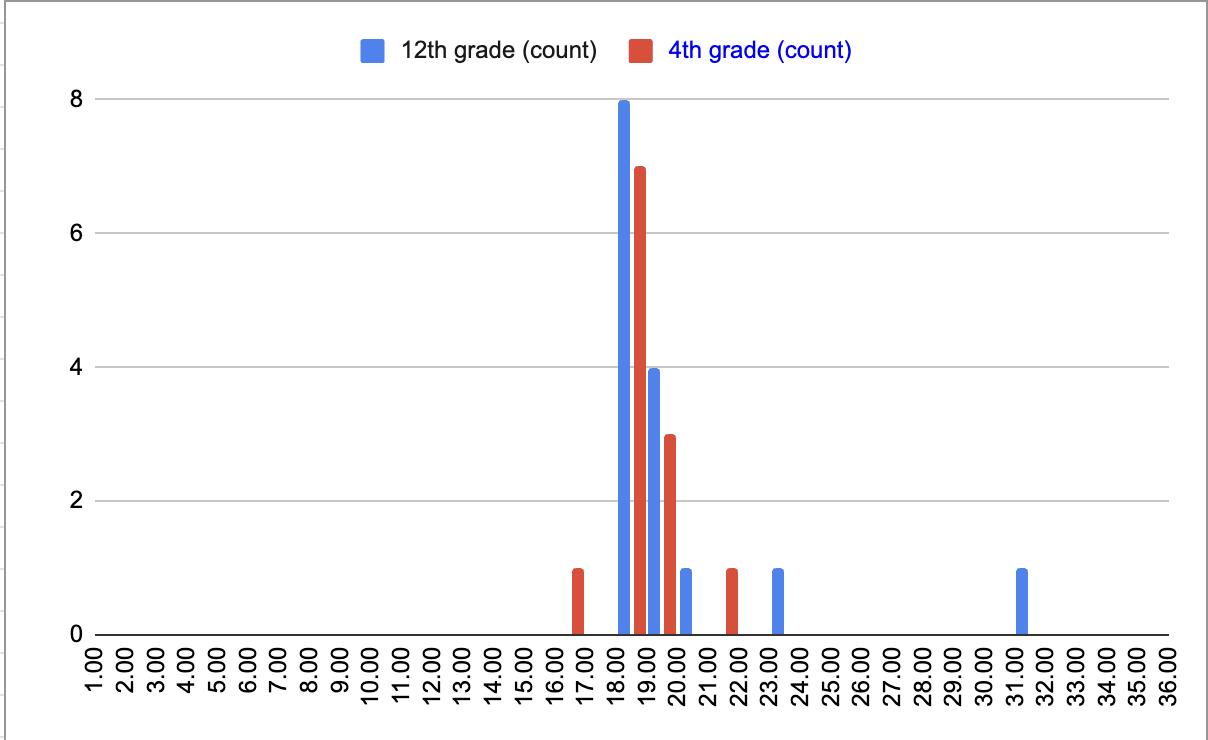
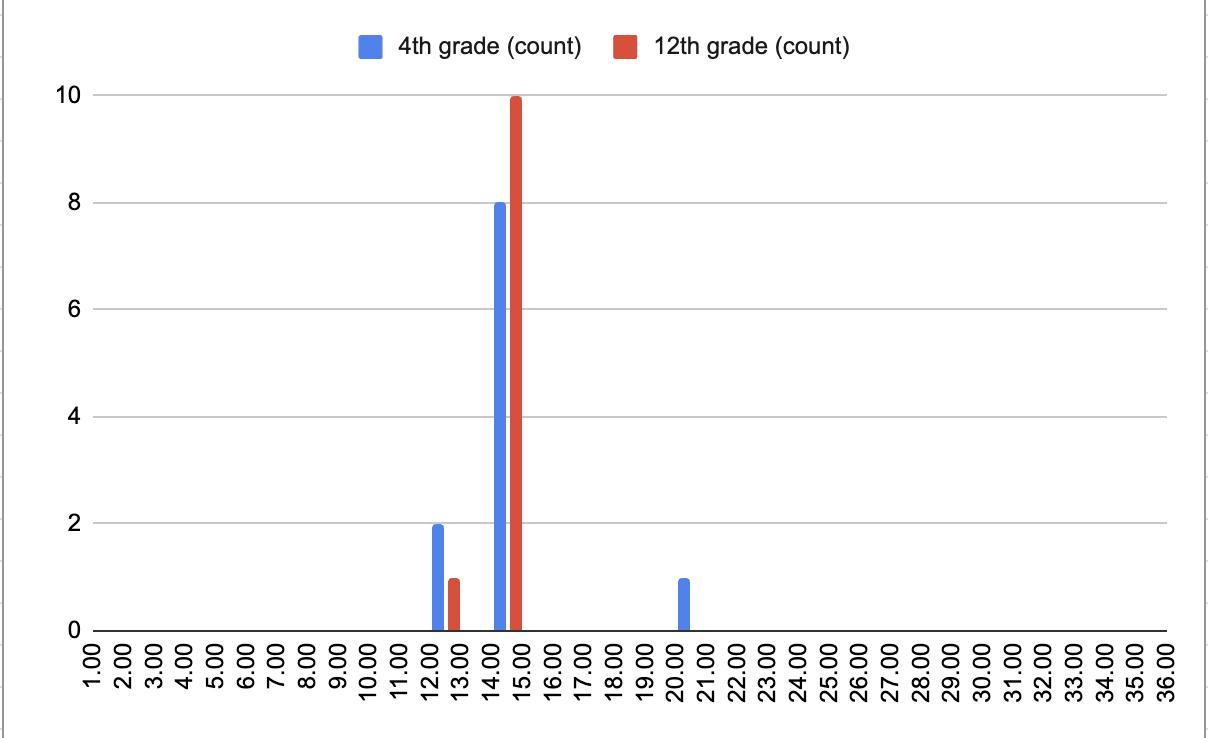
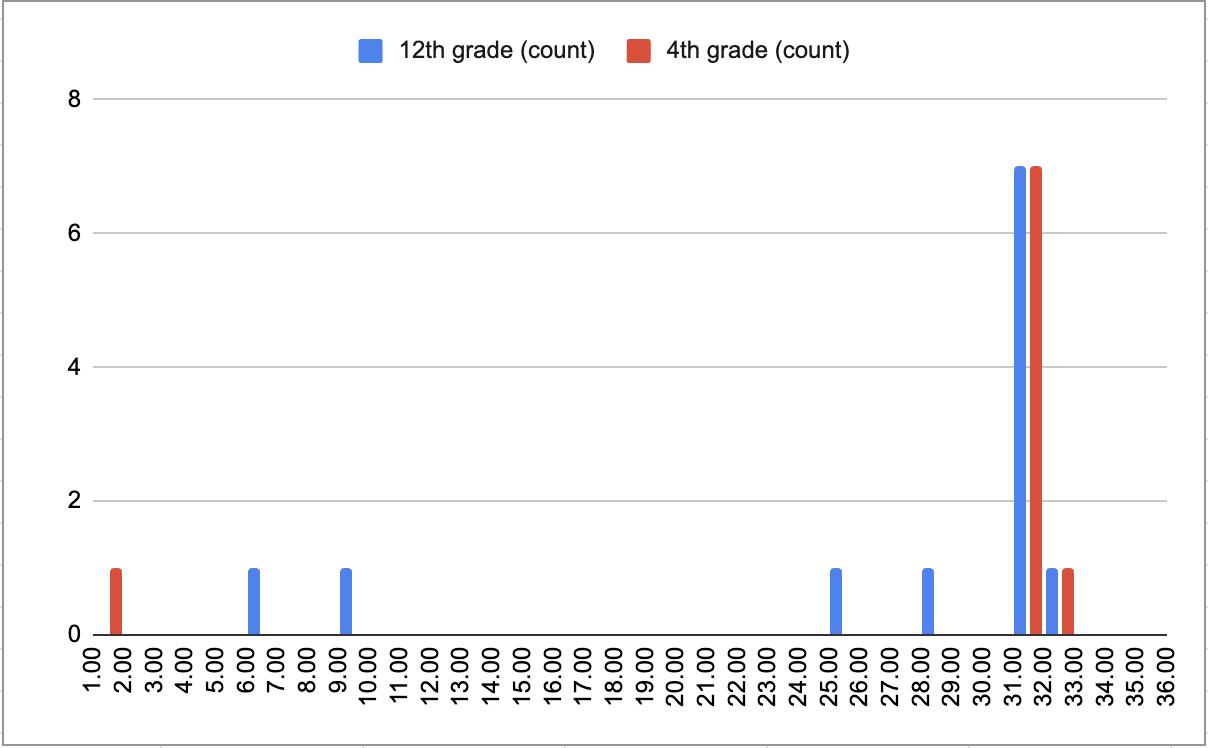
Histograms of Consistent Stimuli: Y-axis - number of responses. X-axis, color options: 1-36
Fig. 3: Histogram of “red”
Fig. 4: Histogram of “blue”
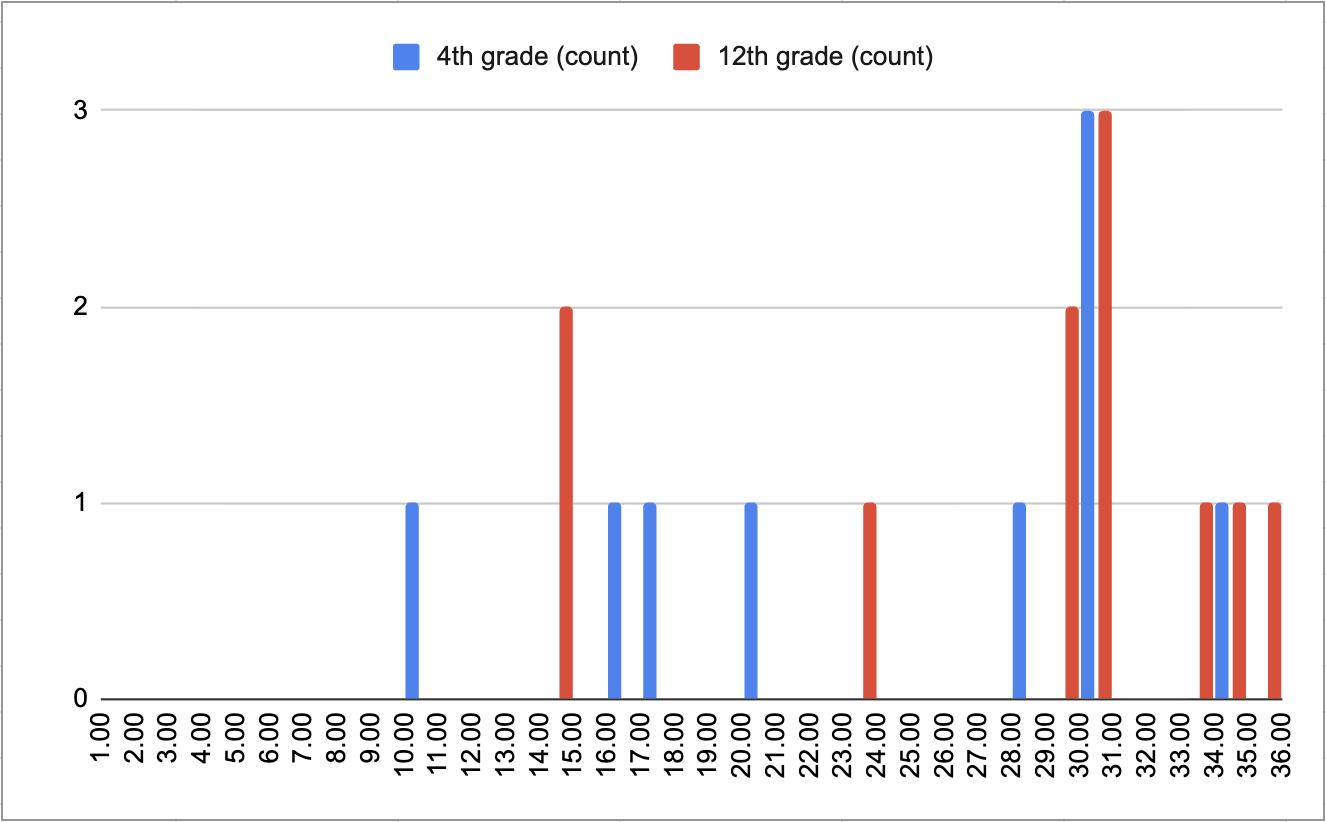
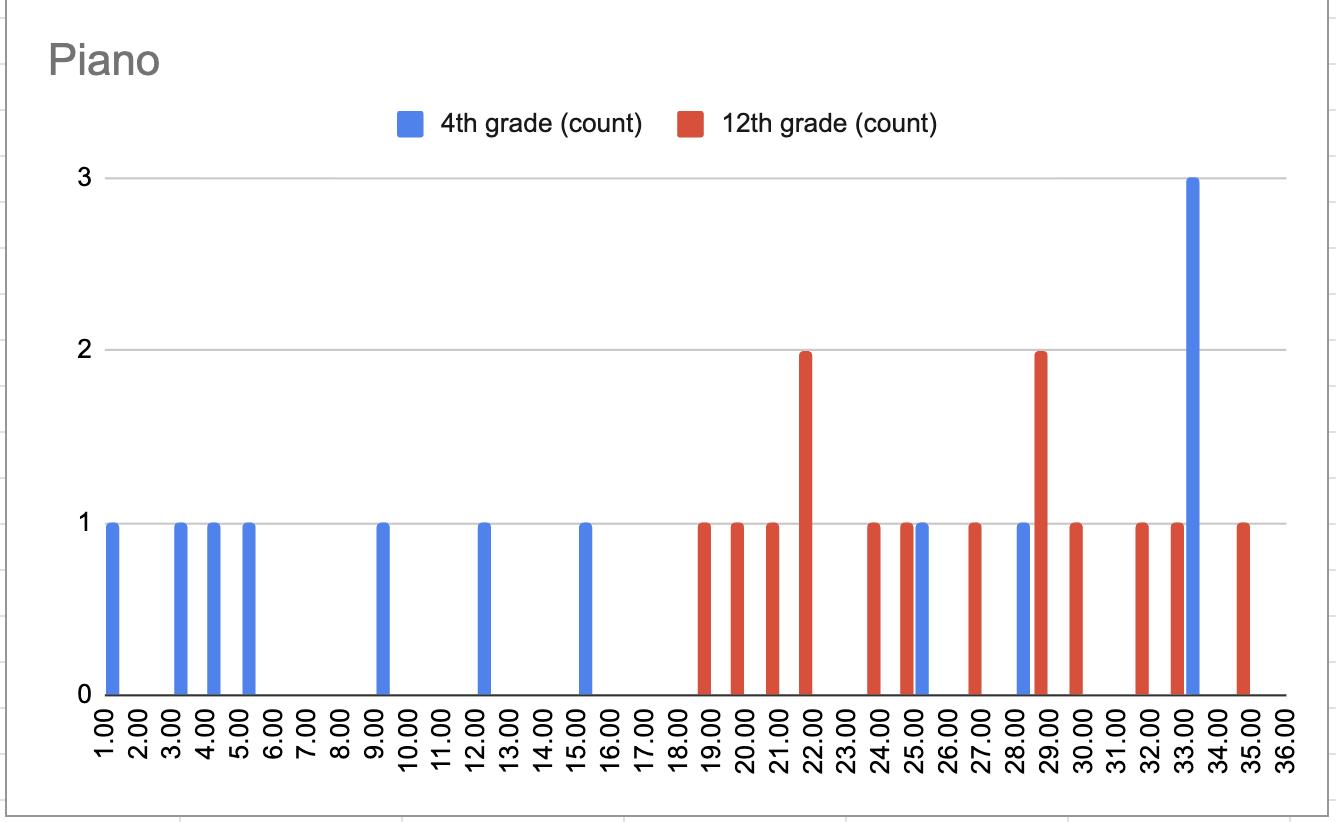
Histograms of Inconsistent Stimuli: Y-axis - number of responses. X-axis, color options: 1-36
Discussion:
For the stimuli under the category of “sounds heard”, 12th graders performed better overall, as their average number of exact matches was higher than the average number of exact matches of 4th graders. For 12th graders the mean of exact matches was 1.5 matches out of six stimuli. For 4th graders the mean of exact matches was 0.6 matches out of six stimuli. It is also worth noting that each individual tested in the 12th grade pool had at least one exact match over two trials, while this was not necessarily true in the 4th grade pool, with six individuals having zero exact matches over two trials. Also worth noting that the presentation of these stimuli wasn’t ideal, as the sound files were highly variable in their presentations to participants.
For the stimuli under the category of “words heard,” 12th graders and 4th graders performed very similarly. For 12th graders the mean of exact matches was 2.42 matches out of ten stimuli. For 4th graders the mean of exact matches was 2.27 matches out of ten stimuli.
Fig 5: Histogram of “forest”
Fig 6: Histogram of “coffee”
Fig. 6: Histogram of “computer”
Fig 7: Histogram of “piano”
While the 12th grade pool appeared to perform slightly better in this category of stimuli, we are not considering this difference in the mean of exact matches significant in this data set.
For the stimuli under the category of “words seen”, 12th graders and 4th graders performed very similarly. For 12th graders the mean of exact matches was 2.5 matches out of ten stimuli. For 4th graders the mean of exact matches was 2.9 out of ten stimuli. While the 4th grade pool appeared to perform slightly better in this category of stimuli, we are not considering this difference in the mean of exact matches significant in this data set. It is also worth noting that both the 12th grade pool and the 4th grade pool performed better overall during the “words seen” over the “words heard”, with the mean of exact matches being higher for each pool. For both 12th and 4th graders, the set of stimuli that contained “words seen” was the most stable set of stimuli.
After both trials were conducted with the 4th grade pool, a few interviews were conducted with the highest performing individuals, to look for any markers of synesthesia as well as to further understand how each color was matched with each stimulus.
Participant #1:
One individual, with the third highest consistency rate of the 4th grade participants (26.92%), said that she would decide how to match color with stimuli: “when I pictured the thing or word in my head, whatever color showed up” is what she would put. “Sometimes I picture words as colors” - but when asked if this individual’s name was a color, the individual responded with “I don’t know.” When asked if the individual could provide an example of a word as a color, the individual identified “apple” as being red, “a plant” as green, and “sky” as a sky blue. When asked about the stimulus “happy” the individual said they put “yellow, as it’s a happy color.” The individual identified the “words heard” as the easiest set to choose a color, and the “words seen” set as the hardest to choose a color. The individual also said that “not all of the colors that came to my mind were on the sheet,” noting that they had pictured medium red, but that the reds on the color guide were too dark.
Participant #2:
This individual had the highest consistency rate out of all of the 4th grade participants (45.83%). When asked how the individual chose the corresponding color for each stimuli, the individual said that they “pictured the physical object, then thought about what color it was, and then picked it.” For the stimulus “annoying”, the individual noted that they chose the color of the first thing that came to their mind that was “annoying” to them: in this case, it was the brown of their brother’s stuffed animal.The individual noted that for the “human scream”
stimulus, the individual chose black and red “which reminded me of darkness and blood - kind of like a horror movie, because those are the first two things that came to my mind.” For the third set of the procedure, the individual chose the color that corresponded best to the color of the musical instruments. The individual identified the “words seen” as the easiest set to choose a color and the “sounds heard” set as the hardest to choose a color The individual also identified objects as the easiest category to assign a color to.
The stimuli that were expected to be the most consistent were the stimuli for colors (blue for “words heard” and red for “words seen”). These stimuli were matched with the same colors pretty consistently: when “blue” was heard most individuals chose a color that was most strongly in the blue color family (as determined by Pantone), and when “red” was seen most individuals chose a color that was most strongly in the red color family (as determined by Pantone). It is also important to note that there were 4 colors displayed on the color guide that were considered within the red color family and 9 colors displayed that were considered within the blue color family. Of all of the color families displayed, the red color family and the blue color family had the first and second highest numbers of color selections within their family, and this may have impacted the results, as a higher variety of choices may have influenced the choice of the participants. These stimuli were used to determine if the other, less predictable results could be considered slightly more significant. All twelve participants of the 4th grade pool chose a color that fit into the red family, ranging from options 1-4. Fourteen out of fifteen participants in the 12th grade pool also chose a color that fit into the red family, ranging from options 1-4. Similar percentages of both the 4th grade pool and the 12th grade pool chose colors that fit into the red color family for the stimulus “red”.All twelve participants of the 4th grade pool chose a color that fit into the blue family, ranging from options 16-23. Fourteen out of fifteen participants in the 12th grade pool also chose a color that fit into the blue family, ranging from options 16-23. Similar percentages of both the 4th grade pool and the 12th grade pool chose colors that fit into the blue color family for the stimulus “blue”.There was slightly more variability for the colors chosen for the stimulus “blue” - this may have happened as there were 4 options in the red color family and 9 options in the blue color family
“forest” and “coffee” also had consistent results. For the stimulus “forest”: 8 out of 11 4th graders chose option 14, which was displayed as a dark green on the color guide. Out of the three remaining, two chose an option that was in the green color family 10 out of 11 12th graders also chose option 14. The one remaining chose an option that was in the green color family as well. It is important to note that there were 5 color choices within the green family– of the 5, only one is a darker green. For the stimulus “coffee”: 7 out of 9 4th graders chose option 32, which was displayed as a lighter brown on the color guide. Out of the two remaining participants, one chose option 2 and the other chose option 33. Neither of these options are considered within the brown color family. 7 out of 12 12th graders also chose option 32. Out of the five remaining participants, none chose options that were within the brown color family. It
is important to note that there were 2 color choices within the brown color family. One hypothesis for this result is that these are stimuli that are extremely easy to visualize and have presumed predetermined color associations if they are able to be pictured in one’s head, “coffee” would most likely be some type of brown and “forest” would most likely be some type of a darker green, perhaps. Even in an individual without synthesia, it is probable that previous associations would be created and perpetuated throughout development, whether it is in daily life, cartoons, picture books for children, and so on.
One stimulus that produced unexpectedly consistent results across both age groups was the stimulus “happy.” While this stimulus was not tied to a physical object or predetermined environmental color in the same way as “forest” or “coffee,” participants still showed a strong tendency toward the same color association. For both the 4th grade and 12th grade pools, the most commonly selected color was option 8, displayed on the color guide as a bright yellow 9 out of twelve 4th graders selected option 8, while 9 out of twelve 12th graders also selected option 8.
The consistency of the “happy” stimulus may also help explain why visually imaginable or emotionally symbolic stimuli generally produced stronger agreement across participants than abstract or unfamiliar stimuli. Participants appeared more confident when assigning colors to concepts that already possessed a strong mental image or emotional tone. This reinforces the broader pattern seen throughout the experiment: the easiest stimuli to associate with a color were stimuli that participants could clearly visualize or conceptually connect to prior experiences.
Unlike the highly consistent stimuli, the stimuli “computer” and “piano” produced very inconsistent results across both age groups. Histograms for both stimuli showed responses distributed across many different responses with no single option emerging as most consistent. Similarly, the stimulus “piano” also showed little consistency between participants.
The inconsistent results for “computer” and “piano” additionally support one of the broader conclusions of this experiment: stimuli without a strong predetermined color association produced the least agreement across participants. In cases where there was no universally reinforced symbolic or visual color attached to a concept, participants relied more heavily on personal experiences, memories, emotions, or imagination. These individualized interpretations likely contributed to the lower consistency rates observed overall in the experiment, especially in the “sounds heard” category.Overall, this experiment did not identify any participants who clearly demonstrated markers of grapheme-color synesthesia. This outcome was not unexpected, as synesthesia is relatively rare (4% of the population) and the participant pool for this experiment was small. However, while no definitive cases of synesthesia were discovered, the experiment still revealed several interesting trends regarding cross-sensory associations, consistency, and development across age groups.
The strongest pattern observed throughout the experiment was that stimuli with strong visual imagery or reinforced symbolic associations produced the highest consistency across participants. Stimuli such as “red,” “blue,” “forest,” “coffee,” and “happy” showed notably similar responses between individuals in both age groups. In contrast, more abstract or emotionally variable stimuli such as “computer” and “piano” produced highly inconsistent results. These findings suggest that individuals without synesthesia may learn these color associations through repeated environmental exposure, emotional symbolism, and learned visual patterns developed throughout childhood.
The experiment also demonstrated that the category of stimuli affected consistency rates. Both age groups performed most consistently during the “words seen” portion of the experiment, while the “sounds heard” stimuli produced the lowest consistency overall. This difference may reflect the stronger role that visualization plays in forming stable color associations. Auditory stimuli appeared to encourage more emotional or individualized interpretations, particularly among younger participants.
Although the original hypothesis predicted that younger participants would demonstrate stronger consistency due to the hyperconnectivity theory and the proposed role of synaptic pruning, the results did not strongly support this prediction. Instead, consistency rates between the two age groups were relatively similar overall, with older participants performing slightly better in the auditory stimuli category. Due to the small sample size, however, these differences cannot be considered statistically significant. Interestingly, the older age group performed slightly better than the younger group with the “sounds heard” set. This could be explained by noting that the younger participants had a harder time choosing a color for this set, and therefore the thought process is less accurate.
Several limitations affected the experiment. First, the participant pool was relatively small, reducing the likelihood of identifying true cases of synesthesia. Additionally, the shortened version of the TOG-R used only 26 stimuli and a 36-color guide, which may not have been detailed enough to capture more subtle associations. While intentionally vague instructions allowed for a broader range of responses, they may also have encouraged participants to rely on symbolic or conceptual reasoning rather than their own associations.
Future studies could improve upon this design in several ways. A larger participant pool across more age groups would allow for more reliable developmental comparisons and increase the likelihood of identifying synesthetic participants. A longer delay between testing sessions, more stimuli, and a more expansive color guide (using a distance matrix to quantify color groups) could also improve the accuracy of the assessment. In addition, future research could further investigate the distinction between true synesthetic experiences and culturally learned symbolic associations. It may also be valuable to include more interviews or qualitative responses from participants in order to better understand the reasoning behind specific color choices.
Conclusions & Looking Forward
While this experiment did not formally identify synesthesia, it demonstrated how deeply connected visualization, emotion, and sensory association can be in both children and adults. Even among non-synesthetic individuals, many stimuli appeared to evoke stable and meaningful color pairings. These findings reinforce the idea that cross-sensory associations may exist on a spectrum, ranging from common symbolic associations to the far more vivid and involuntary experiences characteristic of true synesthesia. Hopefully, further research will delve into the true causes of synesthesia and if this natural phenomenon can be utilized in any way.
References
1. “Color Synesthesia: Insight into Perception, Emotion, and Consciousness.” PubMed Central, U.S. National Library of Medicine, https://pmc.ncbi.nlm.nih.gov/ Accessed 12 May 2026.
2. Eagleman, David M., et al. “A Standardized Test Battery for the Study of Synesthesia.” Journal of Neuroscience Methods, vol. 159, no. 1, 2007, pp. 139–145. PubMed Central, https://pmc.ncbi.nlm.nih.gov/articles/PMC4118597/pdf/nihms599652.pdf Accessed 12 May 2026.
3. “How Do Different Types of Synesthesia Cluster Together? Implications for Causal Mechanisms.” PubMed Central, U.S. National Library of Medicine, https://pmc.ncbi.nlm.nih.gov/ Accessed 12 May 2026.
4. Meier, Beat, and Nicolas Rothen. “Grapheme-Color Synaesthesia Is Associated with a Distinct Cognitive Style.” Frontiers in Psychology, vol. 4, 2013, https://www frontiersin.org/journals/psychology/articles/10.3389/fpsyg.2014.01414/full Accessed 12 May 2026.
5. Mroczko-Wąsowicz, Aleksandra, and Julia Simner “Synesthesia and Music Perception.” Frontiers in Psychology, vol. 5, 2014, PubMed Central, https://pmc.ncbi.nlm.nih.gov/articles/PMC3643691/pdf/nihms-460245.pdf Accessed 12 May 2026.
6. Neufeld, Jessica, et al. “Enhanced Recognition Memory in Grapheme-Color Synaesthesia for Different Categories of Visual Stimuli.” Frontiers in Psychology, vol. 3, 2012.
7. “Neuroanatomy: The Basics.” Dana Foundation. Accessed 12 May 2026.
8. Rouw, Romke, and Steven M. Scholte. “Increased Structural Connectivity in Grapheme-Color Synesthesia.” Nature Neuroscience, vol. 10, no. 6, 2007, pp. 792–797.
9. Rothen, Nicolas, et al. “Diagnosing and Phenotyping Visual Synaesthesia: A Preliminary Evaluation of the Revised Test of Genuineness (TOG-R).” Cortex, vol. 49, no. 7, 2013, pp. 1841–1849. ScienceDirect Accessed 12 May 2026.
10. Rouw, Romke, et al. “A Whole-Genome Scan and Fine-Mapping Linkage Study of Auditory-Visual Synesthesia Reveals Evidence of Linkage to Chromosomes 2q24, 5q33, 6p12, and 12p12.” American Journal of Human Genetics, vol. 84, no. 2, 2009, pp. 279–285. PubMed Central, https://pmc.ncbi.nlm.nih.gov/articles/PMC3643691/pdf/nihms-460245.pdf Accessed 12 May 2026.
11. Ward, Jamie. The Frog Who Croaked Blue: Synesthesia and the Mixing of the Senses Routledge, 2008.
12. Ward, Jamie, et al. “Neurophenomenology of Natural and Induced Synesthesia.” Philosophical Transactions of the Royal Society B, vol. 375, no. 1788, 2020, https://royalsocietypublishing.org/doi/10.1098/rstb.2019.0030 Accessed 12 May 2026.
13. “Do We All Have Synaesthesia?” Horizon Magazine Accessed 12 May 2026.
Public Knowledge and Ethical Perspectives on CRISPR:
The Role of Education in Shaping Attitudes Towards Gene Editing
Maayan M. and Evie T.
Mentor: Nicholas H.
Abstract
The topic of CRISPR (Clustered Regularly Interspaced Short Palindromic Repeats) and gene editing that allows for the modification of DNA strands is one that is both incredibly revolutionary but equally controversial. Should this new technology be allowed? How far will it go? We aimed to grasp the public’s perspectives and level of knowledge regarding this subject. Here we outline a survey-based analysis with the goal of bettering high school students' overall somatic awareness through understanding genetics, gene editing and CRISPR Data collection consisted of two targeted surveys: one designed for people of all ages and scientific backgrounds and a second for ninth graders with little to no prior gene editing knowledge or experience. We had 169 participants for the all-age survey and 55 participants for the ninth grade survey The results from both surveys were analyzed, organized, and used to create a project-based curriculum that aims to build and bolster understanding of the process of gene editing and the use of CRISPR in practical application. Our data suggests that with more knowledge about CRISPR and gene editing, respondents were more likely to be open to this technology being used medicinally and agriculturally We hope that the implementation of our curriculum can influence future understanding and acceptance of gene editing as the technology evolves and becomes more present.
Introduction
This project began with a debate we had with our group of friends early this year. The question was whether or not the editing of an embryo should be legal, and further who should make that decision. The points and perspectives that came up were interesting and varied, but one thing was clear: every person that was debating the question was doing so poignantly. Why? Because they were all educated from parts of a science class curriculum about how the actual mechanism of gene editing works and did not feel that the process was so obscure that they had no choice but to fall victim to the misinformation that clouds and mystifies so much of medical practices today. However, the majority of Americans know very little about CRISPR as it is still an emerging technology. In the current political climate it is so hard to form rational, objective, and knowledge-based opinions about health without biases. Since learning about these scientific breakthroughs is challenging, especially after having graduated from school, we also as a society are more susceptible to misinformation. This realization led to our desire to provide people with sufficient information to make educated opinions and ethical perspectives, especially as this is the generation who will live with CRISPR as a prominent part of the medical future. If we at Saint Ann’s, an institution that prides itself on being forward thinking and
adaptive to the world around us, can develop a curriculum to enhance students’ understanding of CRISPR including the most important and relevant aspects of the technology, we can hopefully share it with other science classes and have it implemented by science teachers at other schools. We hope this would create a better overall understanding of gene-editing and CRISPR, but also help bolster people's health literacy and somatic awareness.
Materials and Methods
Our project was divided into three sections. First, to grasp an understanding of American perspectives of CRISPR, this project began with weeks of preliminary research. We first aimed to make sure that our understanding of CRISPR and gene editing was comprehensive enough to form our own personal opinions about the use of CRISPR that were backed by true information. We then started reading and taking notes on other research papers that had been written about past explorations of CRISPR and its curative applications. Most of the writing we read suggested support for our hypothesis that the less a population knows about a technology the less willing they are to support its development and application. After reading about the very scattered perspectives of CRISPR, we began to wonder how someone’s identity affected their opinions on this technology. To investigate this, we sent out a survey to the high school students of Saint Ann’s high school as well as adults unaffiliated with the school. Questions first began with demographics, asking about age, scientific background, prior education, and any parts of identity that might affect their view towards gene editing such as religion. Then, we asked a series of Agree-Disagree questions. The choices for these questions ranged from “Strongly Disagree” all the way to “Strongly Disagree” with three other options in between. These questions aimed to grasp not only people’s perspectives on the subject, but also what their perception of other Americans’ opinions on the technology were. For example, we asked for responders to agree or disagree with the statement “The majority of adults in the United States know about gene editing and CRISPR”. The sequence of questions was deliberately crafted to eliminate the possibility of guiding participants towards a certain answer. We were cautious of the possibility that if we had reversed the order of these statements, participants might have thought about their high school experience which could have then affected their overall perspective on the majority of adults in the United States. Additionally, in this section, we also always asked questions about what participants thought of national perspectives before asking a personal reflective question. Again, this was to limit the possibility of people thinking about their own perspectives and having those influence their answer for broader questions about the national population. We also created different “pathways” of questions for people with varying degrees of familiarity with CRISPR to understand how people who responded “I am fairly familiar with the technology and have a clear understanding” gained that knowledge. The final portion of this survey included questions regarding a scenario about a young boy who was cured of sickle cell anemia using CRISPR These questions asked more specifically about circumstantial use of the technology with a real world context to simulate the decision making that happens in the medical field.
To further gauge what younger students at Saint Ann’s were thinking when they heard about the technology of CRISPR we created a second more tailored survey which was given to
all 9th grade biology students. The survey included questions about familiarity with the technology, followed by a variety of ethical considerations. We wanted to gain a sense of where students stood regarding their ethical perspectives before they had ever learned anything about the technology in a classroom setting. The form was anonymous and optional in order to ensure that respondents felt that they were safe in expressing their opinions and ensure that they were filling out the survey on account of their own volition and not being prompted by the nature of our project. The 9th grade survey differed from the original, in that the last question was not multiple choice, but instead allowed for a short written portion for students to indicate what aspects they wanted to explore more. This question was a lot less guided and intended to inform the development of a curriculum, the third and culminating aspect of our project. Using the survey results as a starting point, we created a project-based mini-mester curriculum. This involved reading and studying other people's examples of biology focused curriculums while also being innovative and taking what we knew from our personal experiences as students to help us decide what aspects were vital to a comprehensive curriculum. We divided the curriculum into four separate categories, called buckets, that acted as different units progressing from molecular mechanism to the future of CRISPR felt fluid.
Results and Discussion
Our results across all three parts of our experimental portion not only proved our hypothesis correct, but all aligned with each other. Specifically, in our Agree-Disagree spectrum questions, where participants aligned their perspectives on various statements with options varying from “Strongly Disagree” to “Strongly Agree”, we were deliberate in the order we placed the questions. For example, we asked their opinion on the statement “The majority of adults in the United States know about gene editing and CRISPR” before associating general knowledge of these topics with high school education using the next statement, “Most high schools in the United States teach about genetic editing in their science curriculum.”If people that are more comfortable with CRISPR especially in fatal medical contexts also indicate that they are well educated about the subject, we thought that targeting the increase of that education would be the most effective way of changing the perspective people have of CRISPR from fear to hope. When 9th grade students were asked: How comfortable do you feel hearing that scientists can edit DNA, 4 out of 15 students that indicated they knew “just the name” of CRISPR or “nothing at all” replied that they were less than “comfortable” with the use of CRISPR and gene editing. Of the 9 students that replied that they knew “a lot” about CRISPR, 8 of them replied that they were either “very comfortable” or “somewhat comfortable” with hearing that scientists can edit DNA. The majority of the 55 ninth-graders indicated that they had heard “a little” about CRISPR or gene editing. Of these 31 students who responded that they had heard “a little”, 12 indicated that they were “uncomfortable” with the use of CRISPR and gene editing, only 4 indicated that they were “very comfortable” and 15 indicated that they were “somewhat comfortable”. This indicates that the people who considered themselves comfortable with the technology were the same people that indicated they believed they were most familiar with it and vice versa. The only student that indicated they believe no use of CRISPR or gene editing is acceptable also indicated that they know “just the name” of CRISPR and is “very
uncomfortable” with its use. The eight students that indicated being “very comfortable” with the use of CRISPR unanimously agreed that they believed “treating serious diseases” is the most acceptable use of the technology. In response to the question “How interested are you in learning more about gene editing and CRISPR?”, 18 students replied that they are “very interested” in learning more about CRISPR. Out of these students, 7 knew “a lot” about the technology, 8 knew “a little”, 2 knew “just the name”, and only 1 student knew “nothing at all”. This showed that students that were more informed or believed that they knew more about CRISPR were more motivated to learn more about the technology. 32 students indicated that they are “a little interested” in learning more about CRISPR. Out of these students, 21 students already knew “a little” about the technology. 8 students that responded they were “a little interested” in learning more knew “just the name” of CRISPR, while 1 student knew “a lot” and 1 student knew “nothing at all”. The majority of students overall know “a little” bit about CRISPR and the majority of overall students want to know more about CRISPR. 3 out of 5 students that indicated they were either “not interested” or “very uninterested” in learning more about the technology also replied that they knew either “just the name” of CRISPR or “nothing at all” regarding the subject. The more that these students know, the more likely they are to want to know more. Ultimately is what this data proved.
In our ninth-grade survey, which asked for a written along with multiple choice questions, responses varied, ranging from medical applications to health equity. This question allowed us to see what aspects of gene editing and CRISPR interested, concerned, or stood out most to these students, none of whom had ever learned about gene editing or CRISPR as a focused topic or part of a science curriculum in school. The most prevalent response we received to this question was “how it works”. 24 students, approximately 44% total of students, all responded that the part of gene editing and CRISPR they want to know more about is actually about the process and the science. Even though this question was our least specific question, there was a common consensus that even the foundation of CRISPR, the science behind it, is so obscure and unknown to most students. Though “how it works” was our most prominent response, a few other themes were recurring. Many students want to explore the medical ethics of gene editing, a topic that makes lots of headlines regarding CRISPR. Additionally, students were interested in what gene editing can do, such as what diseases it can cure or disorders it can prevent. There were also some one off questions, asking about hypotheticals for non-disease specific related things like cloning or mixed species. The specificity, abundance, and variety in responses indicates an enthusiasm towards learning more about this subject when prompted. This expression of interest in the subject really fueled our approach to the curriculum we were developing.
We ultimately broke our curriculum down into 4 sections, which as previously mentioned we titled buckets. The first bucket examined the Molecular Mechanism, using targeted activities to help students understand how the mechanism of gRNA was finding the mutation within the DNA.Additionally, there were lecture guides to explain how the technology initially was found in bacteria's innate immune system and was then appropriated in order to edit the human genome. This bucket is designed to show students both how small scale and specific the technology is while at the same time emphasizing the ecology of CRISPR and how genes and genetics are closely related to their environments and further the importance of studying those relationships.
The second bucket focused on the Clinical Reality of CRISPR, it contained a case study, as well as a series of testimonials from sickle cell patients that were cured of the disease using CRISPR-Cas9 gene editing technology. We also recommended that teachers show their students the part of the 4 part docuseries that Ken Burns created called The Gene: An Intimate History, focusing on when the FDA first approved the use of CRISPR for practical application. This can bolster students’ understanding of the process that determines whether or not CRISPR is deemed safe, and who specifically is getting a seat at that table. Additionally, this can help students understand the business side of medicine, which, while at times associated with corruption and dishonesty, is crucial to understanding the full picture when talking about introducing a new technology into the world of medicine.
The third bucket was prompted by a surprising and thoughtful response from the 9th grade survey: how do ethics, equity, and bias fit into the equation of CRISPR. We wanted to be careful in approaching this topic because it was the one topic that we felt we could approach with a completely objective, science forward lens. While ultimately students will have different perspectives,we want them to form their opinions based on a well rounded comprehensive understanding of the technology, as is the goal with this whole project. To achieve this, we students first read an op-ed piece on the subject of treatment plan and patient autonomy when it comes to treatment plans, written by journalist and expert Erica Check Hayden. Then teachers asked students to reflect on the article and write a short written response about their feelings on the article. The goal is to enforce deep critical thinking, furthering students' understanding of aspects of CRISPR. The next portion of this bucket was a debate style project to help students understand the importance of listening to and understanding all perspectives, even if one does not agree. In this debate students were assigned different roles (ex. Head of the WHO, Biostatistician working with a lab, etc.) and then they were tasked with debating whether or not a sum of money should be allocated to the use of CRISPR for an extreme case. Some students may find this a difficult activity, especially when tasked with arguing in favor of an idea they don't necessarily agree with. Defending an idea and advocating for it is a difficult thing to do, but an important part of gaining a full understanding of your opinions on a topic.
The final bucket aims to make sure that students realize both the currency of this topic as well as its future prominence as the technology grows. In teaching about the future of CRISPR, students can feel that if they want to be future agents of change in this field they can be. We advised teachers in this portion of the curriculum to look over the syllabus and review a curriculum from the NYU-Grossman School of MedicineThis focuses on the bioethics of sex selection, genetic analysis, and designer babies. The aim was to show students that there is a future in this line of work and field of study. It also shows that medical students aren’t just focused on the hard science of medicine but also are taking into consideration other more socially oriented aspects of medicine and delivery treatment to patients. This consisted of a post mini-mester quiz that would measure their understanding of the material, and a project in which students choose an “extreme” application of CRISPR and write a recommendation to a fake “Global Bioethics Commission". This project closes off the curriculum by forcing students to step and defend their opinions that have now been informed by science and real objective information, rather than by untrustworthy sources and propaganda that feeds into fear-mongering around CRISPR.
The final part of our project involved teaching the curriculum we had created to a 9th grade biology class. While presenting the curriculum, students were not only engaged, but actively involved in expanding their knowledge and experience with CRISPR. We distributed a worksheet in which students mimicked the process of CRISPR on a gene, and every student, after our short explanation, was able to correctly complete the activity. This is promising because when asked whether anyone knew the basics of CRISPR’s mechanism, not one student indicated they did. Furthermore, students were encouraged to ask questions at any point of confusion during our slideshow, and they did not hesitate to ask for clarification or expansion upon anything they didn’t fully understand. Our goal was to give students a broad but sturdy understanding of the basics of CRISPR, and students left the classroom feeling confident that they left with a much clearer understanding and grasp of many aspects of the technology compared to when they arrived. Additionally, after our presentation, the teacher of the biology class we presented to also was eager to ask questions, indicating that because this was a relatively new technology, she was in fact less familiar with it than she would like, especially as it relates to a lot of the topics she covers in her class. This shows that both teachers and students have the desire and capacity to include this revolutionary technology in their science curriculum. Students continued to connect with the curriculum over the next week as they completed a writing assignment. Teachers reached out to borrow and implement the curriculum in their own classrooms. This was nothing short of our final goal.
We wanted to create something that could and would be shared nationwide, so many science classes in our school adding it in to their own curriculum was a splendid start, and it gave us hope that there is a want and need for this education especially as our generation is going to be the first one which will have to deal with possible complications with CRISPR as the technology develops. Our eventual hope was to have some measurable impact within our community, which could potentially be spread further, and through this project, we feel that goal to be achieved. We didn't just want the data that we collected to service us and the hypothesis that we came up with at the beginning of our project but we wanted to make sure that our project was also servicing our smaller community of the school, but the education system in general. Ultimately, our goal with this project was to improve the greater understanding of the technology of CRISPR and gene editing, what that entails, and subsequently increase somatic awareness and change misinformed biased opinions. Through both our surveys, results indicated that education about the technology plays a large role in shaping attitudes, opinions, and ethical perspectives about it.
References
1 Lutz, E (2022, June 27) CRISPR in the Classroom The New York Times https://www nytimes com/interactive/2022/06/27/science/crispr-anniversary-classroom-explainer html
2. Sciupac, C. F., Brian Kennedy and Elizabeth Podrebarac. (2016, July 26). U.S. public opinion on the future use of gene editing Pew Research Center https://www pewresearch org/internet/2016/07/26/u-s-public-opinion-on-the-future-use-of-gene-editing
3. R. Everman, E. (2024, December 24). CRISPR-Cas9 and Sickle Cell Anemia. NATIONAL CENTER for CASE STUDY TEACHING in SCIENCE. https://static.nsta.org/case study docs/case studies/crispr sickle cell.pdf
4 The Gene | Home (n d ) The Gene https://www pbs org/kenburns/the-gene/
5 Montero, M , and Taylor, E (2026, January 23) CRISPR QUESTIONNAIRE Google Docs https://docs.google.com/forms/d/11vZ0qam5lnhhLFBAyaUIMuTlpK-nkM-ethxzgfPl2eE/edit
6 Montero, M , & Taylor, E (2026, February 22) 9th Grade ISR Survey Google Docs https://docs google com/document/d/1Lztpnx-MQXnF1uxSvCRs5ewzOu3B8y5gsfsfzQp5NvI/edit?tab=t 0
Sweet Dreams: An
Assessment of Diet-Induced Cognitive Decline in D. Melanogaster
Hope C. and Daniella S.
Mentor: Jake S.
Abstract
One in nine Americans over the age of 65 have Alzheimer’s disease, and recent studies from the Alzheimer’s Association indicate that this number is only growing.1 Despite this, we still have not found an effective method of Alzheimer’s reversal further than symptom management. Additionally, recent research continues to indicate correlations between Alzheimer’s disease and diabetes (T2DM). Through our experiment, we aimed to simulate the conditions of diabetes through a high glucose diet and then test the cognition of D Melanogaster in order to assess a potential link between a high sugar diet and cognitive decline. To do this, we divided the flies into two groups: one fed on a 20% high-sugar diet, and the other, an unmodified feed. To test cognition, we utilized two of the testing methods we found predominantly in our literature review: Y-mazes and RING assays. Through months of data collection and testing, we learned valuable lessons in fly culturing and maintenance. Ultimately our data show a potential link between high sugar diet and cognitive decline in D. Melanogaster While limitations in sample size and testing time prevent a definitive conclusion, our study provides valuable preliminary information of diet induced cognitive decline in our model.
Introduction
In the past 30 years, researchers have established a link between type 2 Diabetes and Alzheimer’s. Type two Diabetes is the chronic metabolic condition affecting the way an individual processes insulin and Alzheimer's is the most common form of Dementia, a category of progressive brain disease which causes the patient to lose memory and thinking skills.2 However, the reason for this correlation is still in debate. Recent studies have indicated that the insulin resistance that occurs in diabetic patients inhibits memory, learning, and neuronal survival.3 This is because the brain requires insulin signaling to regulate synaptic plasticity, support neuronal growth, and facilitate glucose uptake in neurons.4,5 When insulin resistance develops, these processes are disrupted, leading to impaired cognitive function and increased vulnerability to neurodegeneration. Furthermore, reduced insulin signaling has been shown to promote the accumulation of amyloid-beta plaques and tau tangles the two pathological hallmarks of Alzheimer's disease suggesting that the metabolic dysfunction seen
in diabetes may directly accelerate the neurodegenerative cascade underlying Alzheimer's pathology 6,7,8,9
Instead of genetically modifying Drosophila melanogaster to carry Alzheimer’s and Diabetes, as this was not in the constraints of our budget, we aimed to model the effect of these conditions, taking the correlation between T2DM and Alzheimer’s as inspiration.10,11,12 Our goal was to induce cognitive decline through a high sugar diet. To do this, we divided the flies into two groups: one fed on a 20% high-sugar diet, and the other, an unmodified feed. To test cognition, we used two testing methods: the Y-maze and Rapid Iterative Negative Geotaxis (RING) assay
Materials and Methods
We used genetically modified wingless D melanogaster for behavioral testing, as it was optimal for experimental efficiency. A central undertaking in our study was the development of a fly feed in which we could isolate the variable of sugar. The D. melanogaster were fed on a standard cornmeal feed, using a recipe from Indiana University Bloomington. We constructed and altered the recipe through months of trial and error After encountering issues with excessive mold growth, we found the addition of cinnamon and vinegar helpful methods for mold prevention. We further experimented with methods of pre-cooking the feed, increasing the water content, and changing the ratios of ingredients. To achieve a 20% increase in glucose content, we altered the fly food with Domino’s granulated sugar. This modification was informed by a study we encountered in our literature review that assessed a high sugar diet’s effect on feeding behavior. To determine the most effective preparation method, we tested different incorporation times and mixing approaches to ensure homogeneity in the feed. In order to assess the cognition of the D. melanogaster, we utilized two of the testing methods we found most predominantly in our literature review: a Y-maze and RING assay.
In the Y-maze, both sets of flies were presented with two chambers--one empty and one with a piece of banana.13 If the flies chose the banana, this was an indicator of their positive cognitive function. Our experimental design initially faced several challenges. To construct the Y-maze, we evaluated whether to 3D-print a design or purchase a pre-made apparatus. Through iterative testing, we ultimately determined that building the maze using test tubes, pipette tips, and foam provided the most practical and effective solution. Early designs also resulted in asphyxiation within the maze due to insufficient airflow. Specifically, our initial use of holed stoppers instead of breathable foam limited oxygen availability for the Drosophila melanogaster Replacing stoppers with foam resolved this issue by improving ventilation. In addition, early experiments showed a lack of behavioral motivation in the flies during assays. This was attributed to the absence of a starvation period prior to testing. After optimizing the protocol to include a 16-hour starvation period before the assay, fly responsiveness and
engagement in the task improved significantly. In the reward chamber, we evaluated multiple attractants. Standard fly feed did not elicit a strong behavioral response, likely due to lack of a strong olfactory output. Vanilla extract initially increased attraction but resulted in increased mortality due to ethanol content. Ultimately, banana was selected as the optimal reward due to its strong attractiveness and non-toxic properties. Data was collected at the six hour and twenty-four hour marks. 14
The next assay we utilized was Rapid Iterative Negative Geotaxis (RING) assay.14 In essence, this test measures the locomotor performance of D. melanogaster. The instinct to crawl up the sides of a test tube after being stunned by falling to the bottom of the glass is innate within D. melanogaster. The thought behind this test is that if an innate ability is impaired, this could indicate degrading cognition. The RING assay takes advantage of this by using a control group to establish a baseline performance which we can then compare to the performance of the flies fed on high sugar in order to gain insight into the instinctual changes between the two groups. This test had two sets of two upright test tubes (one set with sugar-fed flies and the other, the control group). After briefly dropping the test tubes to stun the flies and shake them towards the bottom, we measured their cognition by measuring how fast they climbed up the sides of the test tubes. By applying a downward force to the test tubes and tracking the time it took the flies to rise, we measured locomotor performance by tracking the percentage of flies that reached various heights at two time benchmarkers.
Results
In order to assess the success of our Y-maze, we measured the percentage of surviving flies who crawled to the positive banana chamber This was calculated by subtracting the number of flies which died in the starvation chamber from the total number of included flies as the base and the successful flies as the numerator. (Fig 1a. & 1b.)
To evaluate the RING testing, we filmed each trial against a background with height markings. By inspecting the percentage of flies that reached 1-2 cm and rose above 4 cm at both 5 seconds and 15 seconds we were able to inspect the general locomotive performance trends in the D. Melanogaster. (Fig 2a. & 2b.)
Discussion
In the Y-maze, Through our data collection we found a slight correlation between the test flies and a more random distribution between the positive and negative chambers. Of eleven trials, the control group out performed the test group eight times. We took this to indicate a weakening in cognition in the test group. Despite the slight correlation we found, our results are not great enough to prove definitively a causal relationship between the variable and our outcome. (Fig 1a. & 1b.)
In totality, the data of our RING testing was not conclusive, as there was no general skew in performance towards the control or variable. We posited that this uncertainty occurred because we did not have access to the program “Free Climber” which assesses and interprets the video more accurately 15,16 (Fig 2a. & 2b.)
Despite the RING’s equivocal results, our data from the Y-mazes ultimately show a slight correlation between a high-sugar diet and cognitive decline– with 8 out of 11 trials supporting this conclusion. However, the reason for the cognitive decline in Drosophila differs from that of the insulin resistance-neurodegeneration in humans. The possible bases for Drosophila cognitive impairment include oxidation, inflammation, an impaired mushroom body, and glial cell insulin resistance.17
The metabolic and genetic profile of D. Melanogaster greatly resembles that of the human, making them optimal for testing. Much like in humans, a chronic high sugar diet drives inflammation in the body. Chronic inflammation will then disrupt normal neuronal communication and contribute to synaptic degradation over time.
High sugar metabolism also generates excess reactive oxygen species (ROS), which drive oxidation throughout the body Neurons are particularly vulnerable to oxidative damage because they have high energy demands and relatively weak antioxidant defenses. In fruit flies, this oxidative stress accelerates neuronal aging and death.18
The mushroom bodies are the primary brain structures in fruit flies responsible for learning and memory and are also highly sensitive to metabolic disruption. High sugar diets have been shown to damage mushroom body neurons and reduce the strength of synaptic connections within them, directly degrading the fly's ability to form and recall memories.19
High sugar consumption also causes the glial cells in the brain to develop insulin resistance (similarly to how high sugar consumption leads to insulin resistance in humans).20 Insulin resistance will then lead to reduced levels of the Draper protein. Draper is essential for glial cells to identify and remove damaged or dead neurons from the brain. Without adequate Draper, excess waste accumulates in the brain, causing neurodegeneration.21
Other analogous studies have examined the correlations between a high sugar diet and cognitive decline in Drosophila. Our study aimed in large part to model the efforts and methods of these previous studies. While many experiments attempt to isolate specific aspects of neurodegeneration, we intended to synthesize the research already done. By measuring cognitive decline in a more general sense (decision making and impaired innate abilities) we were able to build upon studies already performed. We reinforced the conclusions already proven in other studies, supporting the general data that there does indeed exist a link between high sugar intake and neurodegradation.
Were we to replicate this study or this topic of study in the future, in order to reach more conclusive results, we would change a few things. Primarily, we would hope to be able to run many more trials in order to expand the swath of our data in both the Y-maze and RING. Despite not finding conclusive results with our RING testing, we still find it a promising measure of cognition in D. Melanogaster, and we think that the process and accuracy of our results could be bolstered by the implementation of “Free Climber.” In addition to trial density, being able to repeat this study with increased fly cultures, both for the existing two groups and also to test different levels of additional sugar in different fly cultures.
References
1. New Alzheimer’s Association Report: Americans Care Deeply About Brain Health but Most Don’t Know How to Maintain It (2026)
2 Akinola, O B Sweet old memories: a review of the experimental models of the association between diabetes, senility and dementia Metab Brain Dis 31, 1003–1010 (2016)
3 Zhao, W Q & Townsend, M Insulin resistance and amyloidogenesis as common molecular foundation for type 2 diabetes and Alzheimer's disease. BBA Mol. Basis o. Dis. 1792, 482-496 (2009).
4. Stanciu, G.D. et al. Link between Diabetes and Alzheimer’s Disease Due to the Shared Amyloid Aggregation and Deposition Involving Both Neurodegenerative Changes and Neurovascular Damages. J. Clin. Med., 9, 1713 (2020)
5 Alrouji, M et al The potential role of human islet amyloid polypeptide in type 2 diabetes mellitus and Alzheimer’s diseases Diabetol Metab Syndr 15, 101 (2023)
6. Nguyen, T.T. et al. Type 3 Diabetes and Its Role Implications in Alzheimer’s Disease. Int. J. Mol. Sci. 21, 3165 (2020)
7. Tian, Y., Jing, G. & Zhang, M. Insulin-degrading enzyme: Roles and pathways in ameliorating cognitive impairment associated with Alzheimer's disease and diabetes Ageing Res Rev 90, (2023)
8 Arendonk, J et al Diabetes and hypertension are related to amyloid-beta burden in the population-based Rotterdam Study, Brain, 146, 337–348 (2023)
9 Cheignon, C Oxidative stress and the amyloid beta peptide in Alzheimer’s disease Redox Bio 14, 450-464 (2018).
10. Loreto, J.S. et al. Screening for Differentially Expressed Memory Genes on a Diabetes Model Induced by High-Sugar Diet in Drosophila melanogaster: Potential Markers for Memory Deficits Mol Neurobiol 61, 1225–1236 (2024)
11 Arthur, S Short and sweet: the life of thirsty flies on sugar-rich diets MRC Laboratory of Med Sci (2020) https://lms mrc ac uk/short-and-sweet-the-life-of-thirsty-flies-on-sugar-rich-diets/
12. May, C. et al. High Dietary Sugar Reshapes Sweet Taste to Promote Feeding Behavior in Drosophila melanogaster. Cell Reports. 27, 1675-1685 (2019).
13 Yu, C C et al Assessing the cognitive status of Drosophila by the value-based feeding decision npj Aging Mech Dis 7, 24 (2021)
14 Gargano, J W et al Rapid iterative negative geotaxis (RING): a new method for assessing age-related locomotor decline in Drosophila Exp Gerontology 40, 386-395 (2005)
15. Cao, W. et al. An Automated Rapid Iterative Negative Geotaxis Assay for Analyzing Adult Climbing Behavior in a Drosophila Model of Neurodegeneration. J. Vis. Exp. 127, (2017).
16 Spierer, A N et al FreeClimber: automated quantification of climbing performance in Drosophila J Exp Biol 224, (2021)
17 Yu, S , Zhang, G & Jin, L H , A high-sugar diet affects cellular and humoral immune responses in Drosophila Exp Cell Res 368, 215-224 (2018)
18. Strilbytska, O. et al. Dietary Sucrose Determines Stress Resistance, Oxidative Damages, and Antioxidant Defense System in Drosophila. Scientifica. (202
19 Plaçais, PY et al Upregulated energy metabolism in the Drosophila mushroom body is the trigger for long-term memory Nat Commun 8, 15510 (2017)
20 Kim, T , Song, B & Lee, I S Drosophila Glia: Models for Human Neurodevelopmental and Neurodegenerative Disorders Int J Mol Sci 21, (2020)
21. Alassaf, M., Rajan, A. Diet-induced glial insulin resistance impairs the clearance of neuronal debris in Drosophila brain. PLOS (2023).
Testing Alternative Leaching Solutions for Hydrometallurgy
Dublin L. and Conor M.
Mentor: Liz V.
Abstract
Due to the current and progressive degradation of our environment, we sought to find a cleaner alternative to the current acidic solutions used in the heavy metal recycling industry. We tested an organic acid solution containing citric acid, acetic acid and hydrogen peroxide at various concentrations against the industry standard of sulfuric acid in a multitude of tests. We first compared the efficacy of the two solutions at dissolving pure copper powder and copper shot, then moved on to testing with small printed circuit boards (PCBs) and later full-sized proper PCBs. After allowing the copper to sit in each solution for the proper duration, we tested the amount of dissolved copper through both photospectrometry and through using electrolysis with graphite electrodes and a battery to remove the copper from solution. Throughout the beginning of our research we consistently saw that the organic acid solution achieved a higher absorption reading in the photospectrometer, meaning that there was more copper in the organic acid solution. However, we later questioned those results after hypothesizing that the blue color in the organic acid solution could be a result of non-copper solutes, skewing our results. Lastly, we tested the overall efficacy of our organic acid solution on an entire PCB taken from a treadmill. In this test, we were able to remove large amounts of copper from the PCB. Although these results do look promising, and the organic acid solution was able to effectively leach copper from a properly treated PCB, more research and refining of the solution is necessary before we can convince industrial plants to change their ways.
Introduction
In the present day, our landfills are overflowing with waste, much of which is electronic waste that contains valuable metals. This can be toxic to the environment if left in landfills.1 However, even when these electronics are properly recycled, industrial plants use sulfuric acid to extract the metals. This acid is not just toxic but hazardous, while the alternatives that we tested, citric and acetic acids, are biodegradable and non-toxic. Citric and acetic acids are weak acids, which are acids that have a Ka value of less than one. Ka measures how much an acid dissociates into ions, so a substance with a Ka of less than one does not dissociate into a proton and a conjugate base as much as a substance with a Ka of more than one does. This makes weak acids, such as citric and acetic acids, much safer and less reactive than strong acids such as sulfuric acid. Sulfuric acid waste, when not handled properly, can contaminate waterways and local ecosystems. This can ultimately lead to chronic aquatic toxicity and soil acidification, which often induce large-scale die-offs of marine life and decreased agricultural productivity. Additionally, the process by which sulfuric acid is created both supports the natural gas and oil industry (as recycling companies buy sulfur straight from gas companies) and releases sulfur dioxide, a major pollutant and the main contributor in acid rain.2 However, this is far better than the alternative of not recycling. The heavy metal mining business faces rampant corruption, is extremely harmful to the incredible biological diversity of central Africa where much of the
mining takes place, and, worst of all, many of the companies engage in what has been termed “modern day slavery.” Workers work in incredibly unsafe conditions, are forced to work by armed guards, and are paid wages they can hardly live off themselves, let alone support a family with. In fact, a 2017 article estimates that 2/5ths of cobalt miners in the Democratic Republic of the Congo, which, at the time, was producing over half of the world’s cobalt, were children.3 We hope that if we can make electronic recycling more environmentally friendly, we can help combat both the waste and injustice that is so pervasive in this industry today.
Methods
Test 1: Our leaching solution consisted of a combination of 25mL of 2.5 molar citric acid, 25mL of 5% acetic acid and 50mL of H2O2. We first started by testing to see if our leaching solutions would work or not by using pure copper. We used 1g each of copper shot (pellets of copper) and powdered copper, and tested both in our solutions of organic acid and sulfuric acid. After a week the four solutions ended up at an array of colors and copper concentrations. The powdered copper in our organic acid solution was green, and the shot copper in our organic acid solution was blue. We then ran each of the solutions through the spectrophotometer at 650nm—the suggested for coppery blue—and took absorbance readings. We then dried out the remaining copper shot and powder from the bottom of those beakers and subtracted this weight from the original weight to create a correlation between the amount of copper in the solution and the absorbance readings.
Test 2: We next obtained a printed circuit board and repeated a similar process. We once again waited a week and then utilized the spectrophotometer at 650 nm.
Test 3: We repeated test one but added in our sulfuric acid control to obtain a reliable comparison.
Test 4: We put two strips of copper of equal weight and surface area into 100mL of each solution and weighed them both before and after the test to see which solution had been more effective as a leachate.
Test 5: Lastly, we decided to see if our solution would work at all in leaching copper from a larger PCB that used to be part of a treadmill. We removed the outer protective coating by soaking the board in NaOH, then added the entirety of the board (broken into four pieces) into a beaker with our organic solution and let it sit for one week. After the solution had finished leaching, we added eight graphite electrodes connected to nine-volt batteries to extract copper from the solution.
Results
TEST 1:
Mass Cu (subtracted paper)
g Mass Cu (subtracted from 1g)
g
g Molar mass Cu (g/mol)
(used for both)
Abs @ 650 nm digital
Figure blue coloration, blue hue.
TEST 4:
Observed color Sky blue Darker greenish
Discussion
For Test 1, the solutions with the powdered copper were darker than the solutions with the copper shot. Since we hypothesized before the test that the darker solutions would have higher absorbances at the wavelength of copper, and thus, higher molarities of copper, we believed that the powdered copper solutions had a higher concentration. This was proven correct when we ran the solutions through a spectrophotometer, and found that the powdered copper solutions had a higher absorbance than the copper shot solutions at 650 nm. This was expected, due to the copper powder having more surface area per unit mass than the copper shot.
However, something unexpected that we discovered was that the organic acid solutions were darker than the sulfuric acid solutions. This was a surprising finding, as we had assumed that the sulfuric acid would leach more effectively than the organic acid. However, for this test, it seemed that the inverse was true. To confirm this, we ran the solutions through a spectrophotometer, and our findings confirmed that the organic acid solutions absorbed more light at 650 nm than the sulfuric acid solutions, meaning that, if nothing else had influenced our experiment, the organic acid solutions had a higher concentration of copper than the sulfuric acid solutions did.
For Test 2, we found very similar results. The solution with the ground-up PCB boards had a much higher concentration of copper than the solution with the PCB board chunks because the ground-up boards had more surface area than the board chunks. In addition, once again, the organic acid solution had a higher concentration of copper than the sulfuric acid solution according to the spectrophotometer
For Test 3, we once again found that, according to the spectrophotometer, our organic acid solution was more effectively leaching copper than the sulfuric acid solution. However, during this process, we noticed that although the organic acid solution was a darker blue, which we assumed meant there was more dissolved copper in that solution, there seemed to be more undissolved copper in the base of the organic acid beakers than the sulfuric acid ones. This thus pointed to the possibility that perhaps the color or the absorbance of the solution did not necessarily correlate with the amount of copper dissolved in each solution. Our final hypothesis for the spectrophotometer consistently favoring our organic acid solution was that non-copper solutes had skewed the readings, but this was never explicitly confirmed.
For Test 4, we found that after one week, the copper strip in the sulfuric acid solution weighed far less than the strip in the organic acid solution. This meant that the sulfuric acid
solution had been far more effective at leaching copper than the organic acid solution. This directly opposed our previous findings with the spectrophotometer in Tests 1, 2, and 3.
For our final test, we found that after a week of leaching a PCB board with our organic acid solution, there was ample copper collected on the bottom of our container. Electrolyzing with a battery hooked up to two graphite electrodes, we got a light brown metallic substance to deposit onto the surface of the graphite. This confirmed that our solution was successful in removing the copper from the solid PCB in an appreciable amount.
Conclusion
Although our alternative solution was not more efficient and not as economically viable as the current sulfuric acid solution, with more testing and refining of the process, our solution could offer a promising green alternative to the industry standard. Given that our solution was able to leach copper effectively from PCBs, we hope to persuade the industry away from sulfuric acid solutions, the use of which can have major environmental consequences, and towards our natural weak acid solution at a similar molarity. Our vision for the near future is that a refined version of our solution could be used in tandem with the current system to reduce the amount of sulfuric acid currently in use in the metal recycling industry.
References
1: (1)de, B.; Camila Ester Hollas; Bortoli, M.; Fernando César Manosso; Davi. Heavy Metal Contamination in Soils of a Decommissioned Landfill, Southern Brazil, Ecological and Health Risk Assessment Chemosphere 2023, 339, 139689–139689 https://doi org/10 1016/j chemosphere 2023 139689
2: PUBLIC HEALTH STATEMENT Nih gov https://www ncbi nlm nih gov/books/NBK598211/
3: Hermes Modern Slavery: The true cost of cobalt mining Human Trafficking Search https://humantraffickingsearch org/resource/modern-slavery-the-true-cost-of-cobalt-mining/
Holistic Adjunctive Approaches to Breast Cancer Care: Effects on Morbidity and Mortality: A Focus on Metastatic Disease
Ashley G.
Mentor: Michele L.
Abstract
Do you know someone who is living with breast cancer? Did you know that holistic approaches can support well-being, reduce complications, and improve overall outcomes in individuals living with breast cancer, including those with metastatic disease? Given the limited research on metastatic breast cancer, this paper highlights emerging evidence on how exercise, nutrition, mindfulness, and artistic expression may impact morbidity and mortality in this population. Searching Google Scholar and PubMed databases from 2022-2026, a review of literature was conducted. Findings indicate that holistic adjunctive approaches are associated with improved morbidity and mortality outcomes in breast cancer, including metastatic disease, through the regulation of the inflammatory response. Overall, research supports that holistic approaches are effective strategies to improve quality of life and clinical outcomes in breast cancer, helping individuals live better and potentially longer, with emerging evidence in metastatic disease.
Introduction
Breast cancer is the most commonly diagnosed cancer among women worldwide and remains a leading cause of cancer-related death. Most breast cancer deaths occur when the disease progresses to metastatic breast cancer (MBC), which develops when cancer spreads from the breast to distant organs such as the lymph nodes, bones, lungs, liver, skin, and brain1,2 . Breast cancer is classified in stages ranging from stage 0 (asymptomatic) to stage IV (terminal, with continuous progressive deterioration). Stage III and IV are considered advanced-stage cancer by the American Cancer Society3 . Holistic adjunctive approaches to cancer care are increasingly recognized as important components of cancer prevention and overall survival. Evidence suggests that engaging in healthy behaviors such as regular exercise, balanced nutrition, and overall wellness may help reduce cancer risk, improve tolerance to treatment, and support long-term survivorship4 . While a robust body of research supports these approaches in early-stage cancers, metastatic disease accounts for approximately 90% of all cancer-related deaths. Despite some progress in funding, investment in MBC research remains disproportionately low. From 2000–2013, only 7% of breast cancer research funding was devoted to MBC, increasing to 13% between 2014–2020, still far below the level needed to address the disease responsible for the majority of breast cancer deaths5 The literature highlights four key holistic interventions in cancer care: exercise, nutrition, mindfulness, and artistic expression.
Materials and Methods
A review of the literature was conducted using Google Scholar and PubMed databases from 2022-2026.
Results
Exercise
Exercise has emerged as a key adjunctive intervention in metastatic breast cancer care, with growing evidence demonstrating its ability to improve quality of life while also exerting measurable biological effects on inflammation and disease progression. In patients with metastatic breast cancer, structured physical activity plays an important role in mitigating treatment-related side effects and enhancing overall quality of life (QOL). A systematic review and meta-analysis of clinical trials found that aerobic and strength training programs improve muscle mass, reduce fatigue and dyspnea, and enhance QOL in advanced-stage cancer patients. Conventional therapies used to treat metastatic cancers such as surgery, chemotherapy, and radiation cause fatigue, diarrhea, hypertension, alopecia, weight loss that leads to a decrease in muscle mass, and, overall, a significantly decreased QOL.. In a healthy population, physical exercise used as preventative therapy increases muscle mass, reduces fat, improves physical appearance and vitality, and facilitates socialization and produces relaxing effects. Thus, emphasizing the importance of exercise as adjuvant therapy for patients with cancer. Evidence supports decreased stress, anxiety and depression, pain, fatigue, dyspnea, and insomnia. In addition to enhanced physical function, improvements were seen in mental fatigue, gait, sleep quality and patient autonomy Research on the positive impact of physical exercise, including yoga and electrostimulation training, on advanced-stage cancer has influenced multidisciplinary teams in hospitals to include regular exercise as part of comprehensive patient care3
Another systematic review reported that exercise interventions improve physical function and QOL in individuals with bone metastases and are safe when supervised6 Further supporting these findings, a large multinational randomized controlled trial involving patients with metastatic breast cancer demonstrated that supervised aerobic and resistance exercise significantly improved fatigue, dyspnea, and health-related QOL compared with standard care1 . The most common site for distant metastases in breast cancer is in the bones. Osteoporosis from treatment with aromatase inhibitors increases the risk of fractures and spinal cord compression. However, a supervised exercise program with appropriate adaptations showed that exercise is safe for patients with advanced cancer. Side effects from cancer treatments can also negatively affect QOL. As most literature is based on early-stage cancers, results may not be directly applicable to advanced cancer populations given differences in disease, treatment, and increased risk of disease progression1
A randomized control trial (PREFERABLE-EFFECT ) assessed the effects of exercise on fatigue and QOL in patients with metastatic breast cancer. The multinational study was primarily developed to evaluate the impact of a structured and individualized exercise intervention on fatigue and health related quality of life (HRQOL) over a nine-month period. Improvements in both fatigue and HRQOL were seen at 6 months and maintained throughout the study. Secondary outcomes of the study reported significantly better HRQOL in the exercise group at 3 months. These outcomes included physical functioning, dyspnea, pain, cognitive functioning, insomnia, and social functioning as seen in figure 1.
Despite prevailing uncertainty among health care professionals regarding people with MBC engaging in exercise, a supervised exercise program like EFFECT is beneficial, well tolerated, and safe for individuals with MBC and stable bone metastases. The additional positive effects on pain and dyspnea suggest that exercise may be used as a supportive treatment. While fatigue and pain were mentioned as a deterrent to start or continue exercising, with some people believing that exercise could worsen their symptoms, the evidence indicated that physically active cancer survivors were found to have less pain compared to those who have low activity levels. Educating patients on current research could help in understanding the benefits of exercise while minimizing the fears that diminish motivation. These evidence-based results indicate that a supervised aerobic and resistance exercise program for patients with MBC is recommended as an integral part of supportive care7 .
Figure 17
Emerging evidence suggests that exercise may exert direct biological effects on cancer progression. A recent study found that a single session of resistance or high-intensity interval training increased anti-cancer myokines and suppressed breast cancer cell growth in vitro, highlighting its potential as a non-pharmacological strategy8 .
Consistent findings from systematic reviews and meta-analyses of randomized controlled trials demonstrate that physical activity significantly reduces key inflammatory biomarkers.(reference papers for this statement). Although many cytokines have been studied, changes in interleukin-6 (IL-6), tumor necrosis factor-alpha (TNF-α), and C-reactive protein (CRP) have been most consistently altered, with several studies reporting statistically significant improvements9,10,11 . These biomarkers, illustrated in Figure 2, play a central role in systemic inflammation and cancer progression.
Collectively, this evidence suggests that exercise may improve clinical outcomes and potentially reduce breast cancer recurrence and mortality through modulation of inflammatory and metabolic pathways10,11 . Overall, exercise not only improves physical function and quality of life in patients with metastatic breast cancer, but also targets key inflammatory biomarkers such as IL-6, TNF-α, and CRP, supporting its potential role in reducing disease progression, recurrence, and mortality10,11 . Figure 211
Diet
Dietary patterns also play a pivotal role in breast cancer outcomes by modulating inflammatory pathways, particularly pro-inflammatory cytokines such as IL-6 and TNF-α, as well as metabolic and hormonal processes that collectively influence disease progression, recurrence, and mortality12 Diet plays a critical role in cancer progression, prognosis, and survivorship, with growing evidence demonstrating its ability to influence inflammatory and metabolic pathways that impact morbidity and mortality A systematic review and meta-analysis examined the association between dietary patterns and cancer prognosis. Evidence showed that adherence to a Mediterranean diet, often combined with exercise, enhanced overall QOL. A higher-quality diet demonstrated a 23% reduction in overall mortality of breast cancer survivors in a meta-analysis using a random-effects model12 The Mediterranean diet is a dietary pattern that emphasizes high consumption of fruits, vegetables, whole grains, nuts, and olive oil, with moderate intake of fish and dairy and limited consumption of red meat, saturated fats, and added sugars13 .
Dietary interventions, often combined with exercise, provide multiple benefits for individuals living with cancer. Increased body fatness is a predictor of adverse outcomes in patients with breast cancer Better survival is associated with consumption of foods containing fiber, soy, and lower total and saturated fat intake. A specific scale for breast cancer, FACT-B, showed significant improvement in QOL after 6 months following a plan of individualized exercise and low-calorie diet program. A 2-week intervention in breast cancer patients including physical exercise, dietary instruction, and a 1200 kcal/day calorie restriction reported increased QOL. A ‘fatigue reduction diet’ (diet high in fruit, vegetables, whole grains, and omega-3 fatty acids) investigated in a 3-month randomized pilot trial revealed improved fatigue and quality of sleep12 .
Evidence indicates that pro-inflammatory dietary patterns, characterized by higher intake of processed meats, refined sugars, and soft drinks, are associated with poorer prognosis, including a higher combined risk of mortality, recurrence, and metastasis, whereas anti-inflammatory diets, such as the Mediterranean diet, are linked to lower overall mortality and improved quality of life among cancer survivors. For example, in the Women’s Health Initiative (WHI) Dietary Modification clinical trial, participants followed a dietary intervention for 8.5 years with a median follow-up of 19.6 years12 Results indicated that a low-fat diet emphasizing greater intake of fruits, vegetables, and grains was linked to significantly lower overall mortality (15%) as well as reduced breast cancer–specific mortality (21%) in postmenopausal women12 . Another study found that higher intake of red meat and alcohol was associated with increased breast cancer risk, whereas greater consumption of fruits and vegetables appeared to have a protective effect13 .
Multiple studies support the protective effects of the Mediterranean diet against breast cancer Greater adherence to this dietary pattern has been associated with a reduced risk of breast cancer, and one randomized clinical trial found a 62% reduction in the likelihood of developing malignant breast cancer among women following a Mediterranean diet supplemented with extra-virgin olive oil13
The effects of the Mediterranean diet on breast cancer risk and progression are driven by several interconnected biological mechanisms, including the regulation of inflammation and oxidative stress, gene expression, gut microbiota, insulin signaling, and hormonal balance. One of the primary mechanisms involves its anti-inflammatory and antioxidant effects, as the diet is rich in monounsaturated fats and antioxidant compounds that help reduce cellular damage and limit cancer progression. In addition, the Mediterranean diet influences gene expression by regulating pathways involved in cell proliferation, apoptosis, and angiogenesis, potentially inhibiting tumor growth and metastasis. It also plays a significant role in shaping the gut microbiota, promoting a diverse and balanced microbial environment that may reduce inflammation and lower cancer risk. Furthermore, by emphasizing low glycemic index foods, this dietary pattern supports insulin and glucose regulation, thereby reducing signals that promote cancer cell growth. Finally, the Mediterranean diet may contribute to hormonal regulation, particularly by lowering circulating estrogen levels, a key factor in breast cancer development. Together, these mechanisms suggest that the Mediterranean diet may play a meaningful role in the prevention and management of breast cancer13 .
Breast cancer contributes significantly to both morbidity and mortality in women worldwide, particularly as the disease progresses. In addition to the physical and psychological burden associated with both the disease and its treatment, these factors can negatively impact quality of life and treatment adherence. However, adherence to a Mediterranean dietary pattern has been linked to improved outcomes, including better overall health, enhanced quality of life, and improved prognosis. Importantly, evidence from prospective studies suggests an inverse relationship between adherence to this diet and breast cancer mortality, indicating that higher adherence may be associated with a lower risk of death. For example, a large Greek cohort study reported that even a modest increase in adherence to the Mediterranean diet was associated with a 25% reduction in overall mortality. Taken together, these findings suggest that the Mediterranean diet may play a supportive role in improving both morbidity and mortality outcomes in women with breast cancer13 .
A randomized controlled trial examining a whole-food, plant-based dietary intervention in women with metastatic breast cancer demonstrated significant improvements in several metabolic and hormonal risk factors associated with disease progression. Participants in the intervention group experienced meaningful weight loss, along with reductions in fasting insulin levels, insulin resistance, and cholesterol markers. Additionally, improvements were observed in cardiometabolic health indicators, suggesting that dietary changes may help address treatment-related weight gain and associated risks. While no significant differences were found in short-term cancer progression markers, the intervention was well tolerated and showed clinically relevant benefits in factors known to influence long-term outcomes. These findings highlight the potential role of dietary interventions as a supportive strategy in the management of metastatic breast cancer. Taken together, the evidence suggests that dietary patterns not only improve breast cancer outcomes but also influence key inflammatory and metabolic pathways14 Anti-inflammatory diets, particularly the Mediterranean diet, appear to downregulate pro-inflammatory cytokines such as IL-6 and TNF-α while supporting metabolic and hormonal regulation, thereby contributing to reduced disease progression, recurrence, and mortality.
Mindfulness
Chronic psychological stress plays a significant role in cancer progression by influencing both psychosocial well-being and underlying biological pathways. In patients with cancer, elevated stress and depression are associated with dysregulation of inflammatory processes, including increased levels of cytokines such as IL-6 and TNF-α, which have been linked to poorer prognosis and increased mortality Beyond its biological effects, chronic stress has important clinical and psychosocial implications for patients with cancer. Patients with cancer not only experience physical symptoms related to tumor burden and treatment toxicities but also have higher rates of comorbid psychological conditions compared to individuals without cancer.
Depression and anxiety are among the most common psychological conditions affecting individuals with cancer, with research indicating that approximately 75% of patients experience these disorders and 50% to 85% report both simultaneously These conditions are often underrecognized despite their significant impact, as they can interfere with treatment adherence, reduce survival rates, and increase the overall cost of care. Additionally, individuals with depression face a 40% to 60% higher risk of early mortality compared to the general population15
Depression occurs at significantly higher rates among patients with cancer, estimated to be up to four times more common than in individuals without cancer. Despite this high prevalence, many cases remain undiagnosed. This is particularly concerning, as depression has been associated with increased mortality and poorer overall prognosis in this population16 .
Evidence from meta-analyses and randomized controlled trials indicates that both psychological stress and underlying biological processes contribute to depressive symptoms in this population. In particular, depression has been linked to dysregulation of inflammatory pathways, including elevated levels of cytokines such as interleukin-6 (IL-6) and tumor necrosis factor–alpha (TNF-α), as well as alterations in stress-related hormonal pathways involving cortisol, as seen in figure 4. Importantly, these inflammatory mediators are involved across all stages of cancer development, from initial tumor formation to progression and metastasis. These interconnected mechanisms suggest that depression may influence not only quality of life but also overall disease outcomes16 .
Chronic psychological stress has been identified as a significant contributor to cancer development and progression through its effects on inflammation and immune function.
Activation of the hypothalamic–pituitary–adrenal (HPA) axis and sympathetic nervous system leads to increased levels of cortisol and catecholamines, which disrupt immune surveillance and promote an immunosuppressive environment. At the same time, chronic stress induces sustained low-grade inflammation through elevated production of proinflammatory cytokines. This inflammatory state plays a critical role in tumor growth, angiogenesis, and metastasis. In addition, stress-related signaling has been shown to further promote tumor invasion and metastasis by facilitating tissue remodeling and new blood vessel formation, ultimately contributing to increased cancer morbidity and mortality17
Chronic stress not only contributes to cancer development but has also been linked to increased recurrence, poorer prognosis, and decreased survival. It may also negatively influence treatment outcomes by altering immune function and promoting a persistent inflammatory state within the tumor environment. Importantly, growing evidence suggests that interventions such as mindfulness and regular physical activity may help mitigate these effects by reducing stress hormone levels, lowering inflammation, and supporting immune response18
Mindfulness, originating from Buddhist traditions, is commonly defined as a nonjudgmental awareness of the present moment, with attention directed toward thoughts, bodily sensations, and the breath. This approach allows individuals to observe internal experiences with reduced reactivity, fostering acceptance and improved psychological well-being16
Together, these findings suggest that mindfulness-based interventions targeting psychological stress may not only improve quality of life but also modulate inflammatory pathways implicated in cancer progression, supporting a role in reducing recurrence and mortality18 .
Mindfulness-based interventions (MBIs) are increasingly recognized as potential approaches for managing cancer-related distress and affective symptoms. Existing research suggests that MBIs can help reduce depressive symptoms, lessen fatigue, and improve overall quality of life in patients with cancer, although their relationship with survival outcomes has not been clearly
defined. Considering the association between depression and reduced survival in this population, it is plausible that interventions targeting depression may also have a positive impact on survival16 . MBI’s, including mindfulness-based stress reduction (MBSR) and mindfulness-based cognitive therapy (MBCT), have been widely studied for their effects on psychological well-being. MBSR emphasizes structured mindfulness practices, while MBCT incorporates cognitive strategies to reduce rumination and negative thought patterns. Collectively, findings from meta-analyses and randomized controlled trials indicate that these interventions are associated with significant reductions in stress, anxiety, depression, and rumination, along with improvements in overall quality of life and well-being. In one randomized controlled trial, both MBCT and loving-kindness meditation (LKM) demonstrated greater reductions in depression and rumination compared to controls across multiple time points, along with sustained improvements in self-acceptance and quality of life16 . Further support comes from a systematic review and meta-analysis of 18 randomized controlled trials, which found that mindfulness-based interventions significantly improve quality of life and reduce depression, anxiety, pain, and fatigue in patients with cancer. Importantly, significant improvements were observed across all measured outcomes19 .
Overall, the evidence suggests that mindfulness-based interventions may improve breast cancer outcomes by reducing psychological stress and downregulating pro-inflammatory mediators such as IL-6 and TNF-α, while restoring neuroendocrine and immune balance, thereby contributing to decreased disease progression, recurrence, and mortality
416
Art
and Music Therapy
Artistic expression, including music and art therapy, plays a meaningful role in cancer care by addressing psychological distress and emotional burden, both of which significantly impact quality of life, treatment adherence, and overall disease outcomes.By using music as a
Figure
therapeutic tool, this intervention supports both emotional and physical well-being, helping to ease distress, promote relaxation, and improve overall health. These benefits have been observed in patients with long-term and advanced cancer, including those receiving palliative care. Music influences both the mind and body, making it a valuable tool for supporting individuals with anxiety and depression. It triggers the release of brain chemicals, such as endorphins, that can elevate mood, increase energy and confidence, and help lessen pain, stress, and emotional distress. Through these effects, music therapy plays an important role in improving overall well-being and can benefit cancer patients throughout the course of their treatment.
A meta-analysis evaluating music therapy in cancer patients found it to be more effective than conventional approaches in reducing symptoms of depression and anxiety Evidence suggests that participating in music therapy for one to two months can lead to meaningful improvements in mental health and overall quality of life. Additional findings indicate that music therapy can reduce negative emotional states such as low mood, despair, and hopelessness, supporting its role as a valuable complementary treatment in cancer care15 .
Music therapy has been shown to help reduce emotional distress by improving mood, easing anxiety, and providing distraction from the burden of illness and treatment15 It may also help lessen treatment-related side effects, including pain and certain chemotherapy-related complications15 Overall, music therapy is considered an effective complementary approach for improving psychological well-being in women with breast cancer. As previously discussed, a substantial portion of cancer-related mortality has been linked to untreated depression and anxiety, highlighting the critical role of psychological health in patient outcomes. Music therapy has been identified as an effective intervention for addressing these conditions, helping to reduce depressive symptoms and anxiety commonly experienced by individuals with breast cancer
A meta-analysis examining music therapy in breast cancer patients found significant reductions in anxiety, depression, and pain, along with improvements in overall quality of life. As a noninvasive, multidisciplinary intervention, music therapy works by engaging both emotional and physiological pathways, helping regulate stress responses such as heart rate, blood pressure, and respiration. By influencing cognitive and emotional processing, it can alter the perception of pain and reduce psychological distress. These findings highlight the role of music therapy as an effective supportive intervention for improving psychological well-being and quality of life in breast cancer patients20
Cancer patients often struggle with fears about physical changes, social judgment, and mortality, which can negatively affect their mental health. Music-based approaches may help patients better manage the emotional strain of treatment by influencing brain activity tied to stress and emotional regulation. Even short periods of listening to music can improve physiological balance, reflected in nervous system responses. These interventions may also ease common side effects of treatment, such as pain, fatigue, nausea, and stress, helping patients feel more physically and emotionally at ease21 .
A retrospective study evaluated the impact of music therapy on patients with end-stage cancer, who often experience significant physical and psychological distress. Patients who received music therapy in addition to standard care showed significantly lower anxiety and depression scores compared to those receiving conventional care alone. Music therapy appears to work by influencing emotional and neurological pathways, including brain regions involved in stress and emotion regulation, while also affecting the autonomic nervous system. These changes can reduce psychological distress, improve sleep quality, and enhance immune function. Overall, the findings suggested that music therapy is an effective, low-risk intervention that improves emotional well-being and quality of life in patients with end-stage cancer22 . Given its ability to improve psychological well-being without added risk and with minimal cost burden, incorporating music therapy into treatment may not only enhance quality of life but also contribute to reducing cancer-related mortality15 .
In addition to music therapy, art therapy represents another form of artistic expression that can help address the psychological and emotional challenges associated with cancer. A multiple case study explored how art therapy supports terminal cancer patients and their families as they face end-of-life challenges. The findings suggest that art therapy helps patients cope with the reality of death by reducing anxiety and existential distress while improving self-expression, connection, and overall quality of life. Through creative expression, patients and their families are able to communicate complex emotions, preserve personal identity, and strengthen relationships. Artwork also serves as a meaningful way to create lasting memories and maintain emotional bonds during the dying process. Family art therapy was also shown to shift perspectives on end-of-life, allowing patients and their families to view it not only as a crisis but as an opportunity for meaning, growth, and connection. Over time, participants became more comfortable expressing emotions, developed more open communication, and demonstrated increased emotional resilience. Artistic expression acted as a bridge for communication, enabling individuals to share feelings that might otherwise remain unspoken. Additionally, art therapy strengthened family cohesion and helped maintain supportive relationships despite the challenges of illness. It encouraged shared experiences, emotional healing, and stability within family dynamics. Overall, the study highlights art therapy as a valuable tool for fostering meaning, improving communication, and enhancing emotional well-being for both terminal cancer patients and their families23 .
Art therapy serves as an important component of supportive and palliative cancer care by addressing physical, emotional, and psychosocial needs throughout the illness. It helps reduce treatment-related side effects, enhances coping, and improves overall quality of life. By promoting emotional expression and communication, art therapy strengthens connections between patients, families, and caregivers, ultimately supporting well-being and holistic care in advanced cancer stages24 .
Women living with cancer often report a lack of support after treatment and face challenges in rebuilding their identity Art-based interventions provide a space for reflection and self-expression, allowing patients to process their experiences and navigate personal transformation. Through creative engagement, individuals gain insight into their illness, develop confidence, and reconstruct a more positive sense of self. These interventions support
emotional expression, foster new perspectives, and promote long-term coping, ultimately helping patients adapt to life after cancer and improve overall well-being25 . Overall, the evidence suggests that artistic expression through music and art therapy can improve psychological well-being and quality of life in individuals with breast cancer, helping to reduce anxiety, depression, and emotional distress, which are known to negatively influence treatment adherence, disease progression, and mortality.
Discussion
Taken together, the evidence presented highlights that holistic adjunctive approaches, including exercise, nutrition, mindfulness, and artistic expression, play a significant role in improving outcomes for individuals with breast cancer by targeting both psychological and biological pathways. Across these interventions, a central unifying mechanism is the modulation of inflammation, particularly through the regulation of the pro-inflammatory state induced by cancer disease (such as cytokines IL-6 and TNF-α). Exercise and dietary interventions demonstrate clear direct effects on these inflammatory biomarkers, while mindfulness-based interventions influence these pathways through both physiological regulation of stress responses and reductions in psychological distress. Although music and art therapy are not classified as mindfulness-based interventions, their demonstrated effects on stress reduction and emotional regulation suggest that they may influence similar pathways, potentially contributing to downstream effects on inflammation and disease outcomes. While much of the existing research has been conducted in early-stage cancer populations, the emerging evidence in metastatic breast cancer is promising and highlights the need for further investigation. Collectively, these findings support the integration of holistic, multidisciplinary approaches into standard cancer care as a means of improving both morbidity and mortality in patients with breast cancer
Future research should focus on large-scale randomized controlled trials to further evaluate the long-term effects of lifestyle interventions on inflammatory biomarkers and clinical outcomes, particularly in metastatic breast cancer populations. In addition, efforts should focus on applying these findings into clinical practice through patient and provider education supported by evidence-based practice. Evidence-based holistic interventions can be implemented into practice through community-based programs. Determined Disruptors was founded by a young caregiver supporting a mother with metastatic breast cancer, with the goal of improving physical and emotional well-being through shared activities. Determined Disruptors is a nonprofit organization that supports the physical, emotional, and spiritual well-being of women living with breast cancer through funded, shared activities designed to promote engagement and connection. These interventions, including physical activity, creative expression, and mindfulness-based practices, which are implemented in accessible group-centered settings that encourage both participation and emotional resilience. Programs such as these demonstrate how holistic approaches can support both psychological and physiological well-being. Increasing awareness and accessibility of these interventions may contribute to improved quality of life and overall outcomes for individuals living with breast cancer
References
1. Hiensch, A.E. et al. Design of a multinational randomized controlled trial to assess the effects of structured and individualized exercise in patients with metastatic breast cancer on fatigue and quality of life: the EFFECT study. Trials 23, 610 (2022)
2 Institute for Quality and Efficiency in Health Care (IQWiG) Overview: Metastatic breast cancer InformedHealth.org (2024). Available at:https://www.ncbi.nlm.nih.gov/books/NBK361001/
3 Rodríguez-Cañamero, S et al Impact of physical exercise in advanced-stage cancer patients: Systematic review and meta-analysis Cancer Medicine 11, 3714-3727 (2022)
4 Greco, G , Petrelli, A , Fischetti, F & Cataldi, S Lifestyle-Based Approaches to Cancer Prevention and Treatment: Diet, Physical Activity, and Integrative Strategies Pathophysiology 32, 70 (2025)
5. Metastatic Breast Cancer Alliance, MBC research funding analysis (2023). Available at:https://www mbcalliance org/research/mbc-research-funding-analysis-2023
6. Weller, S. et al. Exercise for individuals with bone metastases: A systematic review. Critical Reviews in Oncology/ Hematology 166, 103433 (2021)
7. Supervised, Structured and Individualized Exercise in Metastatic Breast Cancer: A Randomized Controlled Trial Nature Medicine (2024)
8 Bettariga F , et al A single bout of resistance or high-intensity interval training increases anti-cancer myokines and suppresses cancer cell growth in vitro in survivors of breast cancer. Breast Cancer Research and Treatment 213, 171–180 (2025)
9. Swain, C.T.V. et al. Linking Physical Activity to Breast Cancer Risk via Inflammation, Part 1: The Effect of Physical Activity on Inflammation Cancer Epidemiology, Biomarkers & Prevention 32, 588-596 (2023)
10. Zhou, Y., Jia, N., Ding, M. & Yuan, K. Effects of exercise on inflammatory factors and IGF system in breast cancer survivors: a meta-analysis BMC Women’s Health 22, 507(2022)
11 Invernizzi, M et al Integrating molecular biomarkers in breast cancer rehabilitation What is the current evidence? A systematic review of randomized controlled trials. Frontiers in Molecular Biosciences, 930361 (2022)
12. Castro- Espin, C. & Agudo, A. The Role of Diet in Prognosis among Cancer Survivors: A Systematic Review and Meta-Analysis of Dietary Patterns and Diet Interventions Nutrients 14, 348 (2022)
13. Reytor-González, C., Zambrano, A.K., Frías-Toral, E., Campuzano-Donoso, M., & Simancas-Racines, D. Mediterranean diet and breast cancer: a narrative review Medwave25, e3027 (2025)
14. Campbell, T.M. et al. A whole-food, plant-based randomized controlled trial in metastatic breast cancer: weight, cardiometabolic, and hormonal outcomes Breast Cancer Researchand Treatment 205, 257-266 (2023)
15. Eseadi, C., Ngwu, M.O. Significance of music therapy in treating depression and anxiety disorders among people with cancer World Journal of Clinical Oncology 14,(2) 69-80(2023)
16. Marinovic, D.A. & Hunter, R.L. Examining the interrelationships between mindfulness-based interventions, depression, inflammation, and cancer survival CA: A Cancer Journal for Clinicians 72, 490-502 (2022).
17 Vignjevic Petrinović, S , Milośević, M S , Marković, D , Momčilović S Interplay between stress and cancer-A focus on inflammation Frontiers in Physiology 14, 1119095 (2023)
18. Yan, J. et al. Chronic stress in solid tumor development: from mechanisms to interventions. Journal of Biomedical Science 30, 8 (2023)
19. Lin, L.Y. et al. Effects of mindfulness-based therapy for cancer patients: A systematic review and meta-analysis Journal of Clinical Psychology in Medical Settings 29, 432-445 (2022)
20. Ran, R., Ying, Y., Zhang, W. Effects of music intervention on anxiety, depression symptoms and quality of life in breast cancer patients: A meta-analysis Actas Esp Psiquiatr 51,(6) 250-261 (2023)
21. Lima, T.U. et al. Impact of a music intervention on quality of life in breast cancer patients undergoing chemotherapy: A randomized clinical trial Integrative Cancer Therapies 19, 1-9 (2020)
22 Dong, J & Qu, Y Therapeutic effect of music therapy on patients with end-stage cancer: A retrospective study. Noise and Health 26, (121):82-87 (2024).
23 Park, N , Na, I I , Kwon, S Art therapy in patients with terminal cancer and their families: A multiple case study. Journal of Hospice and Palliative Care 26, (4) 171–184(2023).
24 Arjmand, B et al Coloring the journey: The transformative impact of art therapy on cancer patients’ well-being. Journal of Integrative Medicine 24, (1) 24-32 (2026).
25 Ranger, M C , Houle, S , Rheault, A & Thomas, R Art-based workshops for women: An opportunity for reflection on identity and transformation following cancer treatment Occupational Therapy International 2023,1828314 (2023).
The Muskrats of New York City: A Study of the Factors Influencing Muskrat Populations at Jamaica Bay Wildlife Refuge and Comparative Urban Wetlands
Manus C.
Mentor: Jessica Z.
Abstract
Muskrats are semiaquatic rodents that live all over North America, including in New York City In this project, I am attempting to determine which environmental factors are most pivotal in muskrat habitat choice in New York City The factors measured included: water quality, plant density, presence of predators, and weather, which were compared to evidence of muskrat activity Jamaica Bay Wildlife Refuge in Queens served as the main study site of this project. Comparative study sites were chosen based on location and reports of muskrat sightings. These locations were: Udalls Park Preserve in Queens, High Rock Park in Long Island, Muskrat Cove in the Bronx, and Prospect Park in Brooklyn. Results showed that muskrats were most impacted by plant density and predator activity, which makes sense since muskrats require cover to hide from predators. Water pollution, specifically the presence of chloride, also proved to be a significant factor, which is likely to affect the health of plants and animals in the environment.
Introduction
The common muskrat (Ondatra zibethicus) is a semiaquatic rodent native to North America, South America, Europe and Asia. It is an omnivore, and though it eats mostly plants, it will also eat fish and snails if food is scarce. Muskrats are commonly found in locations with water and prefer marshland habitat to rivers or lakes1 In a marshland habitat, they are most often found in areas with a high concentration of phragmite reeds1 , which provide food, building supplies, and cover from predators.1 Muskrats are generally solitary animals that reside in a structure commonly known as a den, which is often built out of sticks, reeds and mud.1 From late April to early June, however, the parents live together in a single den to raise the kits.1 The gestation period is around twenty eight days and the average litter size is about seven kits.1
Muskrats have dwelled in the New York City area for a very long time, since before Europeans reached the Americas; they even feature in the creation myth of the Lenape people, who were the original inhabitants of the area.3 They tend to dwell in aquatic locations in the city,2 and are most likely to be found in parks, though they may also be seen in canals and other bodies of water. However, because of their skittish and crepuscular nature (they are most active at dawn and dusk), muskrats are rarely sighted in the city by humans.2 Their most frequently documented predators in New York City include the Red-tailed Hawk (Buteo jamaicensis), Common Raccoon (Procyon lotor), Great Horned Owl (Bubo virginianus), Barn Owl (Tyto alba), Great Blue Heron (Ardea herodias) and Common Snapping Turtle (Chelydra serpentina).4
The goal of this project was to identify the characteristics of the most suitable habitats in New York City for muskrats. Jamaica Bay Wildlife Refuge, in Queens was used as the primary study site because muskrats have been seen there by local naturalists.2 Comparative study locations were used to establish the key characteristics that determine the suitability of a habitat for the muskrats. These comparative sites included Udalls Park Preserve in Queens, High Rock Park in Long Island, Muskrat Cove in the Bronx, and Prospect Park in Brooklyn. Manhattan was omitted because it does not contain suitable habitat for muskrats and they have been seen there only rarely.2
My hypothesis is that the most important factors in muskrat habitat choice will be the following: year round access to salt, brackish, and freshwater, seclusion from humans, heavy plant cover, and lack of predators. Jamaica Bay Wildlife Refuge has all of these factors and is thus likely the most suitable location for muskrats to dwell in New York City.
Procedure
In this experiment, evidence of muskrat activity, such as tracks, scat, or muskrat sightings, was recorded. Data was also collected on water quality, plant density, evidence of predators, and human activity at the comparative study sites. Methods for collecting this data are described below.
Water Quality: Water samples were used to measure water temperature, salinity, dissolved oxygen, pH, carbonate, hardness, alkalinity, chlorine, nitrite, and nitrate. Salinity was measured in parts per thousand using a Brix® refractometer. Temperature was measured with an analog thermometer. Dissolved oxygen was measured with a Monitor ® dissolved oxygen test kit. All other measurements were measured with JNW Direct® pond test strips.
Plant density was determined by counting the number of plants in one randomly selected square foot close to the water source and was repeated at each visit. I also photographed and recorded notable plant species at each site.
Evidence of predators was determined by observation, including humans and human pets in the area, as well as tracks, scat or other signs confirming the presence of known predator species.
Metadata included time of day, tide level, air temperature, wind speed, and weather factors such as precipitation.
Results
Figure 1: Predator Activity (Blue) compared to Muskrat Activity (Red) Muskrat activity is generally higher when predator activity is lower and vice versa
2: Chlorine Levels (Blue) compared to Muskrat Activity (Red) Muskrat activity is significantly lower when there is chlorine in the water
Figure
Figure 3: Human Activity (Blue) compared to Muskrat Activity (Red). Human activity does not correlate with muskrat activity as shown here.
4: Plant Density (Blue) compared to Muskrat Activity (Red). High plant density often correlates with higher muskrat activity.
Figure
Analysis
Due to the small sample size of this project, Fisher's Exact Test was used for the analysis of the data. Fisher's Exact Test is used for determining an association between two variables. It is similar to the Chi-squared test for independence but is more useful when limited to small sample sizes. 4 In this study, muskrat signs were compared with other measured variables to identify statistically significant ecological factors at each site.4
The probability (P) was determined using the formula , where a is the �� = (��+��)!(��+��)!(��+��)! (��!��!��!��!��!) number of muskrat signs at a given site, b is the number of muskrat signs at a second site, c is the number of occurrences of the second variable (such as predator signs) at the first site, and d is the number of occurrences of the second variable at the second site, and n is the total number of occurrences (a + b + c + d).4 This was done comparing data at all sites. If the calculated p-value was less than 0.05, it means that there is less than a 5% probability that the results occurred by chance, and thus is considered statistically significant. 4 This test is a quick and efficient way to determine how, or if, any of the results are significant.
The factors that proved the most statistically significant were predator activity (p=0.048), chlorine levels in the water (p=0.035), and plant density per square foot (p=0.048).
Discussion
In this project I aimed to determine which factors most influenced muskrat success in various habitats in the city I hypothesized that Jamaica Bay Wildlife Refuge would be the most beneficial location for muskrats to live in due to year round access to a range of aquatic environments, seclusion from humans, heavy plant cover and lack of predators. In the end, my hypothesis was largely supported by my results. Jamaica Bay did have the most muskrats out of any study site that was surveyed. I hypothesized that seclusion from humans would be important for muskrat habitat choice, and this was supported by the data as chlorine ( indicative of human pollution) was the most influential factor in muskrat habitat choice. Chlorine is known to break down cells and is toxic to water plants and small aquatic animals. Muskrats depend on these species for food so locations with chlorine pollution in the water may not be able to support their dietary needs.6
I also believed that lack of predators would be important in supporting a muskrat population, and predator activity was another of the most important factors that correlated with muskrat activity. Jamaica Bay does not have many predators because species like largemouth bass, which prey on muskrat kits, cannot survive in saltwater With fewer predators, muskrats are better able to populate the area and survive. Human activity, which affects muskrat behavior in the same way as predators, is also less frequent in the deeper areas of Jamaica Bay
I hypothesized that plant density would impact muskrat activity, and this was also supported by the data (Figure 4). Plants provide cover to hide from the elements, predators, and humans, and
thicker plant density means that muskrats would have more plant options to build their dens. These factors suggest that muskrats should have a higher chance of surviving in areas with thicker plant cover.
The only factors not supported by the data were year round water access and different types of water. I thought these factors would be important because it would allow the muskrats access to more food than if there was only one type of water. However, it seems that muskrats get enough food at the different sites even when saltwater is not available.
This project underscored the negative impact humans have on muskrats' ability to thrive in New York City’s urban wetlands due to the introduction of water pollutants, such as chlorine. The sample size of this study was small due to time limitations. It is possible that more time in the field, more observations and more data at all the sites would show more nuanced and accurate, or perhaps different, results. I hope to continue studying muskrats and advocating for their protection because of their ecological importance and their amazing lives.
References
1 Errington PL. Muskrat Populations. Iowa State University Press; 1963.
2 Riepe, Jamaica Bay Guardian, pers comm , [8/31]
3 Creation Stories | Nanticoke and Lenape Confederation [Internet] Nanticokelenapemuseum org 2017 Available from: https://nanticokelenapemuseum.org/news/1380/creation-stories/
5 McClenaghan E. The Fisher’s Exact Test [Internet]. Technology Networks. 2024. Available from: https://www technologynetworks com/tn/articles/the-fishers-exact-test-385738
6 Calomiris JJ, Christman KA How does chlorine added to drinking water kill bacteria and other harmful organisms? Why doesn’t it harm us? [Internet] Scientific American 1998 Available from: https://www.scientificamerican.com/article/how-does-chlorine-added-t/
The Shape of Sound: An Exploration of Associations
Between Melody and Phonetic Features
Anjali Aria A. Mentor: Henry K.
Abstract
This study explores whether and how humans have intuitive associations between melodies and certain phonetic lyrical sounds. I was interested in whether certain musical features are consistently associated with certain lyrical phrases. I conducted two experimental surveys where participants matched 5 melodies with 5 randomly generated pseudoword phrases based on which combinations they believed fit best. In the first experiment, both phrases and melodies were randomly generated to observe baseline associations. In the second experiment, I expanded on the well known Bouba/Kiki phenomenon, a scientific study where people associated certain sharp and round sounds with corresponding shapes, to investigate whether similar associations apply to music. In this experiment, pseudoword phrases were created using either sharp or round sounds, and participants matched them to melodies that varied in pitch, timbre, octave, and mode. The results of this experiment reveal an intriguing correlation between melody and lyrical associations. Participants strongly matched rounder phrases with smoother timbres and lower octaves, while associating sharper phrases with higher octaves and choppier timbres. These findings reveal that certain musical elements, particularly pitch, octave, and timbre, contribute to associations between music and language.
Introduction
When listening to music, we often perceive lyrics and melodies as two separate aspects of a song. The words communicate meaning and narrative while the melody provides the emotion and atmosphere. In reality, however, the way lyrics and melodies interact with each other intuitively impacts our listening experience. The phonetic quality of words, like vowels and consonants, dictates how seamlessly lyrics align with melody, contributing to subconscious emotions and associations we have while listening. As a songwriter, I often find myself instinctively choosing words with certain vowels and consonants that seem to naturally correspond with melodic structure. This suggests humans have an innate understanding of the relationship between phonetics and musical qualities. I was intrigued by this intrinsic connection between sound and melody, and wanted to better understand this through a scientific perspective.
When considering the unconscious associations we form around phonetics, the Bouba Kiki effect instantly comes to mind. The Bouba Kiki Effect is a robust scientific study conducted across 25 countries representing 9 language families and 10 writing systems.1 In the experiment, participants were shown two shapes, one rounded and circular, the other sharp and jagged.2 When asked to match the pseudowords “Bouba” and “Kiki” to the shapes, 95% of participants associated the round shape with “Bouba” and the jagged shape with “Kiki”.3 These near
universal associations are testament to our cross-modal connections between auditory and visual signals, suggesting that humans naturally attach sensory qualities to phonetic sound.4
The Bouba Kiki effect demonstrates a phenomenon closely related to synesthesia. Synesthesia is a neurological condition where the stimulation of one sensory pathway triggers experiences in another.5 For example, some individuals may see colors while listening to the violin. Brain imaging studies have shown that in some synesthetes, both the typical sensory processing areas as well as extra sensory areas light up in response to a signal stimulus.6 This suggests a form of neurological cross activation, where brain regions that normally operate in isolation become connected across sensory systems. While only about 4% of the population has true synesthesia, the Bouba Kiki effect suggests a more universal version of these cross-modal sensory interactions.7
Despite the extensive research surrounding the Bouba Kiki effect, little is known about the potential musical associations humans form in response to phonetic sound. Although our intuitive perception of phonetics and music is clear, the precise qualities of these associations remain a mystery. Through my experiment, I aimed to better understand how specific musical elements correspond with certain phonetic qualities. How do timbre, pitch, octave, and mode contribute to our subconscious listening preferences and experiences? Do specific vowels and consonants naturally align with certain musical features? My study aims to provide a framework to better understand the cognitive relationship between phonetics and music.
Materials and Methods
To test how humans associate musical qualities with phonetic features, I designed a survey-based experiment to expand on the Bouba Kiki effect. This experiment investigates whether phonetic qualities associated with round and sharp sounds influence how listeners perceive musical elements (major and minor, pitch, octave, and timbre). The survey had participants match certain pseudoword phrases with certain melodies to determine whether intuitive connections are commonly made between phonetics and melodic structure.
I designed 4 pairs of melodies, each testing for one of four musical variables: pitch, octave, timbre, and mode. Every melody was produced on the software Logic Pro X and consisted of 4 syllables, quantized to eighth notes to ensure rhythmic consistency across all audio files. I
Figure 1 When provided with these two shapes, 95% of participants matched “Kiki” with the left shape and “Bouba” with the right.
decided on this four syllable criterion after conducting a previous experiment where participants had to match randomly generated pseudoword phrases to 10 syllable melodies. The large number of syllables contributed to the complexity of the experiment, and some participants found it overwhelming and confusing. Therefore, restricting the melodies to 4 syllables simplified the matching process for participants and produced more defined results. For all the melodies except for the timbre pairing, I utilized a simple “Yamaha Piano” sound from the Logic sound library. This was to provide a relatively familiar and understated timbre, so participants could focus more on the musical contents rather than the overlapping frequencies and sound textures.
The first melody pair tested for timbre. The two melodies in this pair contained identical notes but differed in sound texture, attack, envelope, and decay. I used different MIDI instruments from the Logic Pro sound library, one called “Rounded Square Bass” and the other "Sharp Cut Bass”.
The second melody tested for differences in pitch. Despite sharing the same intervallic structure, one was transposed a whole step higher than the other, resulting in two versions of the same melody but in different keys.
The third melody pair tested for Octave. Octaves are the intervals between two notes where one has twice the frequency of the other.8 Despite the differences in frequency, each octave is perceived as nearly identical in pitch– a phenomenon known as “octave equivalence”9 . In this pairing, both melodies were in the key of C and contained the same notes, but were separated by one octave.
The fourth melody pairing tested for differences between minor and major modes. Mode is a fascinating musical variable, because minor and major keys are often associated with sad and happy emotions, respectively. A 2017 study found that negative words like “lost”, “pain”, “fight”, and “die” were overexpressed in minor chords, while positive words like “baby”, “sweet”, and “good” were overexpressed in major chords.10 This finding suggests that humans naturally associate major and minor tonalities with distinct feelings, making it an intriguing variable of study. In this pairing, the melodies were fundamentally the same except for a difference in half step in the musical third, which shifted the mode from major to minor.
After this, I designed 2 pseudoword phrases, each with 4 syllables to rhythmically align with the melodies. Each phrase was constructed to evoke either a “sharp” or “round” phonetic association. I designed these phrases using findings from Bouba Kiki research which identified certain consonants and vowels as being most strongly associated with sharp (“kiki”) shapes or round (“bouba”) shapes. The letters with an 80% or greater association with roundness included B, O, U, A, M, and L. Alternatively, the letters with an 80% or greater association with sharpness included I, K, and T. Using these phonetically disparate groups of letters, I generated the round and sharp pseudoword phrases “Bluba Lobu” and “Kiti Kiti”
Through an online survey on google forms, participants listened to each melody pairing and selected the pseudoword phrase they felt best corresponded to it. The melodies were played twice in random order to account for the primacy effect, where participants may be more likely to remember or favor the first melody they hear11 . Participants were allowed to rewind the audio files and listen to the melodies as many times as they wanted. The goal was to test for innate phonetic associations, not the memorability of musical elements.
Before the beginning of the experiment, participants completed a short questionnaire collecting demographic and musical background information. This included their age, their 3 favorite genres, native and secondary languages, and any prior musical experience they had. Participants who indicated having musical experience were asked to specify the instruments they played and the duration of their experience.
Figure 2 These graphs show the percentage of round and sharp biases for consonants and vowels.
Figure 2 These are the waveforms of the 2 melodies with different timbres The top one, “Sharp Cut Bass”, has a very precise attack and decay and a short envelope. In contrast, the bottom one has a very gentle attack and a steady envelope
Results
Musical Experience among participants: Participants first languages:
Key
=
=
Blue
Kiti Kiki
Red
Blobu Lobu
Timbre Pitch
Octave Mode
Discussion
The results suggest humans have strong associations between phonetic sounds and certain musical features, especially timbre, key, and octave. The strongest associations occurred in timbre. 90% of participants matched the “Sharp Cut Bass” timbre with the Kiki-style phrase “Kiti Kiki”, and the “Rounded Square Bass” timbre with the Bouba-style phrase “Bluba Lobu”. When examining the waveforms of the two timbres, the attacks and decays of “Sharp Cut Bass” appear far more defined than those of “Rounded Square Bass”. In the waveform of the Kiki associated melody, the notes are sharp, pronounced, and evenly divided between eighth notes. In contrast, the waveforms of the “Rounded Square Bass” featured softer attacks and decays, causing each note to blend gradually into the next. These results suggest associations between angular phonetic sounds and timbres characterized by more abrupt attacks and decays.
The overtone frequencies of the different timbres also seemed to impact our phonetic associations. Using the Logic Pro X multimeter analysis plug in, I was able to determine the fundamental and overtone frequencies of each melody. The “Sharp Cut Bass” had a noticeably higher frequency range than the “Rounded Square Bass”. While it reached a maximum fundamental frequency of 300 hertz, its overtones were as high as 1,000 hertz. In contrast, the “Rounded Square Bass” reached a maximum fundamental frequency of 150 hertz, with overtones extending only to approximately 250 hertz. Although timbre does not necessarily alter a note's fundamental frequencies, it does deeply affect the harmonic intensity of additional overtones. The difference in range of overtone frequencies of the two sounds was 750 hertz. The substantially higher range of overtones among the “Sharp Cut Bass” suggests that sharper sounds may be intuitively associated with higher frequencies, while rounder sounds are associated with lower frequencies.
Ultimately, the results of the timbre melody pairing suggest that participants associate higher frequencies and more pronounced attacks and decays with sharper phonetic sounds, while associating lower frequencies and softer attacks and decays with rounder phonetic sounds.
The second strongest associations occurred in the pitch melody pairing. 85% of participants matched the higher-pitched melody with the Kiki-style phrase, and the lower-pitched melody with the Bouba-style phrase. This once again supports the proposition that we intuitively connect higher pitches to angular phonetic structures.
There were also strong associations between octave and phonetic sound. 75% of participants matched the higher octave with the Kiki style phrase and the lower octave with the Bouba style phrase. Since octaves have a frequency ratio of 1:2, the octave with double the frequency was perceived as “sharper”, further reinforcing the idea that higher pitch correlates to angular phonetic sounds like “Kiti Kiki”
Mode, however, revealed inconclusive results. 55% of participants associated the kiki-style phrase with the minor melody and Bouba-style phrase with major melody. Considering the relatively small sample size (n = 30), this distribution is not lopsided enough to produce a strong
claim about the relationship between mode and phonetics. Perhaps a larger sample size would reveal a pattern, but within this dataset, mode does not seem to play a significant role in dictating phonetic-musical associations.
Ultimately, these findings strongly suggest that we have subconscious cross modal associations between musical features– particularly related to frequency and sound contour— and phonetics. Participants naturally matched higher pitched melodies and more intense timbres with sharper consonant and vowel sounds. Alternatively, participants associated lower pitched melodies and softer timbres with rounded consonants and vowels.
These findings suggest that our brain treats “sharpness” and “roundness” as general sensory triggers that apply to music, speech, and potentially other sensory systems.
Because my experiment used the Bouba Kiki data to construct the 2 phonetic phrases, the observed associations may extend into visual associations as well. This implies a potential connection between auditory frequencies and visual shapes, where high frequencies correspond with jagged shapes and low frequencies with circular shapes. The idea that we associate certain musical features with round and sharp shapes is a fascinating reflection of our brain's neurological organizing systems, where sensory pathways are connected across music, phonetics, and visuals– mirroring synesthetic-like experiences.
In future experiments, additional controls should be implemented to further isolate each variable and improve validity. For example, my timbre test had confounding variables that made it difficult to pinpoint the exact cause of the phonetic associations. Volume was one of these confounding variables. Even when external volumes remain the same, different timbres created a difference in perceived volume.12 We perceive timbres with more abrupt attacks as louder in volume and timbres with softer attacks as lower in volume.13 In this experiment I did not control for differences in physiological volume, so it is possible that the phonetic associations were related to volume instead of timbral content. Similarly, higher frequencies often produce a difference in perceived loudness, so there is a slight chance that phonetic associations are explained completely by differences in volume.14 In future experiments, timbres should be completely isolated by using the same sound and manually altering the attacks and decays, adjusting the volume levels until both are perceived as identical in loudness.
Additionally, in future experiments, the participant pool should be more representative of the global population in terms of diversity of language and musical experience. In my current experiment, the sample size consisted of 30 participants. 90% of participants had previous musical experience, with 60% playing both a musical instrument and singing. Because a large number of participants were musically inclined, they might be particularly sensitive to musical elements and make judgments based on factors that naive listeners would not consider Having a participant pool with less musical experience may provide results that better align with the general population rather than those especially sensitive to music. Moreover, 80% of participants spoke English as their first language. Certain phonetic sounds may be more prevalent in English than other languages, resulting in uniquely English associations, and
possibly introducing a linguistic bias. Just as the Bouba Kiki experiment was tested across 25 different languages, it would be intriguing to see how music and phonetics are associated through a multilingual population. With a more general and unbiased participant pool, the results may be different and more applicable to everyday life.
Ultimately, my study suggests a meaningful relationship between certain musical characteristics and phonetic features. For future research, it would be compelling to analyze how these associations shape the commercial music industry and our personal musical preferences. For example, which genres are more Bouba versus Kiki, and do these associations account for the differences in popular music preferences? Additionally, do mainstream billboard charts contain more phonetically sharp sounds than phonetically round sounds? Although we may not notice them consciously , these subconscious cross-modal sensory associations may impact not just our personal musical taste, but also broader trends in songwriting, production, and the mainstream audiences. These phonetic associations not only offer insight into how our brains process internal sensory experiences, but also raise compelling questions about how phonetics can influence songwriting and listening preferences within contemporary popular music and beyond.
References
1. Ćwiek, A et al. The Bouba/Kiki effect is robust across cultures and writing systems | philosophical transactions of the royal society B | royal society Available at: https://royalsocietypublishing.org/rstb/article/377/1841/20200390/108730/The-bouba-kiki-effect-is-robust-across-cultures. (Accessed: 15th May 2026)
2. ibid.
3. ibid.
4. 1.Marian, V It’s a Bouba, not a Kiki: The relationship between sound, form, and meaning. Behavioral Scientist (2023). Available at: https://behavioralscientist.org/its-a-bouba-not-a-kiki-the-relationship-between-sound-form-and-meaning/. (Accessed: 15th May 2026)
5. 1.Hubbard, E. M. & Ramachandran, V S. Neurocognitive Mechanisms of Synesthesia. Science Direct 6. ibid.
7. 1.Bragança, G. F. F., Fonseca, J. G. M. & Caramelli, P. Synesthesia and music perception. Dementia & neuropsychologia (2015). Available at: https://pmc.ncbi.nlm.nih.gov/articles/PMC5618987/. (Accessed: 15th May 2026)
8. 1.Borra, T., Versnel, H., Kemner, C. & Ee, R V Octave effect in auditory attention | PNAS. Proceedings of the National Academy of Sciences Available at: https://www.pnas.org/doi/10.1073/pnas.1213756110. (Accessed: 16th May 2026) 9. ibid.
10. 1.Kolchinsky, A., Dhander, N., Park, K. & Ahn, Y-Y The minor fall, the major lift: Inferring emotional valence of musical chords through lyrics | royal society open science | royal society Available at: https://royalsocietypublishing.org/rsos/article/4/11/170952/93447/The-Minor-fall-the-Major-lift-inferring-emotional. (Accessed: 15th May 2026)
11. 1.Pilat, D & Sekoul Krastev, S. Primacy effect. The Decision Lab Available at: https://thedecisionlab.com/biases/primacy-effect. (Accessed: 15th May 2026)
12. 1.Town, S. M. & Bizley, J K. Neural and behavioral investigations into timbre perception. Frontiers in systems neuroscience (2013). Available at: https://pmc.ncbi.nlm.nih.gov/articles/PMC3826062/. (Accessed: 15th May 2026) 13. ibid.
14. 1.Joshi, S. N., Wróblewski, M., Schmid, K. K. & Jesteadt, W. Effects of relative and absolute frequency in the spectral weighting of loudness. The Journal of the Acoustical Society of America (2016). Available at: https://pmc.ncbi.nlm.nih.gov/articles/PMC4723418/. (Accessed: 15th May 2026)
This Is Your Brain on Ads
Emily A
Mentor: Carlos P.
Abstract
Food, beauty, and sports marketing often use the color red to catch the eye of consumers. This study explored the neuroscience behind various marketing strategies using the color red via survey and Electroencephalographic (EEG) data with 95 students at Saint Ann’s School. For the survey participants, the survey showed different images of Coca-Cola, Rhode Beauty, and Chicago Bulls advertisements with one image predominantly in red, and the other with less red. Then it asked a series of questions to record observations of which advertisements influenced their decision-making more. For the EEG participants, we used a Muse 2 headband to track their brain waves when looking at the same images as the survey Electrodes on the headband were able to track what happened in each participant’s prefrontal cortex, providing data reflecting neurological changes in real time. The data from the survey and EEG had striking similarities in mood changes and attention.
Introduction
Red is a strong color that carries deep meaning and can spark powerful emotions in people. Across cultures, red holds some of the most potent symbolic associations of any color. The Chinese consider red to be good luck and a symbol of prosperity. In Western cultures, red is simultaneously the color of love and romance, danger and warning, passion and aggression. This unique quality carries deep meaning that few other colors can match. While in advertising, the power of red is frequently used across a wide variety of industries. Marketers know this eye-catching color will help their products stand out. It is the color most associated with a sense of urgency. This is why "SALE" tags are almost universally red. It is also the color most associated with appetite stimulation, which has been studied extensively in food psychology. Charles Spence, a research psychologist at Oxford, found that red triggers what he calls 'cross-modal correspondence' which activates not just visual attention but also heightened sensitivity, priming the brain to perceive food as more appealing before it is even tasted.¹
Red also carries connotations of confidence, power, and dominance, which is why it is commonly used in beauty marketing. Sports car ads often use red, capitalizing on it as a sign of strength and speed⁴ . While the NFL's Red Zone literally uses the color in its name during its high-energy highlight show Many sports teams have red uniforms because it strikes the viewer's eye.
In traditional color theory, red sits at the warm end of the spectrum alongside colors picked up by the eye first. On the other side of the color spectrum there are cool tones like green, blue, and purple. This optical property means red naturally draws the eye before surrounding colors have a chance to compete. Red also has the longest wavelength of any visible color in the spectrum, at approximately 700 nanometers, which means it penetrates visual processing quickly and is detected faster than other hues by the human eye²
This study was developed to try to understand why red is used so often and to get an idea of what is happening inside the brain while consumers are observing ads. To accomplish this, a multidisciplinary approach was taken, combining psychology, neuroscience and marketing to evaluate subject responses to marketing materials featuring the color red.
The ads were selected for their use of the color red to grab attention and appeal to a young (13-25 years old) consumer demographic. In the Coca-Cola ad, the marketers capitalized on the popularity of teens sharing things with their friends on social media and created personalized bottle labels intended to be shared. This campaign is called “Share-a-Coke” Rhode’s association with co-owner and social media star Hailey Bieber is widely known among young people and appeals to that audience without even showing her face. Rhode utilizes red to jump out at consumers, which is different from their usual clean and simple aesthetic. The packed stadium in the Chicago Bulls ad conveys high energy and excitement as only the color red can.
The study was designed to compare ads with high concentrations of red against ads with little or no red at all. Using ads with multiple different colors would introduce too many variables, since people hold individual emotional associations and biases toward different colors that could influence their responses for unrelated reasons. Isolating red as the single variable makes it easier to attribute differences in participant responses directly to the presence or absence of red, keeping the results clear and focused.
The same experiments were also conducted through an electroencephalograph, specifically through the use of a Muse 2 headband. The Muse 2 is a lightweight band that is placed across the forehead and tucks behind the ears. Two EEG sensors/electrodes (FP1, FP2) are in front of the forehead touching the skin, and two behind the ears (T9, T10) These sensors track Gamma, Beta, Alpha, Theta, and Delta brainwaves in the frontal lobe. mainly focused on Beta, Alpha, and Theta because those relate the most to decision-making and emotional processing in the context of this study. Beta increasing is associated with active processing, attention, evaluation, and decision-making. This is useful to see when consumers’ attention is focused, and if they are ready to make a decision about the product. Decreasing Alpha waves are associated with the brain engaging more with the image, while increasing Alpha waves means the person is more relaxed, less visually engaged, or zoning out. Analyzing Alpha waves provides data of what images and ads people find interesting and therefore would make them want to purchase the product. Increasing Theta waves could indicate that the person is having an emotional response, or they are remembering something. This is very useful because marketers are always trying to induce emotion in consumers so that they will associate a feeling with their product. However, there is no way to track if this is an emotional response or memory through the Muse Headband. Lastly, there is also a reference sensor that detects the activity of your brain and heart rate, but that feature is not useful for this study. It can provide a good baseline to see how accurate the waves are and how energized the participant is to begin with. The headband collects and records the data via a Bluetooth app and constructs a multiline graph with time stamps for each of the waves. The units are in decibels (dB); those numbers show the strength or amplitude of each brainwave band at that moment.
Materials and Methods
Survey
The majority of my research was done through a survey. Since all of these advertisements were targeted to younger people, we decided to test high school students at Saint Ann's School. First, we asked some demographic questions like grade and gender to
Figure 4 Muse 2 sensor points at FP1, FP2 on forehead Figure 5 Muse 2 Electroencephalograph Headband Device and points T9 and T10 above ears
understand the response pool. Then we accounted for previous biases by asking how familiar they were with these brands and products. If a participant specifically dislikes or loves a brand, their answers may be skewed based on previous knowledge or experience instead of having a fresh look at these advertisements. We also asked what emotions they associate with the color red because that may also impact their opinion on the advertisements. The first advertisements we showed were the Share-a-Coke images. One was almost entirely red, while the second was black and white (shown in Figure 1). Next, the Rhode images were shown, they featured a spare design with mostly grey subjects with pops of red, white and pink (shown in Figure 2). The final image was the Chicago Bulls stadium. One featured an entirely red scene including the basketball floor and stadium seats while the other showed a wooden basketball floor with the red seats (shown in Figure 3). The survey's follow-up questions analyzed each participant's decision-making. Next, we asked, “Which image do you prefer?” as a baseline to see if red is catching consumers' attention more.
EEG
After the headband was in close contact with the skin, subjects were shown the same images from the survey, but instead of having them grouped together, each ad was shown individually (around 20 seconds each) in the following order: 1) Share-a-Coke ad; 2) the grayscale Share-a-Coke ad; 3) each Rhode image: first the red font, then white font, lastly the pink font; 4) the majority red Chicago Bulls stadium; 5) the normal Chicago Bulls stadium. Then, they took the survey to ask about emotional connections to the color red as well as possible association within the EEG data since the EEG does not detect emotions.
Figure 1 Share-a-
Coke ad in red and black and white
Figure 2 Rhode Beauty ad, lip glosses with various colored writing
Results Survey
In total, 95 responses were received from those who took the survey 89 people (93.7% of participants) reported they liked the red Share-a-Coke ad instead of the black and white version. And 80% of those participants said it was because “the ad is more engaging.” Then we asked again what emotions they feel after viewing the ads, and 36.8% of participants reported they feel “hungry” with the Share-a-Coke ad, whereas before the study only 29.5% of participants said they associate hunger with the color red.
For the Rhode images (shown in Figure 2) 44.2% of participants reported they liked the image on the left, the red font image, 32.6% prefer the white font image, and 23.2% prefer the pink font image. Over 80% of participants who said they prefer the red font image said it was because of the “contrast in colors”. No participants that preferred the pink or white font image said that it was because of the “contrast in colors” When asked which emotions they associate with the color in the Rhode images, over 65% said “calm”. Originally, only one person said they associate “calm” with the color red. Therefore, more people could have tied this to the white or pink version.
The Chicago Bulls stadium images (Shown in Figure 3) are a comparison of sports stadiums, one with red seats and court, and one only using red on the logo on the court. 63.3% of participants said they preferred the bottom image (the one with less red), and 33.7% of participants preferred the top (the one with lots of red). 58.9% of participants said it was because they “like the use of color”, over 65% of those people preferred the bottom image. 24.2% of participants said that “it looks more original,” and 100% of those people also preferred
Figure 3 Chicago Bulls stadium featuring all red floor and wooden floor
the bottom image. However, all 33.7% of participants who preferred the top image said it was because the stadium “looks more entertaining”. EEG
It is extremely difficult to actually notice a change in brainwaves using the Muse because it was not designed for this kind of study However, the EEG had relevant correlations for each of the images. For example, when people viewed the red Share-a-Coke, in most cases, Alpha decreased (Figure 7). When people looked at the grayscale version directly after, there was no change in the Alpha waves compared to what people saw right before (Figure 8).
The Rhode ads saw a drop in Alpha waves for the first red image, showing that they were re-focused after the black and white image. And when it switched to the white and pink images the waves went up a little when it first switched and remained relatively steady for the rest of the duration of Rhode images, similar to the Share-a-Coke images (Figure 9).
Then, for the Chicago Bulls images, there was a decrease in Alpha waves for the red image, and there was a large increase in Theta waves of around 10 dB (Figure 10).
Figure
Figure 10 EEG result for Chicago Bulls ads Theta waves start at 4 dB and reach Over 14 dB, and Alpha waves are the ones that start at 10 dB
Discussion
Survey
The 93.7% of participants choosing the red image supports the connection between the color red subconsciously triggering a hunger response in the brain. In this way, Coca-Cola has succeeded since they’ve acknowledged that the reason they use red is to make its consumers feel hungry.
Interestingly, two participants reported that they associated red in this image with “Hunger”, which was not at all Rhode’s goal. This could be lingering effects or feelings from the Coke ad. Both of those participants had said that they felt hungry after viewing the Share-a-Coke ad. As for the red font Rhode image, especially compared to the lighter colors that blend in more easily, it makes sense that the red would stick out.
Data from the Chicago Bulls ads show that for sports games, people tend to like a classic look for the stadiums instead of the overly saturated look with the red flooring. If people grow up watching sports games on Stadium floors that are typically wooden, then they might associate that feeling that they had watched games in the past with the stadium they are looking at. So a red stadium might seem overwhelming because it is new and unlike what people are used to.
EEG
The waves from the Share-a-Coke ads demonstrate that red caught participants’ attention very quickly, which also aligns with the survey data. Revealing, as predicted, that when there are two images that are the exact same except for color, the red one will be more engaging than the one without color.
The red font Road image people found more engaging to look at according to the EEG. and the white and pink images have similar effects of calmness in the brain, which aligns with survey data as well.
For the Chicago Bulls ads, the waves indicated they were more engaged and emotionally responsive to red. For several participants, the Alpha waves increased for the second image during the entire 20 second viewing cycle. This is very interesting because it does not align with the data from the survey. The majority of participants said that they preferred the second image to the first one in the survey, but from the EEG results, one can gather that most people prefer the first image. This is a psychological paradox because what is going on in their brain and what they think is going on in their brain are opposite. The EEG spike shows that participant’s brains were more engaged when exposed to the first, mostly red image, even though the survey showed they did not prefer that image. This proves that even if you don't like the color red or its use in an image, it will always be the color that catches your eye first and spikes a more engaged brain response. Here, red is being used to make consumers more excited to watch the game. So participants acknowledge the purpose of red in these images and admit that they are working.
Conclusion
The data from the survey and from the EEG complemented each other very nicely when they were compared. So the survey was definitely a useful way to correlate common emotions
participants chose with their EEG data. Moving forward, the study could be done with other colors in marketing besides red. But again, comparing two colors with each other could have misaligned reasons for the results. One way it could work is by using colors that are on opposite sides of the color wheel with specific emotional connotations and associations in marketing. If the red image had been compared to an image in a different color instead of black and white, there most likely would be an emotional aspect attached to the other image. For example, yellow and blue, because yellow typically represents energy and happiness, while blue represents sadness or calmness. A more expansive study could go deeper into why participants are picking certain ads and have each participant explain their feelings in real time while looking at the ad, instead of mainly multiple choice questions. And it touches on other areas of marketing like political campaign posters and videos, event marketing, or even email marketing. Ultimately, the study is a useful jumping off point to understanding consumer behavior behind the ways the brain responds to the use of red in advertisements.
References
¹ Spence, C (2015) On the psychological impact of food colour Flavour, 4(21), 1–16 https://doi.org/10.1186/s13411-015-0031-3
² "The Science Behind Why Objects Appear Red " SoftHandTech https://softhandtech.com/how-does-an-object-appear-red/
³ Hutchings, John. "Does Colour Really Affect Our Mind and Body?" The Conversation. https://theconversation com/does-colour-really-affect-our-mind-and-body-a-professor-of-colour-science-explains-8 4382
⁴ "The Psychology of Color in 2026 Digital Advertising " Jasmine Directory https://www.jasminedirectory.com/blog/the-psychology-of-color-in-2026-digital-advertising/
⁵ Tischler, H , et al "Impact of Colored Light on Cardiorespiratory Coordination " National Institutes of Health/PubMed Central, PMC3893775. https://www.ncbi.nlm.nih.gov/pmc/articles/PMC3893775/
⁶ Kim, H., and Jang, J.M. "Disadvantages of Red: The Color Congruence Effect in Comparative Price Advertising." Frontiers in Psychology, 2022 National Institutes of Health/PubMed Central, PMC9712978 https://www.ncbi.nlm.nih.gov/pmc/articles/PMC9712978/
⁷ "The Multifaceted Psychological Power of Color: From Somatic Memory to Consumer Behavior " Get Therapy Birmingham. https://gettherapybirmingham com/the-multifaceted-psychological-power-of-color-from-somatic-memory-to-cons umer-behavior/
⁸ "Will Color Psychology and Neuromarketing Revitalize Your Brand?" The Innovation / Medium https://medium.com/the-innovation/will-color-psychology-and-neuromarketing-revitalize-your-brand-5fbbaafd526 e
The Final Frontier
Jordan Y.
Mentor: Henry K.
Abstract
Space is a wondrous place. Mysterious, the final frontier, and unpredictable. Along with the oceans, space is one of the few places we have not fully explored yet, and that leaves imagination to fill in the edges that science cannot currently reach. Just like the oceans, space might hold untold secrets. One of these secrets could be the existence of extraterrestrial life. Everyone has thought about it at least once: “What if we aren’t the only ones out there?” Well Mr. Kanel and I have created a model that can try to answer this question. Hypothetical, but based on real science, our model takes into account theories like The Kardeshev Scale, The Fermi Paradox, and more to see what mysteries might be unraveled about the true Final Frontier.
Introduction
Scientists still have yet to decide if there are other lifeforms out there in the Universe that are like us: complex and intelligent, and my project serves to answer that question. Currently we have been dedicating a vast majority of our resources into Space Exploration for multiple reasons. One of these reasons is to find life, intelligent or otherwise, on a different planet or moon. Even though we have not found any extraterrestrial life forms explicitly, we have found evidence of some planets and moons being able to sustain life, or used to be able to sustain life, and we can make certain assumptions about life and how it might be able to arise on different planets. Taking Earth as an example we can make the assumption that life cannot be based on Silicon or Nitrogen, or at least rule them out as possible options due to our lack of knowledge and feasible data about said hypothetical life forms. This was about understanding, not necessarily experimenting, so as stated before a few assumptions were made in the making of this model. However, all of them have scientific backing. This project was not necessarily literary or experimental, as all of the data comes from the model that was created during the project itself instead of outside sources. This adds another layer to the project, because due to the nature of this project it can also be a test of our current technological capabilities to code such a model, and if the tools to do so are widely available to the public. This model was the entire cornerstone of my project, as well as the main reference for my data collection and intuitions throughout this paper.
Materials and Methods
Throughout the whole year I coded a scientific model that could show us a hypothetical view of how Alien Civilizations could evolve in the universe as well as interact, trying to build a cosmic ecosystem of sorts based on real science. It starts off by generating a 10,000 by 10,000 parsec grid, mimicking a section of the universe. All star type rarities were based on real life, and the progression of time goes by as millions of years per second. The model, at its current stage, also takes into account multiple interstellar variables to arrive at a conclusion. These include, but are not fully limited to, Supernova Rate, Cometary Impacts, Panspermia Rate, and the Emergence Rate of life itself. In the model these four factors are the main limiters that can be controlled based on sliders. Supernova explosions in my model serve multiple functions. In a certain radius they completely destroy any forms of life or habitability in the surrounding solar systems. However in the perfect range a Supernova can seed a Solar System with the necessary elements needed for life to emerge or progress or speed up the evolution of life from primitive to complex exceptionally quickly.1 Similarly comets can also seed life due to the rocky ice melting into water during an impact as well as through the possibility of Panspermia.2 Panspermia is when life from one solar system migrates to the other via natural or unnatural means.2 For instance in the model life might drift on floating debris or be willingly sent to a separate planet by an intelligent civilization. Going more in depth each civilization that arises will also have a chance to interact with its neighboring civilizations, whether through war, peace, alliances, conquest, or avoidance. Every active civilization had a level of energy that they would emit as well, leaving those who conquered more interstellar territory easier to detect due to the high energy output of the civilization.
Results
The results were shocking. At any one time there were about 20-40 intelligent ETCs (Extra Terrestrial Civilizations) that were active throughout the universe. They mostly reacted to other civilizations in war and conquest, harvesting the energy from their local cluster of stars for themselves. They were extremely active, and while a few attempted to conceal their presence, a large majority of them did not. In terms of intelligent life, which is life that was intelligent but not yet “civilized”, there was about double to triple the amount of instances than those of civilizations. Under perfect conditions and little environmental pressures there were about 100 active civilizations in the universe and about 250 instances of intelligent life, with microbial life being even more common. Almost all instances of life that emerged in solar systems like ours evolved to the state of becoming an Extra Terrestrial threat.
Discussion
So what does this mean? Well it could mean a variety of things. If the model is realistic enough it should, in theory, paint a picture of our real life situation. However in the model ETCs are somewhat common and we have not found a single instance of life like us. Granted, the model does not take into account Silicon or Nitrogen based life. However even though the model only included Carbon based life, ETCs were very active in broadcasting signals and being in interstellar wars. That could imply that we are in fact the only life like us in the universe, as if there were ETCs out there they would be actively broadcasting their signal to us and we would be able to find them. That could also mean that they are one of the few instances of ETCs to hide their presence from us, as in the model this also occurred. However it seems much likelier that there are no ETCs that are currently active unless they can somehow evade our extremely advanced detection methods. Either way aliens do not seem to be something we will find in the near future and possibly forever, as if they were already active we would know and we would be able to find them.
This model has still yet to be “completed” in the standard sense. However science is always adapting and evolving, and if new information appears that can enhance the model and its accuracy I will continue to update and improve it to continue to get the most modern results possible. Additionally this model only takes into account a certain region of the universe, and due to the differing environments across the galaxy it must either be generalized or localized. Either way it will be missing a few areas in terms of accuracy, so implementing a larger range of interstellar environments in future variations.
References:
1 "DOE Explains Supernovae " In Office of Science Accessed May 17, 2026 https://www energy gov/science/doe-explainssupernovae
2. "Comet Impacts Could Bring Ingredients for Life to Europa's Ocean." Unpublished manuscript, The University of Texas, Austin, Texas, December 15, 2022 Accessed May 17, 2026 https://www jsg utexas edu/news/2022/12/ comet-impacts-could-bring-ingredients-for-life-to-europas-ocean/.
3. Kawaguchi, Yuko. "Panspermia Hypothesis: History of a Hypothesis and a Review of the Past, Present, and Future Planned Missions to Test This Hypothesis " Unpublished manuscript, Harvard University, 2019 Accessed May 17, 2026 https://doi.org/10.1007/978-981-13-3639-3 27.
emphasize “natura
lThe Effects of Sensory Inputs on Brain Waves
Asha M.
Mentor: Justin P.
Abstract
The study investigated how different sensory inputs–specifically auditory inputs–affect brainwave activity. Using an EEG device, we measure brainwaves under different sound frequencies, for example 1Hz, 6Hz, 8Hz, and 20Hz. The purpose was to see how external sounds influence corresponding brain waves. Using previous studies which indicate which brain waves are most prominent in different activities like studying or relaxing, it can be concluded that stimulating these brain waves using external inputs can help people switch their focus quickly, encouraging the mental state they need for these activities. We tested the effects of listening to different sound-frequency binaural beats on people’s brain waves to then see which frequencies stimulated which brain wave bands. Overall, these tests and analyses indicate how different auditory inputs can influence brainwave activities and therefore their physiological states. This research can be utilized to help people relax or concentrate, for instance promoting better sleep by triggering restful states, or helping people study by triggering concentrative states.
Introduction
While the use of sensory inputs on brain waves has been well studied for sleep patterns and insomnia, the effects during conscious states have been much less focused on. The act of rapidly switching focus and activities has become a more necessary part of our society today, but it takes time and effort for our brains to rearrange for the mental state we need for each activity. This is why it is difficult to immediately start working after waking up, or calming down and getting into a sleep state after a stimulating day of work.
Based on previous studies, we concluded that delta-wave activity is stronger during relaxation or sleep. We further verified this by measuring people’s brain waves while they had been in a relaxed state for a while, using an EEG headband to see which brain waves were most stimulated. Theta activity is often most prominent in meditative states, a similar result to stimulated delta waves but slightly more stimulated. Alpha waves and gamma waves have been shown to be most stimulated while someone is in deep concentration or doing many tasks at once. We saw this in our own testing as well, since testing someone who had been concentrating on writing a paper for a while showed a strong alpha wave activity
Using this baseline information then allowed us to see how auditory inputs affect different brain waves and what this indicates about how they relate to different mental states like concentration versus relaxation.
Testing
We used an EEG headband to measure different people’s brain activity while listening to binaural beats from frequencies of 1 Hz to >20 Hz. We used the results from someone who had the most common results among our test subjects to show how different frequencies correlate to different brain waves:
Observation
The graph shows strong delta spikes around the middle and later parts of the recording, while alpha and theta remain moderate. This makes sense because delta frequencies = associated with deep bodily relaxation and internal restoration. Listening to a low-frequency noise causes slower neural oscillations.
Conclusion
The 1 Hz stimulus appears to partially entrain slower brain rhythms.
Observation:
A major delta spike appears early, but theta is relatively high throughout. Theta is linked to meditative awareness and inward attention. The initial delta spike may reflect the brain adapting to the rhythmic stimulus and synchronizing temporarily.
Conclusion: Theta frequencies are close to natural meditation rhythms.
Delta 1Hz
Theta 6Hz
Beta/Gamma (16hz – 32 Hz)
Observation
Alpha remained relatively stable with moderate increases and less dramatic spikes.
Alpha represents calm wakefulness. The stability suggests a relaxed but conscious state. This is what would be expected from alpha-frequency stimulation.
Conclusion:
The 8 Hz stimulus maintained relaxation rather than stimulating alertness.
Observation
More irregular activity and multiple sharper peaks across bands.
Higher frequencies increase cognitive engagement and sensory processing. Beta and gamma are associated with concentration and active thought.
Conclusion:
Frequencies around 16 Hz and above promote concentration.
Alpha 8 Hz
Observation
Stronger and steadier alpha dominance than Alpha 8 Hz.
10 Hz is near the classic alpha peak for many people (around 10 Hz), so stronger resonance is expected.
Conclusion:
This may represent the strongest relaxation condition.
Observation
Sharp beta increase and greater activity fluctuations.
Beta = concentration and mental activity.
conclusion:
Over 20 Hz frequencies stimulate alert cognitive states.
Alpha 10Hz
Beta 20 Hz
Results
Analyzing graphs and spikes in certain waves like alpha and delta waves showed that low-frequency sounds (1Hz) increased delta-wave activity, and that higher-frequency sounds (>6Hz) corresponded to increased theta activity. Since we concluded that delta-waves correspond to a restful state, these frequencies could help people relax or relieve anxiety much faster than without any external input. Since theta activity has been linked to solitary and meditative states, frequencies around 6Hz can promote a better brain state condition for meditation. In our tests, even higher frequencies like 20Hz resulted in higher beta and gamma-wave activity while also including greater delta spikes and more brain-wave crossovers. This type of brain activity is most prominent when we test it on people in deep concentration, indicating that higher frequencies could be beneficial for a person’s cognitive engagement.
References
1 Deshmukh V D (2023) The Electroencephalographic Brainwave Spectrum, Mindful Meditation, and Awareness: Hypothesis International journal of yoga, 16(1), 42–48 https://doi.org/10.4103/ijoy.ijoy 34 23
2 Elsevier (n d ) Brain waves In ScienceDirect Topics Elsevier https://www.sciencedirect.com/topics/agricultural-and-biological-sciences/brain-waves
3 Lim, S , Yeo, M , & Yoon, G (2019) Comparison between Concentration and Immersion Based on EEG Analysis Sensors (Basel, Switzerland), 19(7), 1669 https://doi org/10 3390/s19071669
4. Graves, A. R., Moore, S. J., Bloss, E. B., Mensh, B. D., Kath, W. L., & Spruston, N. (2012). Hippocampal pyramidal neurons comprise two distinct cell types that are countermodulated by metabotropic receptors Neuron, 76(4), 776–789. https://doi.org/10.1016/j.neuron.2012.09.036
5 APA 7th edition: Sleep Foundation (2025, July 10) Alpha waves and sleep Sleep Foundation https://www.sleepfoundation.org/how-sleep-works/alpha-waves-and-sleep
6 Cleveland Clinic (2025, September 29) Electroencephalogram (EEG): What it is, procedure & results Cleveland Clinic https://my clevelandclinic org/health/diagnostics/9656-electroencephalogram-eeg
Oh Em GMO! A study on the correlation between price points/marketing and genetically modified foods
Grace A , Katerina L Mentor: Asia J
Abstract
Is there a correlation between the price and health of food and how much it is genetically modified? In New York City, some areas have abundant options of things to eat. Other neighborhoods, however, are food deserts. Food deserts are areas where healthy, nutritious food is accessible in both distance and price. Stemming from the controversies and stigma that genetically modified organisms raise, we wanted to investigate the health, history, and impacts of GMOs and how they relate to socioeconomic status in New York. Along with research of past studies on the subject of GMOs, we decided to conduct our study using maps to find food deserts and places with many supermarket options. We gathered products from a variety of stores from Bodegas to name brand stores like Wegman’s. Then, we used Polymerase Chain Reaction (PCR) and Gel Electrophoresis to test for one of the most commonly added promoters: Cauliflower Mosaic Virus 35S (CaMV-35S). Our results demonstrated that despite their price differences, they all tested for the same promoter These findings exhibit that the GMO we tested for, CaMV-35S, can be found widespread throughout New York’s downstate region regardless of price point and availability.
Introduction
In food marketing, we see the term “not Genetically Modified” as a sign of being natural–therefore appealing. But what actually is the downside of a food being genetically modified? Genetically modified organisms (GMOs) are biotechnology methods to alter the DNA of a crop, plant, or protein in ways that do not occur naturally. One example of a GMO is Rainbow Papaya, which was developed to combat Papaya Ringspot Virus– a virus that stunted papayas’ growth. This widespread disease caused production to drop by 50% between 1993 and 2006. The protein that was added to papayas resulted in the breeding of a new brand of papaya called SunUp. These were marketed as resistant to the Ringspot virus.2 The discovery of this gene saved Hawaii’s papaya industry from economic collapse.
The driving force behind researching genetically modified foods is driven by a variety of factors. As the population grows, there is an increased need for food. The area of arable land is not sufficient with the growth of urbanization and climate change’s effect on water and soil. This means genetically modified and engineered food is critical to improve food quality and quantity sustainably for a growing population. Now, one in eleven people suffer from (world) hunger,
making malnutrition one of the world’s largest crises. Along with the global need for an access of healthy food, genetically modifying produce has other benefits, Genetically modifying produce can alter it to make it the following:
a. More nutritious
b. Tastier
c. More disease and drought-resistant, for example a food could have less need for water or fertilizer.
d. Insect-resistant: allow less use of pesticides
e. Increased supply of food with reduced cost and longer shelf life
f. Faster growing plants
g. Food with more desirable traits (such as potatoes that produce less of a cancer-causing substance when fried)
For our study, we are testing produce from different locations in New York City to see if they contain the CaMV-35S Promoter, which was derived from the cauliflower mosaic virus and nos Terminator. This promoter, or a variation of it, is found in over 60 % of all transgenic crops currently grown worldwide. The Cauliflower Mosaic Infection was described in scientific literature as early as the 1920s in the United States and was the first plant pathogen to be identified as a double-stranded DNA virus. The effects of the Cauliflower mosaic virus (CaMV) were first noted in 1921 in Chinese cabbage, where it caused mosaic-like necrotic lesions on leaf surfaces. The virus was researched first as a disease affecting cabbage growth in the midwest and California. We chose this promoter to research because it is one of the most widespread GMOs added to U.S. produce. It is also one of the most researched GMOs.
Our hypothesis was that the food items we sourced from food deserts (places in the city with less access to a variety of/healthy food) would test for the GMO CaMV Promoter and NOS terminator whereas the products from reliably sourced brands in large chain supermarkets will not test for the GMO or not test for as much.
Materials and Methods
We used Food Desert’s maps of food deserts around New York City to locate stores to purchase our produce to test. The website maps food deserts across the United States while also mapping other things like car ownership and percentages of people living under the poverty line. Represented in Figure 1, there is an abundant amount of supermarkets and food stores in mid and lower Manhattan. In the northern-most neighborhoods in Manhattan and the Bronx, however, the amount of food stores is spread out and less frequent. This is analogous to Figure 2 and Figure 4 representing percentage of people living under the poverty line and median income, showing there is a much higher supermarket need in lower income neighborhoods in New York City.
These statistics help us to understand the accessibility to healthy food around the city. To ensure we got produce from the whole spectrum of food across the city For the strawberries, we bought strawberries from Wegman’s (Driscoll’s) in NoHo for about $9.00, Carnival Fruits and Vegetables (Central West) in Kensington for about $2.79, and Uncle Giuseppe’s (California Giant) on Long Island for about $7. For our corn chips, we spent $1.99 at a deli in Sunset Park, $3.19 at Uncle Giuseppe’s on Long Island, and $5.00 at Wegman’s in the East Village. For our carrots (per pound) we spent $1.79 at a deli in Sunset Park, $2.50 at Uncle Giuseppe’s on Long Island, and $3.49 at Wegman’s in the East Village.
3
4
To test the foods for the CaMV35S promoter, we first had to grind the foods into a thinner consistency The food fragments were then added to a 200 µl PCR tube that had 50 µl of DNA lysis solution. The DNA lysis breaks open the cells and nuclear membranes to release the DNA inside. Once the lysis was mixed in well with the food, we capped the tubes and began to incubate the mixture at 95°C and added 5µl of DNA neutralization. Next, we added 20 µl of the GMO primer and 5 µl of the 5X EZ PCR Mix into our food mixture before placing the tubes into the miniPCR (polymerase chain reaction) machine. The miniPCR works in three steps:
Figure 1
Figure 2
Figure
Figure
denaturation, annealing, and extension. Denaturation separates the DNA strands by heating them up at 95°C, which breaks the hydrogen bonds between the complementary bases of DNA (adenine and thymine; guanine and cytosine). During annealing, the primers (short sequences of about 20 to 30 bases, single-stranded pieces of synthetic DNA that can bind to complementary regions in the template DNA) bind to the target sequence at 50°C-65°C forming hydrogen bonds between the primer and the sequence. Extension allows the polymerase to copy the DNA at around 72°C. This is the temperature at which the Taq polymerase used in PCR can function optimally. Because Taq polymerase adds nucleotides starting from the primers, extending the DNA chain, the third step of PCR is called the extension step. One cycle doubles the DNA strand creating two, but then repeats multiple times, doubling each cycle (2,4,8,16,32…) We ran 35 cycles, creating over one billion strands. Once the DNA was amplified by the PCR, we took our PCR tubes out and let them cool before running our gel electrophoresis.3
To run a gel electrophoresis, we had to create an agarose gel with .48 grams of agarose added and dissolved in 25ml of buffer solution. Once the gel cooled, we placed it into our mini electrophoresis and submerged it in our buffer solution (98ml of distilled water and 2 ml of 50x buffer) making sure there were no bubbles in the wells. Then, we added 10 µl of DNA ladder to the first well as a molecular ruler to compare the foods’ DNA strands to the known lengths/base pairs of the ladder. We then added 15 µl of our food solutions to the wells, leaving the last two wells for the positive control (GMO banana) and negative control (non-GMO banana.) Then, we ran the electrophoresis for 25 minutes. The gel electrophoresis allows you to distinguish DNA fragments of different length. CaMV35S, for example, would fall around 125 bp. The gel is a permeable matrix that molecules move through as the electrical current is passed through. On one side of the electrophoresis is a positive charge, and the opposite has a negative charge; this allows all molecules to migrate to their opposite charge (i.e. DNA – which is negatively charged – will migrate to the positively charged electrode).
Results
Running a gel electrophoresis for three different strawberries (Driscoll’s, from Wegman’s, about $7; California Giant Berry Farm’s, from Uncle Giuseppe’s in Long Island about $3.50; Central West from Carnival fruits and vegetables, about $2.50), the results revealed that all three strawberries tested positive for CaMV35S. Comparing the DNA strands of the three strawberries with the 100 bp DNA latter, the strawberries showed a band around 125 bp, a band only expected to show with the CaMV35S promoter This proves that all three of the strawberry products were genetically modified.
As additional results, we tracked the mold that grew about a 2 week long period in the fridge. The Central West (Carnival Fruits and Vegetables) strawberries grew the most mold (see Figure 6), the Driscoll’s (Wegman’s) grew much less (see Figure 7), but still a fairly good amount, and the California Giant (Uncle Giuseppe) strawberries grew almost no mold, and rather shriveled up becoming a much darker pink color (see Figure 8) These results suggest that some of the strawberries may have had a different promoter that prevents mold that we did not test for. It also proves that CaMV-35S does not prevent mold.
9
Next, we tested three kinds of carrots. One from Wegman’s in the East Village, one from Uncle Giuseppe’s in Long Island, and one from a deli in Sunset Park. Going through the same
Figure Figure
Figure
procedure as the strawberries, all three tested for the CaMV-35S promoter, proving they were genetically
Finally, we ran a test on three different kinds of corn chips from three different locations; a deli in Sunset Park for $1.99, Uncle Giuseppe’s in Long Island for $3.19, and Wegman’s in the East Village for $5.00. Using the same method as we did for the other two tests, we discovered that again, all three products tested positive for CaMV-35S, proving they were genetically modified.
In total, all nine of the products we tested from throughout the city were genetically modified using the CaMV-35S promoter.
Discussion
Our results from the all three tests (with the carrots and corn chips) demonstrated that all varieties of the tested products contained the promoter. These results contrast our initial hypothesis; we originally thought that the products would test differently for the promoter based on price. In actuality, there was no correlation between the marketed price and having the promoter. While all nine products showed they contained the same GMO (CaMV-35S), they had drastically different price points. The strawberries were priced; $2.50, $7.00, and $9.00; the corn chips were priced $1.99, $3.19, and $5.00; and the carrots (per pound) were priced $1.79, $2.50, and $3.49. Furthermore, in certain areas, it proved to be extremely difficult to find fresh produce: only after visiting four stores south of Prospect Park and three in Harlem did we manage to find strawberries. The lack of correlation between price and promoter presence suggests that pricing differences may be more strongly influenced by branding and marketing than by measurable genetic differences identified in this experiment. Stores such as Wegmans
Figure 10
and Whole Foods emphasize “natural” or “non-GMO” labeling, which may shape consumer perceptions of quality
While our results do not directly evaluate the accuracy of these labels, they highlight the need for further investigation into how such marketing claims relate to underlying product characteristics. Furthermore, the difficulty in accessing certain fresh produce across different neighborhoods suggests disparities in food availability, which may intersect with broader socioeconomic inequalities. Overall, our experiment challenges the idea that supermarkets attach prices on their products based on their quality of marketing instead of the quality of their food. And, with the stigma around GMOs the negative connotation it carries, expensive supermarkets can use their apparent ‘health’ as a positive quality to market, and can triple the price (as we saw with the strawberries being $2.50 in Prospect Park South and $9.00 in the East Village) as people perceive their food as healthier.
References
1 GMO Answers (2015, October 9) How GM papaya saved Hawaii’s papaya industry https://gmoanswers.com/how-gm-papaya-saved-hawaiis-papaya-industry
2 National Science Foundation (2022, June 13) Understanding the genomic modifications in transgenic papaya. https://www.nsf.gov/news/understanding-genomic-modifications-transgenic
3 Amack, S C , & Antunes, M S (2020) CaMV35S promoter – A plant biology and biotechnology workhorse in the era of synthetic biology. Current Plant Biology, 24,
4 Limone, O (2019, December 16) Mapping food deserts (and swamps) in Manhattan and the Bronx Medium. https://medium.com/@olivialimone/mapping-food-deserts-and-swamps-in-manhattan-and-the-bronx-46c 6d8fc0804
5 Food Deserts (2022, January 29) Food deserts in New York City
8. Welcome Genome Campus. (n.d.). What is gel electrophoresis? https://www yourgenome org/theme/what-is-gel-electrophoresis/
9 National Human Genome Research Institute (2020, August 17) Polymerase chain reaction (PCR) fact sheet. Genome.gov. https://www.genome.gov/about-genomics/fact-sheets/Polymerase-Chain-Reaction-Fact-Sheet
10 World Health Organization, Food and Agriculture Organization of the United Nations, International Fund for Agricultural Development, United Nations Children’s Fund, & World Food Programme (2024, July 24)
Hunger numbers stubbornly high for three consecutive years as global crises deepen: UN report. WHO. https://www who int/news/item/24-07-2024-hunger-numbers-stubbornly-high-for-three-consecutive-year s-as-global-crises-deepen--un-report
11. World Food Programme. (n.d.). Global hunger crisis. World Food Programme USA. https://www.wfp.org/global-hunger-crisis
12. U.S. Food and Drug Administration. (2024, January 18). GMO crops, animal food, and beyond. FDA. https://www fda gov/food/agricultural-biotechnology/gmo-crops-animal-food-and-beyond
13 Oliver, M J (2014) Why we need GMO crops in agriculture Missouri Medicine, 111(6), 492–507
https://pmc.ncbi.nlm.nih.gov/articles/PMC6173531/
14. MedlinePlus. (n.d.). Malnutrition. U.S. National Library of Medicine. https://medlineplus gov/ency/article/002432 htm
15 Waddell, M (2022, March 24) U S becomes 65th country to label GMOs But whose laws are the best? The Non-GMO Project.
16 U S Food and Drug Administration (n d ) Science and history of GMOs and other food modification processes.
https://www fda gov/food/agricultural-biotechnology/science-and-history-gmos-and-other-food-modificat ion-processes
17. iGeneLabserve. (n.d.). DNA gel electrophoresis: Step-by-step protocol. https://www.igenels.com/dna-gel-electrophoresis-step-by-step-protocol/
18 Mitchell, D (2014, January 10) Why there are no GMO oats (and probably never will be) Modern Farmer https://modernfarmer com/2014/01/heres-gmo-oats/
19. Addgene. (n.d.). Agarose gel electrophoresis. https://www.addgene.org/protocols/gel-electrophoresis/
20 HudsonAlpha Institute for Biotechnology (2009, July 8) How to test for a GMO https://www hudsonalpha org/how-to-test-for-a-gmo-3/
21. Oliver, M. J. (2014). Why we need GMO crops in agriculture. Missouri Medicine, 111(6), 492–507. https://www.ncbi.nlm.nih.gov/pmc/articles/PMC6173531/
22 Waddell, M (2024, October 31) The GMO high-risk list: Apples The Non-GMO Project https://www nongmoproject org/blog/the-gmo-high-risk-list-apples/
25 Department of Environment, Government of the People’s Republic of Bangladesh (2019) Manual on GMO detection and GLP (Draft). Bangladesh Biosafety Portal. https://bangladeshbiosafety org/wp-content/uploads/2021/03/Manual-on-GMO-Detection-and-GLP 201 9 Draft pdf
26. Lee, D., & Hain, P. (2002). Electrophoresis: How scientists observe fragments of DNA. Plant and Soil Sciences eLibrary (PASSeL), University of Nebraska–Lincoln. https://passel2 unl edu/view/lesson/33f8b452604f/2
27 Popova, A Y , & Schlundt, J (2008) Food safety risk perception and communication: A systematic review Food Control, 20(10), 1002–1012. https://doi.org/10.1016/j.foodcont.2008.11.006
28. Kennedy, M., & Cassetty, S. (2020, November 20). Evidence-based pros and cons of GMO foods. Business Insider https://www businessinsider com/guides/health/diet-nutrition/gmo-food
29 Amack, S C , & Antunes, M S (2020) CaMV35S promoter A plant biology and biotechnology workhorse in the era of synthetic biology. Current Plant Biology, 24, Article 100179. https://doi org/10 1016/j cpb 2020 100179