
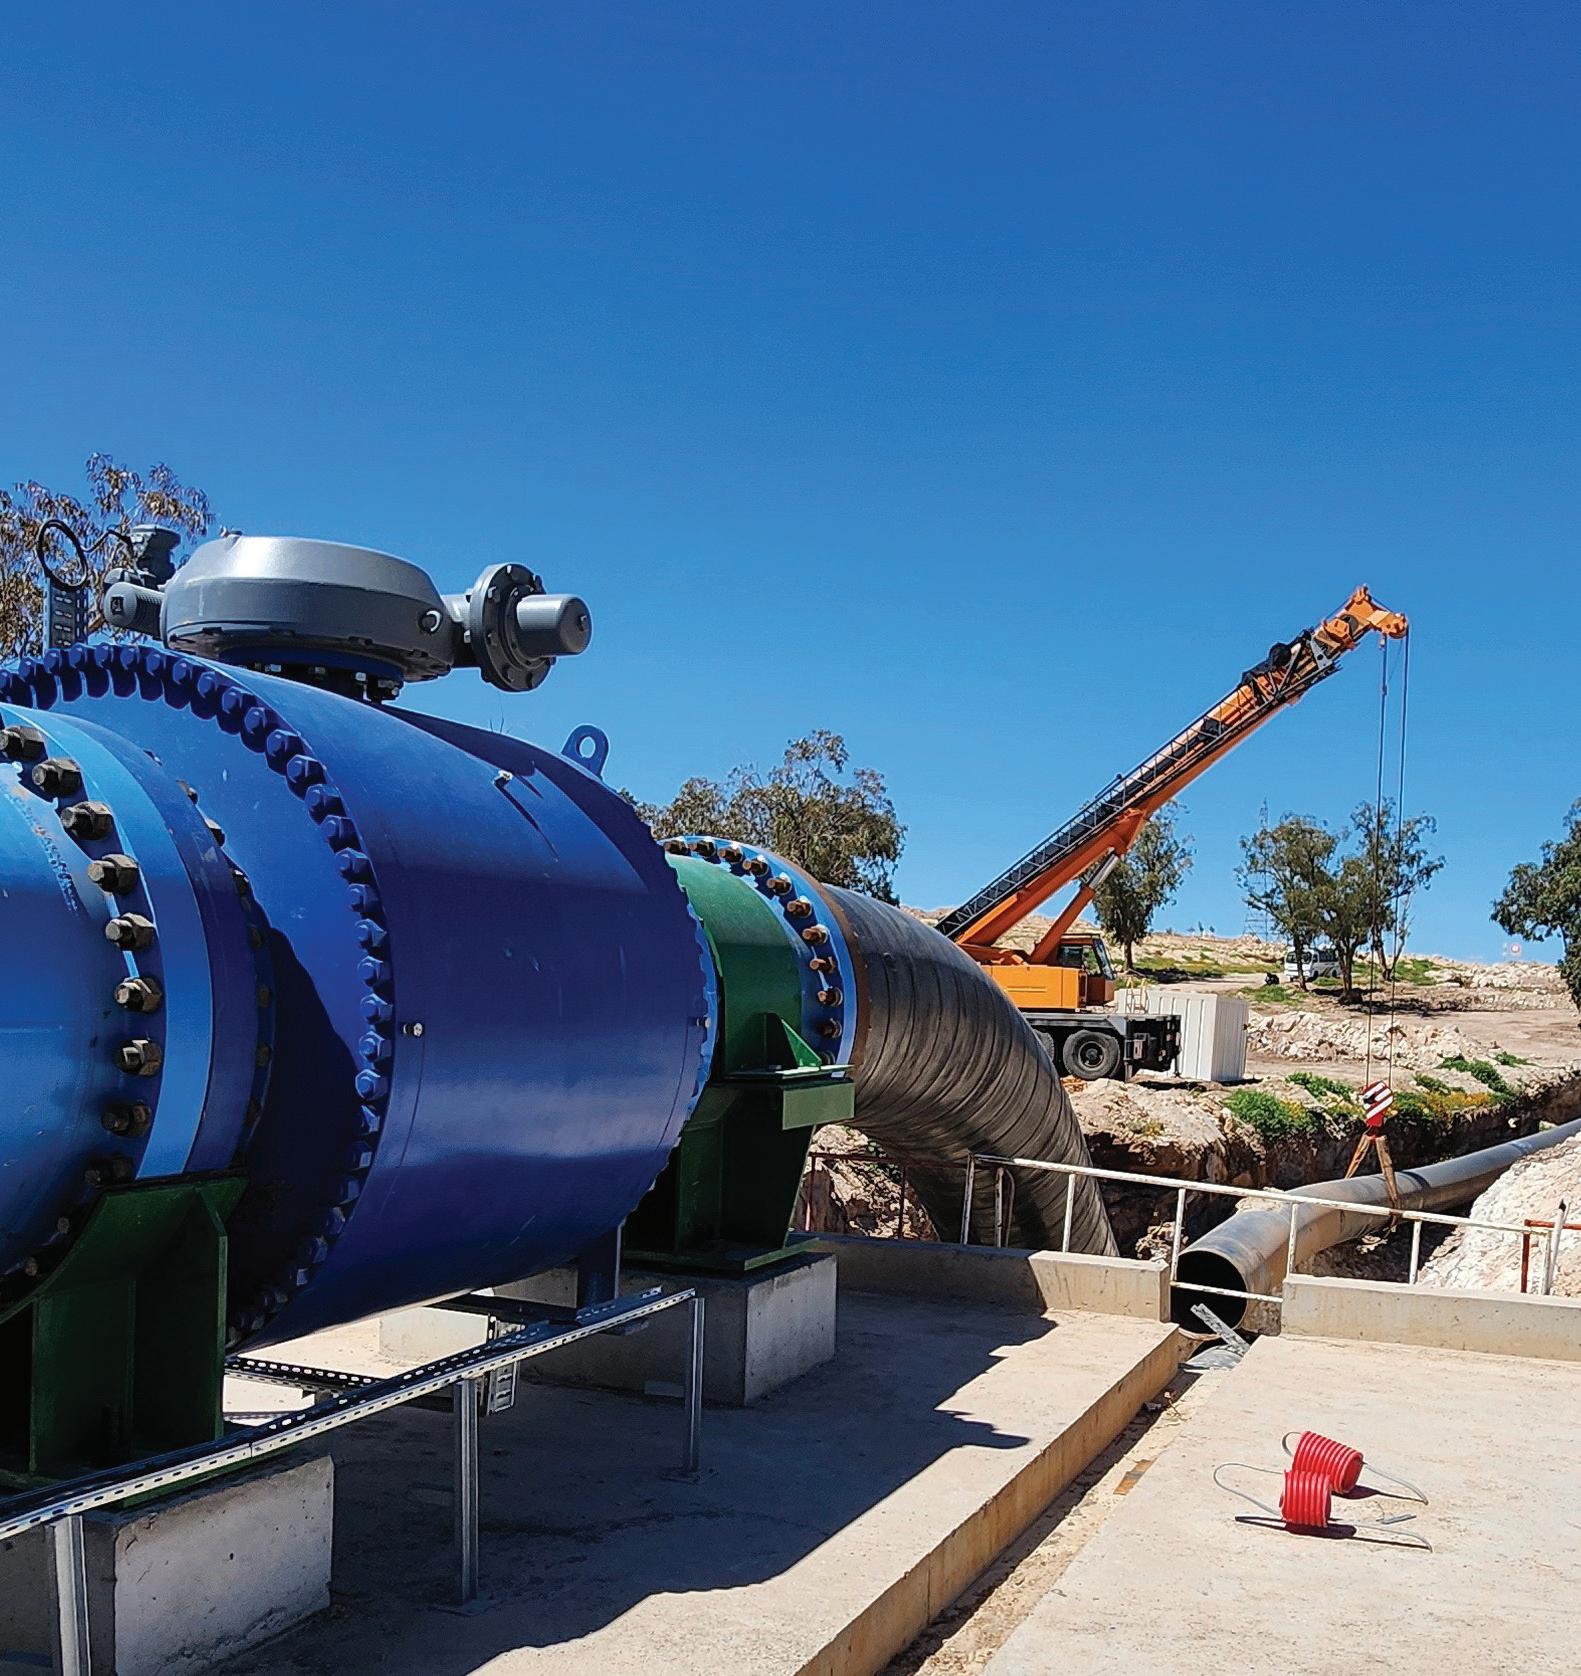
Specialised Engineering for the Mining Industry
Providing Engineering Expertise and Innovation Since 1991
With 35 years of industry experience in slurry pipelines and mining related systems. Our expertise runs from concept development to the detailed engineering, on-site support and execution of multi-disciplinary projects.
Tailings & Mine Waste
As leading experts, our holistic solutions balance many competing requirements, such as geotechnical stability, geochemical stability, water conservation, social license to operate, people at risk, emissions, operational risks, and cost. Our solutions are site specific and focus on each of the processing, transportation, and deposition challenges, as well as the client’s needs.
Long-distance Pipelines
With over 30 years of experience designing overland pipeline systems, we are global leaders in this field. Our expertise includes conventional tailings pipelines, thickened and paste tailings disposal systems, and long-distance ore and concentrate pipelines.
Mine Backfill
Our engineers have solved some of the most complex backfill challenges while testing and designing hydraulic, paste and cemented rock fill (CRF) projects all over the world. We remain leaders in the design, execution, and ongoing management support of mine backfill systems.
Tailings & Mine Waste
Long-Distance Pipelines
Mine Backfill
Mineral Processing
Mine Services
Bulk Water Supply
Dredging & Marine Pipelines
Laboratory & Test Work
Engineering Services
The Southern African Institute of Mining and Metallurgy
OFFICE BEARERS AND COUNCIL FOR THE 2025/2026 SESSION
President G.R. Lane
President Elect
T.M. Mmola
Senior Vice President
M.H. Solomon
Junior Vice President
S.J. Ntsoelengoe
Incoming Junior Vice President
M.C. Munroe
Immediate Past President
E. Matinde
Honorary Treasurer
W.C. Joughin
Ordinary Members on Council
W. Broodryk M.A. Mello
A.D. Coetzee K. Mosebi
Z. Fakhraei M.J. Mothomogolo
B. Genc S.M. Naik
F. Lake G. Njowa
K.M. Letsoalo S.M. Rupprecht
S.B. Madolo A.T. van Zyl
Co-opted Council Members
K.W. Banda
M.L. Wertz
Past Presidents Serving on Council
N.A. Barcza W.C. Joughin
R.D. Beck C. Musingwini
Z. Botha J.L. Porter
V.G. Duke M.H. Rogers
I.J. Geldenhuys G.L. Smith
R.T. Jones
M.L. Wertz – TP Mining Chairperson
W. Broodryk – TP Metallurgy Chairperson
C.T. Chijara – YPC Chairperson
T.S. Ndlela – YPC Vice Chairperson
Branch Chairpersons
Botswana K. Mosebi
DRC Vacant
Johannesburg A. Hefer
Limpopo M.S. Zulu
Namibia T. Aipanda
Northern Cape Vacant
North West T. Nsimbi
Pretoria P.G.H. Pistorius
Western Cape M.H. Solomon
Zambia N.M. Kazembe
Zimbabwe L. Shamu
Zululand Vacant
PAST PRESIDENTS
*Deceased
* W. Bettel (1894–1895)
* A.F. Crosse (1895–1896)
* W.R. Feldtmann (1896–1897)
* C. Butters (1897–1898)
* J. Loevy (1898–1899)
* J.R. Williams (1899–1903)
* S.H. Pearce (1903–1904)
* W.A. Caldecott (1904–1905)
* W. Cullen (1905–1906)
* E.H. Johnson (1906–1907)
* J. Yates (1907–1908)
* R.G. Bevington (1908–1909)
* A. McA. Johnston (1909–1910)
* J. Moir (1910–1911)
* C.B. Saner (1911–1912)
* W.R. Dowling (1912–1913)
* A. Richardson (1913–1914)
* G.H. Stanley (1914–1915)
* J.E. Thomas (1915–1916)
* J.A. Wilkinson (1916–1917)
* G. Hildick-Smith (1917–1918)
* H.S. Meyer (1918–1919)
* J. Gray (1919–1920)
* J. Chilton (1920–1921)
* F. Wartenweiler (1921–1922)
* G.A. Watermeyer (1922–1923)
* F.W. Watson (1923–1924)
* C.J. Gray (1924–1925)
* H.A. White (1925–1926)
* H.R. Adam (1926–1927)
* Sir Robert Kotze (1927–1928)
* J.A. Woodburn (1928–1929)
* H. Pirow (1929–1930)
* J. Henderson (1930–1931)
* A. King (1931–1932)
* V. Nimmo-Dewar (1932–1933)
* P.N. Lategan (1933–1934)
* E.C. Ranson (1934–1935)
* R.A. Flugge-De-Smidt (1935–1936)
* T.K. Prentice (1936–1937)
* R.S.G. Stokes (1937–1938)
* P.E. Hall (1938–1939)
* E.H.A. Joseph (1939–1940)
* J.H. Dobson (1940–1941)
* Theo Meyer (1941–1942)
* John V. Muller (1942–1943)
* C. Biccard Jeppe (1943–1944)
* P.J. Louis Bok (1944–1945)
* J.T. McIntyre (1945–1946)
* M. Falcon (1946–1947)
* A. Clemens (1947–1948)
* F.G. Hill (1948–1949)
* O.A.E. Jackson (1949–1950)
* W.E. Gooday (1950–1951)
* C.J. Irving (1951–1952)
* D.D. Stitt (1952–1953)
* M.C.G. Meyer (1953–1954)
* L.A. Bushell (1954–1955)
* H. Britten (1955–1956)
* Wm. Bleloch (1956–1957)
* H. Simon (1957–1958)
* M. Barcza (1958–1959)
* R.J. Adamson (1959–1960)
* W.S. Findlay (1960–1961)
* D.G. Maxwell (1961–1962)
* J. de V. Lambrechts (1962–1963)
* J.F. Reid (1963–1964)
* D.M. Jamieson (1964–1965)
* H.E. Cross (1965–1966)
* D. Gordon Jones (1966–1967)
* P. Lambooy (1967–1968)
* R.C.J. Goode (1968–1969)
* J.K.E. Douglas (1969–1970)
* V.C. Robinson (1970–1971)
* D.D. Howat (1971–1972)
* J.P. Hugo (1972–1973)
* P.W.J. van Rensburg (1973–1974)
* R.P. Plewman (1974–1975)
* R.E. Robinson (1975–1976)
* M.D.G. Salamon (1976–1977)
* P.A. Von Wielligh (1977–1978)
* M.G. Atmore (1978–1979)
* D.A. Viljoen (1979–1980)
* P.R. Jochens (1980–1981)
* G.Y. Nisbet (1981–1982)
A.N. Brown (1982–1983)
* R.P. King (1983–1984)
J.D. Austin (1984–1985)
* H.E. James (1985–1986)
H. Wagner (1986–1987)
* B.C. Alberts (1987–1988)
* C.E. Fivaz (1988–1989)
* O.K.H. Steffen (1989–1990)
* H.G. Mosenthal (1990–1991)
R.D. Beck (1991–1992)
* J.P. Hoffman (1992–1993)
* H. Scott-Russell (1993–1994)
J.A. Cruise (1994–1995)
D.A.J. Ross-Watt (1995–1996)
N.A. Barcza (1996–1997)
* R.P. Mohring (1997–1998)
J.R. Dixon (1998–1999)
M.H. Rogers (1999–2000)
L.A. Cramer (2000–2001)
* A.A.B. Douglas (2001–2002)
* S.J. Ramokgopa (2002-2003)
T.R. Stacey (2003–2004)
F.M.G. Egerton (2004–2005)
W.H. van Niekerk (2005–2006)
R.P.H. Willis (2006–2007)
R.G.B. Pickering (2007–2008)
A.M. Garbers-Craig (2008–2009)
J.C. Ngoma (2009–2010)
G.V.R. Landman (2010–2011)
J.N. van der Merwe (2011–2012)
G.L. Smith (2012–2013)
M. Dworzanowski (2013–2014)
J.L. Porter (2014–2015)
R.T. Jones (2015–2016)
C. Musingwini (2016–2017)
S. Ndlovu (2017–2018)
A.S. Macfarlane (2018–2019)
M.I. Mthenjane (2019–2020)
V.G. Duke (2020–2021)
I.J. Geldenhuys (2021–2022)
Z. Botha (2022-2023)
W.C. Joughin (2023-2024)
E. Matinde (2024-2025)
Editorial Board
S.O. Bada
P. den Hoed
I.M. Dikgwatlhe
M. Erwee
B. Genc
A.J. Kinghorn
D.E.P. Klenam
D.F. Malan
D. Morris
P.N. Neingo
S.S. Nyoni
M. Onifade
M. Phasha
P. Pistorius
P. Radcliffe
N. Rampersad
Q.G. Reynolds
I. Robinson
S.M. Rupprecht
Past President’s serving on the Editorial Board
R.D. Beck
R.T. Jones
W.C. Joughin
C. Musingwini
T.R. Stacey
S. Ndlovu*
*International Advisory Board member International Advisory Board members
R. Dimitrakopolous
R. Mitra
A.J.S. Spearing
E. Topal
D. Tudor
F. Uahengo
D. Vogt
Editor/Chairperson of the Editorial Board
R.M.S. Falcon
Typeset and Published by
The Southern African Institute of Mining and Metallurgy
PostNet Suite #212 Private Bag X31 Saxonwold, 2132
E-mail: journal@saimm.co.za
Printed by Camera Press, Johannesburg
Advertising Representative
Barbara Spence
Avenue Advertising
Contents
Journal Comment: Beyond succession: From next in line to leading the charge by C.
Chijara
President’s Corner: Rebuilding the capability system for modern mining by G.R. Lane
THE INSTITUTE, AS A BODY, IS NOT RESPONSIBLE FOR THE STATEMENTS AND OPINIONS ADVANCED IN ANY OF ITS PUBLICATIONS.
Copyright© 2026 by The Southern African Institute of Mining and Metallurgy. All rights reserved. Multiple copying of the contents of this publication or parts thereof without permission is in breach of copyright, but permission is hereby given for the copying of titles and abstracts of papers and names of authors. Permission to copy illustrations and short extracts from the text of individual contributions is usually given upon written application to the Institute, provided that the source (and where appropriate, the copyright) is acknowledged. Apart from any fair dealing for the purposes of review or criticism under The Copyright Act no. 98, 1978, Section 12, of the Republic of South Africa, a single copy of an article may be supplied by a library for the purposes of research or private study. No part of this publication may be reproduced, stored in a retrieval system, or transmitted in any form or by any means without the prior permission of the publishers. Multiple copying of the contents of the publication without permission is always illegal. U.S. Copyright Law applicable to users In the U.S.A. The appearance of the statement of copyright at the bottom of the first page of an article appearing in this journal indicates that the copyright holder consents to the making of copies of the article for personal or internal use. This consent is given on condition that the copier pays the stated fee for each copy of a paper beyond that permitted by Section 107 or 108 of the U.S. Copyright Law. The fee is to be paid through the Copyright Clearance Center, Inc., Operations Center, P.O. Box 765, Schenectady, New York 12301, U.S.A. This consent does not extend to other kinds of copying, such as copying for general distribution, for advertising or promotional purposes, for creating new collective works, or for resale.
Honorary Legal Advisers
M H Attorneys
Auditors
Genesis Chartered Accountants Secretaries
The Southern African Institute of Mining and Metallurgy 7th Floor, Rosebank Towers, 19 Biermann Avenue, Rosebank, 2196
PostNet Suite #212, Private Bag X31, Saxonwold, 2132 E-mail: journal@saimm.co.za
Telephone (011) 463-7940 . E-mail: barbara@avenue.co.za
ISSN 2225-6253 (print) . ISSN 2411-9717 (online)



iv
PROFESSIONAL TECHNICAL AND SCIENTIFIC PAPERS
Evaluating the corrosion and wear behaviour of high velocity oxygen fuel sprayed titanium iron oxide modified with nickel-chromium coating on plain carbon steel by M. Raoufi, Y. Naami, Z.M. Beiranvand, M. Moghaddasi, A. Naeimi
Titanium iron oxide and nickel-chromium coatings were applied on low-carbon steel substrates. The results indicated that the nickel-chromium composition exhibited superior corrosion resistance and resulted in an 80% reduction in weight loss. These findings suggest that nickel-chromium-modified titanium iron oxide coatings enhance both corrosion and wear resistance, making them promising candidates for industrial applications.
Modelling particulate matter concentration from loading operations in mineral quarries with a decision tree approach by Z. Duran, B. Erdem, T. Dogan, M. Genc
This study aims to develop a model for particulate matter concentration during the loading process in open pit mining. The researchers conducted simultaneous measurements of particulate matter and meteorological parameters and found that the number of fine particles released during loading is influenced by various weather factors. The M5P decision tree algorithm provides an innovative approach to developing local concentration estimates for non-coal surface mining.
Tax Deductibility of mining rehabilitation expenditures – Sishen Iron Ore Company (Pty) Ltd v Commissioner for the South African Revenue Service
by K. Thambi
Environmental rehabilitation has increasingly become a central concern in the regulatory and fiscal landscape governing South African mining operations. This commentary critically examines the multifaceted implications of the Sishen ruling, highlighting the intersection of statutory interpretation, operational realities, and environmental accountability within South Africa’s mining sector.
Overmining low factor of safety coal pillars using an enhanced monitoring system by W.J. van Wyk, W. Mahne, G. Priest, G.P.W. Liebenberg, C. du Toit
This paper presents the use of geophone arrays to monitor micro-fracturing in number two seam pillars and the interburden between number two seam and number four seam, thereby enabling early detection of potential instability during overmining of the number two seam. The study quantifies the efficacy of geophone monitoring in optimising coal recovery over low factors of safety pillars and assesses the application of Van der Merwe’s (2019) time-based formulae for pillar stability analysis for this project.
Quantitative impacts of induction heating power on refractory erosion and inclusion behaviour in tundishes by M. Hao, Y. Yin, B. Yang, L. Wang
This study established a coupled fluid-electromagnetic numerical model to systematically analyse the effects of molten steel flow, inclusion transport, and temperature gradients on refractory erosion behaviour within an induction-heated tundish. The results demonstrate that increased induction heating power significantly exacerbates both flow-induced erosion and magneto-thermal corrosion of the refractory lining in the channel region. This research provides a quantitative basis for balancing metallurgical benefits with the longevity-oriented design of refractory linings.
A comprehensive evaluation of non-explosive rock fragmentation techniques with a focus on the potential of soundless chemical demolition agents in the surface mining of gemstone in Zambia by S. Ncube, F. Mulenga
This paper provides a comprehensive evaluation of non-blasting rock fragmentation techniques with an emphasis on the efficiency, economic considerations, and operational constraints of soundless chemical demolition agents SCDAs in gemstone mining. Soundless chemical demolition agents technology has shown promising results in preserving gem purity and reducing environmental impact, despite ongoing challenges. This review identifies the main factors that affect soundless chemical demolition agent performance and brings together reported strategies that can improve their use.
Analysing the energy consumption according to the type of dump scroll track during skip discharging of an inclined shaft hoist in an open pit mine by I.C. Paek, U.C. Han, I.K. Tae, K.S. Jong, C.I. Kim, P.J. Thak ...........................................
This paper analyses the energy consumption according to the type of dump scroll track during skip discharging in an inclined shaft hoist for an open pit mine. Skip discharging is analysed using discrete element method software, and dynamic simulation of its run is performed using Visual Nastran software. This study demonstrates that the energy consumption at the cosine track is always lower than that at the linear accretion track.
253
261
285
297
309
319
Journal Comment


TBeyond succession: From next in line to leading the charge
he mining industry has long been a cornerstone of economic growth, powering industries, enabling infrastructure, and supporting livelihoods across the globe. Yet, today, the sector stands at a defining moment. Rapid technological advancement, increasing sustainability pressures, and shifting workforce expectations are reshaping the landscape faster than ever before. The future of mining will not simply unfold on its own; it will be built by those bold enough to shape it.
Young professionals are often spoken about as the “next generation” of leaders, as though their role is to wait patiently in the wings until it is their turn. While succession planning remains important, this narrative can unintentionally downplay the value young professionals bring right now. They are not merely future leaders. They are innovators, problem-solvers, and changemakers already influencing the industry today.
As digital natives entering an increasingly data-driven and technology-enabled world, young professionals are naturally positioned to accelerate innovation. They are often more comfortable embracing emerging technologies such as automation, artificial intelligence, digital twins, and simulation-based learning tools. Their confidence in these areas can unlock new ways of working, improve efficiency, and drive smarter decision-making across operations.
But the transformation of mining is not just about technology. The industry’s greatest opportunities and challenges require more than technical solutions. Improving productivity, strengthening safety, reducing environmental impact, and attracting top talent all demand human-centred leadership. Young professionals often bring fresh energy, collaborative mindsets, and a strong desire to contribute to meaningful work. They are more willing to challenge outdated practices, ask difficult questions, and seek better ways of doing things. This mindset is exactly what the industry needs to remain competitive and sustainable.
At the same time, many young professionals enter the industry with ambition and excitement, only to find themselves navigating rigid structures, limited exposure to strategic conversations, and a lack of mentorship. If mining organisations want to unlock the full potential of young professionals, they must move beyond seeing them as part of a succession pipeline and start recognising them as strategic contributors. This means creating real opportunities for young voices to be heard, involving them in innovation and problem-solving initiatives, and investing in mentorship that develops both technical and leadership capability.
Professional bodies such as the South African Institute of Mining and Metallurgy and its Young Professionals Council have an important role to play in this journey. By creating platforms for networking, knowledge-sharing, and professional development, these organisations help bridge the gap between emerging talent and established leaders.
The mining industry of tomorrow is being shaped today. It will belong to those who innovate boldly, collaborate intentionally, and lead with purpose through complexity and change. Young professionals are already doing exactly that.
The conversation should no longer be about preparing young professionals to lead someday. The conversation should be about trusting them, empowering them, and partnering with them to lead now.
C. Chijara SAIMM YPC Chairperson
President’s Corner


TRebuilding the capability system for modern mining
he minerals industry is facing a capability challenge that will not be solved by producing more graduates. The complexity of modern mining is now outpacing the systems that are being relied on to develop the professionals who must lead, operate, and improve it.
Over the past month, through engagements with universities, mine managers, industry leaders, regulators, professional bodies, and the SAIMM Council, one message has been consistent: The industry is becoming more complex at the same time as the systems that historically developed experienced professionals are becoming weaker. If the challenge is diagnosed only as a shortage of people, the wrong solutions will continue to be designed. The more important question is whether talent is being converted into experienced, professionally accountable capability at the rate and depth required by the future industry.
This contradiction came into sharp focus during a recent two-day workshop hosted by the University of Limpopo to design a new mining engineering degree aligned to future industry requirements. Representatives from universities, the Mining Qualifications Authority, local government, mining companies, and other stakeholders participated in the discussions. One theme stood out: In some cases, mining engineering graduates struggle to secure structured workplace opportunities, while mine leaders identify capability and skills constraints as one of the major operational risks facing their operations.
That tension exposes a deeper system failure.
The industry is not struggling to produce graduates. It is struggling to systematically produce capability. Producing graduates and producing industry-capable professionals are not the same outcome. The real constraint sits within the conversion system itself: workplace exposure, mentoring, structured development, operational experience, professional formation, leadership development, and long-term progression.
This challenge did not emerge overnight. Historically, many of South Africa’s large mining houses played a decisive role in developing technical and leadership capability through formal graduate programmes, structured development pathways, mentorship systems, and long-term operational exposure. Companies such as Anglo American became powerful capabilitydevelopment engines for the broader industry, launching the careers of many of today’s senior engineering and mining leaders.
As the industry evolved through restructuring, divestment, decentralisation, outsourcing, and changing operating models, many of these large-scale development pathways were gradually dismantled or fragmented. The institutional memory and structure that underpinned systematic capability development dwindled, even as the complexity of modern mining operations continued to increase.
The industry is now living with the long-term consequences of that widening gap.
Mining leaders participating in the Limpopo workshop greatly reinforced this. Technical competence remains essential but, increasingly, it is not sufficient. Future mining professionals will operate in environments where operational performance, safety, ESG obligations, automation, energy, geotechnical risk, digital systems, AI, productivity pressure, communities, and regulatory requirements are tightly interconnected. The challenge is no longer only depth within a discipline. It is the ability to make sound decisions across an interconnected socio-technical system.
At the same time, the industry must be careful not to over-correct the diagnosis. What is missing is not only systems capability, but also deep technical capability across core mining and engineering disciplines. The future industry will require professionals who can think across systems, but it will also require strong technical specialists, artisans, and supervisors with the depth to operate, maintain, and improve increasingly complex operations.
This has important implications for the broader development pipeline. If the industry is serious about rebuilding capability, it must also help to rebuild and strengthen the technical and vocational base that historically supported mining performance. That includes renewed attention to technical schools, artisan pathways, and especially the role of TVET colleges, in rebuilding the pipeline of practically trained, industry-relevant capability on which the sector depends.
The strongest missing capability repeatedly identified during discussions was the ability to understand interactions across the broader mining system rather than only within narrow technical silos. The same concern emerged around safety behaviour, ESG understanding, and professional accountability. These capabilities cannot simply be added once graduates enter the workplace. They must begin forming during university and continue developing intentionally throughout professional progression.
A similar pattern emerged during the recent SAIMM Reimagining Diversity and Inclusion showcase. In several miningrelated university programmes, female representation now exceeds 50% in the first year, but declines materially across graduation, professional membership, and leadership levels. This is not just a diversity statistic. It is evidence of a pipeline conversion failure: The system is attracting talent into the front end of the pipeline but is not consistently converting and progressing that talent across the full professional journey.
President’s Corner (continued)
At its core, this is also a responsibility to the next generation of professionals entering an increasingly demanding industry.
The operational implications of this capability gap were reinforced again during Mine Managers’ Day at the University of Pretoria. Listening to mine general managers, AMMSA representatives, and other industry leaders, the message was direct: Capability constraints are increasingly becoming operational constraints. Mine leaders are dealing with rising operational complexity while simultaneously experiencing a thinning layer of experienced technical and operational capability. The requirement is no longer simply more people. It is professionals capable of operating, leading, and making decisions within complex, high-consequence environments.
The capability gap is no longer theoretical. It is affecting operational resilience, decision quality, safety performance, and long-term sustainability. Too often, capability development is still approached through fragmented recruitment schemes, bursary offerings, and short training interventions, rather than as an integrated, long-term capability-development system.
Encouragingly, there are signs of a different approach emerging. One example discussed during recent engagements is the ten-year initiative recently established by Gold Fields under the leadership of Benford Mokoatle, EVP South Africa. The Group Legacy Programme reflects the type of long-term capability-system thinking the industry increasingly requires: structured development pathways, cross-operation and cross-industry exposure, and a deliberate focus on building future leaders over time rather than relying on isolated short-term interventions.
Similarly, discussions with Mzila Mthenjane, CEO of the Minerals Council South Africa, and a recent podcast conversation with Julie Courtnage of the Mandela Mining Precinct reinforced that genuine collaboration across the mining ecosystem will be essential if the industry is serious about rebuilding long-term capability. No single company, university, or professional body can rebuild this system alone.
These pressures also force an important question for SAIMM.
If the industry challenge is evolving, SAIMM must evolve with it.
At this month’s Council meeting, SAIMM resolved to implement significant changes to the organisational structure and operating model of the Institute. This is an important milestone in its evolution from a predominantly administrativelyfocused body towards a more industry-facing organisation that strengthens execution capability and supports the future professional requirements of the minerals industry. This is not restructuring for its own sake. It is a deliberate shift to position SAIMM as a stewardship and integration platform for the professional capability pipeline.
If SAIMM is to play a meaningful stewardship role within the evolving capability system, then the Institute itself must be fit for that responsibility. In practical terms, this means sharpening its work around the full professional pipeline: how it is architected, how professionals are formed, how standards are signalled, and how performance is understood over time. The intent is not to duplicate what companies, universities, or regulators already do, but to help connect those efforts into a more coherent system and to keep the long-term capability question on the industry’s strategic agenda.
Strategy without execution capability does not change a system. SAIMM’s own evolution must therefore be judged not only by new structures, but by whether it helps the industry move from fragmented initiatives to integrated, long-term development pathways. That will require discipline over several years, not a single-year programme.
The next important step in this journey will take place on 3 June, when SAIMM hosts an industry engagement breakfast bringing together mining leaders, institutions, and key stakeholders in the capability ecosystem. The purpose is not for SAIMM to present all the answers. It is to create a platform for the industry to engage honestly with the growing gap between mining complexity and capability development, and to begin aligning around the coordinated actions required to address it.
What the past month has reinforced very clearly is that this challenge is no longer seen as an isolated HR issue, a university issue, or a professional registration issue. It is increasingly recognised as a strategic constraint on the future competitiveness and resilience of the minerals industry.
Unless the industry becomes far more deliberate and integrated in how it develops professionals across the full pipeline, the gap between mining complexity and available capability will continue to widen. The challenge is no longer to understand the problem. The challenge now is whether, together, the capability-development system required for the future of modern mining can be rebuilt, and whether that work will be treated as a core strategic priority rather than a peripheral support function.
Around every mining operation, significant investment is made in the resource endowment itself, and in the equipment, infrastructure, technology, and systems required to extract and process it. Skills and professional capability need to be treated as a third pillar of that investment — as important to long-term performance as the orebody and the physical and digital asset base. If the industry is prepared to invest heavily in capital and technology, it must be equally deliberate in investing in its capability endowment, because without that, neither the resource nor the equipment can be turned into sustainable value.
This is not SAIMM’s project alone. It is an industry project that SAIMM is choosing to help steward. As president of the SAIMM, my view is simple: the industry cannot afford not to.
G.R. Lane President, SAIMM
Affiliation:
1 Department of Materials Science and Engineering, Faculty of Engineering, Arak University, Iran
2 Corrosion and Coating Inspection Department, Imam Khomeini Oil Refinery Company, Iran
3 Department of Mechanical and Energy Systems Engineering / Energy Systems Engineering, Shahid Beheshti University, Iran
Correspondence to: M. Raoufi
Email: m-raoufi@araku.ac.ir
Dates:
Received: 31 May 2024
Revised: 7 Jul. 2025
Accepted: 01 Oct. 2025
Published: May. 2026
How to cite:
Raoufi, M., Naami, Y., Beiranvand, Z.M., Moghaddasi, M., Naeimi, A. 2026. Evaluating the corrosion and wear behaviour of high velocity oxygen fuel sprayed titanium iron oxide modified with nickel-chromium coating on plain carbon steel. Journal of the Southern African Institute of Mining and Metallurgy, vol. 126, no. 5, pp. 253 - 260
DOI ID:
https://doi.org/10.17159/2411-9717/3242/2026
ORCiD:
M. Raoufi
https://orcid.org/0000-0001-8487-8934
Z.M. Beiranvand
https://orcid.org/0009-0009-1945-4954
A. Naeimi
https://orcid.org/0000-0003-2408-7844
Evaluating the corrosion and wear behaviour of high velocity oxygen fuel sprayed titanium iron oxide modified with nickelchromium coating on plain carbon steel
by M. Raoufi1, Y. Naami1, Z.M. Beiranvand1, M. Moghaddasi2, A. Naeimi³
Abstract
Titanium iron oxide and nickel-chromium coatings were applied on low-carbon steel substrates using the high-velocity oxygen fuel thermal spraying process. The microstructure, phase composition, and hardness of the coatings were analysed using scanning electron microscopy, x-ray diffraction, and microhardness tests. The phase analysis confirmed the formation of oxide compounds in the coatings. The average microhardness values for titanium iron oxide and titanium iron oxide-nickel-chromium coatings were measured at 580 HV and 970 HV, respectively, under a 100 g load. The corrosion resistance of the coatings was evaluated in a 3.5% sodium chloride solution using electrochemical impedance spectroscopy (EIS) and polarisation tests. The results indicated that the nickel-chromium composition exhibited superior corrosion resistance, which was attributed to its low porosity, preventing solution diffusion into the substrate. Wear behaviour was assessed using a pin-on-disk test with a tungsten carbide pin as the counterbody. The incorporation of nickel-chromium into the titanium iron oxide coating resulted in an 80% reduction in weight loss, indicating significant improvement in wear resistance. These findings suggest that nickel-chromium-modified titanium iron oxide coatings enhance both corrosion and wear resistance, making them promising candidates for industrial applications.
Keywords coating, high velocity oxygen fuel VOF, nickel-chromium, corrosion, wear, titanium iron oxide
Introduction
Carbon steel is among the most extensively utilised engineering alloys, particularly in the automobile, oil and gas, and petrochemical industries. Despite its widespread use, the surface of plain carbon steel is highly susceptible to degradation mechanisms such as wear, oxidation, and corrosion (Sidhu et al., 2007; Galedari et al., 2019; Ding et al., 2018; Torbati-Sarraf, Poursaee, 2018). The surface condition of metals plays a critical role across various industries, as it directly influences the performance and durability of components. To address these demands, the development of advanced surface engineering processes and technologies has become essential to enhance the quality, longevity, and operational efficiency of components. Surface coating techniques are widely employed to improve the surface properties and extend the service life of carbon steel components. Among these techniques, thermal spraying has gained significant attention. It encompasses a variety of processes used to apply both metallic and non-metallic coatings for improved surface performance (Tobergte, Curtis, 2013). High velocity oxygen fuel (HVOF) spraying is a prominent thermal spraying technique known for producing dense and well-adhered coatings. It is extensively used for coating industrial components in sectors such as oil and gas, aerospace, and agriculture, primarily to enhance surface resistance against corrosion and wear (Sidhu et al., 2007; Jones et al., 2001; Singh et al., 2019; Yilbas et al., 2003; Park et al., 2013). Thermal spraying involves the deposition of molten or semi-molten particles onto a substrate surface to form a coating, offering advantages such as process simplicity and cost-effectiveness (Wei et al., 2023; Hong et al., 2023). Among the various thermal spraying techniques, coatings produced by HVOF method are particularly notable for their high density, low porosity, elevated hardness, and strong adhesion to the substrate (Zhao, Lugscheider, 2003; Lekatou et al., 2008; Hong et al., 2014; Xie et al., 2013). As a result, HVOF is widely employed to extend the service life span of components and improve manufacturing efficiency across a range of materials. Furthermore, HVOF-deposited cermet coatings have been developed with excellent bonding characteristics and superior resistance to wear and corrosion, thereby optimising in-service
Evaluating the corrosion and wear behaviour of high velocity oxygen fuel sprayed titanium
performance in demanding industrial applications (Stokes, Looney, 2004; Li et al., 1996; Karimi et al., 1995). Various coatings have been developed using thermal spraying techniques to enhance wear and corrosion resistance. Verdian et al. (2010; 2012) reported favorable corrosion resistance in coatings such as nickel titanium (NiTi) and nickel silicide composites or commonly known as niobium (Ni (Si)/ Ni₅Si) produced via thermal spraying. These coatings exhibited high hardness and strong bond strength, outperforming the substrate when immersed in a 3.5% sodium chloride (NaCl) corrosion solution. The incorporation of nickel in the coatings contributed significantly to corrosion resistance, primarily due to the reduced oxidation during the spraying process. Furthermore, the addition of hard particles such as chromium improved the coatings’ wear resistance by forming a more robust structure (Verdian et al., 2012; Ak et al., 2003; Zavareh et al., 2016; Karaoglanli et al., 2017). Nickel and cobalt are among the most suitable materials for coatings applied via the HVOF method, as they tend to produce dense coatings with low porosity and have demonstrated effectiveness as barriers against electrolyte permeation. Consequently, exploring coatings based on other metals—particularly nickel and cobalt—as alternatives to niobium for protection against hydrogen embrittlement and as hydrogen barriers, using HVOF thermal spray techniques, is both promising and of significant practical relevance (Brandolt et al., 2019). In a study conducted by Brandolt et al. (2019), micro-printing techniques were employed on thermally sprayed coatings to investigate the mechanisms of hydrogen trapping within the coating layers. Oxide coatings are widely employed across various industries due to their excellent protective properties. However, to date, titanium iron oxide powder has not been extensively utilised as a coating material. Oxide coatings are particularly attractive in surface engineering due to their excellent chemical stability, high-temperature resistance, and ability to form dense, adherent layers that act as effective barriers against corrosive agents. These coatings can significantly reduce oxidation and material degradation in harsh environments, making them suitable for demanding industrial applications. Additionally, their inherent hardness and wear resistance contribute to improved mechanical durability, which is essential for extending the service life of components exposed to friction, erosion, or corrosive media (Sidhu, Prakash, 2006). In this study, titanium iron oxide is applied in combination with nickel and chromium (NiCr) using HVOF thermal spraying process. During solidification from high temperatures, the conditions facilitate the formation of oxides within the coating structure. This results in the development of a continuous and stable oxide layer that serves as an effective protective barrier. The oxide layer acts as a dense shield, preventing the penetration of oxygen and corrosive agents to the steel surface, while also enhancing resistance to scratching and friction. Consequently, surface degradation of the substrate is significantly reduced. The primary objective of this research is to investigate the corrosion and wear behavior of titanium iron oxide-NiCr and titanium iron oxide coatings deposited via the HVOF process. It is anticipated that this composition of powder will enhance both corrosion and wear resistance of industrial components, owing to the presence of elements with high resistance to oxidation and mechanical wear—ultimately contributing to extended service lifespan of the substrate.
Materials and methods
The material used in this research work was titanium iron oxide together with NiCr. This powder was produced from an inorganic
Table 1
HVOF process parameters
mineral that was subjected to a milling process for 8 hours in order to be finer. Then, about 70% of titanium iron oxide powder was mixed into the mill with 30% of NiCr powder for 4 hours. The rotation speed of the container in the milling process was considered about 180 rpm. The milling powders with a size of 15 μm – 45 μm were implemented for use in the spraying process. The coating was applied on the substrate of low-carbon steel having the dimensions of 20*20*80 mm3. At first, the surface of the samples was cleaned and uniformed by a stonemason device-equipped magnetic table. Then, before applying the coating, sandblasting was executed by means of alumina powder with mesh 20 to create appropriate roughness on the surface. Finally, the samples were degreased by rinsing it with acetone solution. The MJ5000 model thermal spraying with 8-axis robotic system was utilised to create titanium iron oxide and titanium iron oxide-NiCr coatings. The coating improvement parameters are presented in Table 1.
X-ray diffraction (XRD) was used by ASENWARE device (model AW-XDM300) under 40 KV voltage and 30 mA current to investigate the exist phases in the obtained compacted powders and coatings. Finally, phase matching was performed by Xpert high Score software. Scanning electron microscopy (SEM) (model LE1455VP) was utilised to observe the microstructure and measure the thickness of the coatings. For that purpose, several crosssections were provided from the coated samples. These crosssections were grinded. Before sanding, mounts were used to avoid detaching the coating as well as proper sanding of the sample edges. The hardness test was performed by Vickers micro-hardness device under operating conditions of 100 g applying load and 15 s time with 3 iterations. Scanning electron microscopy was used to investigate the porosity of the coatings. After comparing the micrographs with each other and identifying the porosities, their amount was determined by Image J software. The corrosion test of steel samples with a coating was done in a 3.5% NaCl solution. Before commencing the experiment, to reach the surface reaction of the samples with the electrolyte solution, the open circuit potential of each sample was monitored for 30 min. The Tafel polarisation test was carried out by Autolab Potentiostat device (model PG STAT302N), which was attached to a three-electrode cell composing of the sample, reference saturated calomel electrode, and platinum auxiliary electrode. This test was accomplished in the range of -0.5 V to +1 V in comparison with the open circuit having a corrosion rate of 2 mVs-1. Electrochemical impedance spectroscopy (EIS) was implemented in the frequency range of 10 kHz to 100 mHz in the open circuit potential. In order to study the results of this test, Nova1.8 software was used. The pin-on-disk test was executed to determine the wear resistance and friction coefficient of the coatings. This test was evaluated using a tungsten carbide (WC) pin with 75 RC hardness under a 10 N applied force over the distance of 1000 m. After completion of the test, to completely discard the eroded particles adhered to the surface, the sample was rinsed. At that time, the eroded surface of the coating was evaluated to investigate the wear mechanism of the coatings using SEM.
Evaluating the corrosion and wear behaviour of high velocity oxygen fuel sprayed titanium

Results and discussion
X-ray diffusion pattern
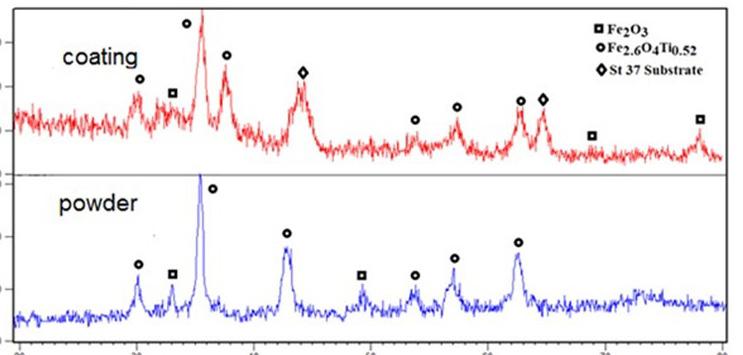
X-ray diffusion (XRD) patterns of the titanium iron oxide powder and the deposited coating are presented in Figure 1. The XRD analysis reveals that the primary phases present in the ground powder include Fe₃O₄ (magnetite) and Fe₂.₆Ti₀.₅₆O4, which are consistent with previously reported compositions in similar oxide systems. As shown in Figure 1, these phases are also observed at similar diffraction angles in the coating produced via the thermal spraying process, indicating that the phase composition is largely retained during deposition. In addition, diffraction peaks corresponding to the St37 steel substrate are also detectable, suggesting partial penetration or exposure of the substrate during analysis.
Figure 2 presents the XRD patterns of the crushed mineral powder after the addition of NiCr, along with the corresponding coating produced from this composite powder. The results indicate that the mechanical milling of titanium iron oxide with NiCr led to the formation of several new phases. In addition to the phases identified in the previous coating, new peaks corresponding to FeNi3, metallic nickel (Ni), and metallic chromium (Cr) are observed in the diffraction pattern. These findings suggest that the incorporation of NiCr significantly alters the phase composition of the coating, likely enhancing its structural and functional properties.
A comparison between the XRD patterns of the powder and the corresponding coating after thermal spraying reveals a broadening of the diffraction peaks and a reduction in their intensity. According to previous studies (Verdian et al., 2010; Verdian et al., 2012), this phenomenon can be attributed to the high kinetic energy of the semi-molten particles during the HVOF spraying process.
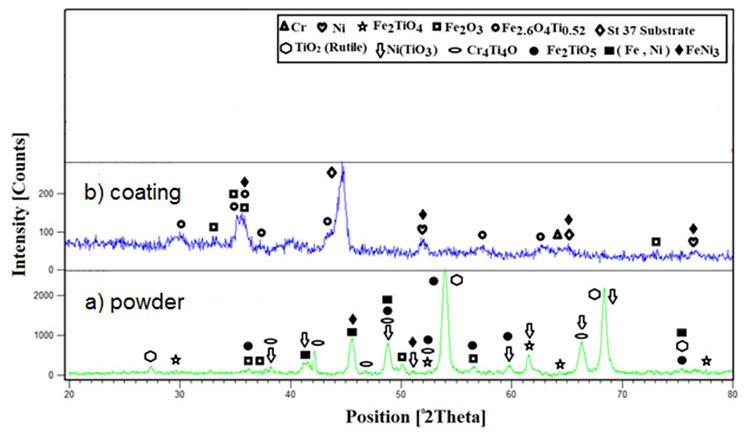
Upon impact with the underlying surface, these particles undergo severe plastic deformation, which leads to grain refinement and an increase in internal strain energy—both of which contribute to peak broadening and intensity reduction in the diffraction pattern.
Scanning electron microscopy images
Figure 3 shows scanning electron microscopy (SEM) images of the coating surfaces produced by the HVOF thermal spraying process. In this method, particles are deposited in molten or semi-molten states due to the relatively low internal heat input, which contributes to coatings with minimal defects (Puetz et al., 2010). The SEM image of the titanium iron oxide coating in Figure 3(a) reveals a small number of pores and craters and no visible cracks. This may be attributed to the difference in melting points between Fe₂O₃ and TiO2, which results in the formation of more spherical features on the coating surface. Additionally, due to the proximity between the melting point of Fe and the temperatures reached during HVOF spraying, Fe and Ti particles may remain unmelted or only partially melted during deposition. As shown in Figure 3(b), the number of pores and craters decreases with the incorporation of NiCr into the titanium iron oxide powder, suggesting that Ni and Cr fill the voids within the coating structure. All coatings exhibit a uniform, homogeneous surface with minimal oxidation and no surface cracks, indicating good coating quality across all systems. Figure 4 presents cross-sectional SEM images of the coatings produced via the HVOF thermal spraying method. All micrographs clearly show good adhesion between the coating and the substrate, with no visible signs of delamination or interfacial separation (Sadeghimeresht et al., 2017; Brito et al., 2012). As observed in Figure 4a, the titanium iron oxide coating exhibits notable porosity, cracks, and a distinct dark oxide layer. According to energy dispersive spectroscopy (EDS) analysis, this oxide-rich layer contains a high proportion of iron (Fe: 81.83 wt%, Ti: 8.94 wt%, O: 9.23 wt%). Iron remains the dominant element throughout the titanium iron oxide coating; however, its concentration significantly decreases upon the addition of NiCr (Fe: 37.80 wt%, Ti: 4.09 wt%,
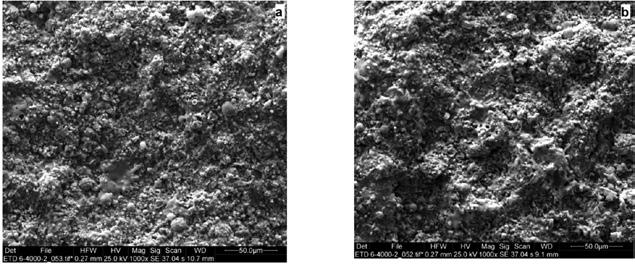
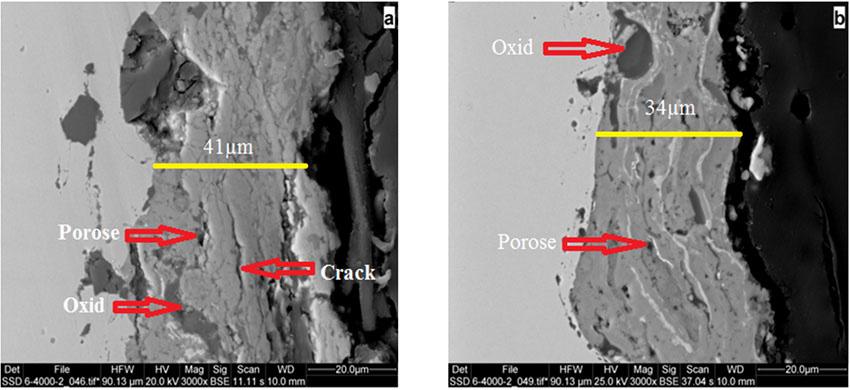
Figure 1—XRD patterns of titanium iron oxide powder and HVOF titanium iron oxide coating
Figure 2—XRD patterns of (a) titanium iron oxide -NiCr powder and (b) HVOF titanium iron oxide -NiCr coating
Figure 3—Surface SEM images of coatings (a) titanium iron oxide, (b) titanium iron oxide -NiCr
Figure 4—Cross-sectional SEM images of coatings: (a) Fe3TiO4, (b) Fe3TiO4NiCr
Evaluating the corrosion and wear behaviour of high velocity oxygen fuel sprayed titanium
O: 6.19 wt%, Cr: 43.88 wt%, Ni: 2.39 wt%). The average thickness and porosity of the titanium iron oxide and titanium iron oxideNiCr coatings were measured as 41 μm with 1.3% porosity, and 34 μm with 0.4% porosity, respectively. These results indicate effective integration of Ni and Cr particles with the titanium iron oxide matrix. During the spraying process, NiCr particles appeared to have completely melted and, upon impact with the substrate, infiltrated the underlying layers, effectively filling voids and reducing overall porosity. Consequently, the titanium iron oxideNiCr coating exhibits a denser microstructure and thinner layer compared to the titanium iron oxide-only coating. The low porosity and high density observed in both coatings are attributed to the high-velocity impact of particles during HVOF spraying, which enhances packing efficiency and reduces the presence of voids and defects.
In conclusion, the thermal spraying process using the HVOF technique successfully produced coatings with high density and excellent adhesion to the substrate—key advantages of this method (Suarez et al., 2008; Murthy, Venkataraman, 2006). The incorporation of NiCr significantly reduced the size and volume of porosities within the coating, indicating a denser microstructure in the titanium iron oxide-NiCr coating compared to titanium iron oxide alone. Since porosity plays a critical role in determining the corrosion performance of coatings, this reduction is especially beneficial. The presence of fewer and smaller pores in the structure enhances the barrier properties of the coating, thereby improving its corrosion resistance (Zhao et al., 2005).
Hardness measurements
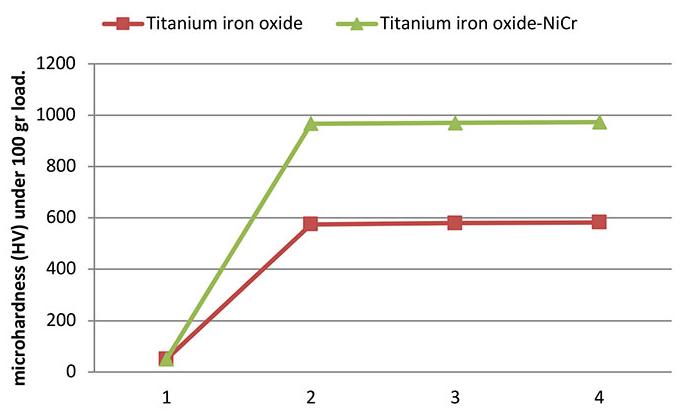
Figure 5 presents the measured average microhardness values of the titanium iron oxide and titanium iron oxide-NiCr coatings. A significant difference in hardness between the two coatings
is evident. This variation can be attributed to several factors, including porosity levels, the proportion of unmelted and semi-melted particles, the presence of fully melted and rapidly solidified particles, oxide phases, and differences in grain size and morphology—all of which are known to influence the hardness of thermally sprayed coatings (Mahesh et al., 2008; Kamal et al., 2010). The reduced porosity observed in the titanium iron oxide-NiCr coating, due to the incorporation of hard NiCr particles, contributes to the increase in hardness. Moreover, the XRD analysis confirms the presence of hard phases such as TiO₂, Fe₂O₃, Cr, and Ni in the NiCr-containing coating, further enhancing its hardness. Notably, the addition of 30 wt% NiCr to the titanium iron oxide powder resulted in a substantial improvement in hardness, suggesting that this composition may represent an optimal reinforcement level for maximising hardness performance.
Polarisation results
Figure 6 illustrates the Tafel polarisation curves of the coatings produced via the HVOF thermal spraying process, along with the uncoated steel substrate, in a 3.5% NaCl solution under ambient conditions.
The extracted electrochemical parameters of these curves, such as corrosion potential (Ecorr), corrosion flow density (icorr) (corrosion rate) cathodic and anodic Tafel slips, which were obtained using the Tafel extrapolation method, are presented in Table 2. Based on Table 2, the coating containing NiCr exhibits a more noble corrosion potential compared to both the substrate and the NiCr-free coating, indicating improved corrosion resistance.
The corrosion, current density significantly decreases with the addition of NiCr particles, and the corrosion potential shifts toward more positive values. As observed in the Tafel curve, the coated samples exhibit a passive-like behaviour. The corrosion rate of the uncoated sample is 112 μAcm-2, while the sample with the titanium iron oxide coating shows a corrosion rate of 315 μAcm-2, which leads to the breakdown of the passive-like layer at higher anodic
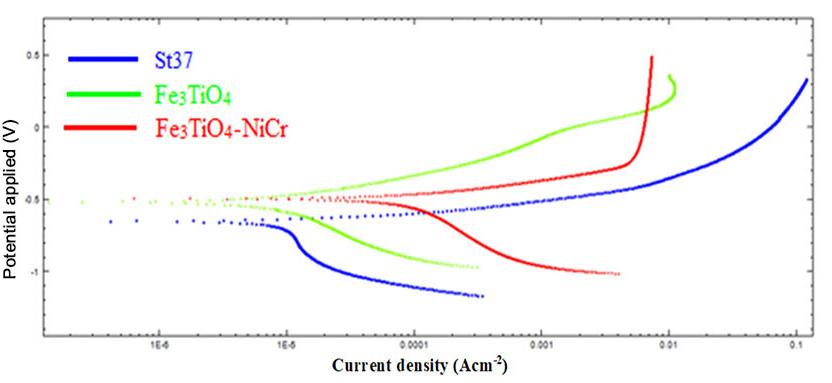
Figure 5—The average microhardness values of the HVOF coatings
Figure 6—Polarisation curves of St37 steel substrate, HVOF titanium iron oxide (Fe3TiO4) and titanium iron
in
NaCl solution
Table 2
Evaluating the corrosion and wear behaviour of high velocity oxygen fuel sprayed titanium
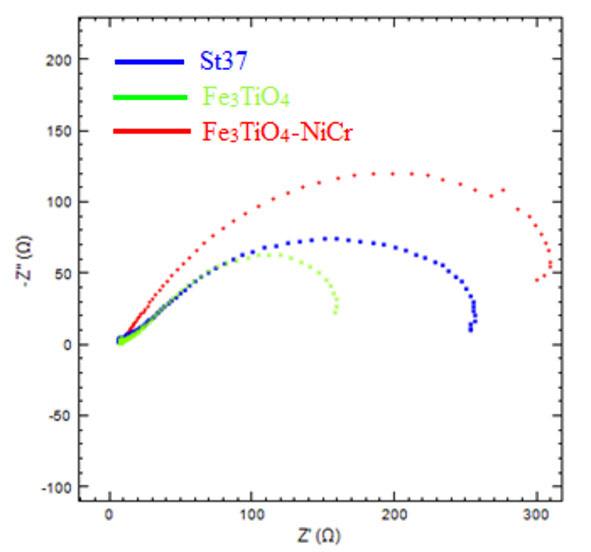
potentials around -0.1 V. Notably, the corrosion rate is reduced to 42 μAcm-2 with the addition of NiCr. This reduction can be attributed to the passive-like behaviour of the NiCr coating at high anodic potentials, which prevents electrolyte diffusion into the underlying layers, resulting in a decrease in the corrosion current density and enhanced stability at higher potentials. In other words, the passive-like layer in the NiCr coating is not porous. Therefore, it causes disruption of the electron transfer on the surface and obstructs it from participating in electrochemical reactions. This behaviour has a high resistance in comparison with other researchers (Verdian et al., 2010; Myalska et al., 2017; Pileggi et al., 2015; Hassannejad et al., 2017). The Nyquist plot for the coated samples and the steel substrate is shown in Figure 7.
In this circuit, a capacitive ring is observed, which is associated with the coating resistance on the electrode surface. The impedance data extracted from the equivalent circuit include charge transfer resistance (Rct), a constant phase element (Q) representing the capacitor behaviour, and the Ohmic resistance of the electrolyte, which remains low across all samples (11.2 Ω·cm² – 13.5 Ω·cm²). As shown in Figure 7, the titanium iron oxide coating exhibits the smallest diameter of the semicircle, indicating a relatively low charge transfer resistance (167 Ω·cm²), compared to the steel substrate (270 Ω·cm²). The charge transfer resistance is directly related to electron transfer across the coating surface and inversely proportional to the corrosion rate. The charge transfer resistance increases with the addition of NiCr to the titanium iron oxide coating (312 Ω·cm²), which corresponds to the largest diameter of the semicircle. The enhancement in charge transfer resistance in the titanium iron oxide-NiCr coating is attributed to the high resistance of the dual-layer structure against the penetration of corrosive agents into the underlying layers, which is facilitated
by the uniform distribution of nickel and chromium particles on the coating surface and between the layers. The high correlation between the experimental data and the proposed equivalent circuit further demonstrates the accuracy of the model used to describe the corrosion behaviour of the samples in a corrosive environment. This behaviour is similar to that observed in other dense coatings, such as stainless-steel coatings, TiNi coatings with TiO₂ particles, and WC-CoCr coatings, which exhibit passive behaviour (Magnani et al., 2007; Cheng et al., 2004; Guilemany et al., 2006).
Wear results
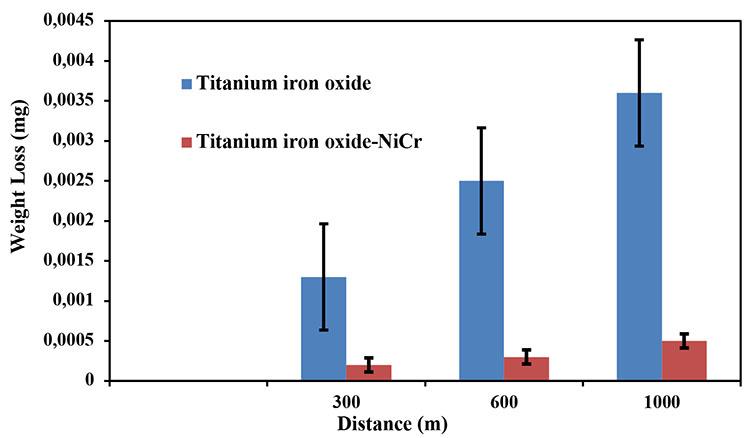
Figure 8 presents the weight loss data of the titanium iron oxide and titanium iron oxide-NiCr coating samples after undergoing a continuous 1000-metre sliding distance. The results show that the weight loss for the titanium iron oxide sample is 0.0036 g, while the weight loss significantly decreases to 0.0005 g upon adding NiCr particles, forming the titanium iron oxide-NiCr coating. This reduction in weight loss for the titanium iron oxide-NiCr coating is attributed to its higher hardness, which results in a lower wear rate compared to the titanium iron oxide coating. This trend aligns with Archard's wear law (Zmitrowicz, 2006), which is expressed as:
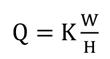
Where Q denotes the wear volume in the slipway unit, W is the applying load, H is the hardness and K defines as the wear coefficient. Hence, weight loss of the coating during the wear test has a reverse relation with its hardness. The results of several researchers show the correctness of this issue (Fang et al., 2009; Lih et al., 2000). Many research studies have been conducted on the effect of NiCr on the wear resistance. Their results indicate that the wear rate is lessened by adding NiCr particles and led to the improvement of the wear resistance (Zavareh et al., 2016; Karaoglanli et al., 2017).
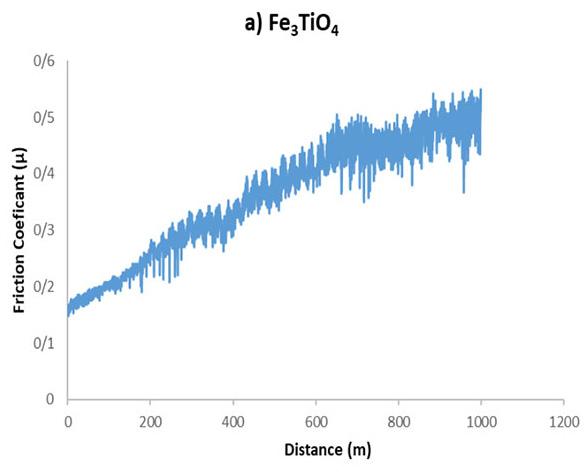
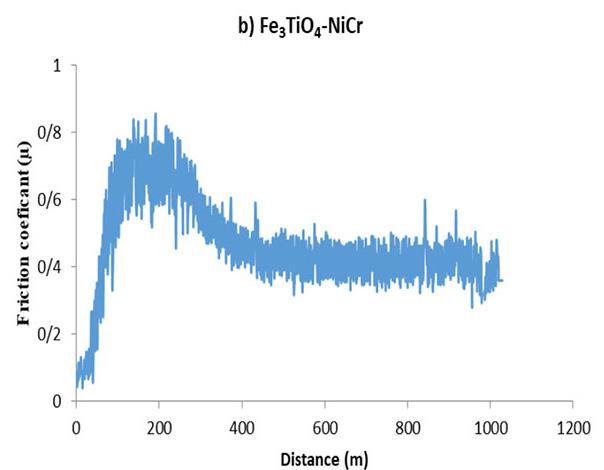
Figure 9 presents the variation of the friction coefficient for the HVOF-coated samples. The curves exhibit significant fluctuations, which are attributed to the repeated adhesion and detachment of wear particles. These fluctuations lead to periodic increases and decrease in the force exerted between the abrasive and the coating surface. At the beginning of the test, the friction coefficient for the titanium iron oxide-NiCr coating is notably lower than that of the titanium iron oxide coating. The high slope observed at the start of the friction coefficient curve for the titanium iron oxide coating can be explained by the rapid accumulation of wear particles. These particles accumulate between the two contacting surfaces, which increases the wear rate. As the test progresses, the removal of some particles results in a reduction in the friction coefficient. The stability of the friction curve for titanium iron oxide occurs when the number of particles generated and trapped between the surfaces is balanced by the number of particles removed from the surfaces.
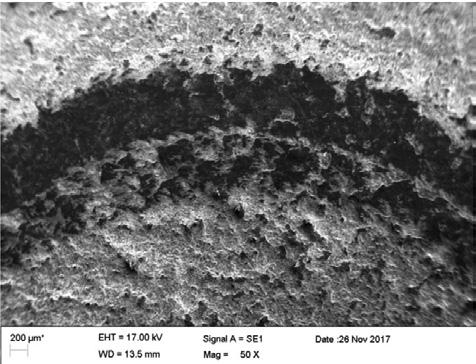
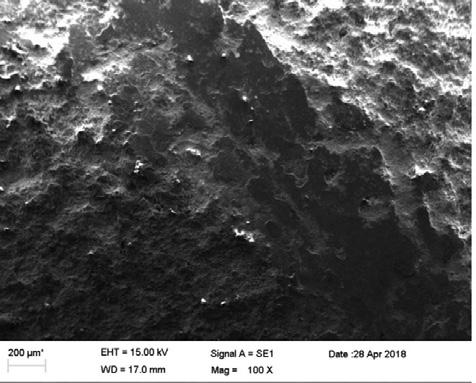
The coating containing NiCr exhibits lower roughness compared to the titanium iron oxide coating. According to the findings of Magnani et al. (2004), coatings with lower roughness are expected to stabilise more quickly or over shorter distances. However, in this study, the titanium iron oxide-NiCr coating behaves contrary to these expectations. This discrepancy can be attributed to the increased temperature at the contact point of the abrasive particles, caused by the frictional heat. This elevated temperature leads to the oxidation of the particles (Magnani et al., 2008; Srinivasan et al., 2012). The images in Figure 10 (a) and (c) show SEM micrographs of the worn paths of the titanium iron oxide and titanium iron oxide-NiCr coatings at 200 x magnification.
Figure 7—Experimental Nyquist diagram for steel substrate and HVOF coatings in 3.5% NaCl solution
Figure 8—Wear rate of coatings
Evaluating the corrosion and wear behaviour of high velocity oxygen fuel sprayed titanium
The wear on the NiCr-containing coating is negligible compared to the titanium iron oxide coating, owing to the lower roughness and the presence of hard phases. No signs of lamination (ductility) or particle breakage were observed in either coating. Only micro-scratches, indicative of abrasion, were visible, aligned in the direction of the wear. These grooves suggest a shredding mechanism. In higher magnification images (Figure 10b and 10d), white areas are visible, which likely indicate particle detachment, pointing to an adhesion mechanism in operation. SEM images of both coatings show no microcracks, delamination, or any destructive effects. Furthermore, due to the higher hardness and lower friction coefficient of the titanium iron oxide-NiCr coating, the wear tracks appear smoother and less pronounced, as seen in the microscopic images of this coating (Karaoglanli et al., 2017).
Conclusion
The HVOF technique has been used to deposit titanium iron oxide and titanium iron oxide-NiCr coatings on St37 carbon steel
substrate and the micro-structure; corrosion resistance and wear resistance were characterised. The following observations were made based on the present study.
➤ The porosity amount of the coating was decreased from 1.4% in the sample without NiCr to 0.4 % in the sample with NiCr, which indicates a coating with high density and hardness and strong bond strength.
➤ The coating hardness was increased from 570 HV to 970 HV by adding NiCr.
➤ The incorporation of NiCr into the titanium iron oxide coating led to a significant improvement in corrosion resistance, as indicated by the decrease in corrosion current density (icorr) from 315 μAcm-2 for the titanium iron oxide coating to 42 μAcm-2 for the titanium iron oxide-NiCr coating, and a positive shift in corrosion potential (Ecorr) from -509 mV to -488 mV. These results demonstrate the formation of a more stable and protective passive-like layer, effectively enhancing the corrosion resistance of the coating.
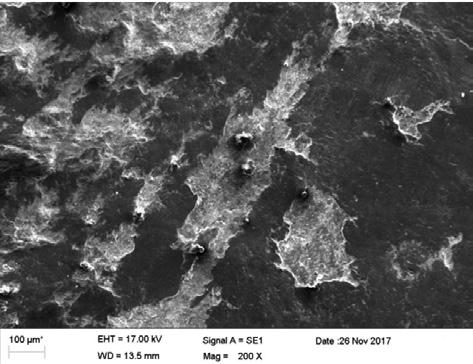
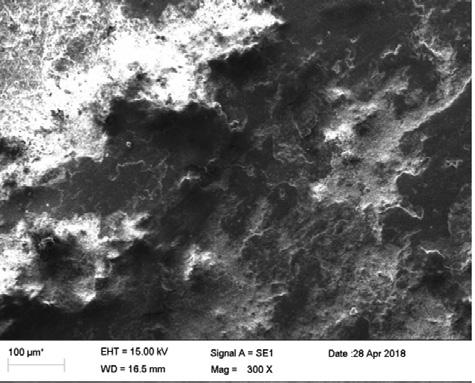
Figure 10—SEM images of wear tracks on (a, b) titanium iron oxide and (c, d) titanium iron oxide-NiCr coatings
Figure 9—Evolution of the friction for HVOF (a) Fe3TiO4, and (b) Fe3TiO4-NiCr coatings
Evaluating the corrosion and wear behaviour of high velocity oxygen fuel sprayed titanium
➤ The weight loss of the titanium iron oxide-NiCr coating was low due to the presence of the NiCr particles. Besides, the wear behaviour was improved owing to the formation of the hard phases.
References
Ak, N.F., Tekmen, C., Ozdemir, I., Soykan, H.S., Celik, E. 2003. NiCr Coatings on Stainless Steel by HVOF Technique, Surfcoat Coatings Technology, 174–175, p 1070–1073. doi:10.1016/S02578972(03)00367-0
Brandolt, C.S., Malfatti, C.F., Ortega Vega, M.R., Navarro Hidalgo, G.E., R. M. Schroeder, R.M. 2019. Determination of hydrogen trapping mechanisms by microprinting in Ni and Co coatings obtained by HVOF. Surface and Coatings Technology, vol. 362, pp. 262–273. doi.org/10.1016/j.surfcoat.2019.01.111
Cheng, F., Shi, P., Man, H. 2004. A Preliminary Study of TiO2 Deposition on NiTi by a Hydrothermal Method. Surfcoat Coatings Technology, vol. 187, no. 1, p 26–32. doi:10.1016/j.surfcoat.2004.01.023
Ding, L., Torbati-Sarraf, H., Poursaee, A. 2018. The Influence of the Sandblasting as a Surface Mechanical Attrition Treatment on the Electrochemical Behavior of Carbon Steel in Different PH Solutions. Surfcoat Coatings Technology, vol. 352, pp. 112–119.
Fang, W., Cho, T.Y., Yoon, J.H., Song, K.O., Hur, S.K., Youn, S.J., Chun, H.G. 2009. Processing Optimization, Surface Properties and Wear Behavior of HVOF Spraying WC–CrC–Ni Coating. Journal of Material Processing Technology, vol. 209, no. 7, pp. 3561–3567. doi:10.1016/j.jmatprotec.2008.08.024
Galedari, S.A., Mahdavi, A., Azarmi, F., Huang, Y., McDonald, A. 2019. A Comprehensive Review of Corrosion Resistance of Thermally-Sprayed and Thermally-Diffused Protective Coatings on Steel Structures. Journal of Thermal Spray Technology, vol. 8, no. 4, p 645–677. doi:10.1007/s11666-019-00855-3
Guilemany, J.M., Fernández, J., Espallargas, N., Suegama, P.H., Benedetti, A.V. 2006. Influence of Spraying Parameters on the Electrochemical Behaviour of HVOF Thermally Sprayed Stainless Steel Coatings in 3.4% NaCl. Surfcoat Coatings Technology, 2006, vol. 200, no. 9, p 3064–3072. doi:10.1016/j.surfcoat.2005.02.116
Hassannejad, H., Moghaddasi, M., Saebnoori, E., Baboukani, A.R. 2017. Microstructure, Deposition Mechanism and Corrosion Behavior of Nanostructured Cerium Oxide Conversion Coating Modified with Chitosan on AA2024 Aluminum Alloy. Journal of Alloys and Compounds, vol. 725, p 968–975. doi:10.1016/j. jallcom.2017.07.253
Hong, S., Wu, Y.P., Gao, W.W., Wang, B., Guo, W.M., Lin, J.R. 2014. Microstructural Characterisation and Microhardness Distribution of HVOF Sprayed WC–10Co–4Cr Coating. Surfcoat Eng, vol. 30, no. 1, pp. 53–58. doi:10.1179/174329441 3Y.0000000184
Hong, S., Wang, Z., Lin, J.R., Cheny, J.B., Sun, W., Y. Zheng, Y. 2023. Hydro-abrosive erosion behaviors of HVOF sprayed Carbidebased Cemet Coatings in Simulated Seawater Slurries, Tribol. lnt, 177, Article (108001).
Jones, M., Horlock, A., Shipway, P., McCartney, D., Wood, J. 2001. A Comparison of the Abrasive Wear Behaviour of HVOF
Sprayed Titanium Carbide- and Titanium Boride-Based Cermet Coatings. Wear, vol. 251, no. 1–12, pp. 1009–1016. doi:10.1016/S0043-1648(01)00702-5
Kamal, S., Jayaganthan, R., Prakash, S. 2010. Mechanical and Microstructural Characteristics of Detonation Gun Sprayed NiCrAlY+0.4wt% CeO2 Coatings on Superalloys. Materials Chemistry and Physics, vol. 122, no. 1, pp. 262–268. doi:10.1016/j.matchemphys.2010.02.046
Karaoglanli, A.C., Oge, M., Doleker, K.M., Hotamis, M. 2017. Comparison of Tribological Properties of HVOF Sprayed Coatings with Different Composition. Surfcoat Coatings Technology, vol. 318, pp. 299–308. doi:10.1016/j. surfcoat.2017.02.021
Karimi, A., Verdon, C., Martin, J.L., Schmid, R.K. 1995. Slurry erosion behaviour of thermally sprayed WC-M Coating. Wear, 186-187, pp. 480-486.
Lekatou, A., Zois, D., Grimanelis, D. 2008. Corrosion Properties of HVOF Cermet Coatings with Bond Coats in an Aqueous Chloride Environment. Thin Solid Films, vol. 516, no. 16, pp. 5700–5705. doi:10.1016/j.tsf.2007.07.130
Li, C.J., Ohnori, A., Harada, Y. 1996. Effect of Powder Structure on the Structure of Thermaly Sprayed WC-Co Coatings Journal of Materials and Science, vol. 31, pp. 785–794.
Lih, W.-C., Yang, S., Su, C., Huang, S., Hsu, I., and M.. Leu, M. 2000. Effects of Process Parameters on Molten Particle Speed and Surface Temperature and the Properties of HVOF CrC/NiCr Coatings. Surfcoat Coatings Technology, 133–134, pp. 54–60, doi:10.1016/S0257-8972(00)00873-2
Magnani, M., Suegama, P.H., Recco, A.A.C., Guilemany, J.M., Fugivara, C.S., Benedetti, A.V. 2007. WC-CoCr Coatings Sprayed by High Velocity Oxygen-Fuel (HVOF) Flame on AA7050 Aluminum Alloy: Electrochemical Behavior in 3.5% NaCl Solution. Materials Research, vol. 10, no. 4, pp. 377–385, doi:10.1590/S1516-14392007000400010
Magnani, M., Suegama, P.H., Espallargas, N., Dosta, S., Fugivara, C.S., Guilemany, J.M., Benedetti, A.V. 2008. Influence of HVOF Parameters on the Corrosion and Wear Resistance of WC-Co Coatings Sprayed on AA7050 T7. Surfcoat Coatings Technology, vol. 202, no. 19, pp. 4746–4757. doi:10.1016/j. surfcoat.2008.04.055
Mahesh, R.A., Jayaganthan, R., Prakash, S. 2008. Oxidation Behavior of HVOF Sprayed Ni–5Al Coatings Deposited on Ni- and Fe-Based Superalloys under Cyclic Condition. Material Science and Engineering. A, vol. 475, no. 1–2, p 327–335. doi:10.1016/j.msea.2007.04.108
Murthy, J.K.N., Venkataraman, B. 2006. Abrasive Wear Behaviour of WC–CoCr and Cr3C2–20(NiCr) Deposited by HVOF and Detonation Spray Processes. Surfcoat Coatings Technology, vol. 200, no. 8, pp. 2642–2652. doi:10.1016/j. surfcoat.2004.10.136
Myalska, H., Michalska, J.K., Moskal, G., and Szymański, K. 2017. Effect of Nano-Sized TiC Powder on Microstructure and the Corrosion Resistance of WC-Co Thermal Spray Coatings. Surfcoat Coatings Technology, vol. 318, pp. 270–278. doi:10.1016/j.surfcoat.2017.01.078
Evaluating the corrosion and wear behaviour of high velocity oxygen fuel sprayed titanium
Park, G., Bae, G., Moon, K., and C. Lee, C. 2013. Effect of Plasma Nitriding and Nitrocarburizing on HVOF-Sprayed Stainless Steel Coatings. Journal of Thermal Spray Technology, vol. 22, no. 8, pp. 1366–1373. doi:10.1007/s11666-013-0035-4
Pileggi, R., Tului, M., Stocchi, D., Lionetti, S. 2015. Tribo-Corrosion Behaviour of Chromium Carbide Based Coatings Deposited by HVOF. Surfcoat Coatings Technology, vol. 268, pp. 247–251. doi:10.1016/j.surfcoat.2014.10.007
Puetz, P., Huang, X., Lima, R.S., Yang,Q., Zhao, L. 2010. Characterization of Transient Oxide Formation on CoNiCrAlY after Heat Treatment in Vacuum and Air. Surfcoat Coatings Technology, vol. 205, no. 2, pp. 647–657. doi:10.1016/j. surfcoat.2010.07.079
Sadeghimeresht, E., Markocsan, N., Nylén, P. 2017. Microstructural Characteristics and Corrosion Behavior of HVAF- and HVOFSprayed Fe-Based Coatings. Surfcoat Coatings Technology, vol. 318, pp. 365–373. doi:10.1016/j.surfcoat.2016.11.088
Sá Brito, V.R.S., Bastos, I.N., Costa, H.R.M. 2012. Corrosion Resistance and Characterization of Metallic Coatings Deposited by Thermal Spray on Carbon Steel. Matererials and Designs, vol. 41, pp. 282–288. doi:10.1016/j.matdes.2012.05.008
Sidhu, H.S., Sidhu, B.S., Prakah, S. 2007 , Hot Corrosion Behavior of HVOF Sprayed Coatings on ASTM SA213-T11 Steel. Journal of Thermal Spray Technology, vol. 16, no. 3, pp. 349–354. doi:10.1007/s11666-007-9029-4
Sidhu, T.S., Prakash, S. 2006. Hot corrosion and performance of nickel-based coatings. Current science, vol. 90, no. 1, pp. 41–47.
Singh, G., Kaur, M., Upadhyaya, R. 2019. Wear and Friction Behavior of NiCrBSi Coatings at Elevated Temperatures. Journal of Thermal Spray Technology, vol. 28, no. 5, pp. 1081–1102. doi:10.1007/s11666-019-00876-y
Srinivasan, M., Loganathan, C., Kamaraj, M., Nguyen, Q.B., Gupta, M., Narayanasamy, R. 2012. Sliding Wear Behaviour of AZ31B Magnesium Alloy and Nano-Composite. Trans. Nonferrous Met. Soc. China (English Ed., The Nonferrous Metals Society of China, vol. 22, no. 1, pp. 60–65. doi:10.1016/S10036326(11)61140-0
Stokes, J., Looney, L. 2004. Residuol Stress in HVOF Thermally Sprayed thick Deposits. Surfcoat Coat. Technology, 177-178, pp. 18–23.
Suarez, M., Bellayer, S., Traisnel, M., Gonzalez, W., Chicot, D., Lesage, J., Puchi-Cabrera, E.S., Staia, M.H. 2008. Corrosion Behavior of Cr3C2–NiCr Vacuum Plasma Sprayed Coatings. Surfcoat Coatings Technology, vol. 202, no. 18, pp. 4566–4571. doi:10.1016/j.surfcoat.2008.04.043
Tobergte, D.R., Curtis, S. 2013. Handbook of Thermal Spray Technology. Journal of Chemical Information and Modeling Torbati-Sarraf, H., Poursaee, A. 2018. Corrosion of Coupled Steels with Different Microstructures in Concrete Environment. Construction Building Materials, vol. 167, pp. 680–687.
Verdian, M.M., Raeissi, K., Salehi, M. 2010. Electrochemical Impedance Spectroscopy of HVOF-Sprayed NiTi Intermetallic Coatings Deposited on AISI 1045 Steel. Journal of Alloys and Compounds, Elsevier B.V, vol. 507, no. 1, p 42–46. doi:10.1016/j.jallcom.2010.07.132
Verdian, M.M., Raeissi, K., Salehi, M. 2010. Corrosion Performance of HVOF and APS Thermally Sprayed NiTi Intermetallic Coatings in 3.5% NaCl Solution. Corros Science, Elsevier Ltd, vol. 52, no. 3, pp. 1052–1059. doi:10.1016/j.corsci.2009.11.034
Verdian, M.M., K. Raeissi, K., Salehi, M. 2012. Characterization and Electrochemical Properties of Ni(Si)/Ni5Si2 Multiphase Coatings Prepared by HVOF Spraying. Applied Surfcoat Science, vol. 261, pp. 493–498. doi:10.1016/j.apsusc.2012.08.043
Wei, Z.Y., Cui, D.D., Wei, Z., Kory, S. 2023. Effect of Sulphide Concentration on Corrosion Behaviors of HVOF-Sprayed WC-Cr3C2-Ni and WC-Ni Coatings. International Journal of Refractory Metals and Hard Materials, 111, Article (106104).
Xie, M., Zhang, S., Li, M. 2013. Comparative Investigation on HVOF Sprayed Carbide-Based Coatings. Applied Surfcoat Science, vol. 273, pp. 799–805. doi:10.1016/j.apsusc.2013.03.010
Yilbas, B.S., Khalid, M., Abdul-Aleem, B.J. 2003.Corrosion Behavior of HVOF Coated Sheets. Journal of Thermal Spray Technology, vol. 12, no. 4, pp. 572–575. doi:10.1361/105996303772082323
Zavareh, M.A., Sarhan, A.A.D.M., Zavareh, P.A., Razak, B.B.A., Basirun, W.J., M.B.C. Ismail, M.C.B. 2016. Development and Protection Evaluation of Two New, Advanced Ceramic Composite Thermal Spray Coatings, Al2O3–40TiO2 and Cr3C2–20NiCr on Carbon Steel Petroleum Oil Piping. Ceramics International vol. 42, no. 4, pp. 5203–5210, doi:10.1016/j.ceramint.2015.12.044
Zhao, L., Lugscheider, E. 2003. Influence of the Spraying Processes on the Properties of 316L Stainless Steel Coatings. Surfcoat Coatings Technology, vol. 162, no. 1, pp. 6–10.
Zhao, W.-M., Wang, Y., Dong, L.-X., Wu, K.-Y., Xue, J. 2005. Corrosion Mechanism of NiCrBSi Coatings Deposited by HVOF. Surfcoat Coatings Technology, vol. 190, no. 2–3, pp. 293–298. doi:10.1016/j.surfcoat.2004.04.057
Zmitrowicz, A. 2006. Wear Patterns and Laws of Wear - A Review. Journal of Theory Applied Mechanics, vol. 44, no. 1803, pp. 219–253. u
Affiliation:
1 Sivas Vocational School of Technical Sciences, Sivas Cumhuriyet University, Türkiye
2 Geophysics Engineering Department, Sivas Cumhuriyet University, Türkiye
3 Industrial Engineering Department, Sivas Cumhuriyet University, Türkiye
4 Hekimhan Mehmet Emin Sungur Vocational School, Malatya Turgut Ozal University, Türkiye
Correspondence to:
Z. Duran
Email: zduran@cumhuriyet.edu.tr
Dates:
Received: 4 Jul. 2024
Revised: Nov. 2025
Accepted: 27 Feb. 2026
Published: May. 2026
How to cite:
Duran, Z., Erdem, B., Dogan, T., Genc, M. 2026. Modelling particulate matter concentration from loading operations in mineral quarries with a decision tree approach. Journal of the Southern African Institute of Mining and Metallurgy, vol. 126, no. 5, pp. 261–278
DOI ID:
https://doi.org/10.17159/2411-9717/3496/2026
ORCiD:
Z. Duran
https://orcid.org/0000-0002-9327-8567
B. Erdem
https://orcid.org/0000-0002-1226-9248
T. Dogan
https://orcid.org/0000-0002-2628-4238
M. Genc
https://orcid.org/0000-0002-9950-0720
Modelling particulate matter concentration from loading operations in mineral quarries with a decision tree approach
by Z. Duran¹, B. Erdem², T. Dogan³, M. Genc⁴
Abstract
This study aims to develop a model for particulate matter concentration during the loading process in open pit mining. The researchers conducted simultaneous measurements of particulate matter and meteorological parameters and collected samples to determine the moisture content of the loaded materials. The analysis used 7,895 measurement data points from gypsum and limestone quarries, employing two data analysis programs, SPSS® and Waikato Environment for Knowledge Analysis, to derive equations for predicting particulate matter release. In the modelling, particulate matter measurements were the dependent variables, while meteorological parameters, laboratory measurement results, and loader bucket capacities were the independent variables. The classical regression models did not adequately capture the dependent variable, thus, the researchers explored the decision tree approach for further modelling. The M5P algorithm was used to generate regression equations for the different data sets, and the findings showed that the models had a satisfactory degree of predictive capability. The number of fine particles released during loading is influenced by various weather factors. Temperature, humidity, wind speed, and station pressure can all affect the dispersal of these particles. Additionally, the moisture content of the loaded material and the capacity of the loading equipment contribute to this process. The M5P decision tree algorithm, which is rarely used in particulate matter concentration models, provides an innovative approach to developing local concentration estimates for non-coal surface mining.
Keywords
data mining, decision tree algorithm, M5P, particulate matter concentration, regression model
Introduction
Air pollution is a major environmental health problem that primarily affects residents of low- and middle-income countries. In 2019, particulate matter was responsible for an estimated 4.2 million premature deaths worldwide due to cardiovascular, respiratory, and cancer diseases (WHO, 2023). The term “dust” generally refers to particles smaller than 75 µm that can remain suspended in the air for a certain period (WHO, 1999). Dusts are defined as substances produced from various inorganic and organic materials during processes such as drilling, crushing, transportation, abrasion, grinding, decomposition, and combustion. They can range in size from 1 μm to 100 μm and settle under the influence of gravity (WHO, 1999; Vidinli et al., 2016).
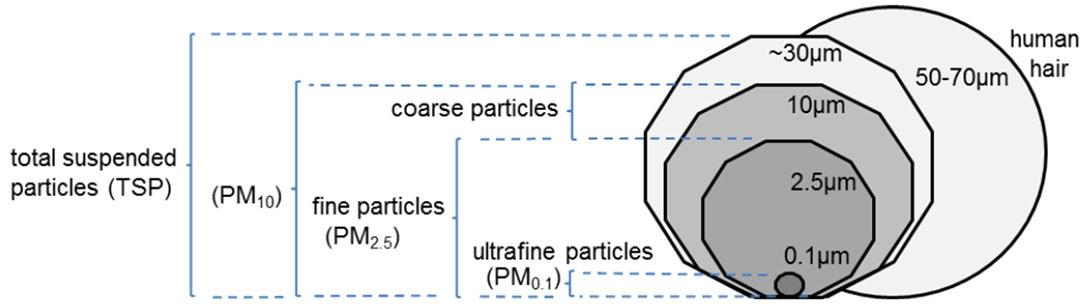
The size of particulate matter (PM) is typically expressed as an aerodynamic diameter, defined as the diameter of a sphere with a density of 1 g/cm³ that settles in still air under gravity at the same rate as the particle under the prevailing temperature, pressure, and relative humidity. PM size can range from a few nanometers (nm) to several tens of micrometers (μm) (Keskinkılıç et al., 2010). There are various approaches to defining the PM size range. Total suspended particles (TSP) has been used to refer to all
Figure
Modelling particulate matter concentration from loading operations in mineral quarries with a decision tree approach
suspended particles of 40 µm and smaller (Chow, Watson, 1998; USEPA, 1998b) or 50 µm and smaller (Araújo et al., 2014). TSP has also been defined as particles between 0 µm and approximately 30 µm – 50 µm (Cao et al., 2013) or all suspended particles of 30 µm and smaller (Evyapan et al., 2012, Hime et al., 2015; NSW EPA, 2015; Patra et al., 2016a). Additionally, particles equal to or smaller than 10 µm are designated as PM10, while those equal to or smaller than 2.5 µm are designated as PM2.5 (WHO, 2006; Keskinkılıç et al., 2010; Evyapan et al., 2012; Araújo et al., 2014; Hime et al., 2015; NSW EPA, 2015; EPA, 2020). Figure 1 presents the classification of PM size ranges.
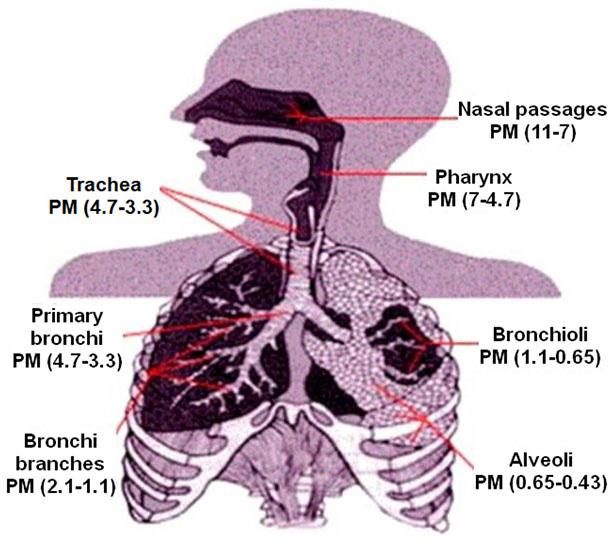
Figure 2 shows the diameters of particles entering the airways, lungs, and bronchi of the human body. The range of particulate matter (PM) that poses a risk to human health is 0.43 µm to 11 µm, while the PM sizes that reach the bronchi and alveoli range from 0.43 µm to 2.1 µm. PM2.5, in particular, can remain suspended in the air for long periods and be transported over long distances. Inhaling particulate matter of this size can directly affect the respiratory system by reaching the deeper parts of the lungs. Workers in mines exposed to particulate matter of this size can suffer from diseases such as asthma, chronic lung disease, silicosis, asbestosis, berylliosis, inflammation, bauxite fibrosis, and siderosis (Gautam et al., 2012).
Surface mining releases a considerable amount of dust that can be hazardous to health and harmful to the environment, especially when dust particles are smaller than 100 µm. Trivedi et al. (2010), Gautam et al. (2012), and Arregocés et al. (2021) have reported on the health and environmental hazards associated with dust from open pit mining. Trivedi et al. (2010) specifically noted that TSP and PM10 emissions from surface coal mines are significant pollutants. Long before the environmental movement began, coal miners faced various occupational diseases that developed later in their working lives, especially during retirement. Long-term exposure to respirable coal dust causes several lung diseases, collectively known as coal miner's lung. In the United States, approximately 76,000 miners have died from this disease since it was legally recognised in 1969. However, reducing exposure limits to respirable dust is unlikely to be sufficient to reverse the increase in coal miner's lung disease observed among the current generation of miners (Duncan, 2015). Additionally, surface coal mining activities such as drilling, blasting, loading, unloading, storage, and transportation on unpaved roads have been identified as sources of air pollution (USEPA, 1995; Singh et al., 2016; Kumar, Kumar 2017; Rojano et al., 2020; Murzin, Gorlenko, 2021; Trechera et al., 2021).
Dust emissions from surface coal mining vary depending on
the type of activity, such as drilling, loading, and transportation. Gautam et al. (2012) argue that modelling is essential for predicting and analysing the movement, distribution, and concentration of particulate matter released during mining activities. They also state that meteorological data is the most important factor determining the dilution of particulate matter. Emission prediction equations vary depending on the physical characteristics of the material, such as moisture and silt content, as well as equipment characteristics, such as bucket or dipper capacity, truck travel speed, work duration, and wind speed. Therefore, further work is needed to develop more consistent prediction equations (Ghose, 2004; Lashgari, Kecojevic, 2016).
Dust in mining is a significant problem affecting the environment, human health, workplace safety, and productivity in mining areas. Air and water pollution are among the most significant environmental problems facing communities in and around the copper mining areas of Zambia (Muma et al., 2020). Studies have shown that dust exposure in various work areas of coal mines can be hazardous (Petavratzi et al., 2005; Ghose, Majee, 2007; Papagiannis et al., 2014; Tripathy et al., 2015). In a recent study at the Lakhanpur opencast coal mine in India, dust exposure was monitored in different work areas (Tripathy et al., 2015). The aim of the study was to analyse dust collected from various sources, calculate personal exposure to dust, and estimate dust concentration in different areas of the mine and its vicinity. The results showed that dust emissions vary between mines and that most workers are exposed to dust concentrations exceeding permissible limits. The main sources of dust in mining were drills and bucket wheel excavators. A comparative analysis estimated dust emissions from electric excavators and wheel loaders in an open coal mine in the USA (Lashgari, Kecojevic, 2016). Three methods of dust estimation were used, including field measurements and laboratory studies: the EPA AP-42 equations to estimate emission factors, the methodology used in developing the AP-42 equations (Type 2 dust emission estimation), and the methodology used in the EPA AERMOD model (Type 3 dust emission estimation). The results showed that dust emissions estimated by the AP-42 method were higher than the area-based emissions determined by the Type 2 and Type 3 methods. In addition, the Type 2 method resulted in higher dust emissions compared to the Type 3 method. Önder and Yiğit (2009) calculated that in an open coal mine in Türkiye, the operator of a drill was exposed to the highest personal dust concentration of 3.08 mg/m³, while the operator of a coal loader was exposed to the lowest personal dust concentration of 1.3 mg/m³. In a separate study, researchers measured the amount of dust to which
Figure 2—Collection areas of dust particles of different diameters in the human body (Löndahl et al., 2006 in Kim et al., 2015)
Modelling particulate matter concentration from loading operations in mineral quarries with a decision tree approach
the operators of heavy machinery were exposed while working in three different opencast mines. Although the dust exposure of the operators of drills and crawler excavators was high, the dust concentration values for all operators were below the limit specified in the relevant regulations (Öztürk, 2016).
The primary objective of this study is to model the concentrations of particulate matter (PM) emitted into the atmosphere during loading operations, a key activity in open pit gypsum and limestone mining. While most studies on PM emissions have focused on minerals such as coal and iron ore, this research makes a unique scientific contribution by addressing the less-studied mining of gypsum and limestone. Monitoring fine particulates, particularly PM10, PM2.5, and PM1, which are critical to human health, strengthens the environmental and public health aspects of the study and provides an important basis for air quality assessment. Methodologically, this study differs significantly from existing modelling approaches. While PM emissions are typically expressed in lb/ton, kg/ton, or g/s in the literature, this study uses PM concentration data directly emitted into the atmosphere during loading, and the models are presented in volume-normalised µg/m³. This approach allows for a more concrete, on-site, and measurable assessment of the impacts of PM directly emitted into the environment on living organisms and ecosystems.
One of the most notable aspects of the study is the development of separate and independent concentration equations for TSP, PM10, PM2.5, and PM1, which represents a rare level of specificity in modelling within the literature. Additionally, because the PM data measured in the study were widely distributed (TSP and PM10 ranged from 0 to over 6527.9, and PM2.5 and PM1 ranged from 0 to over 652.79), traditional linear regression techniques had low explanatory power. Therefore, the M5P algorithm, a decision tree algorithm, was chosen. The M5P algorithm improves the overall explanatory power of the model by incorporating both raw and transformed datasets into the analysis.
During the modelling process, variables such as meteorological factors (temperature, wind speed—including headwind and crosswind speeds—station pressure, relative humidity, etc.), moisture content of the loaded material, and loader bucket capacity were considered to develop PM concentration equations adaptable to similar mine site conditions. In the decision trees created for this purpose, specific PM classes (e.g., LM1, LM2) were specified at each leaf node, along with the number of samples and intraclass ratios, clearly demonstrating the model's classification success and the accuracy of the decision points. The explainability and visual interpretability provided by the decision tree structure offer significant advantages for developing field-based decision support systems. For these reasons, this study makes an original contribution to the literature in both content and methodology for modelling PM concentrations resulting from loading activities in gypsum and limestone open pit mining. The modelling structure, developed based on the M5P algorithm and enabling multidimensional data integration, aims to provide a scientific basis for sustainable environmental management strategies by systematically analysing the effects of environmental conditions and operational variables on PM concentrations.
Materials and methods
Study area
One gypsum quarry and two limestone quarries where PM concentration measurements were taken are located within the boundaries of the Sivas Basin, an orogenic sedimentary basin
bounded by faults running northeast to southwest. The basin, situated in Central Anatolia, developed as a foreland basin after the subduction of the Neotethys Ocean during the Late Cretaceous (Poisson et al., 1996). Mining was conducted in the Oligocene-aged massive gypsum deposit, one of the Maastrichtian-Paleoceneaged limestone blocks, and in early Quaternary travertines in the gypsum, limestone (A), and L limestone (B) quarries, respectively. Between July 2020 and November 2021, a total of 7,895 PM concentration measurements were taken in the quarries. To comply with the work permits negotiated with the mine administrations, the identities of the companies were not disclosed. The mining companies in the Sivas region did not operate between December and April due to adverse weather conditions.
In Sivas, which has a continental climate, precipitation occurs in winter, spring, and autumn, while summers are typically dry. The average annual rainfall is 420 mm, and the average snow depth is approximately 20 cm. Of the total precipitation, 22% falls in autumn, 36% in spring, 32% in winter, and 10% in summer. The average atmospheric pressure around Sivas is 853.2 millibars. As a low-pressure center, the area is particularly vulnerable to northern sector winds in summer. The northwest wind accounts for 19.3% of all winds in the Sivas region, followed by the north wind (18.1%), the northeast wind (16.8%), and other winds (SÇR, 2023).
Devices and sampling frequency
The portable PM monitor uses light scattering technology to measure the concentration of particles and dust in the air. Using a standard laser nephelometer detector, it simultaneously measures the characteristics of TSP, PM10, PM2.5, and PM1. The recorded data can be uploaded to a computer via PC-link for further analysis. The device responds quickly and can detect sources of dust and smoke in the air at concentrations as low as 0.1 µg/m³. It can simultaneously measure TSP, PM10, PM2.5, and PM1 outdoors, and TSP, PM10, and PM4 indoors. The device measures PM diameters from 0.5 to 20 µm, with particles larger than 20 µm reduced to this size. It accurately measures up to 6000 µg/m³ (equivalent to 60 mg/ m³ without size selection) at an airflow rate of 0.6 l/min, with an accuracy of 0.01 µg/m³ (Hwang et al., 2014; Dreshaj et al., 2017; Econorm, 2021; Turnkey, 2024). The PM monitor was new and used for the first time in this study (serial number DM12034). It was calibrated by a laboratory accredited by the Turkish Accreditation Agency (TÜRKAK) under registration number AB-0078-K for TS ISO IEC 17025:2017 on 17 February 2020. The relative error in volumetric flow rate (l/min) ranged from 1.8 to 5.3 per mille. In this study, AirQ™ software was used to transfer and process the collected data. The organised data were then uploaded to Excel™ software for statistical analysis.
The portable equipment used for weather monitoring (Kestrel 5500) complies with the Environmental Engineering Considerations and Laboratory Tests (MIL-STD-810G) standard. Air temperature, relative humidity, station pressure, dew point temperature, wind speed, headwind, and crosswind speed were measured and recorded in the device's internal memory. The data in CSV format were transferred to Excel™ via the device's integrated LiNK interface and processed simultaneously with the PM data.
Studies were conducted to optimise the sampling frequency. The initial measurement duration of one minute was insufficient to detect fluctuations in PM concentrations during the loading process, so the duration was kept short. Although both devices can measure continuously, the PM meter's battery is quickly depleted
Modelling particulate matter concentration from loading operations in mineral quarries with a decision tree approach
in this scenario. The battery, which has a backup, can measure for about one hour if data are collected every 5 seconds and up to 2.5 hours if data are collected every 10 seconds. The measurement interval was set to 10 seconds to maximise the use of the day shift for PM measurements and to collect as many samples as possible. The weather meter was started at the same time as the PM meter, and recordings were made at 5-second intervals. The data recorded by the PM meter during that period were used for the analyses.
The PM and meteorological parameter measurements were scheduled to last at least 10 minutes and to cover a full duty cycle of the loader. They were performed simultaneously to accurately represent the task. However, due to possible variations in the duration of the full duty cycle during the loading process, the measurement time was adjusted accordingly. The portable PM meter and weather meter device were placed at a safe distance of 2 to 10 metres from the loading area. The PM meter was placed on a three-legged tachymeter stand, while the weather meter was mounted on a separate tripod. The devices were positioned to collect samples at a height of 1.5 to 1.6 metres, corresponding to the breathing height of an adult (Figure 3).
Crawler excavators were used in the quarries. A Hitachi Zaxis 520 LCH and a Hidromek HMK 300 were used in the limestone (A) and gypsum quarries, respectively. A Hitachi Zaxis 490 LCH and a Hidromek 370 LCH operated in the limestone quarry (B). The bucket capacities ranged from 1.50 m³ to 3.20 m³.
To determine moisture content, samples were collected every 5 minutes during the measurement cycle. All 1-kg samples delivered to the laboratory on the same day were reduced using the coning and quartering method. Moisture content in limestone quarries was determined according to the TS 1900-1 (2006) standard, and in gypsum quarries according to the TS 4447 (1985) standard. Samples from the limestone quarries were weighed at 100 g in a laboratory sample container and placed in an oven at 105 °C for 2 hours. Samples from the gypsum quarry were weighed at 100 g in the sample container and placed in the oven at 40 °C for 30 minutes (Figure 4).
Data analysis
The study's three-stage methodology is outlined in the following (Duran, 2022). In the first stage, all PM variables (TSP, PM10, PM2.5, and PM1) were measured simultaneously using the PM meter. The weather meter recorded air temperature, dew point temperature, relative humidity, station pressure, wind speed, headwind, and crosswind speed. Samples were also collected to represent material characteristics. In the second stage, the moisture content of typical
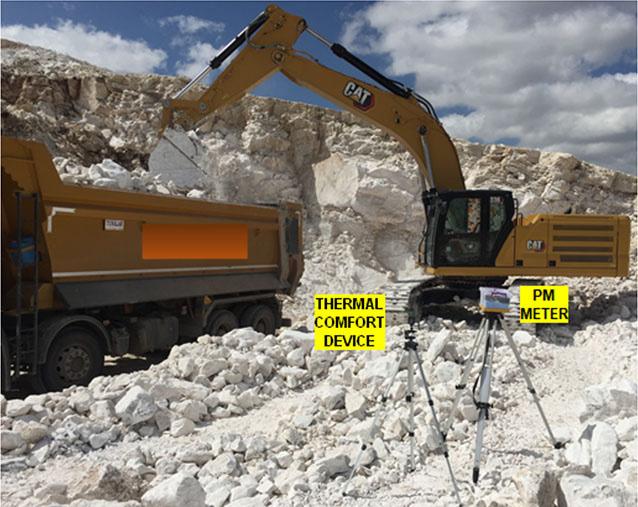
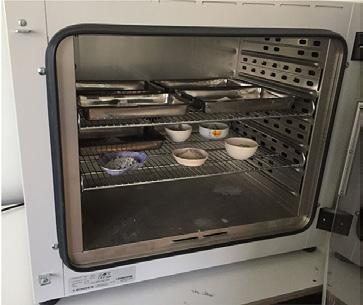
samples collected during field measurements was tested in the laboratory. In the third stage, both field and laboratory data were used to generate equations to estimate PM concentrations. Two software packages, SPSS® and Waikato Environment for Knowledge Analysis (WEKA®), were used for data analysis, with PM data as dependent variables and meteorological parameters and laboratory measurement results as independent variables (Figure 5).
The linear stepwise regression approach
The suitability of all data groups collected in the quarries and determined in the laboratory for normal distribution was assessed using the Shapiro-Wilk test, and a decision was made regarding the use of parametric or non-parametric test methods. If the values for skewness and kurtosis are between ±1.5 (Tabachnick, Fidell, 2013; Erbay, Beydoğan, 2017) or, according to another approach, between ±2.0 (George, Mallery, 2010), the data are considered normally distributed. The variance inflation factor (VIF) is used to test for multicollinearity, which indicates the correlation between independent variables. A multicollinearity problem is identified when the VIF is ≥ 10 (Albayrak, 2005; Montgomery et al., 2012; Büyükuysal, Öz, 2016; Karabulut, 2019; Ahmad et al., 2021) or the VIF is ≥ 5 (Bükey, Çetin, 2017; Avcı, 2020; Shrestha, 2020).
The raw PM concentration datasets covered a large area, which prevented them from conforming to a normal distribution. Therefore, they were transformed using inversion (1/), division by 1000 (/1000), natural logarithm (ln), and logarithm (log). The suitability of the transformed datasets for a normal distribution was tested using skewness and kurtosis values. The datasets transformed with the natural logarithm and logarithm conformed to a normal
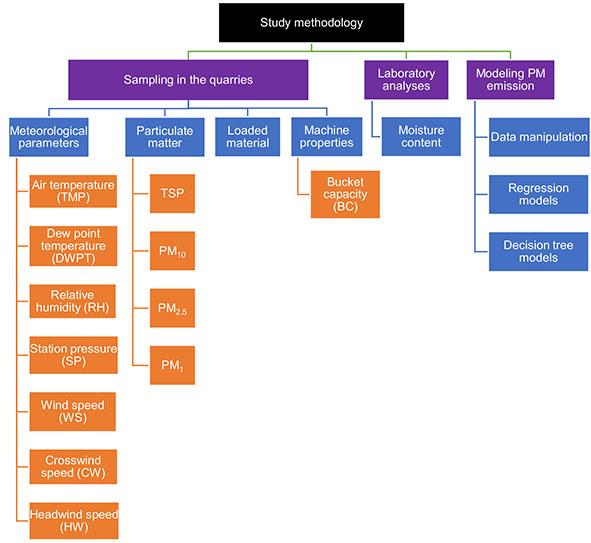
Figure 3—Field sampling setup
Figure 4—Oven drying
Figure 5—Study methodology
Modelling particulate matter concentration from loading operations in mineral quarries with a decision tree approach
Table 1
Results
log(raw)
1/raw
distribution (Table 1).
The decision tree approach
±
PM2.5/1000 0.02 ± 0.04 0.01 (0.00 - 0.54) 5.657 43.902 <0.001
PM1/1000 0.00 ± 0.01 0.00 (0.00 - 0.40) 18.813 452.124 <0.001
Decision trees are widely used for classifying both numeric and alphanumeric data and are recognised for their high interpretability and understandability (Gargano, Raggad, 1999; Chien, Chen, 2008; Czajkowski, Kretowski, 2010; Onan, 2015; Aydemir et al., 2020). These qualities make them particularly suitable for simplifying complex data structures and improving decisionmaking processes. Technical advantages such as low cost, fast processing, easy integration into databases, and high reliability have made decision trees among the most preferred classification algorithms (Akçetin, Çelik, 2014; Aydemir et al., 2020). They are widely applied in areas such as knowledge discovery and pattern recognition. Because they produce understandable classification and regression models, decision trees are also extensively used in critical applications such as medical diagnosis and credit risk assessment. Their nonparametric structure enables them to achieve satisfactory accuracy in both classification and regression problems while providing significant interpretability. In regression, decision trees organise independent variables into a hierarchical structure to predict the dependent variable. Starting from the root node, branching is performed through tests on the attributes, and a specific regression equation is presented at each leaf. The estimation process is completed by following the branches based on the results of these attribute tests, starting from the root (Barros et al., 2015; Aksu, 2018).
The M5P algorithm is a Java implementation of the M5 algorithm developed by John Ross Quinlan for the WEKA software (Quinlan, 1992; Witten et al., 2011). This algorithm provides a decision tree-based regression method, generating linear regression models at each leaf node. The tree is constructed inductively, with independent variables split into branches based on the dependent variable (Del Campo-Avila, Luengo, 2011; Njeguš, Štavljanin, 2015).
The splitting process stops when low variance is observed among the class values at a node or when the number of samples at the node decreases (Öztürk, 2012; Kara, Şamlı, 2021). Pruning is then performed at each leaf node, and linear regression inequalities are derived from the pruned leaves (Sihag, Kumar, 2021). In the model output, each leaf is presented with two numerical values in parentheses: the first indicates the number of samples in that leaf, and the second shows the ratio of the mean square error of the linear model in the leaf to the global absolute deviation in the entire dataset (Witten et al., 2011; Aydemir, 2018; Altair, 2024; Stackexchange, 2024; WEKA, 2024). This structure combines the explanatory power of a decision tree with the predictive power of linear regression, enabling effective modelling, especially for large and multi-layered datasets. The M5P algorithm provides greater explanatory power and accuracy than classical regression trees, and patterns and correlations in the data can be directly identified through rules and regression equations (Figure 6).
The success of numerical models developed using decision tree algorithms such as DecisionStump, RandomForest, RandomTree, and M5P is evaluated using error criteria including the correlation coefficient (R), coefficient of determination (R²), mean absolute error (MAE), root mean square error (RMSE), relative absolute error (RAE), and root relative squared error (RRSE) (Gültepe, 2019). Among these criteria, R² expresses the model's accuracy and ranges from 0 to 1. When this value approaches 0, it indicates that the model does not fit the data (Çınaroğlu, 2016). Similarly, a high correlation coefficient indicates high predictive success; values less than 0.40 are classified as low correlation, 0.40 – 0.70 as normal correlation, and greater than 0.70 as high correlation, indicating better performance (Aydemir, 2018; Schober et al., 2018; Sabti et al., 2019; Tanni et al., 2020). Values close to zero for MAE and RMSE, the most commonly used error measures, indicate high model performance (Wang, Xu, 2004; Gültepe, 2019), and it is recommended to evaluate these two measures together (Chai,
Modelling
particulate matter concentration from loading operations in mineral quarries with a decision tree approach
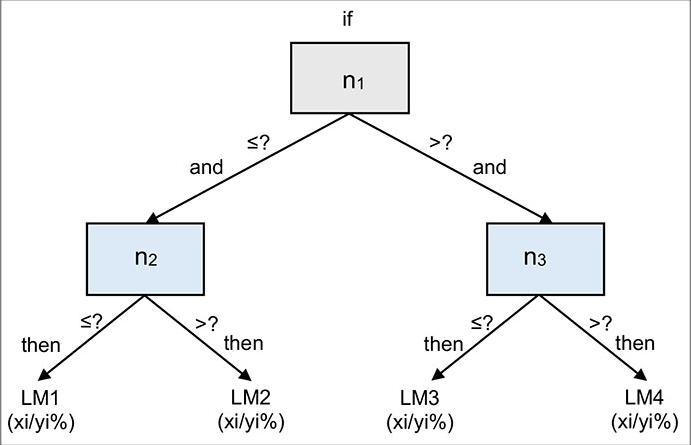
Draxler, 2014). If MAE is zero, the model is considered to produce excellent results (Aydemir, 2018), and if RMSE is zero, it indicates ideal performance (Çınaroğlu, 2017). MAE is a fundamental accuracy parameter that measures the average magnitude of errors in the prediction results. It averages the differences between actual and predicted values and indicates how close the predictions are to the final results (Usha, Balamurugan, 2016). RMSE, in contrast, tends to be higher than MAE when error magnitudes are large. While MAE generates a linear score by considering all individual differences equally, RMSE calculates the mean error by giving greater weight to large errors. Both metrics range from 0 to ∞ and are used to identify error variation in the predictions (Alsultanny, 2020). In this study, in addition to the model success criteria mentioned in the literature, it was found that having a small number of nodes in the model (< 40) is also crucial for model success.
Three different meta-learning algorithms were applied to examine the relationship between the dependent and independent variables: training set, cross-validation, and percentage split. Both forward addition (FA) and backward elimination (BE) search approaches, as well as standard regression methods, were used for model development. The modelling methods of the decision tree technique are illustrated in Figure 7. In the initial approach, the entire dataset was used for both training and testing. The next experiment used a 5- to 15-fold cross-validation technique, where the data was randomly divided into 5 to 15 subsamples. In each iteration, one subsample was set aside as validation data to
evaluate the model, while the remaining k - 1 subsamples were used for training. This cross-validation process was repeated k times, with each subsample serving as the validation data once. For the percentage split method, the dataset was divided into two parts: one for training and one for testing. The training portion used 60% to 70% of the entire dataset, in 1% increments.
Results
Analysis of data recorded from the quarries
During the dry months from July to September, the amount of particulate matter in the air was higher than in October and November. The highest dispersion was recorded in July, and the lowest in November. For all measurements, TSP and PM10 concentrations ranged from 1 µg/m³ to 6527.9 µg/m³, PM2.5 concentrations from 0.3 µg/m³ to 540.22 µg/m³, and PM1 concentrations from 0.01 µg/m³ to 397.47 µg/m³ (Figure 8). The values for meteorological parameters also varied over the months and years (Figure 9). In months with high PM concentrations, relative humidity was low, while air temperature and wind speed were high. The moisture content of the loaded material also differed between the dry and rainy seasons. This variation results from the mineralogical inhomogeneity of the loaded rock, the ability of intervening clay bands to store water, and the effect of water seeping into the subsoil due to the cracked structure of the rock layers. The moisture content of the loaded materials ranged from 0.02% to 21.21%.
Modelling PM concentration using the linear stepwise regression method
The correlation matrix between the normally distributed logarithmic and natural logarithmic dependent variables and the independent variables is shown in Figure 10. The correlation between the dependent and independent variables is low (R ≤ 28%). This indicates that it is very difficult to explain the change in a dependent variable with a single independent variable. There is a low negative correlation (R ≤ 28%) between the moisture of the loaded material and the normally distributed logarithmic and natural logarithmic TSP and PM10 concentrations. There is a high positive correlation (R ≥ 70%) between wind speed, crosswind speed, and headwind speed. There is a positive normal correlation
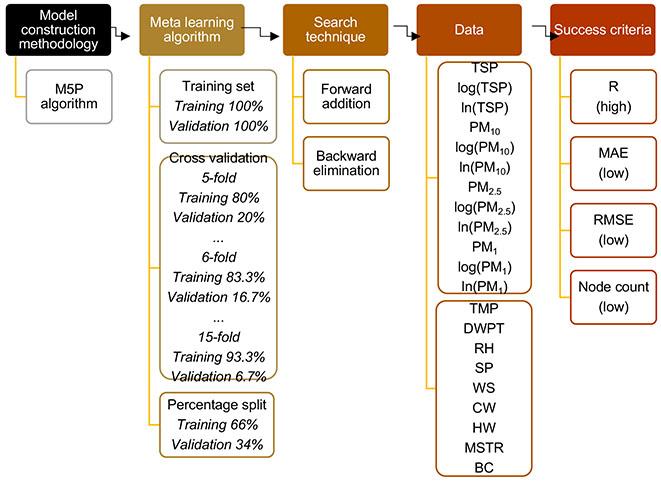
Figure 6—Decision tree algorithm
Figure 7—Modelling methodology used in the study
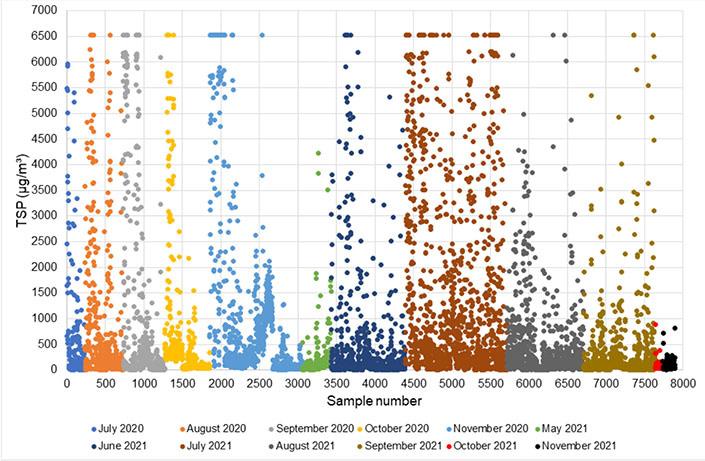
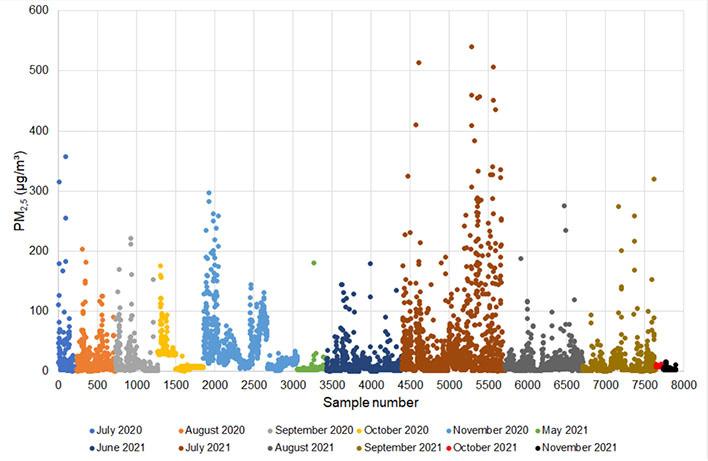
with air temperature and dew point temperature (R < 70%), and a negative normal correlation with relative humidity.
The normally distributed datasets were analysed using stepwise regression with the SPSS® statistical analysis package (George, Mallery, 2010). Several variable selection techniques, including enter, stepwise, and forward selection, were applied during standard regression analyses. However, the coefficient of determination was low in all models (R² < 15%) indicating that they could not accurately capture changes in the dependent variable. Additionally, models developed for similar quarries used different independent variables. This indicates that estimating PM concentrations with standard regression models is statistically unreliable. The main reason for this inadequacy is the wide distribution of the dependent variable data. Nevertheless, strong partial correlations were observed in the developed models, particularly with variables such as the moisture content of the loaded material, wind speed (including headwind), and loader bucket capacity. In contrast, the effects of variables such as air temperature, station pressure, and relative humidity were relatively minor.
Table 2 presents the dominant parameters, the explanatory power of the predictive models, and the partially correlated parameters. The regression models for the logarithmic and natural logarithmic PM datasets were significant (p ≤ 0.001). The independent variables in the regression equations for modelling TSP concentrations are moisture of the loaded material, loader bucket capacity, relative humidity, air temperature, and crosswind and headwind speed. However, these models explain only a small portion of the variation in PM concentrations (adj. R² ≤ 12.2%). For partial correlation, the most influential variables in the regression models are moisture of the loaded material and headwind speed, while air temperature is the least influential variable.
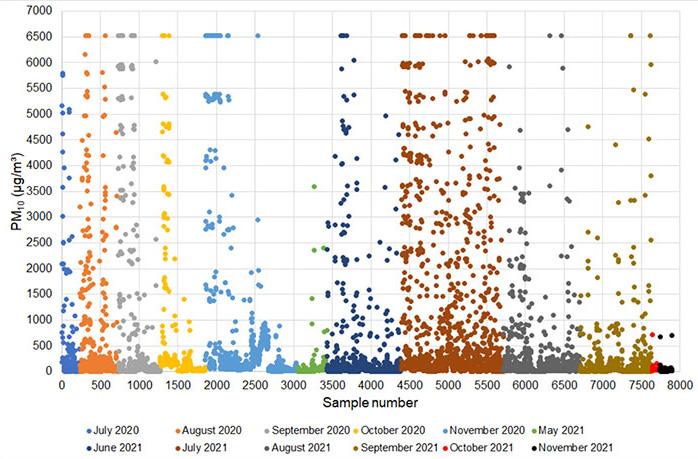
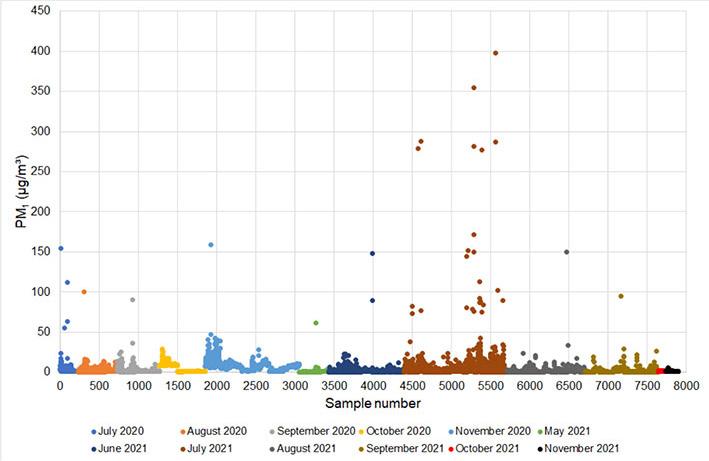
The PM10 regression model is explained by air temperature, relative humidity, moisture of the loaded material, headwind speed, and crosswind speed. The model's significance for explaining changes in particulate matter concentrations is weak (adj. R² ≤ 11%). The most effective variables in the model are headwind speed and moisture of the loaded material.
The PM2.5 regression model is explained by loader bucket capacity, air temperature, relative humidity, station pressure, wind speed (including headwind), and moisture of the loaded material. The model's significance for explaining changes in particulate matter concentrations is also weak (adj. R² ≤ 7.1%). The most effective variables in the model are loader bucket capacity and headwind speed.
The regression analysis showed that the release of PM1 depends on the moisture of the loaded material, air temperature, relative humidity, wind speed (including headwind), and the loader's bucket capacity. However, the independent variables were not sufficient to explain PM release (adj. R² < 13%). Wind speed and loader bucket capacity had the highest partial correlation with PM concentration, while relative humidity had the lowest correlation.
Modelling PM concentration using decision tree approach
As the explanatory power of traditional linear regression models was low, the decision tree technique was used for further modelling. In addition to the original data, transformed datasets were also used in the regression analyses conducted with the M5P decision tree method. The models using raw datasets provided coefficients for TSP and PM10, while the models with logarithmic datasets yielded coefficients for PM2.5 and PM1. Regardless of the metalearning algorithm used, the decision tree equations that best predicted the concentration for each PM size shared the same
Figure 8—PM concentration by month of sampling
Modelling
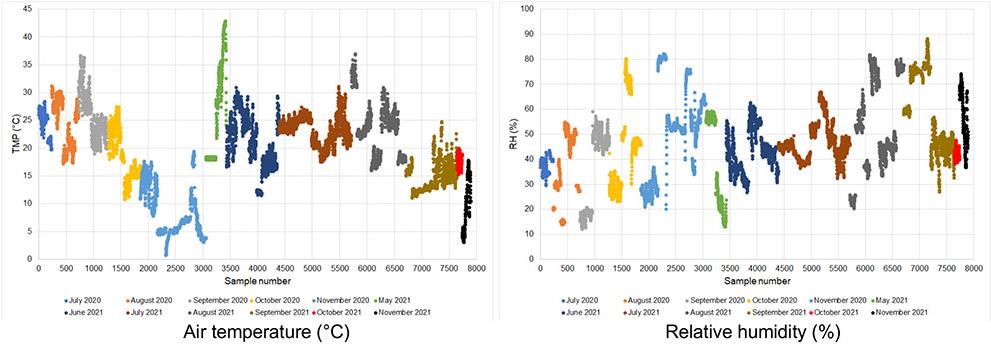
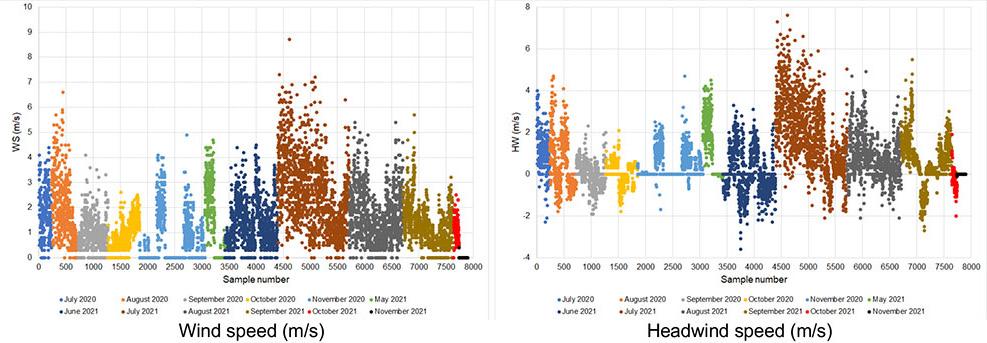
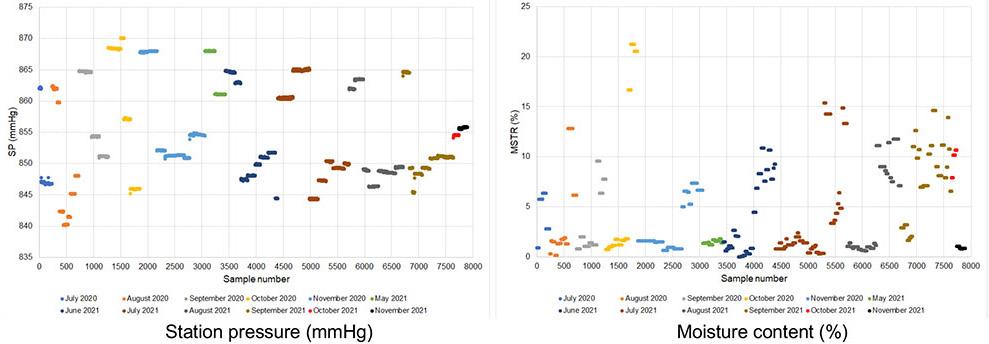
characteristics: 5dew point temperature, wind speed (including headwind and crosswind), loader bucket capacity, and moisture content of the loaded material. Decision trees organised variables by importance, starting from the root node, and generated regression equations for data subsets that met specific conditions in each branch. This approach enabled flexible and reliable predictions of PM concentrations by considering different variable combinations. Additionally, regression equations based on unique parameter combinations for each subset allowed detailed analysis of interactions between variables. The statistical significance of all
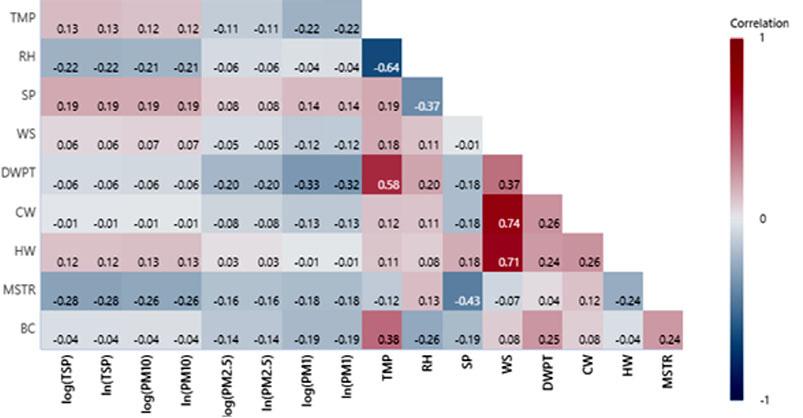
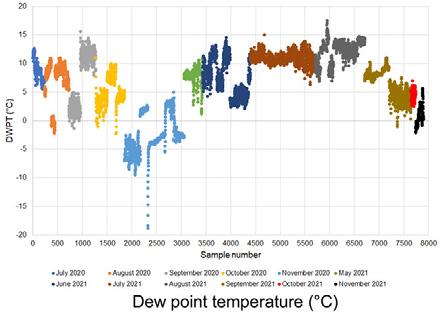
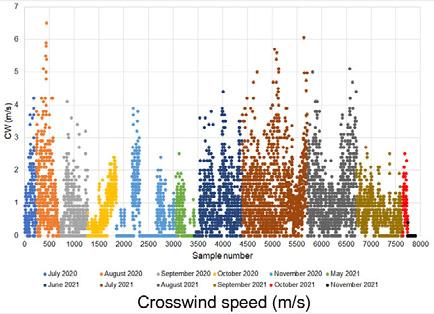
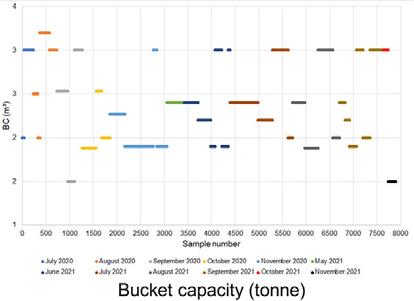
independent variables improved the overall predictive performance of the models.
The M5P model tree developed for predicting TSP concentration and its associated equations is shown in Figure 11. The model has a top-down tree structure with 22 terminal nodes, each containing a regression equation. The first split in the tree is based on station pressure, the most important variable (SP ≤ 858.5 and SP > 858.5), followed by secondary variables such as air temperature and relative humidity. At lower levels, the moisture content of the loaded material and the bucket capacity are included. Each regression equation in the model is calculated using different independent variables. For example, to use the LM22 regression equation, SP must be greater than 858.5 and RH must be greater than 47.95.
The M5P model tree and prediction equations for PM10 concentration are shown in Figure 12. This model has 21 terminal nodes, each with a regression equation. Similar to the TSP model, the first split is based on station pressure (SP ≤ 858.5 and SP > 858.5), followed by air temperature and relative humidity. Variables such as the moisture content of the loaded material and bucket capacity play important roles in the lower branches.
The PM2.5 concentration prediction model has 25 terminal nodes, each represented by its own regression equation (Figure 13). Unlike other models, the first split in the decision tree is based on dew point temperature (DWPT ≤ 2.75 and DWPT > 2.75). Subsequent levels include station pressure and relative humidity,
Figure 9—Meteorological and material parameters by month of sampling
Figure 10—Correlation matrix of transformed dependent and independent variables
Modelling particulate matter concentration from loading operations in mineral quarries with a decision tree approach
Table 2
Independent variables with the highest and lowest correlations with dependent variables in the stepwise linear regression models
Dependent variable
ln(TSP)
log(TSP)
ln(PM10)
log(PM10)
ln(PM2.5)
log(PM2.5)
ln(PM1)
log(PM1)
Table 3
Stepwise linear regression
Independent variables having a major impact on the model (p <0.05; VIF ≤5)
HW, MSTR, BC, CW, RH, TMP 12.2
HW, MSTR, CW, RH, TMP
BC, HW, WS, TMP, MSTR, RH, SP 7.1
WS, BC, HW, TMP, MSTR, RH
Regression models developed with the decision tree models Algorithm Criteria
HW, MSTR TMP
BC, HW SP
Training set
Cross validation
Percentage split
while lower branches consider headwind speed, moisture content of the loaded material, and bucket capacity.
The M5P model tree developed for PM1 concentration estimation has 23 terminal nodes, each with a unique regression equation (Figure 14). Unlike other models, the initial split in this tree is based on bucket capacity (BC ≤ 2.335 and BC > 2.335). Subsequent variables incorporated into the model include station pressure, relative humidity, crosswind speed, and the moisture content of the loaded material.
The equations with the highest number of samples used in the nodes for TSP, PM10, PM2.5, and PM1 concentrations are LM14, LM13, LM21, and LM23, respectively.
These M5P decision tree models allow for the estimation of
PM concentrations in similar gypsum and limestone fields. During the estimation process, PM concentrations can be predicted with reasonable accuracy by measuring the independent variables specified in the decision trees and applying the corresponding regression equations according to the tree structure.
The data analysis showed that when the PM concentration data were dispersed, the training set model had a slight advantage of about 5% over the other two approaches. However, when the data followed a similar pattern, the representative capabilities of all techniques were comparable. The final particulate matter concentration models developed, using the three different test methods, had the same number of nodes, the same variable addition methods for regression analysis, and the same minimum sample
Modelling particulate matter concentration from loading operations in mineral quarries with a decision tree approach
requirements for the nodes.
The PM concentration models developed using the decision tree technique did not show significant changes in MAE or RMSE over the course of iterations. Therefore, the number of nodes in the decision tree and the correlation coefficient were identified as crucial factors for accurately modelling PM concentrations. The success of the models was influenced by the meta-learning technique, the search method (regression analysis variable addition method), and the minimum number of samples allowed in a node. The final prediction equations were derived from the data sets with the highest correlation coefficient and the fewest nodes. The correlation coefficients obtained using the training data set were higher than those from the other two test methods.
Discussion
No previous studies have used decision tree algorithms to model PM concentrations resulting from loading, which increases the originality and contribution of this study to the literature. We conducted experiments with various decision tree algorithms and artificial neural networks (ANNs), including M5P, RandomForest, RandomTree, REPTree, and DecisionStump, during the modelling process. It should be noted that RandomForest, RandomTree, and REPTree do not provide reference equations, and artificial neural networks do not generate model equations or allow parameter estimation (Yazıcı et al., 2007; Duran, 2022).
Artificial neural networks (ANNs) have three basic layers: the input layer, where data enter the network; the output layer, which generates the response after processing; and the hidden layer(s), which transform and interpret data during learning (El-Shahat, 2018). Although artificial intelligence, machine learning, and deep learning share logical similarities, they also differ functionally. Artificial intelligence makes decisions based on pre-taught data, while machine learning produces results from provided data and its inferences. Deep learning, a subfield of supervised learning,
uses artificial neural network algorithms and is structured based on inspiration from brain function (Copeland, 2016; Akın, Şahin, 2024). They can continuously generate feature values, make inferences based on these values, and iteratively learn complex data structures. These structures, which can mimic the observation, analysis, learning, and decision-making behaviours of living organisms, can extract features from large amounts of data and perform operations such as transformation and classification with high accuracy (Deng, Yu, 2014; Kayaalp, Süzen, 2018; Akın, Şahin, 2024). However, advanced algorithms such as ANN and SVR conceal their prediction equations due to their internal structure (Henedy et al., 2022). Therefore, algorithms other than the M5P algorithm were not evaluated in this study because they did not meet the main objective.
Determining the levels of particulate matter (PM) to which workers in the mining industry are exposed is critical due to the health risks posed by PM. The emission prediction equations and exposure parameters from previous studies on coal and iron mines are presented in Table 4. Previous studies have developed equations to predict TSP release using raw data sets. These studies used lb/t (Axetell and Cowherd, 1984; USEPA, 1998a), kg/t (USEPA, 1991; USEPA, 1995; USEPA, 2006; NPI, 2012), and g/s (Chakraborty et al., 2002; Chaulya, 2006; Lal, Tripathy, 2012) as units of measurement. In this study, however, the prediction equations are expressed in µg/m³, indicating the PM concentration in the environment during loading activities. Several parameters were considered when estimating TSP released during coal extraction in open coal mines. These included the moisture content of the loaded material (Axetell, Cowherd, 1984; USEPA, 1991; USEPA, 1995; USEPA, 1998a; NPI, 2012), as well as the moisture and silt content of the loaded material, unloading height, wind speed, loading frequency, and bucket capacity (Chakraborty et al., 2002; Lal, Tripathy, 2012). When modelling TSP release during overburden
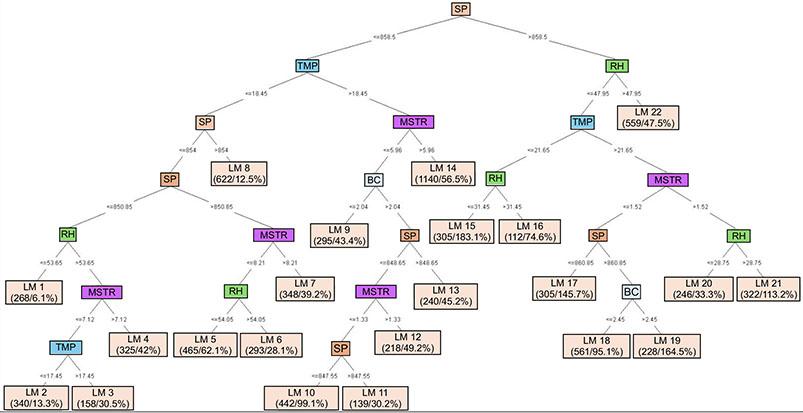

Figure 11—Decision tree model and predictive equations for TSP concentrations
Modelling particulate matter concentration from loading operations in mineral quarries with a decision tree approach
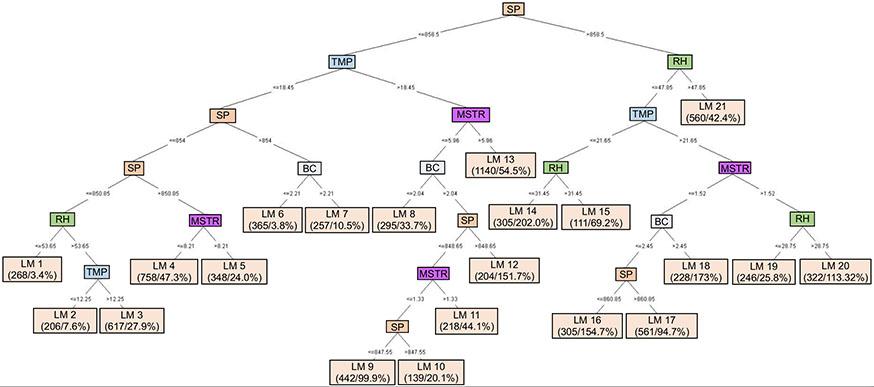

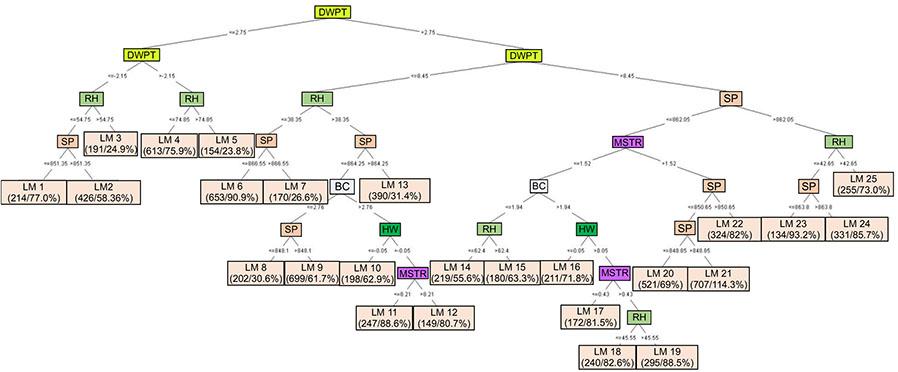

removal in coal mines, factors such as the moisture and silt content of the loaded material, unloading height, wind speed, loading frequency, and bucket capacity were included (Chakraborty et al., 2002; Lal, Tripathy, 2012). Moisture content and wind speed were also considered (NPI, 2012).
TSP released during ore extraction and overburden removal in open pit iron mining was modelled using parameters including the moisture and silt content of the loaded material, unloading height, wind speed, loading frequency, and bucket capacity
(Chaulya, 2006). Similarly, aggregate loading in quarries has been modelled using the moisture content of the material and wind speed (USEPA, 2006). While previous studies have primarily focused on modelling TSP release from open pit iron and coal mines, this study specifically examines TSP concentrations from gypsum and limestone quarries. The study identifies several effective independent variables for modelling TSP concentrations, including air temperature, dew point temperature, station pressure, relative humidity, wind speed (including headwind and crosswind),
Figure 12—Decision tree model and predictive equations for PM10 concentrations
Figure 13—Decision tree model and predictive equations for log(PM2.5) concentrations
Modelling particulate matter concentration from loading operations in mineral quarries with a decision tree approach
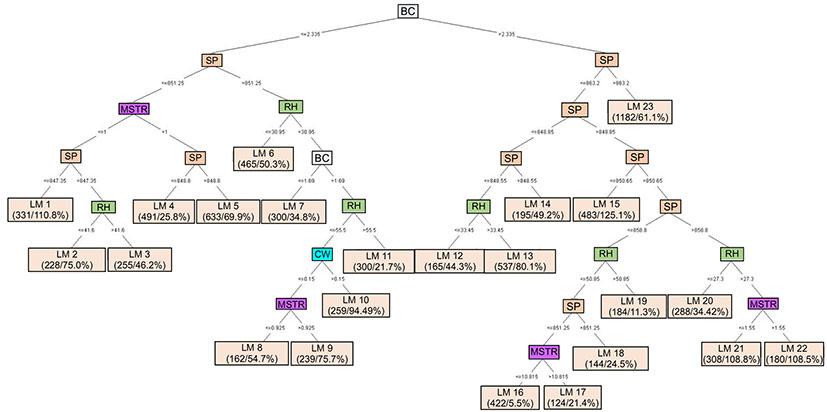

moisture content of the loaded material, and loader bucket capacity. Previous emission models have traditionally ignored meteorological conditions. However, this study demonstrates that these conditions also play an important role in modelling particulate matter concentrations.
Previous studies have limited PM10 emission modelling of loading activities to coal and aggregate mines. Certain parameters were used to predict PM10 levels during coal mining activities, including 0.75 × PM15 (USEPA, 1991; USEPA, 1995), moisture content of loaded material (NPI, 2012), and both moisture content of loaded material and wind speed during overburden removal in coal mines (NPI, 2012). PM10 was estimated as a fraction of TSP (35%) in aggregate quarry loading operations (USEPA, 2006). In this study, PM10 concentrations were modelled using several parameters, including air temperature, dew point temperature, station pressure, relative humidity, wind speed (including headwind and crosswind), moisture content of loaded material, and loader bucket capacity.
To the best of the authors' knowledge, no academic study has been published on modelling PM1 concentration in open pit mining. However, there are two different formulas for calculating PM2.5 emissions generated during loading in open pit coal mining and aggregate mining. The formula for PM2.5 emissions from coal mining is 0.019 × TSP (Axetell, Cowherd, 1984; USEPA, 1991; USEPA, 1995; USEPA, 1998a; NPI, 2012), while the formula for aggregate loading is 0.053 × TSP (USEPA, 2006). In this study, independent formulas were developed to predict the concentrations of PM2.5 and PM1.
The PM concentration models include key parameters such as air temperature, dew point temperature, station pressure, relative humidity, wind speed (including headwind and crosswind components), moisture content of the loaded material, and loader bucket capacity.
Some prediction models in this study use logarithmic values of dependent variables, assuming the regressors are non-random and the error terms are independent and identically distributed. When the log-based fitted values of the dependent variables are directly back-transformed, it is assumed that the errors in the log model are normally distributed. However, if this assumption does not hold, this approach may produce biased predictions. To address this, Duan (1983) proposed a nonparametric method called the smearing estimate, which does not require any specific assumption about the distribution of the regression errors. In this method, a smearing estimate is applied for the reverse transformation to obtain a prediction of the original variable after a transformation has been used for estimation. It is recommended to follow this methodology when using the logarithm-based estimation formulas generated in this study.
Previous research has shown that open-cast coal mining releases significant amounts of dust into the workplace. Emission estimating equations are site-specific, and factors developed for one site may not yield accurate results at another. Therefore, it is essential to adjust emission factors for each location (Ghose, 2004; Huertas et al., 2012; Papagiannis et al., 2014; Richardson et al., 2019). In this study, the emission estimation equations differed, even though the parameters influencing them were similar in the quarries examined. These findings are consistent with the existing literature.
Drawing the conclusion that a single independent variable affects the PM concentrations model is very challenging, primarily due to significant fluctuations in the dependent variable. The decision tree models developed using the training set methodology show a higher correlation coefficient than the other two methods, with similar outcomes when the PM concentrations data are widely distributed. In contrast, all three test methods yield similar correlation coefficients for narrower data ranges. The final PM concentration models produced by the three testing methods
Figure 14. Decision tree model and predictive equations for log(PM1) concentrations
Modelling particulate matter concentration from loading operations in mineral quarries with a decision tree approach
include the same number of nodes, use the same methods for inserting variables into regression analysis, and have the same minimum number of samples for each node. Because the mean absolute error (MAE) and root mean square error (RMSE) in PM concentration models varied minimally, the correlation coefficient and number of nodes were the most relevant predictors of model success. The meta-learning strategy, the search method, and the minimum number of samples permitted in a node all affected the performance of the PM concentration models.
Limitations
Samples representing material properties were collected at regular intervals of 5 minutes per kilogram. The moisture content test was performed on the same day because the characteristics of the samples could change by the next day. To achieve more consistent results, laboratory staff and resources should allow for the simultaneous examination of multiple moisture samples.
This study used a PM meter and a weather meter to measure PM concentrations during loading. Simultaneous use of these instruments from various directions is likely to yield more precise results in assessing PM concentrations.
Conclusions and recommendations
This study examined particulate matter levels and meteorological parameters during loading operations at gypsum and limestone quarries near Sivas, Türkiye. The researchers recorded the characteristics of the mining equipment and periodically collected samples to analyse the properties and moisture content of the loaded materials in the laboratory. They developed separate predictive models for TSP, PM10, PM2.5, and PM1 concentrations using two different software packages (SPSS and WEKA): one for statistical analysis and one for data mining.
Author Mine
Chakraborty et al., 2002; Lal, Tripathy, 2012
2012
Chaulya, 2006
2006
Axetell, Cowherd 1984; USEPA, 1998a
USEPA, 1991; USEPA, 1995
Chakraborty et al., 2002; Lal, Tripathy, 2012
Chaulya, 2006
In the statistical analyses, the original data sets were generally not suitable for a normal distribution. The researchers applied various mathematical transformations, including the natural logarithm, logarithm, reciprocal, and thousandths, to the data. The data sets transformed using the natural logarithm and logarithm conformed to a normal distribution. Stepwise regression analysis was used to create representative models with normally distributed data sets, which demonstrated a modest ability (adj. R² < 15%) to predict particulate matter concentrations. The researchers then used the decision tree approach with both raw and transformed data sets to develop PM prediction equations. The final models included equations with the highest correlation coefficients and the fewest nodes for all PM size categories. In this respect, the M5P algorithm stands out as an effective and powerful tool, particularly for developing decision support systems based on field data.
The release of particulate matter is a complex phenomenon influenced by many factors. No single variable can fully explain the significant variations observed in PM levels. Meteorological factors such as air temperature, relative humidity, dew point temperature, wind speed (including headwind and crosswind), and station pressure all contribute to the amount of PM emitted. Equipment characteristics, loader bucket capacity, and the moisture content of the loaded material also affect PM concentrations.
Existing research on dust generation in mining has primarily focused on coal mines and personal dust exposure. However, there is limited research on particulate matter released from machinery and equipment in non-coal open pit mines. More comprehensive studies are needed to quantify particulate matter concentrations from all mining operations. This will provide a clearer understanding of the impact of these concentrations on workers and the surrounding environment.
Table 4
PM release prediction equations for loading activity in open-pit mining operations (Duran et al., 2021)
Modelling particulate matter concentration from loading operations in mineral quarries with a decision tree approach
Models developed for similar mining operations can be used to forecast particulate concentrations from loading activities during the initial planning stage of a new mining project. These models offer valuable insights that support the development and implementation of sustainable mining practices, ensuring that environmental impacts are thoroughly considered from the outset. The prediction equations developed in this study can also be used to estimate the dust concentrations to which personnel working in South African quarries are exposed.
Declarations
Funding
This work was supported by the Scientific Research Project Fund of Sivas Cumhuriyet University under Grant [M-780].
Competing interest
The authors have no competing interests to declare that are relevant to the content of this article.
Data and model availability
All data processing scripts, WEKA configuration files, trained models, and a representative subset of the field dataset are archived on Zenodo (DOI: 10.xxxx/zenodo.xxxxxx) and mirrored on GitHub (release v1.0). Due to operational confidentiality, raw continuous data are not public but may be inspected upon reasonable request.
Author contributions
Zekeriya Duran and Bülent Erdem envisioned and planned the research project. Zekeriya Duran and Mehmet Genç carried out the material preparation and data gathering tasks. Zekeriya Duran and Tuğba Doğan conducted the traditional statistical analyses. Zekeriya Duran developed the decision tree models. Zekeriya Duran and Bülent Erdem wrote the initial draft of the manuscript. All contributors provided feedback on all versions of the written work.
References
Ahmad, A.U., Balakrishnan, U.V., Jha, P.S. 2021. A study of multicollinearity detection and rectification under missing values. Turkish Journal of Computer and Mathematics Education, 12(1S), pp. 399–418. https://doi.org/10.17762/turcomat. v12i1S.1880
Akçetin, E., Çelik, U. 2014. The performance benchmark of decision tree algorithms for spam e-mail detection. Journal of internet applications and management, vol. 5, no. 2), pp. 43–56. https://doi.org/10.5505/iuyd.2014.43531
Akın, E., Şahin, M.E. 2024. A review on deep learning and artificial neural network models. EMO Scientific Journal: Scientific Refereed Journal of Electrical, Electronics, Computer, Biomedical, Control Engineering, vol. 14, no. 1, pp. 27–38.
Aksu, G. 2018. Investigation of data mining methods used for estimating pisa success (In Turkish). Hacettepe University Graduate School of Educational Sciences (Doctoral Thesis), Ankara.
Albayrak, A.S. 2005. Alternative to the least squares technique in multiple linear connection, biased estimation techniques and an application (in Turkish), International Journal of Management Economics and Business, vol. 1, no. 1, pp. 106–126.
Alsultanny, Y.A. 2020. Machine learning by data mining REPTree and M5P for predicating novel information for PM10. Cloud Computing and Data Science, pp. 40–48.
Altair. 2024. The regression trees returned by the operators W-M5P and W-REPTree. https://community.rapidminer.com/ discussion/440/the-regression-trees-returned-by-the-operatorsw-m5p-and-w-reptree [accessed 27 May 2024]
Araújo, P.S.I., Costa, B.D., J.B de Moraes, R. 2014. Identification and characterization of particulate matter concentrations at construction jobsites. Sustainability, 6, pp. 7666–7688.
Arregocés, H.A., Rojano, R., Restrepo, G. 2021. Effects of lockdown due to the COVID-19 pandemic on air quality at Latin America’s largest open-pit coal mine. Aerosol and Air Quality Research, vol. 21, no. 8, p. 200664.
Avcı, T. 2020. The effects of macroeconomic factors and bank loans on inflation: the case of Turkey. Journal of Corporate Governance, Insurance, and Risk Management, vol. 7, no. 2, pp. 70–86.
Aydemir, E. 2018. Artificial intelligence with Weka (in Turkish), Ankara: Seçkin Publishing House.
Aydemir, E., Kaysi, F., Yavuz, M. 2020. Estimation of income obtained by tree algorithms using drug sales data. Anatolian Journal of Computer Sciences, vol. 5, no. 1, pp. 14–21.
Axetell, K., Cowherd, C. 1984. Improved emission factors for fugitive dust from western surface coal mining sources. Industrial Environmental Research Laboratory, U.S. Environmental Protection Agency, Cincinnati, USA.
Barros, R.C., De Carvalho, CPLFA., Freitas, A.A. 2015. Automatic design of decision-tree induction algorithms. SpringerBriefs in Computer Science, 176p, London.
Bükey, A.M., Çetin, B.I. 2017. The analysis of the factors influencing income distribution by the least squares method in Turkey (in Turkish), Research Journal of Public Finance, vol. 3, no. 1 pp. 103–117.
Büyükuysal, M.Ç., Öz, İ.İ. 2016. An alternative method to least squares in presence of multicollinearity: ridge regression (in Turkish), Journal of Düzce University Health Sciences Institute, vol. 6, no. 2, pp. 110–114.
Cao, J., Chow, C.J., Lee, S.C.F., Watson, G.J. 2013. Evolution of PM2.5 measurements and standards in the U.S. and future perspectives for China. Aerosol and Air Quality Research, vol. 13, no. 4, pp. 1197–1211.
Chai, T., Draxler, R.R. 2014. Root mean square error (RMSE) or mean absolute error (MAE)? - Arguments against avoiding RMSE in the literature. Geoscientific Model Development, vol. 7, pp. 1247–1250.
Chakraborty, M.K., Ahmad, M., Singh, R.S., Pal, D., Bandopadhyay, C., Chaulya, S.K. 2002. Determination of the emission rate from various opencast mines operations. Environmental Modelling & Software, vol. 17, no. 5, pp. 467–480.
Chaulya, S.K. 2006. Emission rate formulae for surface iron ore mining activities. Environmental Modeling & Assessment, vol. 11, no. 4, pp. 361–370.
Chien, C.F., Chen, L.F. 2008. Data mining to improve personnel selection and enhance human capital: A case study in hightechnology industry, Expert Systems with Applications, vol. 34, no. 1, pp. 280-290.
Modelling particulate matter concentration from loading operations in mineral quarries with a decision tree approach
Chow, C.J., Watson, J.G. 1998. Guideline on speciated particulate monitoring. U.S. Environmental Protection Agency, Research Triangle Park.
Copeland, M. 2016. What’s the difference between artificial intelligence, machine learning and deep learning, https:// blogs.nvidia.com/blog/whats-difference-artificial-intelligencemachine-learning-deep-learning-ai/ Accessed 2 Sep 2025.
Czajkowski, M., Kretowski, M. 2010. Globally induced model trees: an evolutionary approach. 11th International Conference on Parallel Problem Solving from Nature, September vol. 11–15, pp. 324–333, Krakow.
Çınaroğlu, S. 2017. Comparison of Machine Learning Regression Methods to Predict Health Expenditures, Uludağ University Journal of The Faculty of Engineering, vol. 22, no. 2, pp. 179–200. DOI: 10.17482/uumfd.338805.
Del Campo-Avila, J., Moreno-Vergara, N., Trella-Lopez, M. 2011. Analyzing factors to increase the influence of a Twitter user. Advances in Intelligent and Soft Computing, vol. 89, pp. 69–76.
Deng, L., Dong, Y. 2014. Deep learning: methods and applications, Foundations and trends® in signal processing 7, 3–4, pp. 197–387.
Dreshaj, A., Millaku, B., Shala, S., Selimaj, A., Shabani, H. 2017. Sources of air pollution, environmental impacts and exploitation of natural resources in Kosovo. Proceedings of CBU International Conference on Innovations in Science and Education, March 22-24, pp. 1275–1280, Prague.
Duan, N. 1983. Smearing estimate: A nonparametric retransformation method. Journal of the American Statistical Association, vol. 78, pp. 605–610.
Duncan, J., Stolarczyk, L.G. 2015. Mining complex geology, mitigation of float dust, and developing autonomous machine capability using horizon sensing technology for coal seam boundary detection. Journal of the Southern African Institute of Mining and Metallurgy, vol. 115, no. 11, pp. 1013–1020. http://dx.doi.org/10.17159/2411-9717/2015/v115n11a5
Duran, Z., Erdem, B., Doğan, T. 2021. Particulate matter emissions in surface mining operations: literature research (in Turkish), Journal of ESOGU Engineering and Architecture Faculty, vol. 29, no. 3, pp. 450–465, https://doi.org/10.31796/ogummf.945742
Duran, Z. 2022. Particulate matter emission measurement and modeling of variation in some surface mines with meteorological conditions, material and heavy mining equipment properties (In Turkish). Doctoral dissertation, Sivas Cumhuriyet University
Econorm. 2024. Turnkey ambient air portable dust analyzers (in Turkish). http://www.econorm.com.tr/urunler/ortamda-veonline-toz-olcum-cihazlari/turnkey-dustmate-anlik-toz-olcumcihazi/ [accessed 27 May 2024]
EPA. 2020. What is PM? U.S. Environmental Protection Agency, Washington, DC. (https://www3.epa.gov/region1/airquality/ pm-what-is.html)
Erbay, Ş., Beydoğan, H.Ö. 2017. Educators' attitudes towards educational research (in Turkish), Ahi Evran University Kırşehir Journal of Education Faculty, vol. 18, no. 3, pp. 246–260.
Evyapan, F., Mungan, D., Akgün, M., Arbak, P. 2012. Air quality and health (in Turkish). T.R. Ministry of Health and Turkish Thoracic Association, ISBN: 978-1-84984-008-8, Ankara.
Gargano, M.L., Raggad, B.G. 1999. Data mining-a powerful information creating tool. OCLC Systems & Services, vol. 15, no. 2, pp. 81–90.
Gautam, S., Prusty, B.K., Patra, A.K. 2012. Pollution due to particulate matter from mining activities, Reciklaža i održivi razvoj 5, pp. 53–58.
George, D., Mallery, M. 2010. SPSS for Windows step by step: a simple guide and reference, 17.0 update (10th ed.). Allyn & Bacon, 386p, Boston.
Ghose, M.K. 2004. Emission factors for the quantification of dust in India coal mines. Journal of Scientific and Industrial Research, vol. 63, pp. 763–768.
Ghose, M.K., Majee, S.R. 2007. Characteristics of hazardous airborne dust around an Indian surface coal mining area. Environmental Modeling & Assessment, vol. 130, pp. 17–25.
Gültepe, Y. 2019. A Comparative Assessment on Air Pollution Estimation by Machine Learning Algorithms. European Journal of Science and Technology, vol. 16, pp. 8–15.
Henedy, S.N., Naser, A.H., Imran, H., Bernardo, L.F., Teixeira, M.M., Al-Khafaji, Z. 2022. Development of Prediction Models for the Torsion Capacity of Reinforced Concrete Beams Using M5P and Nonlinear Regression Models. J. Compos. Sci., vol. 6, pp. 366.
Hime, N., Cowie, C., Marks, G. 2015. Review of the health impacts of emission sources, types and levels of particulate matter air pollution in ambient air in NSW. NSW Environment Protection Authority and NSW Ministry of Health, Environmental Health Branch
Huertas, J.I., Camacho, D.A., Huertas, M.E. 2012. Standardized emissions inventory methodology for open-pit mining areas. Environmental Science and Pollution Research, vol. 19, pp. 2784–2794.
Hwang, S.Y., Yang, D.N., Kwon, H.J., Lee, J.Y. 2014. Measurement of PM10 concentration in one dental clinic. International Journal of Clinical Preventive Dentistry, vol. 10, no. 4, pp. 273-280. http://dx.doi.org/10.15236/ijcpd.2014.10.4.273
Karabulut, C. 2019. Development of E-Commerce in Turkey After 2000. Journal of Management, Economic and Marketing Research, vol. 3, no. 5, pp. 192–207. doi: 10.29226/TR1001.2019.152
Kara, Ş.E., Şamlı, R. 2021. Comparative analysis of machine learning algorithms in WEKA for cost estimation of software projects. European Journal of Science and Technology, vol. 23, pp. 415–426. doi: 10.31590/ejosat.877296
Kayaalp, K., Süzen, A.A. 2018. Deep Learning and Applications in Türkiye (In Turkish), Institution of Economic Development and Social Researches Publications, pp. 93.
Keskinkılıç, B., Karakaya, K., Kutlu, Ş., Zal, H. 2010. A health approach to Turkey's air pollution and climate change problems (In Turkish). T.R. Ministry of Health General Directorate of Health Services, Ankara.
Modelling particulate matter concentration from loading operations in mineral quarries with a decision tree approach
Kim, K-H., Kabir, E., Kabir, S. 2015. A review on the human health impact of airborne particulate matter. Environment International, vol. 74, pp. 136–143.
Kumar, E., Kumar, L.A. 2017. A methodology for assessing the cumulative impact of a mineral transportation system on air quality. Journal of the Southern African Institute of Mining and Metallurgy, vol. 117, no. 4, pp. 401–408. http://dx.doi.org/10.17159/2411-9717/2017/v117n4a13
Lal, B., Tripathy, S.S. 2012. Prediction of dust concentration in open cast coal mine using artificial neural network. Atmospheric Pollution Research,vol. 3, pp. 211–218. https://doi.org/10.5094/APR.2012.023
Lashgari, A., Kecojevic, V. 2016. Comparative analysis of dust emission of digging and loading equipment in surface coal mining. International Journal of Mining, Reclamation and Environment, vol. 30, no. 3, pp. 181–196. https://doi.org/10.1080/17480930.2015.1028516
Löndahl, J., Pagels, J., Swietlicki, E., Zhou, J.C., Ketzel, M., Massling, A., Bohgard, M. 2006. A set-up for field studies of respiratory tract deposition of fine and ultrafine particles in humans. Journal of Aerosol Science, vol. 37, no. 9, pp. 1152–1163.
Montgomery, D.C., Peck, E.A., Vining, G.G. 2012. Introduction to linear regression analysis. Wiley, 679p, Hoboken.
Muma, D., Besa, B., Manchisi, J., Banda, W. 2020. Effects of mining operations on air and water quality in Mufulira district of Zambia: A case study of Kankoyo Township. Journal of the Southern African Institute of Mining and Metallurgy, vol. 120, no. 4, pp. 287–298. http://dx.doi.org/10.17159/2411-9717/952/2020
Murzin, M.A., Gorlenko, N.V. 2020. Analyzing effects of dust from mining enterprises on the environment, Agritech-IV-2020. Proceedings of IOP Conf. Series: Earth and Environmental Science 677 (2021) 042091. https://doi.org/10.1088/17551315/677/4/042091
Njeguš, A., Nikolić, V., Jovanović, V. 2015. The selection of optimal data mining method for small-sized hotels. International Scientific Conference of IT and Business-Related Research, April 16, pp. 519–524, Belgrade.
NPI. 2012. Emission estimation technique manual for mining-version 3.1. Australian Government, Canberra.
NSW, EPA. 2015. NSW coal mining benchmarking study best practice measures for reducing non-road diesel exhaust emissions. NSW Environment Protection Authority (EPA), Sydney.
Onan, A. 2015. Comparative performance analysis of decision tree algorithms in the corporate bankruptcy prediction. Journal of information technologies, vol. 8, no. 1, pp. 9–19. https//doi.org/10.17671/btd.36087
Önder, M., Yiğit, E. 2009. Assessment of respirable dust exposures in an opencast coal mine. Environmental Monitoring & Assessment, vol. 152, no. 1-4, pp. 393–401. https://doi.org/10.1007/s10661008-0324-4
Öztürk, E. 2012. Transformation and segmentation operations on images for increasing the effectiveness of compression methods (In Turkish). Trakya University Graduate School of Natural and
Applied Sciences (Master’s Thesis), Edirne.
Öztürk, N. 2016. Assessment of noise, vibration and dust exposure of the heavy equipment operators in surface mines (In Turkish). Expertise thesis, T.R. Ministry of Labour and Social Security, Directorate General of Occupational Health and Safety, Ankara.
Papagiannis, A., Roussos, D., Menegaki, M., Damigos, D. 2014. Externalities from lignite mining-related dust emissions. Energy Policy, vol. 74, pp. 414–424. https://doi.org/10.1016/j.enpol.2014.08.026
Patra, A.K., Gautam, S., Kumar, P. 2016. Emissions and human health impact of particulate matter from surface mining operation - a review. Environmental Technology & Innovation, vol. 5, pp. 233–249. https://doi.org/10.1016/j.eti.2016.04.002
Petavratzi, E., Kingman, S., Lowndes, I. 2005. Particulates from mining operations: A review of sources, effects and regulations. Minerals Engineering, vol. 18, no. 12, pp. 1183–1199. https://doi.org/10.1016/j.mineng.2005.06.017
Poisson, A., Guezou, J.C., Öztürk, A., İnan, S., Haluk, T., Gürsoy, H., Kavak, K.S., Özden, S. 1996. Tectonic setting and evolution of the sivas basin, central anatolia, turkey. International Geology Review, pp. 838–853. https://doi. org/10.1080/00206819709465366
Quinlan, J.R. 1992. Learning with continuous classes. 5th Australian Joint Conference on Artificial Intelligence, pp. 343–348, Singapore.
Richardson, C., Rutherford, S., Agranovski, E.I. 2019. Open cut black coal mining: Empirical verification of PM2.5 air emission estimation techniques. Atmospheric Research, vol. 216, pp. 151–159. https://doi.org/10.1016/j.atmosres.2018.10.008
Rojano, R.R., Arregocés, H.A., Restrepo, G. 2020. PM10 Concentrations measured in open pit coal mines in northern colombia: seasonal variations, trends and source. WIT Transactions on Ecology and the Environment, vol. 244. https:// doi.org/10.2495/AIR200081
Sabti, A.A., Rashid, S.M., Hummadi, A.S. 2019. Interrelationships between writing anxiety dimensions and writing goal orientation among Iraqi EFL undergraduates, International Journal of Instruction, vol. 12, no. 4, pp. 529-544, https://doi.org/10.29333/iji.2019.12434a
Schober, P., Boer, C., Schwarte, L.A. 2018. Correlation coefficients: appropriate use and interpretation, Anesthesia & Analgesia, vol. 126, no. 5, pp. 1763–1768. https://doi.org/10.1213/ANE.0000000000002864
SÇR. 2023. Sivas Province 2023 State of Environment Report, T.C. Sivas Governorship Provincial Directorate of Environment, Urbanization and Climate Change (in Turkish), 217s, Sivas.
Sihag, P., Singh, B., Said, A., Azamathulla, H.M. 2021. Prediction of Manning’s coefficient of roughness for high-gradient streams using M5P. Water Supply, vol. 22, no. 3, pp. 2707–2720. https://doi.org/10.2166/ws.2021.440
Singh, P.K., Roy, M.P., Paswan, R.K., Sarim, M., Kumar, S., Ranjan, Jha.R. 2016. Rock fragmentation control in opencast blasting. Journal of Rock Mechanics and Geotechnical Engineering,
Modelling particulate matter concentration from loading operations in mineral quarries with a decision tree approach
vol. 8, no. 2, pp. 225–237.
Shrestha, N. 2020. Detecting multicollinearity in regression analysis. American Journal of Applied Mathematics and Statistics, vol. 8, no. 2, pp. 39–42. https://doi.org/ 10.12691/ajams-8-2-1
Stackexchange. 2024. M5P Interpretations and Questions. https://stats.stackexchange.com/questions/228724/m5pinterpretations-and-questions [accessed 27 May 2024]
Tabachnick, B.G., Fidell, L.S. 2013. Using multivariate statistics (6th ed.), Pearson, Boston.
Tanni, S.E., Patino, C.M., Ferreira, J.C. 2020. Correlation vs. regression in association studies. Jornal Brasileiro de Pneumologia, 46(1): e20200030. https://doi.org/10.1590/18063713/e20200030
Trechera, P., Moreno, T., C´ordoba, P., Moreno, N., Zhuang, X., Li, B., Li, J., Shangguan, Y., Dominguez, A.O., Kelly, F., Querol, X. 2021. Comprehensive evaluation of potential coal mine dust emissions in an open-pit coal mine in Northwest China. International Journal of Coal Geology, vol. 235, pp. 1–17. https:// doi.org/10.1016/j.coal.2021.103677
Tripathy, D.P., Dash, T.R., Badu, A., Kanungo, R. 2015. Assessment and modelling of dust concentration in an opencast coal mine in India. Global Nest Journal, vol. 17, no. 4, pp. 825–834.
Trivedi, R., Chakraborty, M.K., Sangode, A.G., Tewary, B.K. 2010. A study of air pollution load assessment around opencast coal project in lndia. Indian Journal of Environmental Protection, vol. 30, no. 3, pp. 198–206.
TS 1900-1. 2006. Methods of testing soils for civil engineering purposes in the laboratory - Part 1: Determination of physical properties (in Turkish), Turkish Standards Institute, Ankara.
TS 4447. 1985. Gypsum- Ground (for Agricultural Use) (in Turkish), Turkish Standards Institute, Ankara.
Turnkey. 2024. DustMate. https://turnkey-instruments.com/ product/dustmate/ [accessed 27 May 2024]
USEPA. 1991. Review of surface coal mining emissions factors. U.S. Environmental Protection Agency, Research Triangle Park, North Carolina.
USEPA. 1995. AP-42 compilation of air pollutant emission factors, U.S. Environmental Protection Agency, Research Triangle Park, North Carolina.
USEPA. 1998a. Revision of emission factors for AP-42 Section 11.9
Western surface coal mining. U.S. Environmental Protection Agency, Research Triangle Park, North Carolina.
USEPA. 1998b. Particulate matter (PM2.5) speciation guidance document. U.S. Environmental Protection Agency, Research Triangle Park, North Carolina.
USEPA. 2006. Revision of emission factors for AP-42. Chapter 13: miscellaneous source. section 13.2.4: aggregate handling and storage piles. U.S. Environmental Protection Agency, Research Triangle Park, North Carolina.
Usha, T.M., Balamurugan, S.A. 2016. Seasonal based electricity demand forecasting using time series analysis. Circuits and Systems, vol. 7, no. 10, http://dx.doi.org/10.4236/cs.2016.710283
Vidinli, N., Özkan, E.K., Topçu, D., Yamurluklu, Y., Gedikli, F.G., Kürkçü, E.A. 2016. Guidance on dust control in the cement sector (In Turkish). T.R. Ministry of Labour and Social Security, Ankara.
Wang, W., Xu, Z. 2004. A heuristic training for support vector regression. Neurocomputing, vol. 61, pp. 259–275. https://doi.org/10.1016/j.neucom.2003.11.012
WHO. 1999. Hazard prevention and control in the work environment: airborne dust. World Health Organization, Geneva.
WHO. 2023. Ambient (outdoor) air pollution. World Health Organization, Geneva. https://www.who.int/news-room/ fact-sheets/detail/ambient-(outdoor)-air-quality-and-health [accessed 23 September 2023].
WEKA. 2024. Weka machine learning software. Waikato University, Hamilton. https://sourceforge.net/p/weka/mailman/ search/?q=The%20second%20number%20in%20the%20 model%20on%20the%20Weka%20m5P%20decision%20 tree%20leaves%20is%20obtained%20by%20dividing%20 the%20mean%20squared%20error%20of%20the%20linear%20 model%20on%20each%20leaf%20by%20the%20global%20 absolute%20deviation.&limit=50 [accessed 27 May 2024]
WHO. 2006. Health risks of particulate matter from long-range transboundary air pollution. World Health Organization, Copenhagen.
Witten, I.H., Frank, E., Hall, M.A. 2011. Data Mining: Practical Machine Learning Tools and Techniques. Burlington: Morgan Kaufmann Publishers. https://doi.org/10.1016/C2009-0-19715-5
Yazıcı, A.C., Öğüş, E., Ankaralı, S., Canan, S., Ankaralı, H., Akkuş, Z. 2007. Artificial neural networks: review, Journal of Surgical Medical Sciences, vol. 27, pp. 65–71. u
ENGINEERING HEALTH & SAFETY FOR SUSTAINABLE FUTURE-READY MINES
Modelling particulate matter concentration from loading operations in mineral quarries with a decision tree approach
HYBRID CONFERENCE
HYBRID CONFERENCE
11-12 NOVEMBER 2026 — CONFERENCE 13 NOVEMBER 2026 — INDUSTRY AWARDS DAY

GALLAGHER CONVENTION CENTRE, JOHANNESBURG, SOUTH AFRICA
11-12 NOVEMBER 2026 — CONFERENCE 13 NOVEMBER 2026 — INDUSTRY AWARDS DAY GALLAGHER CONVENTION CENTRE, JOHANNESBURG, SOUTH AFRICA



BACKGROUND
BACKGROUND


We are excited to announce our upcoming industry Conference and Industry Awards Day, dedicated to advancing mining safety and health, innovation, and sustainability and recognising the excellent work in creating ZERO HARM future ready mines. This year’s theme, “Engineering Health, Safety for Sustainable Future-Ready Mines”, underscores our collective commitment to achieving zero harm while embracing modernisation, technology, and collaboration as the foundation for safer, future-ready mining operations.
We are excited to announce our upcoming industry Conference and Industry Awards Day, dedicated to advancing mining safety and health, innovation, and sustainability and recognising the excellent work in creating ZERO HARM future ready mines. This year’s theme, “Engineering Health, Safety for Sustainable Future-Ready Mines”, underscores our collective commitment to achieving zero harm while embracing modernisation, technology, and collaboration as the foundation for safer, future-ready mining operations.
This conference will serve as a vital platform for knowledgesharing and idea exchange among key stakeholders, including mining companies, the Department of Mineral Resources and Energy (DMRE), the Minerals Council South Africa, labour unions, and health and safety practitioners at all levels in the minerals industry.
This conference will serve as a vital platform for knowledgesharing and idea exchange among key stakeholders, including mining companies, the Department of Mineral Resources and Energy (DMRE), the Minerals Council South Africa, labour unions, and health and safety practitioners at all levels in the minerals industry.
CONFERENCE THEMES
CONFERENCE THEMES
1. Driving Zero Harm Forward


Abstract submission – 31 July 2026 I Extended Abstract/Papers submission- 31 August 2026
• Environmental stewardship and climate-conscious practices.
• Linking safety with sustainability for long-term industry resilience.
• Environmental stewardship and climate-conscious practices.
• Linking safety with sustainability for long-term industry resilience.
Why Attend?
Why Attend?
• Gain insights from global case studies and pioneering projects.
• Network with industry leaders, engineers, and technology innovators.
• Gain insights from global case studies and pioneering projects.
• Network with industry leaders, engineers, and technology innovators.
• Explore practical solutions for building safer, sustainable mines.
• Explore practical solutions for building safer, sustainable mines.
• Be part of shaping the future of mining through collaboration and innovation.
• Be part of shaping the future of mining through collaboration and innovation.
Join us as we work together towards Safe Mines, Healthy Lives, and Sustainable Futures!
Join us as we work together towards Safe Mines, Healthy Lives, and Sustainable Futures!
PARTNERSHIP OPPORTUNITIES
PARTNERSHIP OPPORTUNITIES
Sponsorship opportunities are available. Companies wishing To partner on this event should contact the Conference Coordinator.
Sponsorship opportunities are available. Companies wishing To partner on this event should contact the Conference Coordinator.
WHO SHOULD ATTEND
WHO SHOULD ATTEND
The conference should be of value to:
The conference should be of value to:
• Safety practitioners
• Mine management
• Safety practitioners
• Mine management
1. Driving Zero Harm Forward
• Mine health and safety officials
• Reinforcing the vision of eliminating fatalities.
• Sharing progress, lessons learned, and renewed commitments.
• Reinforcing the vision of eliminating fatalities.
• Sharing progress, lessons learned, and renewed commitments.
2. Technology in Action
• Case studies of mines implementing breakthrough technologies.
2. Technology in Action
• Case studies of mines implementing breakthrough technologies.
• Practical examples of problems solved through innovation.
3. Future-Ready Mine Design
• Practical examples of problems solved through innovation.
• Strategies for long-term sustainability and resilience.
3. Future-Ready Mine Design
• Strategies for long-term sustainability and resilience.
• Integrating safety and health into planning and operational frameworks.
• Integrating safety and health into planning and operational frameworks.
4. Engineering Safety Excellence
4. Engineering Safety Excellence
• Advances in engineering solutions that enhance safety.
• Advances in engineering solutions that enhance safety.
• Best practices in design, maintenance, and risk management.
• Best practices in design, maintenance, and risk management.
5. Engineering in the Digital Age
5. Engineering in the Digital Age
• Modernisation and digital transformation in mining operations.
• Leveraging data, automation, and AI for safer outcomes.
• Modernisation and digital transformation in mining operations.
• Leveraging data, automation, and AI for safer outcomes.
6. Technology Advancements and Innovation
6. Technology Advancements and Innovation
• Exploring robotics, wearables, sensors, and predictive analytics.
• Exploring robotics, wearables, sensors, and predictive analytics.
• Emerging technologies shaping the future of mining safety.
• Emerging technologies shaping the future of mining safety.
7. Health and Wellbeing in Mining
7. Health and Wellbeing in Mining
• Protecting workers’ physical and mental health.
• Protecting workers’ physical and mental health.
• Occupational health strategies, wellness programs, and medical innovations.
• Occupational health strategies, wellness programs, and medical innovations.
8. Sustainability and Responsible Mining
8. Sustainability and Responsible Mining
For further information contact: Gugu Charlie, Conference Co-ordinators
E-mail:gugu@saimm.co.za | Tel: +27 11 538-0238
For further information contact: Gugu Charlie, Conference Co-ordinators
| Web: www.saimm.co.za
E-mail:gugu@saimm.co.za | Tel: +27 11 538-0238 | Web: www.saimm.co.za
• Mine health and safety officials
• Engineering managers
• Underground production supervisors
• Engineering managers
• Surface production supervisors
• Underground production supervisors
• Surface production supervisors
• Environmental scientists
• Environmental scientists
• Minimizing of waste
• Minimizing of waste
• Operations manager
• Operations manager
• Processing manager
• Processing manager
• Contractors (mining)
• Contractors (mining)
• Including mining consultants, suppliers and manufacturers
• Education and training • Energy solving projects
• Including mining consultants, suppliers and manufacturers
• Water solving projects
• Education and training • Energy solving projects
• Water solving projects
• Unions
• Unions
• Academics and students
• Academics and students
• DMRE
• DMRE
• Occupational health practitioners
• Occupational health practitioners
• Leadership and ManagementTechnical and Engineers
• Leadership and ManagementTechnical and Engineers
CALL FOR PAPERS
CALL FOR PAPERS
Call for papers on the topics of safety, health and environment
Call for papers on the topics of safety, health and environment
Prospective authors are invited to submit titles and abstracts of their presentations in English and not longer than 500 words. Abstracts should be submitted to:
Prospective authors are invited to submit titles and abstracts of their presentations in English and not longer than 500 words. Abstracts should be submitted to:
Include Abstract Submission Deadline: 31 July 2026
Extended Abstract/Paper Submission: 31 August 2026
Affiliation:
Faculty of Law, University of Johannesburg, South Africa
Correspondence to:
K. Thambi
Email: kiyashat@uj.ac.za
Dates:
Received: 24 Jun. 2025
Revised: 28 Nov. 2025
Accepted: 15 Jan. 2026
Published: May. 2026
How to cite:
Thambi, K. 2026. Tax Deductibility of mining rehabilitation expenditures – Sishen Iron Ore Ccompany (Pty) Ltd v Commissioner for the South African Revenue Service. Journal of the Southern African Institute of Mining and Metallurgy, vol. 126, no. 5, pp. 279–284
DOI ID:
https://doi.org/10.17159/2411-9717/3753/2026
ORCiD: K. Thambi
https://orcid.org/0000-0003-4456-3027
Tax Deductibility of mining rehabilitation expenditures – Sishen Iron Ore Company (Pty) Ltd v Commissioner for the South African Revenue Service
by K. Thambi
Abstract
Environmental rehabilitation has increasingly become a central concern in the regulatory and fiscal landscape governing South African mining operations. A key issue within this domain is the extent to which mining entities may claim tax deductions for expenditures incurred in fulfilling their environmental rehabilitation obligations. The Supreme Court of Appeal's decision in Sishen Iron Ore Company (Pty) Ltd v Commissioner for the South African Revenue Service [2025] ZASCA 16 addresses pivotal questions regarding the tax treatment of such expenditures. The judgment offers authoritative clarification on the interpretation of the Income Tax Act 58 of 1962—specifically sections 11(a), 11(c), and 36(11)(e)—as they pertain to mining activities and the environmental responsibilities imposed under the Mineral and Petroleum Resources Development Act 28 of 2002. This commentary critically examines the multifaceted implications of the Sishen ruling, highlighting the intersection of statutory interpretation, operational realities, and environmental accountability within South Africa’s mining sector.
Keywords
Tax deductions, mining rehabilitation, capital expenditure, mining right obligations, Sishen, MPRDA, South Africa mining law
Introduction
In the matter of Sishen Iron Ore Company (Pty) Ltd v Commissioner for the South African Revenue Service, the Supreme Court of Appeal (SCA/the court) addressed the deductibility of environmental rehabilitation expenses under Section 36(11)(e) of the Income Tax Act 58 of 1962 (the Income Tax Act). The appellant, Sishen Iron Ore Company (SIOC), sought to claim tax deductions for expenditures incurred in terms of a mining right pursuant to the Mineral and Petroleum Resources Development Act (MPRDA), specifically related to environmental rehabilitation (Sishen, 2025). The SCA ruled that such expenditures are deductible, provided they are directly linked to the mining operations and comply with the provisions of the MPRDA (Sishen, 2025). This judgment reaffirms the statutory right of mining corporations to obtain tax relief for verifiable environmental rehabilitation expenditures, thereby reinforcing the 'polluter pays' principle embedded within South African environmental jurisprudence.
The SCA ruled in favour of SIOC, holding that:
➤ “Expenditure incurred to fulfil a mining right obligation under the MPRDA is directly related to mining operations.
➤ Rehabilitation expenses are inextricably linked to mining operations, forming part of the cost of compliance with statutory conditions under which mining rights are granted.
➤ Section 36(11)(e) should be liberally interpreted to give effect to the purpose of the provision: to allow deductions for costs incurred in conducting sustainable mining in compliance with South African environmental law” (Sishen, 2025).
Moreover, the Court emphasised that interpreting the Income Tax Act in isolation from the MPRDA and National Environmental Management Act 107 of 1998 (NEMA) would be legally incorrect and undermine legislative coherence (Sishen, 2025).
Tax Deductibility of mining rehabilitation expenditures
Background
The global shift toward heightened environmental awareness, catalysed by the Brundtland Report on sustainable development (Brundtland, 1987), has prompted a wave of policy interventions aimed at promoting environmental accountability. These responses have culminated in the establishment of comprehensive legal frameworks and regulatory guidelines focused on environmental protection and rehabilitation (Van Wyk, Haagner, 2025). Within this evolving landscape, the South African mining sector has come under increasing scrutiny for its perceived inadequacies in addressing environmental concerns and the socio-economic impacts on surrounding communities. As a capital-intensive industry characterised by substantial start-up costs and complex regulatory obligations, mining operations face persistent challenges in reconciling economic imperatives with sustainable development objectives (Thambi, 2018). The emergence of sustainability as a guiding paradigm has further foregrounded the role of normative values in shaping mine closure strategies. As such, a comparative study conducted in Australia, Foran et al. (2024) identified two core values underpinning effective mine closure: the pursuit of net-positive outcomes and the equitable distribution of responsibility, risk, and opportunity throughout the closure process (Marais, 2025).
Mining companies typically incur a broad spectrum of expenditures in the course of their operations, encompassing both current and capital outlays. Current expenditures are generally deductible under the general deduction formula outlined in the Income Tax Act, while capital expenditures are subject to specific provisions that allow for immediate deductions, particularly in relation to prospecting and incidental activities (Clegg, 2018). The capital expenditure regime is designed to accommodate the unique financial structure of the mining sector, which is characterised by substantial upfront investment and delayed revenue generation (Ledwaba, Montjane, 2024). Notably, amendments introduced through the Taxation Laws Amendment Bill of 2016 extended the scope of section 36(11)(e) to include capital expenditures incurred for infrastructure development mandated by the Mineral and Petroleum Resources Development Act 28 of 2002 (TLAB, 2016). These legislative developments reflect a broader policy objective to incentivise sustainable investment in the mining industry by aligning fiscal relief mechanisms with regulatory obligations.
Furthermore, recent legislative developments underscore a broader policy commitment to incentivising sustainable investment within the mining sector by harmonising fiscal relief mechanisms with environmental regulatory obligations. Section 38(1)(d) of the MPRDA stipulates that mining permit holders are required, insofar as reasonably practicable, to rehabilitate land disturbed by mining activities to its natural or predetermined state, or to a land use consistent with sustainable development principles (MPRDA, 2002). Complementing this, the NEMA imposes a statutory duty on holders of prospecting or mining rights to remediate environmental damage, pollution, or ecological degradation resulting from mining operations. In fulfillment of these obligations, mining companies must make financial provision for rehabilitation, which may take the form of financial guarantees, direct cash payments to a Department of Mineral Resources and Energy (DMRE) account, or contributions to special purpose vehicles such as rehabilitation trusts or companies.
In this regard, the Income Tax Act provides tax relief for such contributions, allowing deductions for cash payments made to approved mining rehabilitation funds. Section 37A of the Act governs the tax treatment of these entities, stipulating that the sole purpose of the rehabilitation company or trust must be the remediation of environmental impacts associated with mine closure, including latent and residual effects (the Income Tax Act).
While the overarching aim of rehabilitation practices is to restore disturbed land to a sustainable and productive condition, considerable ambiguity persists regarding the specific requirements of such rehabilitation and the delineation of accountability (Van Wyk, Haagner, 2025). A key complexity in closure and sustainability planning lies in the necessity for rehabilitation objectives to align with broader national and regional Integrated Development Plans (IDP). Despite this, the rehabilitation goals articulated in Environmental Management Plans (EMP) and Closure Plans are typically formulated and costed by mining companies themselves, based on internal corporate commitments and their interpretation of sustainable post-mining land use (Van Wyk, Haagner, 2025). Although section 38(1) of the MPRDA mandates the restoration of land to its natural or predetermined state, it also emphasises that such rehabilitation must be practicable and informed by a public participation process to determine the intended end-use (MPRDA, 2002). The lack of alignment among monitoring programmes further complicates the realisation of sustainability outcomes, often resulting in delays (Van Wyk, Haagner, 2025). Moreover, despite growing awareness within the mining sector regarding rehabilitation responsibilities, the absence of a standardised framework or centralised database for evaluating rehabilitation quality continues to hinder effective decision-making and the successful reintegration of mined land into productive socio-economic systems (Van Wyk, Haagner, 2025).
The problem
The real problem lies in the intersection of fiscal policy, environmental regulation, and operational accountability. Moreover, the lack of coherence between tax law and environmental law, resulted in uncertainty where the Commissioner for the South African Revenue Service (CSARS) disallowed deductions for essential compliance costs. Meanwhile the Income Tax Act provides mechanisms for tax relief, the stringent compliance conditions, regulatory overlap, and the potential for fund misuse present significant challenges. Addressing these issues requires clearer guidance from CSARS, stronger governance of rehabilitation entities, and better integration of fiscal and environmental planning frameworks to support sustainable mine closure and land reintegration.
Context to the Sishen Iron Ore case
In the matter of SIOC v Commissioner for the South African Revenue Service, the Supreme Court of Appeal addressed the deductibility of environmental rehabilitation expenses under Section 36(11)(e) of the Income Tax Act. The appellant, SIOC, sought to claim tax deductions for expenditures incurred in terms of a mining right pursuant to the Mineral and Petroleum Resources Development Act (MPRDA), specifically related to environmental rehabilitation (Sishen, 2025).
Tax Deductibility of mining rehabilitation expenditures
Facts
SIOC, a major mining operator in the Northern Cape, incurred substantial expenditure towards environmental rehabilitation in the course of its mining operations. These expenditures included costs associated with the relocation of the Dingleton township and the Sishen Western Expansion Project (SWEP) infrastructure, legal expenses related to the relocation of Dingleton residents, and the relocation of a 66 kV power line supplying electricity to mine equipment. These costs were part of its obligations under the MPRDA and were captured in its Environmental Management Plan (EMP). SIOC attempted to deduct these expenditures from its taxable income in terms of section 36(11)(e) of the Income Tax Act. CSARS disallowed the deductions, arguing that the expenses did not qualify under the relevant section as they were not “capital expenditure directly incurred in respect of mining operations”. This led to the appeal. (Sishen, 2025).
The primary issues before the court were:
➤ “Whether the relocation expenditures for Dingleton and SWEP infrastructure were deductible under section 36(11)(e) of the Income Tax Act.
➤ Whether the costs associated with the relocation of the 66 kV power line were deductible under sections 11(a) or 36(11)(
➤ Whether the legal expenses incurred for assisting Dingleton residents were deductible under section 11(c).
➤ Whether interest and penalties imposed by CSARS were justified under section 89quat of the Income Tax Act” (Sishen, 2025).
Nuanced judgment delivered by the SCA, addressing the following issues:
Relocation expenditures
The taxpayer, Sishen Iron Ore sought to deduct relocation expenditures under sections 15(a), 25, and 36(7C), read with section 36(11)(e) of the Income Tax Act, which permits deductions for capital expenditure incurred "in terms of a mining right" other than in respect of infrastructure. Alternatively, Sishen argued that the relocation costs constituted revenue expenditure, forming part of its operational costs associated with open-cast mining, or compensation obligations under section 54 of the Mineral and Petroleum Resources Development Act 28 of 2002 (MPRDA), and were therefore deductible under section 11(a) (Sishen, 2025).
The Commissioner disputed the deductibility, contending that the expenditure was capital in nature and not incurred in terms of the mining right. However, the Supreme Court of Appeal held that the relocation costs related to the Dingleton community and SWEP infrastructure were indeed deductible under section 36(11)(e), as they were incurred pursuant to the mining right and were essential for the continuation of mining operations (Sishen, 2025; Tax Act, 1962). The court emphasised that such expenditures are not merely compliance costs but integral to the exercise of mining rights (Sishen, 2025).
The 66 kV power line relocation
The relocation of the 66 kV power line, which forms part of the operational infrastructure supplying electricity to Sishen’s mining equipment, was central to the continuation of its mining activities. Sishen claimed the associated expenditure as capital expenditure in
respect of "mine equipment" under section 36(11)(a) of the Income Tax Act In the alternative, it argued that the expenditure qualified as revenue in nature under section 11(a), or as a depreciation allowance under section 11(e). A key legal challenge arose from the fact that the term "mine equipment" is not explicitly defined in the Act, creating interpretive uncertainty (Sishen, 2025).
The CSARS contended that the expenditure related to infrastructure, which is expressly excluded from the scope of section 36(11)(e), and that being capital in nature, it could not be deducted under section 11(a). Furthermore, CSARS argued that section 11(e) was inapplicable, as the expenditure did not relate to wear and tear but rather to relocation costs incurred to access previously sterilised mining areas (Sishen, 2025).
The SCA ultimately upheld the deductibility of the 66 kV line relocation costs under section 36(11)(a), alternatively under section 11(a), on the basis that the power line was integral to the operation of mine equipment and essential for the extraction of ore. The Court emphasised that the expenditure was not merely incidental but directly linked to the income-generating activities of the mine. Each relocation of the line was necessitated by the movement of mining operations, thereby constituting an activity closely associated with the method or process of mineral extraction. Accordingly, the expenditure was deemed deductible as part of the operational framework supporting Sishen’s mining trade (Sishen, 2025).
Legal expenses
Section 11(c) of the Income Tax Act permits the deduction of legal fees incurred during the year of assessment, provided such expenses arise from claims, disputes, or legal actions that occur in the ordinary course of a taxpayer’s trade (Tax Act, 1962). However, the Act does not define the terms “claim,” “dispute,” or “action at law,” which introduce interpretive ambiguity. Furthermore, the provision is subject to two key limitations: the legal expenses must not be capital in nature, and they must not relate to claims for damages or compensation where the settlement of such claims would not qualify for deduction under section 11(a) (Tax Act, 1962).
The taxpayer, Sishen Iron Ore sought to deduct legal fees paid to practitioners who assisted residents of Dingleton with relocationrelated legal advice. Sishen argued that these expenses were incurred in the course of its mining trade and thus deductible under section 11(c). The central issue was whether the legal services bore a sufficiently close connection to the company’s income-producing activities. The Supreme Court of Appeal held that the legal fees did not satisfy the requirements of section 11(c), as they were not incurred in the direct production of income and lacked a proximate link to Sishen’s core mining operations. Consequently, the deduction was disallowed (Sishen, 2025).
Interest and penalties
The SCA overturned the understatement penalties levied by the CSARS, concluding that they were not substantiated by the facts of the case. With respect to the interest imposed under section 89quat(2) of the Income Tax Act, the Court remitted the matter to CSARS for reconsideration. It directed the revenue authority to assess whether the tax shortfall may have been influenced by external factors beyond the control of SIOC, thereby necessitating a more nuanced evaluation of the circumstances surrounding the understatement (Sishen, 2025).
Tax Deductibility of mining rehabilitation expenditures
Strategic and operational implications of the Sishen judgment
From an operational standpoint, Sishen Iron Ore Company has encountered significant logistical and infrastructurerelated constraints that have adversely affected its production capacity and financial performance. These disruptions have had cascading effects, not only for SIOC but also for key downstream stakeholders, including Transnet and regional suppliers, thereby exposing systemic vulnerabilities in the mining value chain.
Strategically, the Sishen case has illuminated the pressing need for policy reform within South Africa’s mining regulatory framework. The legal complexities and operational challenges arising from the interpretation of the Mineral and Petroleum Resources Development Act (MPRDA) have reignited debates around the adequacy of the current legislative environment. In particular, the case contributes to broader discussions on resource nationalism and the transformation agenda, especially regarding the balance between state custodianship and private sector participation in mineral wealth allocation. The judgment may serve as a catalyst for renewed calls to amend the MPRDA to enhance legal certainty and investment stability.
From a technical and economic perspective, the long-term viability of Sishen has come under scrutiny. The legal risk premium now associated with the asset has prompted a reassessment of capital allocation strategies, particularly in relation to brownfield expansion and high-grade ore recovery. Nevertheless, the clarity provided by the judgment may offer a stabilising effect, enabling the realignment of technical planning and the restoration of investor confidence.
Importantly, the ruling affirms the tax deductibility of environmental rehabilitation expenditures under the Income Tax Act, reinforcing the principle that such obligations are not merely regulatory but constitute legitimate business expenses. It underscores the necessity for mining companies to maintain compliance with the MPRDA to ensure the recognition of these costs for tax purposes (Myburgh, Cronje, 2025). Furthermore, the judgment reiterates the enduring responsibility of mining entities to fulfil their environmental obligations, even beyond the cessation of active operations (Sishen, 2025).
The legal and policy implications of the Sishen case
The legislative context and relevant statutes pertaining to this decision are:
➤ Income Tax Act, Section 36(11)(e): Provides for deduction of capital expenditure in mining operations.
➤ MPRDA, especially Sections 41 and 96: Requires mining companies to conduct environmental rehabilitation and submit financial provision plans.
➤ NEMA (Act 107 of 1998): Governs environmental impact assessment and rehabilitation principles under Section 24.
The SIOC judgment is of considerable significance for both legal and operational dimensions of the mining sector.
➤ Clarification of deductibility criteria: The ruling provides authoritative guidance on the interpretation of sections 11(a), 11(c), and 36(11)(e) of the Income Tax Act, particularly in relation to expenditures incurred in the course of mining
operations and in fulfilment of environmental obligations.
➤ Integration of environmental compliance into tax law: The judgment affirms that environmental obligations arising from mining rights are not peripheral but are embedded within the operational and fiscal framework of mining enterprises. This integration reflects a maturing alignment between environmental and tax law.
➤ Precedential value for future disputes: The decision sets a precedent for the tax treatment of expenditures related to environmental compliance, offering a framework for future adjudication in similar contexts.
➤ Recognition of environmental costs as core business expenditure: By affirming the deductibility of post-closure rehabilitation and related environmental costs, the Court recognised these as essential, income-producing expenditures rather than discretionary or ancillary obligations.
➤ Incentivising corporate environmental responsibility: The allowance of tax deductions for rehabilitation-related costs serves as a fiscal incentive for mining companies to proactively plan for environmental restoration, thereby reinforcing the principle of environmental stewardship through the tax system.
➤ Implications for SARS policy and interdepartmental coordination: The judgment underscores the need for greater consistency and transparency in SARS’s treatment of rehabilitation fund deductions. It also highlights the importance of harmonising regulatory approaches between the Department of Mineral Resources and Energy (DMRE) and SARS to ensure coherent policy implementation.
➤ In sum, this decision represents a critical step toward the long-advocated integration of environmental and fiscal governance in the mining sector. While it resolves key areas of legal uncertainty, it also exposes ongoing challenges— particularly the lack of transparency and oversight in the administration of rehabilitation funds. These gaps underscore the need for robust regulatory frameworks and public accountability mechanisms to ensure that environmental commitments are both credible and enforceable.
Unintended consequences of the Sishen case
While the SCA provides much-needed clarity on the deductibility of mining-related expenditures—particularly those associated with the relocation of communities and infrastructure under section 36(11)—it simultaneously introduces new interpretive complexities. Legal and tax experts have cautioned that the judgment may blur the traditional distinctions between capital and revenue expenditure, especially in the context of the interplay between sections 11(a), 15(a), and 36(11) of the Income Tax Act (Myburgh, Cronje, 2025).
As a result, mining companies are now faced with heightened compliance demands. There is an increasing need to ensure that Mine Works Programmes (MWP), legal obligations, and financial reporting frameworks are meticulously aligned to demonstrate that such expenditures are “necessary and indispensable” to the conduct of mining operations. This evolving standard not only raises the evidentiary threshold for tax deductibility but also contributes to increased administrative and legal complexity in tax planning and audit preparedness.
Tax Deductibility of mining rehabilitation expenditures
Conclusion
The Supreme Court of Appeal’s ruling in Sishen Iron Ore Company (Pty) Ltd v CSARS [2025] represents a landmark moment in the evolving relationship between tax law, environmental governance, and mineral rights regulation in South Africa. By affirming the deductibility of key expenditures—including those related to infrastructure relocation and community resettlement—the judgment provides critical clarity on the application of sections 11(a), 11(c), and 36(11) of the Income Tax Act. This clarity is particularly timely, given the 9.6% decline in mining sector investment in 2024 (Myburgh, Cronje, 2025) and may serve as a fiscal stimulus for capital expenditure in an increasingly risksensitive industry.
Importantly, the judgment reinforces the principle that environmental rehabilitation obligations are not merely regulatory burdens but tax-recognisable business expenses—integral to the lawful and sustainable operation of mining enterprises. This recognition strengthens the alignment between fiscal policy and environmental stewardship, yet also raises the bar for compliance, requiring mining companies to demonstrate that such expenditures are “necessary and indispensable” to their trade. However, the ruling also exposes persistent tensions surrounding the interpretation of the MPRDA, especially in relation to mineral rights and ownership structures. These tensions have historically contributed to legal uncertainty and operational instability, and the Sishen case is likely to influence future judicial and legislative approaches to the MPRDA.
Ultimately, this case serves as more than a legal precedent—it is a lens through which the structural strengths and vulnerabilities of South Africa’s mining landscape are revealed. It underscores the need for coordinated reform across legal, fiscal, and environmental domains. Addressing the challenges highlighted by this judgment will require collaborative engagement among regulators, industry stakeholders, and policymakers to ensure a mining sector that is both profitable and sustainable. Moreover, the case contributes to broader debates on resource nationalism and transformation, particularly regarding the balance between state and private interests in mineral wealth allocation. As such, it may catalyse renewed calls for legislative clarity and targeted amendments to the MPRDA to prevent similar disputes and promote long-term sectoral stability.
References
Centre for Environmental Rights (CER). 2018. "Tackling the transparency of mine rehabilitation in South Africa." https:// www.mining-technology.com/features/tackling-transparencymine-rehabilitation-south-africa/mining-technology.com [Accessed 9 June2025].
Fincor. 2022. Mining rehabilitation of a company or trust: deductibility of amounts paid and compliance with Section 37A of the Income Tax Act – Part 1 of 2. 2022. https://fincor.co.za/ mining-rehabilitation-of-a-company-or-trust-deductibilityof-amounts-paid-and-compliance-with-section-37a-of-theincome-tax-act-part-1-of-2/ [Accessed 10 June 2025].
Hertog, D. 2023. Accelerated Capital Expenditure Allowances: Does it Apply to Contract Miners? https://law.uct.ac.za/mineral-law/ articles/2023-05-30-accelerated-capital-expenditure-allowancesdoes-it-apply-contract-miners [Accessed 18 June 2025].
Ledwaba, S., Montjane, J. 2024. Capability statement 2024. https:// www.grantthornton.co.za/insights2/mining-tax--cit/ [Accessed 11 June 2025].
Mandlana, W. 2017. New tax measures to curb abuse of mining rehabilitation funds are a missed opportunity. https:// bowmanslaw.com/insights/new-tax-measures-curb-abusemining-rehabilitation-funds-missed-opportunity/ [Accessed 11 June 2025].
Marais, L. 2025. Planning for post-mining economies: Misconceptions and opportunities. Journal of the Southern African Institute of Mining and Metallurgy, vol. 125, no. 4. pp. 217–224.
Myburgh, A., Cronje, E. 2025. “Supreme Court of Appeal boost for Mining tax deductions” https://www.mondaq.com/southafrica/ income-tax/1594958/supreme-court-of-appeal-boost-formining-tax-deductions [Accessed 1 June 2025].
Southern African Legal Information Institute. 2025. Sishen Iron Ore Company (Pty) Ltd v Commissioner for the South African Revenue Service [2025] SASCA 16; ALL SA 350 (SCA), https:// www.saflii.org/za/cases/ZASCA/2025/16.html [Accessed 7 June 2025].
South Africa. 1962. Income Tax Act, 58 of 1962.Sections 11(a), 11(c), 36(11)(e), 36(7C), section 89quat.
South Africa. 2002. Mineral Petroleum Resource Development Act, 28 of 2002. Sections 41 and 96.
South Africa. 1998. National Environmental Management Act 107 of 1998. Section 24.
Van Blerck, M. 1992. Mining Tax in South Africa. 2nd ed. Rivonia, South Africa: Taxfax CC page 12-12.
Van Wyk, SJ., Haagner, A.S.H. 2025. A review of mine land rehabilitation outcomes: Culture, procurement and practice. Journal of the Southern African Institute of Mining and Metallurgy, vol. 125, no. 4. pp. 209–216. u
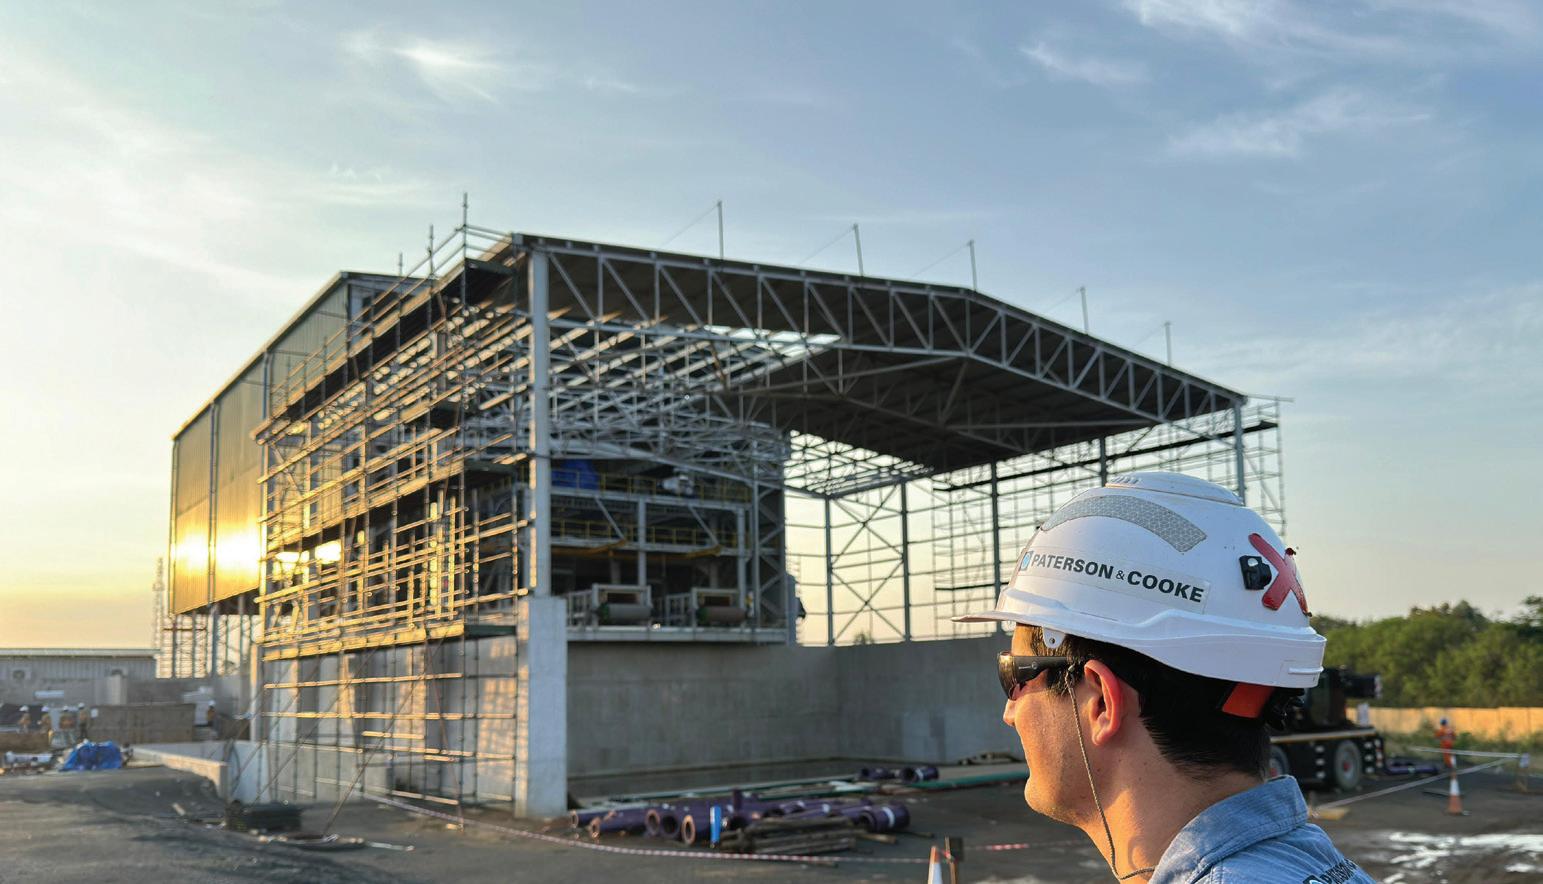
Experts in Slurry Pipelines, Mine Backfilling, Mine Waste Systems, and Mineral Processing
With 35 years of experience and offices worldwide, our global presence allows us to offer local knowledge to our clients paired with international expertise.
Slurry Pipelines
As a global leader in slurry pipeline systems our engineers have experience in all aspects of slurry pipeline system design and operation, ranging from laboratory test work, hydraulic analysis, pipeline routing, and pipeline construction, to the detailed design and engineering of pump, valve, and choke stations.
Mine Backfill
Since 1991, our engineers have solved some of the most complex backfill challenges while testing and designing hydraulic, paste and cemented aggregate fill projects all over the world. We pioneered the development of full flow technology to keep backfill reticulation systems fully pressurised to manage energy and reduce pipeline wear.
Our global backfill group, made up of engineers, operators, technologists, and specialists, allows us to coordinate expertise and resources from our offices to deliver backfill projects through detail design, construction, commissioning and ongoing operational support. Our expertise includes the detailed understanding of the backfill requirements to support the mining method, cement technology to optimise the binder selection, process development and specialist engineering services.
Mine Waste
Paterson & Cooke’s holistic solutions balance many competing requirements such as geotechnical stability, geochemical stability, water conservation, social license to operate, people at risk, emissions, risk to operations, and
cost. Our process starts with understanding corporate and mine site requirements in conjunction with the client and the geotechnical engineer.
Through this collaborative process, we develop a technology roadmap that addresses each client’s unique challenges. The solutions that are developed are site specific and focus on each of the processing, transportation, and deposition challenges.
Mineral Processing
With declining feed grades, increasingly challenging and problematic ores being processed, and a drive for more sustainable mining practices, the modern process plant needs to adapt. Often this means adopting newer and novel technology or modifying and/or optimising the process flowsheet. From early-stage conceptual studies through to construction, commissioning and training, we provide solutions every step of the way.
Laboratory Services
We have comprehensive laboratories in the countries in which we operate that provide a wide range of metallurgical, process and bulk materials handling test work to support our engineering designs, as well as providing flow sheet development and pilot plant campaigns. Our testing capabilities include processing run of mine ore to generate concentrate and flotation tailings as well as extensive crushing, milling, flotation, dewatering, geochemical and mineral analysis.
patersoncooke.com
Affiliation:
1. SANIRE, SAIMM, South Africa
2. SANIRE, South Africa
3 Institute of Mine Seismology (IMS), South Africa
Correspondence to:
W.J. van Wyk
Email: wynand.vanwyk@live.co.uk
Dates:
Received: 23 Jun. 2025
Revised: 7 Mar. 2026
Accepted: 17 Mar. 2026
Published: May. 2026
How to cite:
van Wyk, W.J., Mahne, W.I., Priest, G., Liebenberg, W.A., Du Toit, C. 2026. Overmining low factor of safety coal pillars using an enhanced monitoring system. Journal of the Southern African Institute of Mining and Metallurgy, vol. 126, no. 5, pp. 285–296
DOI ID:
https://doi.org/10.17159/2411-9717/3756/2026
ORCiD:
W.J. van Wyk
https://orcid.org/0009-0001-5031-0870
W.I Mahne
https://orcid.org/0009-0005-7441-0373
G. Priest
https://orcid.org/0009-0002-8811-9219
W.A. Liebenberg
https://orcid.org/0009-0005-0746-809X
C. du Toit
https://orcid.org/0009-0005-6264-6813
Overmining low factor of safety coal pillars using an enhanced monitoring system
by W.J. van Wyk1, W.I. Mahne2, G. Priest1, W.A. Liebenberg2, C. du Toit3
Abstract
Prior to the Coalbrook disaster in 1960, bord-and-pillar mining of the number two seam in the Witbank coalfields often resulted in small pillars with low factors of safety. At the Goedehoop Colliery, number two seam pillar stability is also affected by top and bottom coaling, while at Greenside Colliery, stability was further reduced by additional loading from a surface mineral residue deposit. This compromised the stability of the number two seam workings, impacting the safe mining of the overlying number four seam reserves. To extend the life of mine of both operations, an alternative risk management approach using designated enhanced monitoring districts was implemented to safely mine the number four seam reserves. This paper presents the use of geophone arrays to monitor micro-fracturing in number two seam pillars and the interburden between number two seam and number four seam, thereby enabling early detection of potential instability during overmining of the number two seam. Risk was assessed using fault and event tree analyses to determine acceptable failure probabilities. Automated seismic data processing distinguished micro-fracturing from noise, supported by extensive evacuation procedures for effective risk management. This approach facilitated the safe extraction of 4.70 Mt of number four seam coal. The study quantifies the efficacy of geophone monitoring in optimising coal recovery over low factors of safety pillars and assesses the application of Van der Merwe’s (2019) time-based formulae for pillar stability analysis for this project.
Keywords
overmining low factor of safety coal pillars, seismic monitoring system, crack counting, fault and event tree analysis, evacuation procedures
Introduction
Prior to the Coalbrook disaster in 1960, bord-and-pillar coal mining in the Witbank Coalfields resulted in smaller pillars, typically left at extensive mining heights during top and bottom coaling. This means that the long-term strength and load-carrying capacity of the pillars were not considered during mining operations.
Failure of the pillars in a lower-lying seam can cause uncontrolled deformation, thereby impacting the potential mining of the upper seams. The impact of potential subsidence on the number five seam (S5) and the number four seam (S4) is shown in Figure 1.
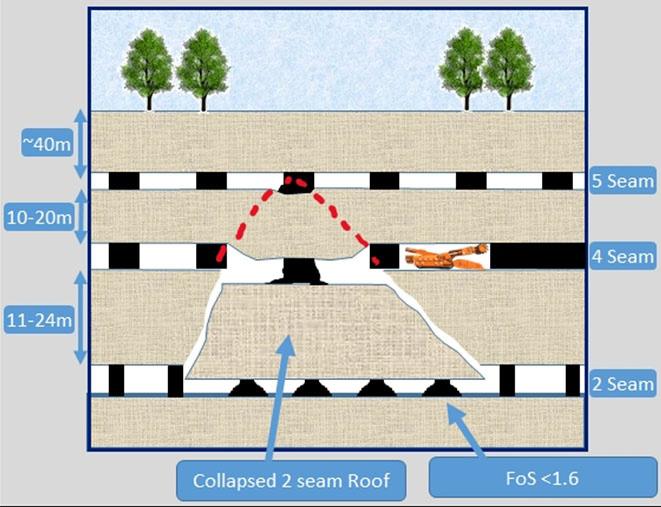
Figure 1—Schematic of the impact of a pillar failure in S2 on the mining of S4 and S5
Overmining low factor of safety coal pillars using an enhanced monitoring system
At the Goedehoop and Greenside Collieries the seams were mined with bord and pillar layouts. The number two seam (S2) at Goedehoop Colliery was mostly mined out in the early 1960s and at Greenside Colliery between 1930 and 1960.
Top and bottom coaling were carried out at Goedehoop to maximise extraction. This reduced the pillar system factors of safety (FoS) as the width-to-height (W:H) ratio decreased. The potential future mining of the other seams, overlying S4 in this case, was not considered during the extraction of the S2.
As Goedehoop’s reserves dwindled in the mid-2010s, the life-of-mine became heavily dependent on mining the S4 reserves. However, in extensive areas, the underlying S2 was not considered safe to overmine, leading to potentially sterilised reserves.
At Greenside Colliery, some of the S4 resources were underlying the Greenside surface mineral residue deposit (MRD). However, the stability of the historical S2 workings underlying the planned S4 reserves was impacted by additional loading imposed by the MRD.
At both operations, analysis of the S2 stability was conducted using the most accepted pillar design formulae in South Africa. At Goedehoop Colliery, these initially included those developed by Salamon and Munroe (1967) and Van der Merwe (2013a; 2016). In addition, post-analysis at Greenside Colliery in 2020 also utilised the Van der Merwe (2019) formulae.
To optimise the life-of-mine at both operations, the risks had to be properly quantified, and effective mitigation strategies implemented.
The cracking of pillars was confidently considered as a potential precursor to pillar failure, therefore monitoring the behaviour (cracking) of the pillars and roof would provide warning of pillar failure and ultimately of interburden instability. Several monitoring options were considered:
➤ Crack counting, such as the Goaf Warn, and seismic monitoring systems were assessed to give an indication of possible imminent failure in the rock mass (roof and pillars of the S2). The Goaf Warn system was used in longwall coal operations with limited success. As the majority of the S2 at both operations were inaccessible, the placement of these units would be problematic and not adequate to monitor the onset of failure.
➤ Extensometers were also considered to indicate signs of roof beam failure. These were installed previously at Goedehoop to monitor intersection stability in the S2. However, they can only monitor failure or displacement in the roof in the immediate area of its installation, e.g., the intersection.
Table 1
33c
As such, the large number and cost of the extensometers precluded their use. Additionally, remote real-time monitoring was not proven in our scenario.
Geophones are widely utilised in the deep-level hard rock mines of South Africa to monitor mining induced seismicity. Geophones have not been extensively used in South African coal mining, due to the low risk of seismic events associated with the shallow nature of the underground workings. However, the ability of these devices to detect micro fracturing would indicate possible pillar and interburden instability.
This paper aims to share learnings in managing the associated risks when overmining previously mined bord-and-pillar workings with a low safety factor using arrays of geophones to detect the possible onset of pillar and/or roof instability.
The use of this monitoring system in the application of the Van der Merwe 2019 pillar design formulae that utilises a time-based stability approach is also discussed.
Although this paper will touch on some practical issues, it will not go into depth on how it was managed on the operations; the main aim of the paper is the assessment and mitigation strategy in the overmining of the Low FoS pillars.
Background General
Coal pillar design aims to satisfy industry-accepted FoS, and more recently, probability of stability (PoS) criteria. These minimum criteria were developed based on the long-term stability requirements of the panels. In this context, these criteria are used to validate the stability requirements of historically mined S2 panels and thereby assess the probability of safely overmining such workings.
Goedehoop Colliery
The S2 at Goedehoop was mined in the early 1960s. After depletion of the S2 reserves, top coaling was carried out in several areas and, in some cases, bottom coaling was done on the retreat out of panels. At the time, the overlying S4 reserves were not considered economically viable, and therefore, no consideration was given to the impact of the low safety factors on future mining of the overlying seams.
The secondary mining (top and bottom coaling) in the late 1980s resulted in FoS that were below the industry-accepted criteria (FoS <1.6, down to 0.8) and low W:H ratios (≤ 2) for extensive areas
Example of FoS and PoS of S2 cells at the corridor area at Goedehoop Colliery
Overmining low factor of safety coal pillars using an enhanced monitoring system
of S2 pillars. This effectively sterilised the S4 reserves above, as these areas were considered unsafe to mine.
Additional analyses were done in 2017 utilising the Salamon and Munroe (1967), Van der Merwe (2013a), and Van der Merwe (2016) pillar design formulae to assess the stability of the pillar systems. Note that the pillar design is done on the system and not an individual pillar – so more or less rectangular analysis blocks (cells) were evaluated where the cell length is at least equal to the panel width. A sample of the results obtained for these cells in the socalled corridor area is shown in Table 1. Even though not available at the time, the results, when utilising the Van der Merwe (2019) formulae, have also been added to Table 1.
The results show that, using the Van der Merwe (2019) formulae, a number of cells have an FoS and a PoS above the minimums of 1.60% and 99.00%, respectively, compared to the other formulae. The Van der Merwe (2019) methodology builds on the time-based probabilistic approach that was developed by Van der Merwe (2016). The 2019 formulae utilise the expected pillar size at failure by accounting for the expected scaling between the onset of mining and failure. This results in the statistical expectation of
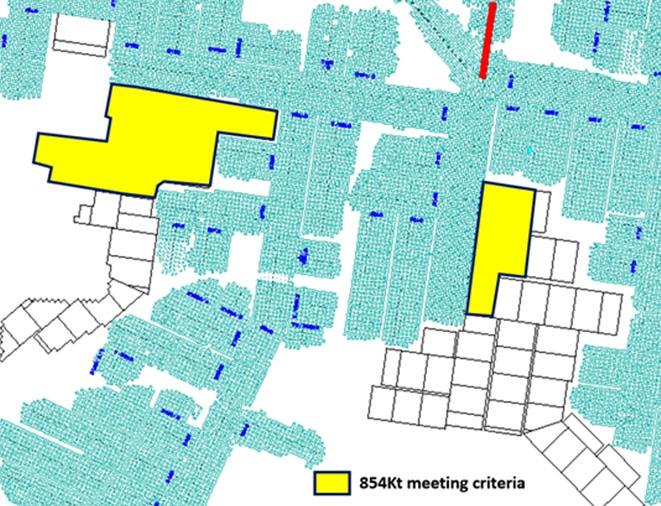
FoS of 1.0, corresponding to a probability of failure of 50% (Van der Merwe, 2019).
In the mid-2010s, with dwindling S4 reserves, two more areas (so-called blocks G and H) were earmarked for over-mining at Goedehoop that met the minimum FoS criteria of 1.2, using Van der Merwe (2013). These are shown in Figure 2.
Greenside Colliery
The S2 at Greenside Colliery was mined from the early 1930s to the mid-1960s. The average S2 mining height was approximately 2.40 m. At these relatively low mining heights, S2 pillar stability was historically not considered to pose a safety risk to future S4 mining.
In the early 1930s, a surface mineral residue deposit (MRD) consisting of waste material generated during coal processing was started. The initial expansion of the MRD did not consider S4 as viable at the time. In 2019, the height of the MRD extended 57 m above the surface, with the S4 panels located around 40 m below the surface. The additional loading imposed by the MRD potentially negatively impacted the stability of the S2 workings. A stability analysis was conducted in 2019 by splitting the area under the dump and under the planned S4 panels into several cells. By splitting the area in cells, factors such as changes in S2 pillar dimensions, depth below surface, and MRD height variations could effectively be accounted for during analysis. These cells, in relation to the historically mined S2 working and planned S4 panels, can be seen in Figure 3.
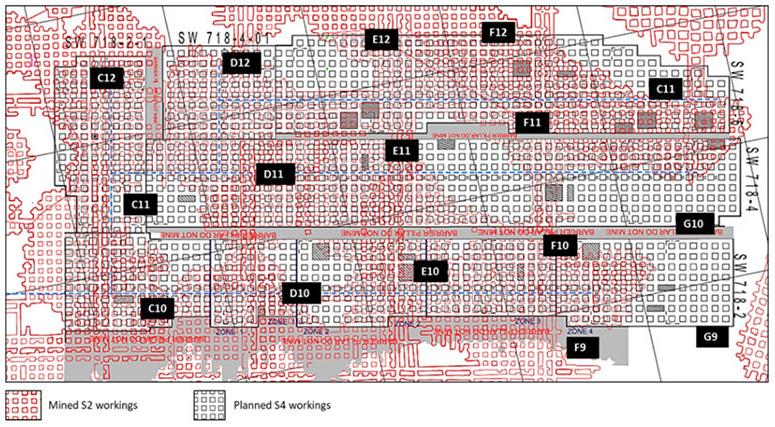
G9
Figure 2—Proposed S4 blocks G and H for overmining low safety factor areas in relation to mined S2 workings
Figure 3—Stability analysis cells in relation to mined S2 workings
Table 2
FoS and PoS for S2 cells below planned S4 panels at Greenside Colliery
C11
Overmining low factor of safety coal pillars using an enhanced monitoring system
For each cell, the corresponding FoS and PoS were calculated utilising different industry-accepted formulae. The results can be seen in Table 2, with the red-coloured values being less than the industry-accepted minimum stability requirements.
The following findings were derived from the stability analysis:
➤ Both the Salamon and Munroe (1967) and Van der Merwe (2013a) pillar design formulae indicated only two S2 cells (C12 and D12) exceeding the minimum required FoS of 1.60. These cells were located at the edges of the dump footprint and therefore subjected to less loading than the adjacent areas.
➤ The Van der Merwe (2016) formula indicated that the FoS and PoS of the entire area underneath the Greenside MRD fell below the minimum requirements of 1.60 FoS and 99.00% PoS. This methodology considers the time-dependent behaviour of the pillar and its impact on pillar strength since mining of the S2 workings took place.
➤ The Van der Merwe (2019) formula indicated both an FoS and PoS that met the minimum industry requirements. This method utilises the reduction in pillar sizes due to scaling within the statistical analysis.
Overall, formulae prior to Van der Merwe (2019) indicated FoS values less than industry requirements. A decision was made that to safely overmine the S4 workings below the MRD, the same methodology employed at Goedehoop Colliery, utilising strategically installed geophones, would be utilised.
Defining risk
Before the start of the project at Goedehoop Colliery, a joint session
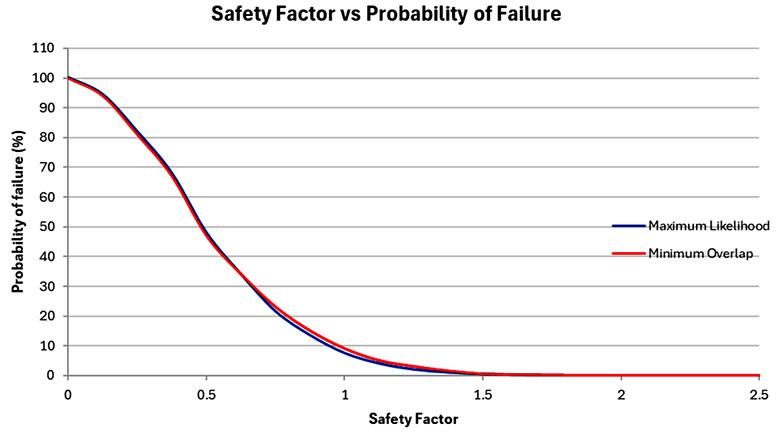
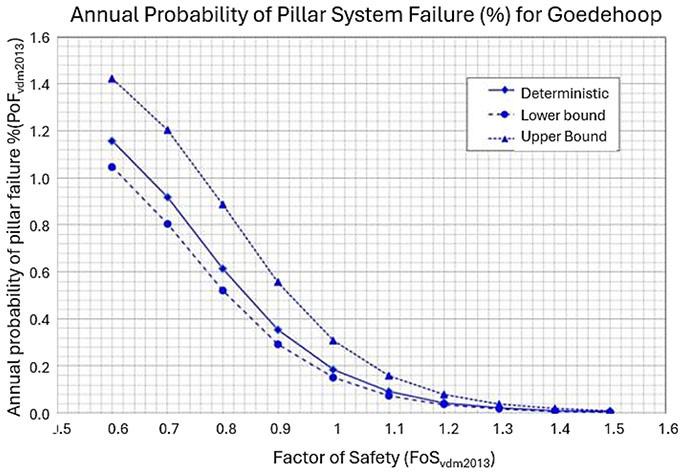
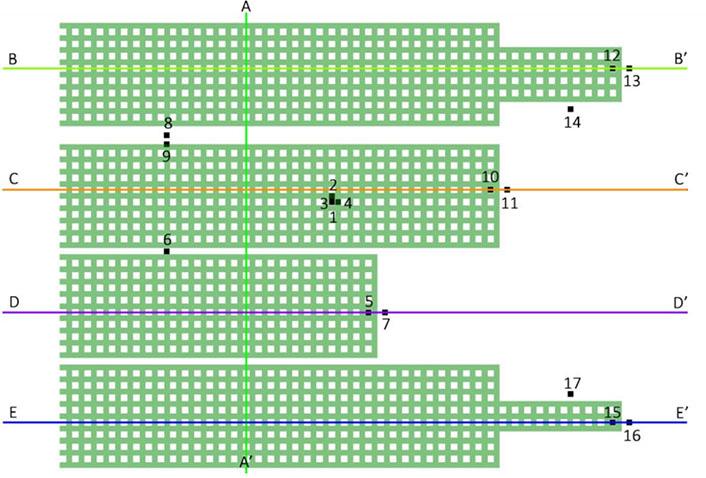
1 Pillar centre in middle of panel 2 Bord centre in middle of panel 3 Pillar edge in middle of panel 4 Bord edge in middle of panel 5 Pillar behind lagging panel 6 Narrow barrier pillar centre (one pillar width) 7 Abutment ahead of lagging panel
8 Wide barrier pillar (two pillar widths) centre 9 Wide barrier pillar (two pillar widths) edge 10 Pillar behind leading panel
11 Abutment ahead of leading panel
12 Pillar behind five roadway width panel
13 Abutment ahead of panel (five roadway widths)
14 Abutment on the side of (five roadway width panel) 4
15 Pillar behind panel (three roadway widths)
16 Abutment ahead of panel (three roadway widths)
17 Abutment on the side of (three roadway width panel)
Figure 7—Map3D conceptual model showing positions at which stress changes were monitored at different levels below the S4
was held with several rock engineers from various mining houses and consulting agencies. The aim of this session was to discuss possible rock mass responses, failure mechanisms, and possible monitoring strategies.
The session output and several follow-up discussions further guided the requirements for quantifying the risk and probability of failure that could result in an unwanted event during the overmining of the S4.
Probability of failure
An evaluation of the annual pillar probability of failure (PoF) was one of the most critical inputs to the risk assessment. While the FoS of a pillar gives an indication of relative pillar stability, the degree to which a pillar is stable cannot be quantified from FoS alone. However, a link between the FoS and PoF had been established by comparing the observed number of failures with a predicted number of stable cases for each safety factor across the entire population of pillars in South Africa (Van der Merwe, Mathey, 2013b).
Using statistical methods, maximum likelihood, and minimum overlap, the work done by Van der Merwe and Mathey (2013b)
Figure 5—Factor of safety vs probability of pillar failure (Van der Merwe, Mathey, 2013b)
Figure 6—Annual probability of pillar system failure on S2 for Goedehoop Colliery, as derived by SRK Consulting
Overmining low factor of safety coal pillars using an enhanced monitoring system
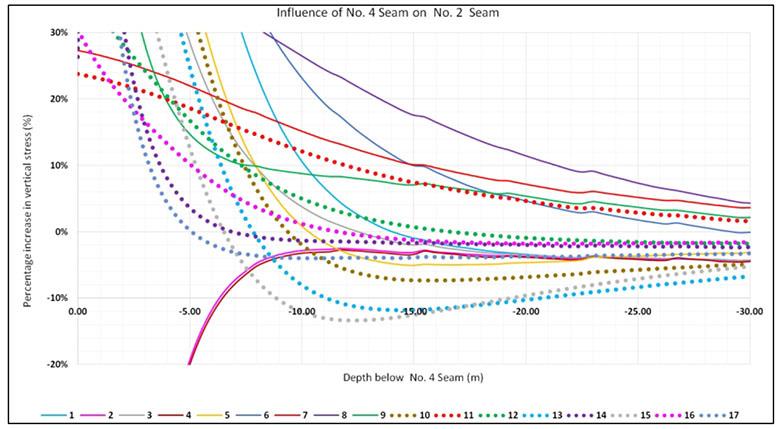
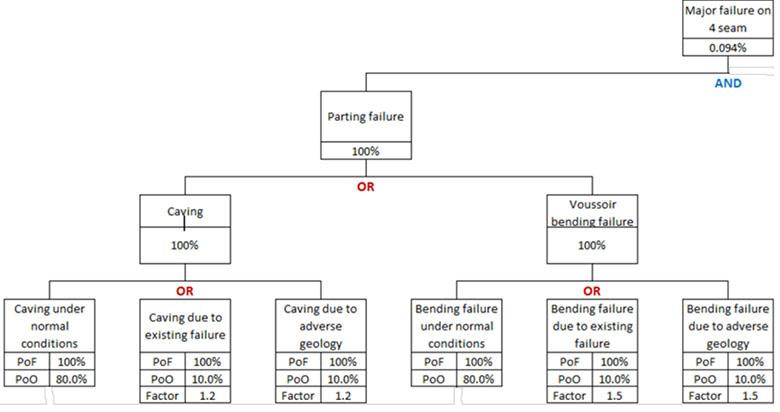
yields a PoF of 7.7% for FoS = 1, and not 50% as predicted by the typical probability theory by Van der Merwe (2019). It is also interesting to note that the FoS coinciding with a PoF of 50% is just less than FoS = 0.5 (Van der Merwe, Mathey, 2013b). This can be seen in Figure 5.
The annual PoF was calculated using an approach developed by SRK Consulting, based on a site-specific relationship between PoF and FoS by using the Van der Merwe (2013a) formulae for S2 in the Witbank area. The annual probability of failure for pillar system failure on S2 can be seen in Figure 6.
Adjustments required for pillar behaviour, taking into account abutment stress
Mining of S4 will cause a redistribution of abutment stresses, which could affect the stability of S2. Map3D (a numerical modelling code) analysis done by SRK Consulting for Goedehoop Colliery showed that the magnitude of these stresses on S2 will be a function of the interburden between the seams and the mining geometry of the S4 panels. Additionally, adjustments were made to account for increased pillar loading due to overmining. The positions at which these stress changes were assessed are shown in Figure 7. The percentage increase in vertical stress acting on the pillars at each position is shown in Figure 8.
In the aforementioned analysis, adjustments for additional timedependent deterioration of the workings are incorporated into the various pillar design formulae.
The probability of failure was determined using a fault tree. The risks were then determined using an event tree, after which they were evaluated against predefined acceptable levels of risk.
Fault tree concept
The concept of the tolerability of risk is considered before
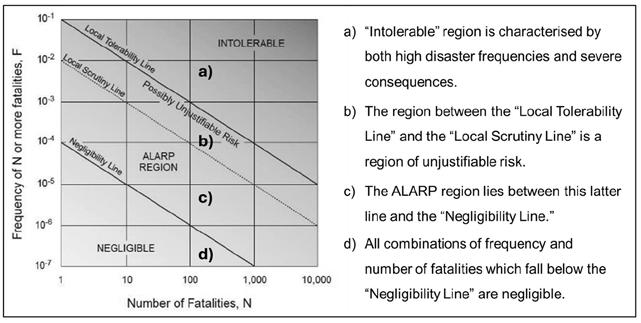
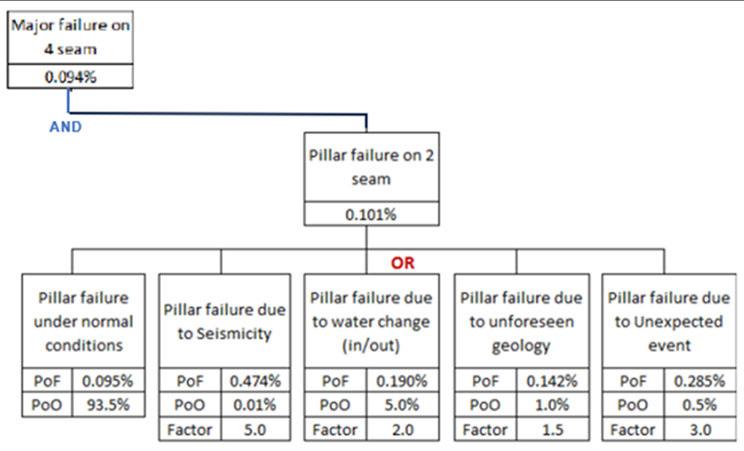
presenting the results. Risk thresholds, indicating the tolerability of risk, are plotted in terms of local acceptability of fatalities from industrial and other accidents. This is shown in Figure 9.
Fault tree analysis
The most undesirable event identified in the fault tree analysis was a major failure on S4. The events leading to such a major failure would be a result of multiple pillar failures on S2 and the parting between S4 and S2. Each event is split into probability of failure (PoF) and probability of occurrence (PoO), as can be seen in Figure 10. Each of the potential modes of failure (caving and beam failure) was evaluated using the mining layouts, borehole lithology data, and back analysis of the subsidence data provided by Goedehoop Colliery.
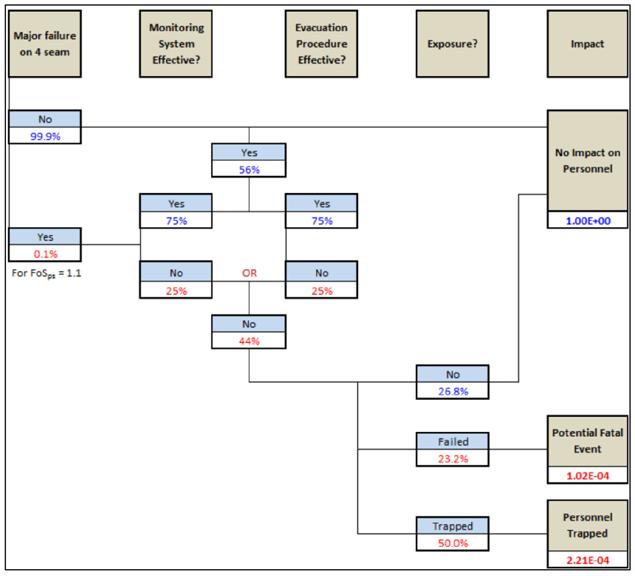
Figure 8—Increase in vertical stress at different middlings and locations due to overmining of S4 workings
Figure 9—Indicative frequency-fatalities curve indicating the tolerability of risk from industrial and other accidents (Lamb, 1997)
Figure 10—Fault tree analysis of major failure of S4
Figure 11—Event tree of major failure on S4
Overmining low factor of safety coal pillars using an enhanced monitoring system
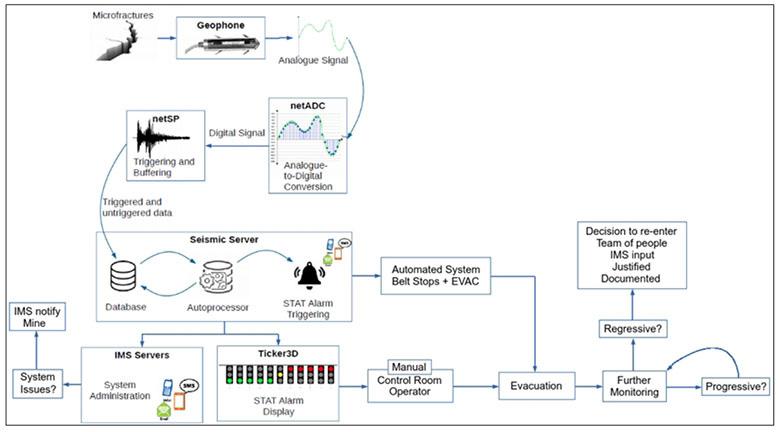
Probability of fatality
Event tree
The main purpose of the event tree is to estimate the probability of fatality or injury caused by a major failure on S4. The event tree developed during the joint workshops is shown in Figure 11.
The components of the event tree address the following:
➤ Whether the monitoring systems in place can detect impending failures.
➤ Whether the evacuation procedures will be effective.
➤ Whether people are exposed.
➤ Whether there is at least one injury or fatality.
Monitoring
The ability to give timeous warning of possible instability or a failure in the monitor system were essential for safely overmining the Low FoS areas. The areas to which the above procedures were applicable were called enhanced monitoring districts (EMD).
Crack counting process
The objective of the seismic monitoring system was to monitor an area that might be susceptible to pillar failure. When pillar instability is detected, the Mine Control Room and responsible mine personnel are informed so that appropriate and immediate action can be taken.
The Institute of Mine Seismology (IMS) previously developed an early warning system based on the concept of “crack counting” (Lynch, 2002), which used a seismic sensor to trigger alarms based on predefined criteria. However, a key limitation of this system was that it did not allow for the classification of the recorded waveforms.
In a mining environment, many signals recorded by seismic sensors originate from non-seismic sources, such as underground machinery, mine personnel, or even surface activity, especially in shallow mining operations. Without waveform classification, these signals cannot be reliably distinguished from actual seismic events. For the alarm system to be effective—capable of detecting early signs of pillar instability while avoiding excessive false alarms— accurate waveform classification is essential.
The classification or processing of the seismic data needs to be fast and accurate. Automatic processing is preferred over manual processing as it is much faster and can be carried out at a lower cost. Another advantage of using automatic processing is that, if the
mine experiences connectivity issues, the alarm system can still run locally on the mine site, and mining operations can continue.
The automatic processor needs to be able to distinguish between three classes:
➤ Noise generated by underground mining activities.
➤ General noise, caused by activity on surface and other environmental factors.
➤ Seismic cracks – pillar- or interburden-related.
For the classification, there are two types of machine learning techniques, namely supervised and unsupervised. With supervised machine learning, the training set (waveforms, in our case) will already be classified into the three classes. In this case, these labels were not available. Unsupervised machine learning does not use labels; instead, it attempts to detect clusters for classification. Simple algorithms were developed based on pattern recognition to specifically detect waveforms that were generated from underground machinery, mining activities, and possible cracking of rock.
The short-term activity tracker (STAT), as per Mendecki (2016), can be used to trigger an alarm, which might indicate pillar instability. This method can run automatically in real time on IMS software at the Mine Control Room. The STAT gives the probability that the current activity rate is higher than the reference activity rate. If the reference activity (i.e., events per hour) is too
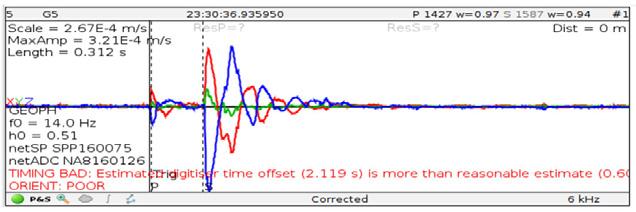
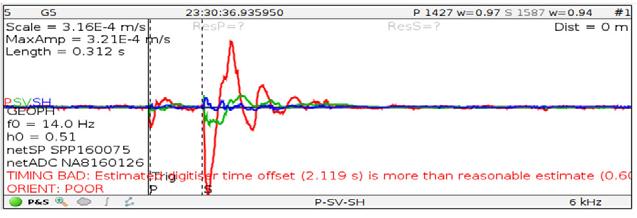
Figure 12—Process flow indicating the steps to be followed when micro-fracturing is detected
Figure 13—The top signal visually looks like a seismic crack, but rotated only once (bottom signal), it is clear that this signal is not a seismic event
Overmining low factor of safety coal pillars using an enhanced monitoring system
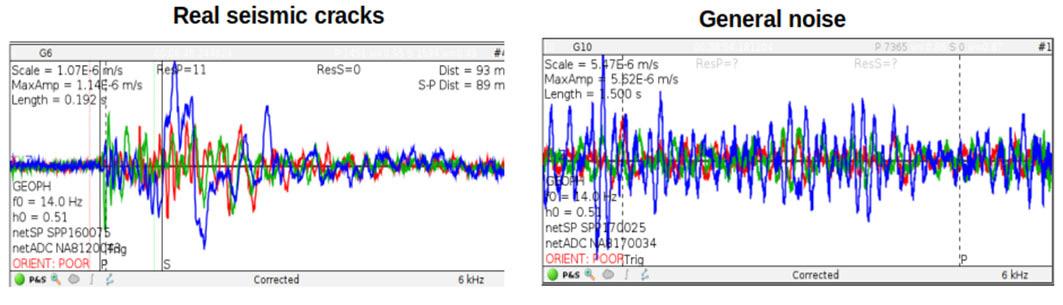
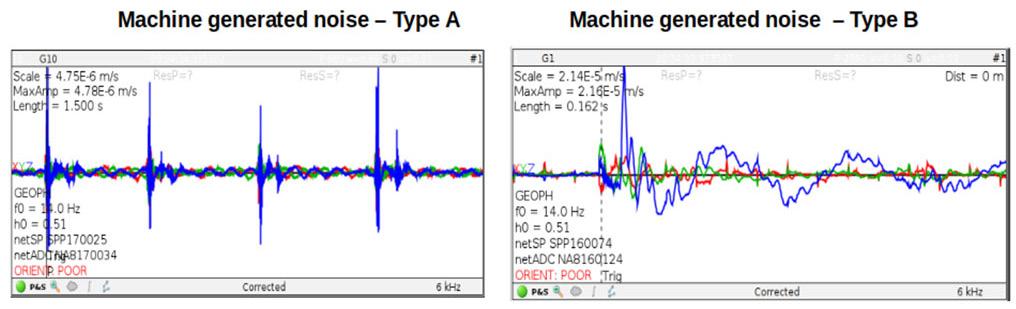
high, then actual instability may not be detected. However, if the reference activity is too low, then false alarms will be generated. An illustration of the process flow when micro fracturing is detected is shown in Figure 12.
Geophones
As the objective of the monitoring was crack counting and not event location, there was not a real need for tri-axial geophones, however tri-axial geophones are required to calculate the directivities. The directivity of the particle motion of the P-wave and S-wave is orthogonal. This can be useful in classification and to distinguish, if possible, whether arrivals are indeed P- and S-waves. The waveform shown in Figure 13 looks visually like a seismic crack, but only after rotating the waveform is it clear that the two arrivals are P-waves.
Once an automatic P-wave pick has been made, the variability in the recorded waveform around that pick can be analysed. By applying a standard statistical technique, principal component analysis (PCA), the waveform is rotated into a new coordinate system that better separates the different wave components. In this transformed system, the first principal component typically aligns with the direction of wave travel, and is expected to contain only P-wave energy. The remaining two components are then expected to represent the S-wave energy. This separation helps assess whether the identified P- and S-wave arrivals are likely to be correct.
Automatic processor
In Figure 14 examples of data recorded at Goedehoop Colliery are shown. The top left example is a real seismic crack recorded on 1 September 2017 at 01:00:48, the top right waveform an example of general noise recorded on 1 September 2017 at 00:38:54, the bottom left waveform is from a crusher on 6 September 2017 at 09:04:34, and the waveform displayed in the bottom right was generated from material moving over a broken bolt on a conveyer belt and was recorded on 5 April 2017 at 20:34:53.
Following here, the algorithms are explained in more detail on how to detect the different noise types, including machinegenerated noise or possible seismic cracks.
Type A
A standard statistical measure can be used to assess how much the recorded signal fluctuates relative to its average level. Figure 15 shows a waveform generated by a hydraulic hammer, with motion
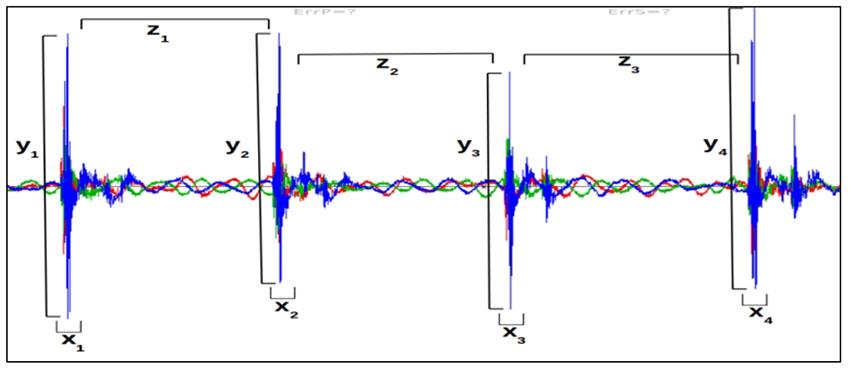
recorded in three directions (x, y, and z). For signals of this type, the variation in all three directions is typically low. When the measured variation in each direction falls below a certain threshold, the signal is classified as noise or non-seismic and is excluded from further analysis.
Type B
In Figure 16 a waveform is shown that looks like a possible seismic crack but turned out to have been generated from material moving over a broken bolt on a conveyer belt structure. Around early September 2017 many alarms were triggered, and the waveforms produced looked seismic, but all the waveforms that activated the alarms were very similar. Further, as soon as underground personnel evacuated, these signals stopped. After investigation, a broken roller was discovered that triggers these waveforms when material moves over the roller. Waveform similarity techniques,
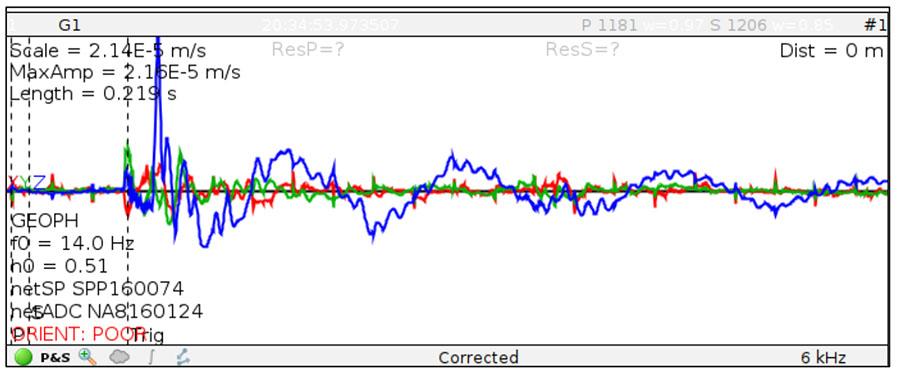
Figure 14— Examples of data recorded at Goedehoop Colliery in 2017
Figure 15—The waveform produced by a hydraulic hammer
Figure 16—Example of a waveform that was generated by a broken bolt on a conveyor belt
Overmining low factor of safety coal pillars using an enhanced monitoring system
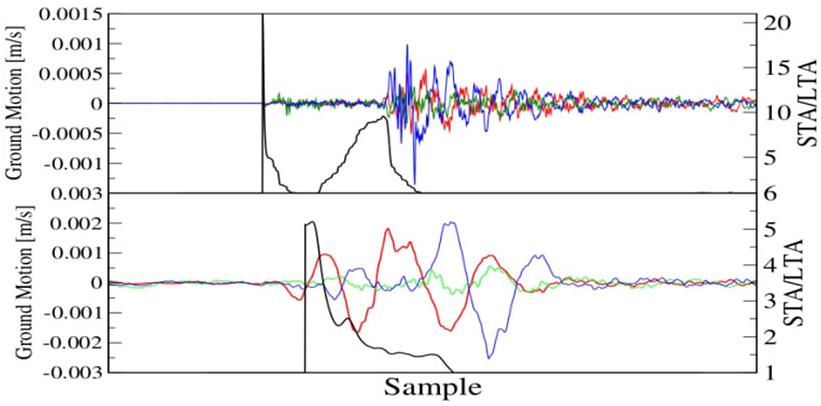
such as cross-correlation, can be used to detect the second type of machine-generated noise. If the Pearson correlation coefficient of all three components is above some threshold, then the recorded data is classified as reject.
Seismic cracks
Simple pattern recognition techniques are used to classify recorded data as seismic. Seismic events typically have visible pressure (P) and shear (S) wave arrivals, and signal-no-noise (SNR) with not too many other spikes. The different characteristics/features can be measured as the number of spikes (arrivals), nspikes, signalto-noise, SNR, short-term average (STA) and long-term average (LTA) ratio of the signal, STA/LTA, and dominant frequency of the signal, fdom. The STA/LTA of the signal is a means of obtaining the number of arrivals a signal has; this ratio tends to increase rapidly close to a phase arrival – Baer and Kradolfer (1987). This can be used to determine if a likely arrival (P-wave) is followed by another phase arrival (S-wave). These features can be used to detect possible seismic cracks.
In Figure 17, two waveforms are shown: the top waveform has
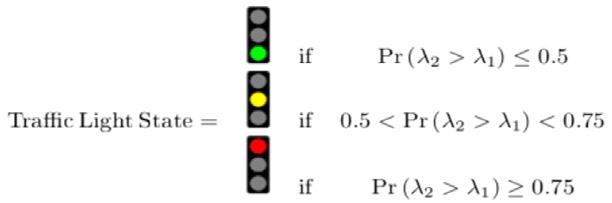
a clear P- and S-wave arrival, while the bottom waveform does not. The STA/LTA curve (black line) has a sharp increase near the P-wave arrival, then drops during the P-wave coda, then increases near the S-arrival, and then finally dropping towards the S-wave coda. This is clearly different from the bottom curve.
Short-term activity tracker
To avoid unnecessary false alarms, the activity level is compared to a reference value. This reference value is calibrated based on historical alarm rates to achieve a manageable false alarm rate while not missing alarms associated with actual pillar failure. These rates are compared probabilistically. If this probability exceeds a pre-defined level, an alarm is raised. In this case, the short-term activity tracker (STAT) gives the probability (for each seismic sensor) of the current activity rate (lambda2) being larger than the reference activity (lambda1). The STAT probability, as per Mendecki (2016), is given in terms of: N1 = 20 is the reference number of events per time Δt1, N2 is the number of classified seismic cracks in the last Δt2 hours, Δt1 = Δt2 = 1 hour, and k = 1.
STAT is implemented in the IMS software Ticker3d and runs in the mining operation's control room. If the STAT probability of a sensor is smaller than 0.5, then a green light is assigned, if the probability is between 0.5 and 0.75, an orange light is assigned, and if larger than 0.75, then an alarm is raised, as indicated in Figure 18.
To reduce the number of false alarms, the alarm threshold, i.e., N1 increases when machine generated noise is detected. Typical machine-generated noise has low recorded ground motion (< 1e-5 m/s). The machine-generated noise may appear very similar to seismic events and this may cause false alarms. When the automatic processor classifies data (with low ground motions) as seismic, and machine-generated noise was detected in the past 15 minutes, then it will be saved as seismic with a 0.2 probability. This effectively increases the alarm threshold during times when machine noise is detected.
Results and alarm statistics
In Figure 19 the histogram of the triggers per hours (left) and accepted events per hour (right) is shown for all data recorded between commissioning of the seismic system and decommissioning at Goedehoop Colliery. As can be seen, a reference activity rate of 20 will not produce many false alarms but seems low enough to detect real alarms.
Connectivity and evacuation
Each installed geophone was linked to a seismic enclosure (container). The enclosures were then linked to the Institute of
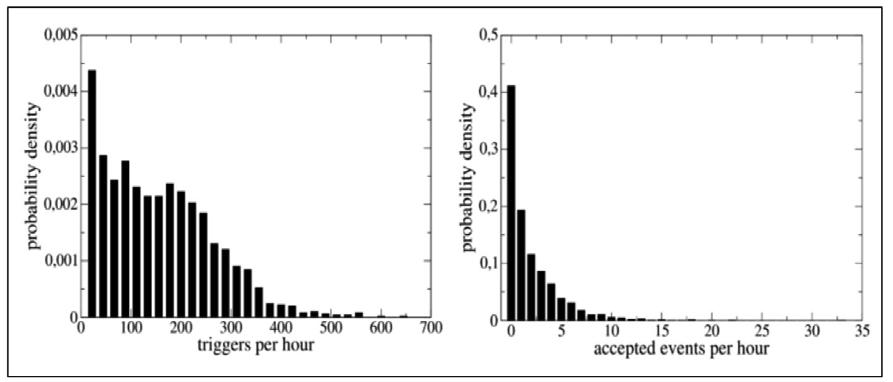
Figure 17—Waveform of a seismic crack (top) with clear phase arrivals and a waveform that was generated from an unknown source but only has a p-wave. Note the difference between the STA/LTA curves (black lines) of the two signals
Figure 18—The STAT traffic light system. An alarm is raised when the probability is larger than 0.75
Figure 19—Histograms of the number of triggers per hours (left) and the number of accepted events per hour (right) are shown for all data recorded between commissioning of the seismic system and decommissioning
Overmining low factor of safety coal pillars using an enhanced monitoring system
Mine Seismology (IMS) and the Mine Control Room using fibre connectivity. A dedicated desktop computer in the Mine Control Room updated the status of the geophones in real time.
To reduce the risk, strict access controls to the EMD blocks were required. A dedicated guard stationed at the EMD Waiting Place was responsible for issuing a set number of access tags. The EMD Waiting Place was in a safe area outside of the EMD blocks with an open communication line to the Mine Control Room.
The evacuation procedure specified the response taken based on the triggered alarm condition. When the number of accepted triggers exceeded the threshold limit of 20, a robocall was received by all responsible parties and the Mine Control Room desktop flagged it as a so-called Red TARP alarm. This led to the Mine Control Room immediately phoning the Section Waiting Place to initiate an evacuation of the crew. In addition, the Control Room remotely activated an audible alarm in the Section and enforced a stoppage of all mining activities by stopping the section conveyor. This ensured that even if the phone went unanswered, personnel would still be aware of the required evacuation.
During the evacuation, all personnel were expected to gather at the EMD Waiting Place. When all personnel had been accounted for using the tag system, the guard notified the Mine Control Room that the area was clear. The location of the triggered sites allowed the Rock Engineering Department to determine the affected areas, and the required extent of the evacuation. Personnel were only allowed to return to the affected areas when triggers had reduced to below the set accepted trigger threshold. This upliftment needed to be authorised in writing by the Mining Manager after consultation with the Rock Engineering Department. A dedicated WhatsApp group per site was used for swift communication. Overall, this resulted in an automated evacuation process with several additional manual controls to enforce compliance. Re-entry required management involvement to ensure full positive communication by all responsible parties.
If real-time connectivity to the geophones was lost due to network issues or a power failure, a 15-minute time window was given for restoration. When the system was not restored to real-time connectivity within this time frame, an evacuation of the affected areas was ordered. When connectivity to IMS was lost but not to the Control Room desktop, the so-called ‘Hawkeye’ response was activated. This involved a trained mine supervisor being stationed at the Mine Control Room desktop to manually alert the response team to any triggers or system downtime.
Exposure of people
The event tree shown in Figure 11 indicates the probability of mine personnel being exposed to pillar system failure over time and space if people had not been evacuated. Although a failure could occur at any time, underground personnel will only be exposed for a limited time during each shift.
Exposure of personnel is dependent on:
➤ Category of mine personnel (production and nonproduction)
The number of mining and engineering personnel allowed in each section will depend on the risk analysis for that section, ensuring the risk remains ALARP. This is done by relating the frequency (per year) to the number of possible fatalities (F-N assessment).
➤ Time exposed to the risk in the working area
Assuming 299.8 working days per year.
➤ Area within the working area where the person will work Face Area – The length of the face area was taken as the distance from the face to the feeder breaker (3 rows back), typically around 52 m (dependent on pillar sizes).
Back Area – This was defined as the total area from the waiting place to the face area.
➤ Probability of spatial coincidence of personnel exposed to the failure.
This is dependent on the space occupied by a failure.
The probability for intersection collapse will be low but might be high for multiple pillar failure of the S2. A failure that affects the face area’s consequence will be more severe as all the workers could be affected because they are concentrated within the face area.
Evaluation of risk
The process described in the aforementioned 0was used to determine the risk against accepted risk levels (ALARP) and is expressed as individual risk per annum and plotted using an F-N graph. The input parameters account for the abutment loading, exposure parameters, coincidence, and an evacuation success rate. The parameters can be seen in Table 3.
The exposure of different mining personnel (Table 4) and visitors were calculated for the different areas within the working area for both day and night shift. The annual exposure of mining personnel calculated for day shift can be seen in Table 4.
The data was then plotted on an F-N graph against acceptable risk levels. An example of such a plot for different mining commodities done by SRK Consulting can be seen in Figure 20. Should the risk exceed the acceptable risk levels then the following should be considered:
➤ Reduce the number of people allowed in the section.
➤ Reduce the exposure time by changing the duration of the shifts and / or eliminating the night shift.
➤ Reduce the exposed area by reducing the number of roadways (width and ultimately the exposed area).
Table 3
Example of general inputs into the F-N graph
Input parameters
Overmining low factor of safety coal pillars using an enhanced monitoring system
Table 4 Annual exposure of mining personnel within the working area for day shift
Personnel
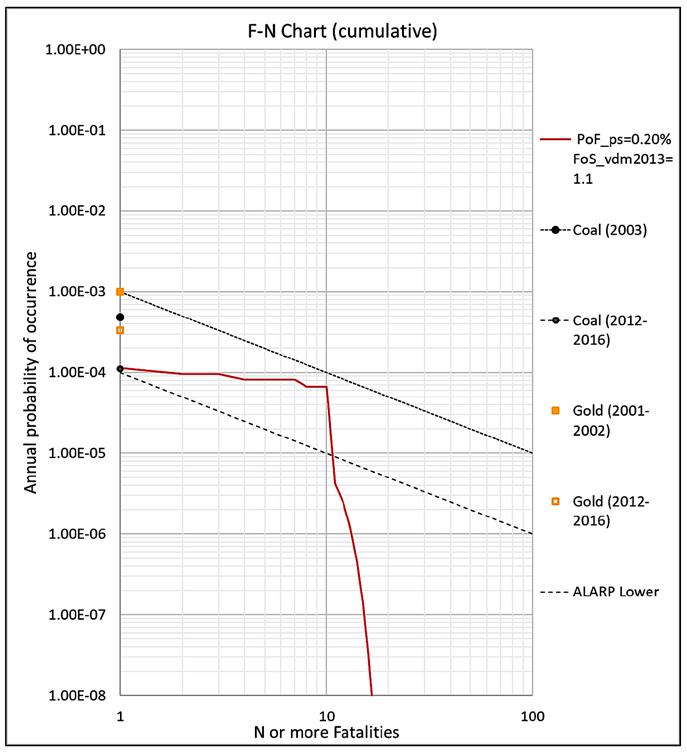
Figure 20—Example of an F-N Chart comparing outcome of the analysis with different mining commodities
Operational implementation
Goedehoop Colliery
Corridor area
For the trial to commence, a suitable low factor-of-safety block
had to be chosen. The site needed to have access to the S2 pillars for visual assessments during overmining, should fracturing be detected by the seismic system. The only S2 block fulfilling these criteria was located at Simunye Shaft. The so-called corridor area is shown in Figure 21.
Overmining low factor of safety coal pillars using an enhanced monitoring system
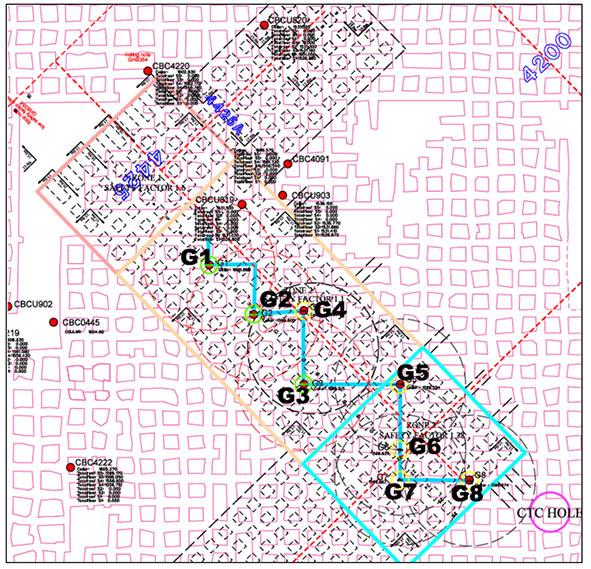
To ensure that micro-cracking of the S2 pillars was detected, the geophones were installed 100 m apart. Installation initially occurred from the accessible S2 workings by drilling and installing the geophones 10 m into the roof. Each geophone was grouted in place so as to ensure positive contact with the surrounding rock mass. For this initial trial, the geophones were connected to NetADC’s and NetSP in underground seismic enclosures within the accessible area.
As the S2 workings in the corridor area were accessible, all triggers exceeding the 20 acceptable triggers per hour threshold were visually inspected. No cracking of pillars was observed following the alarms, which indicated that the triggers were not linked to pillar straining. Analysis by the Rock Engineering Department and IMS indicated that the triggers were caused by machinery and other activities within the S4 workings. As the project progressed, the trigger algorithms were adjusted to refine the system and exclude any false triggers. The evacuation and re-entry procedures employed during these alarms proved highly successful,
Table 6
Issues and learnings from the EMD project
Issues
Long lead time on hardware components in relation to expected time of mining.
Analysis and risk assessment process of EMD panels taking too long.
Surface rights may not belong to the mine. Negotiation with landowners and leases for access and drilling are required.
Detailed monitoring procedure is not in place. Control Room personnel are not adequately trained to exercise the procedure.
with all personnel safely evacuating to the designated waiting area.
Blocks G and H
The focus then shifted to Block G and Block H, geophones were installed from the surface, as the S2 workings were not accessible. The seismic stations, communication infrastructure, and security systems were all placed on surface. The length of cabling to the geophones had to be limited to approx. 400 m, as the signals weakened due to voltage drop and signal attenuation. Two separate seismic enclosures had to be installed for Block G and Block H, due to these distance requirements. Both Block G and H were successfully mined with no alarms linked to pillar instability.
Square Block
Lastly the S4 reserves at the so-called Square Block were successfully mined using EMDs. No alarms related to pillar instability were detected. The remaining geophones were subsequently switched off and all hardware on the surface was reclaimed.
Greenside Colliery
A total of four panels at Greenside Colliery were classified as EMDs. The sites were drilled from the top of the Greenside MRD and connected to two seismic enclosures. Even though the initial project plan was for the distance between sites not to exceed 100 m, this proved challenging due to drilling constraints on the dump. The unconsolidated nature of the fine waste material led to drill rods getting stuck and holes being abandoned before the natural ground elevation could be reached. As a result, several planned locations had to be shifted.
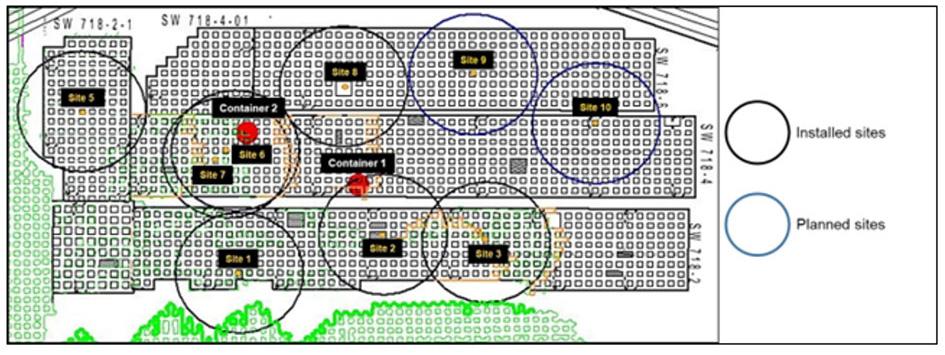
Learnings
All hardware components, including geophones and seismic stations, must be ordered and installed in advance of overmining.
All EMD panels and the expected time of mining must be planned to allow for diligent S2 pillar stability analysis and risk assessments.
Consult landowners in advance to allow for drilling of boreholes, site preparation, and installation of seismic stations on surface. Free access to the stations should be arranged to address hardware issues.
All Control Room personnel should be trained in advance to prevent any confusion. Creation of a simple but detailed Trigger Action Response Plan (TARP) visible at the Control Room assists the operators with the required steps.
Unauthorised personnel entering the EMD panels. Guard should be stationed at a single-entry point into the EMD panels, with a predetermined number of access tags.
Confusion of section personnel when an alarm is triggered. Setup of evacuation and re-entry procedure. All section personnel must undergo training and participate in emergency evacuation drills.
Figure 21—Geophone layout in the corridor area
Figure 22—Final positions of the installed sites and enclosures at Greenside Colliery
Overmining low factor of safety coal pillars using an enhanced monitoring system
By the end of the project, eight of the planned ten sites were installed. The final locations of the installed sites and the abandoned positions of sites 9 and 10 are shown in Figure 22. The installation of sites 9 and 10 were abandoned due to a decision that sufficient data had been gathered and the highest risk areas had been safely mined. Several alarms occurred during the project. The Rock Engineering Department set up the Greenside Evacuation Procedure based on the proximity of the alarming site/s to each panel.
Most of the TARP alarms that occurred could be linked to a trigger mechanism that had not been accounted for and subsequently excluded from the accepted trigger range. These include triggers caused by surface re-mining activity occurring on the MRD above.
Immediately after Site 6 was commissioned in panel SW718-4, it began to set off alarms. After a hardware issue was excluded by IMS, underground and surface visits were conducted, but did not indicate any clear cause. The surrounding sites did not register the same accepted triggers, and a decision was made to install a new geophone at Site 7 within a 16 m centre distance of Site 6. When Site 7 did not register the same triggers appearing in Site 6, a decision was made to decommission the unit.
By the end of the project, none of the TARP alarms could be linked to instability from the S2 pillars.
Learnings
Several learnings were made during the EMD project. A summary of issues and subsequent learnings can be seen in Table 6.
Conclusion
➤ Approximately 4.70 Mt of coal, which was previously declared as sterilised, was successfully mined between operations using a thorough risk assessment and mitigation process.
➤ Fault and event tree analyses were done to ensure the risks were kept ALARP and within acceptable limits.
➤ The factors identified that could cause instability in the S4 was a failure of either the pillars in the S2 or the parting between the S2 and S4.
➤ Coal reserves overlaying perceived low FoS coal pillars can potentially be safely extracted utilising geophone arrays by implementing the following:
• Automated seismic data processing that gives timeous warning of possible micro-crack formation and pillar failure.
• An effective evacuation procedure.
• Ensuring limited exposure of personnel to the perceived level of risk.
• Ensuring the risk levels were ALARP and within acceptable limits.
➤ Mining of the S4 reserves were done in areas where pillar failures could be expected, based on the FoS calculations at the time. Following the success of mining these areas without failure indicated that the historical formulae used (post 1960) may be conservative.
Recommendations
➤ Enhanced monitoring is recommended if overmining of potentially unstable coal pillars is planned that fall outside of the scope of this paper.
➤ Even though the results of this project might assist in validating that the Van der Merwe (2019) formulae better
represent actual pillar strength over time, closer scrutiny of the available data is recommended.
Acknowledgements
We would like to thank Thungela Resources for their support in carrying out this project at both Goedehoop and Greenside Collieries. We would like to acknowledge SRK Consulting for the work done on annual PoF derivations for the Goedehoop Colliery, F-N modelling, as well as analysis on abutment stress interaction on S2 from the mining of differently structured S4 panels. We would also like to thank the Institute of Mine Seismology (IMS) for the extensive work done as only briefly outlined in this paper. Finally, we would like to thank all other stakeholders, including the rock engineering personnel from various mining houses for their participation in the concept formulation.
References
Baer, K., Kradolfer, U. 1987. An automatic phase picker for local and teleseismic events. Bulletin of Seismological Society of America, vol. 19, no. 6, pp. 1437–1445. Available at: https://pubs.geoscienceworld.org/ssa/bssa/articleabstract/77/4/1437/119016/An-automatic-phase-picker-forlocal-and?redirectedFrom=fulltext
Lamb, J. 1997. Risks and Realities - A Multidisciplinary Approach to the Vulnerability of Lifelines to Natural Hazards. Centre for Advance Engineering CAE, New Zealand. ISBN: 0-908993-12-9. Lynch, R.A. 2002. Col816: Develop specifications for a portable counting seismometer to be implemented routinely in mines underground. Safety in Mines Research Advisory Committee. Available at: https://www.mhsc.org.za/sites/default/files/public/research_ documents/COL816%20Report.pdf
Mendecki, A.J. 2016. Mine Seismology Reference Book: Seismic Hazard. Institute of Mine Seismology, ISBN 978-0-9942943-0-2, www.imseismology.org/msrb/, 1 edition, May 2016. URL https://www.imseismology.org/imsdownloadsapp/webresources/ filedownload/Mendecki(2016)-MSRB-Seismic-Hazard.pdf
Salamon, M.D.G., Munro, A.H. 1967. A study of the strength of coal pillars. The Journal of The Southern African Institute of Mining and Metallurgy, vol. 68, no. 2, pp. 55–67. Available at: https://journals.co.za/doi/pdf/10.10520/AJA0038223X_3918
Van der Merwe, J.N., Mathey, M. 2013a. Update of the coal pillar strength formulae for South African coal using two methods of analysis. The Journal of The Southern African Institute of Mining and Metallurgy, vol. 113, pp. 841–847. Available at: https://www.scielo.org.za/pdf/jsaimm/v113n11/09.pdf
Van der Merwe, J.N., Mathey, M. 2013b. Probability of failure of South African coal pillars. The Journal of The Southern African Institute of Mining and Metallurgy, vol. 113, pp. 849–857. Available at: https://www.saimm.co.za/Journal/v113n11p849.pdf
Van der Merwe, J.N. 2016. A three-tier method of stability evaluation for coal mines in the Witbank and Highveld coalfields. The Southern African Institute of Mining and Metallurgy, vol. 116, pp. 1189–1194. Available at: https://www.scielo.org.za/pdf/jsaimm/v116n12/16.pdf
Van der Merwe, J.N. 2019. Coal pillar strength analysis based on size at the time of failure. The Southern African Institute of Mining and Metallurgy, vol. 119, pp. 681–692. Available at: https://scielo.org.za/pdf/jsaimm/v119n7/12.pdf u
Affiliation:
1 School of Materials and Metallurgy, University of Science and Technology Liaoning, PR China
Correspondence to:
B. Yang
Email: yang583766560@163.com
Dates:
Received: 2 Jul. 2025
Revised: Feb. 2026
Accepted: 7 Feb. 2026
Published: May 2026
How to cite:
Hao, M., Yin, Y., Yang, B., Wang, L. 2026. Quantitative impacts of induction heating power on refractory erosion and inclusion behaviour in tundishes. Journal of the Southern African Institute of Mining and Metallurgy, vol. 126, no. 5, pp. 297–308
DOI ID:
https://doi.org/10.17159/2411-9717/3762/2026
ORCiD:
M. Hao
https://orcid.org/0009-0002-0049-1615
Y. Yin
https://orcid.org/0009-0008-4784-3634
B. Yang
https://orcid.org/0000-0001-5987-5790
L. Wang
https://orcid.org/0009-0000-0017-4316
Quantitative impacts of induction heating power on refractory erosion and inclusion behaviour in tundishes
by M. Hao1, Y. Yin1, B. Yang1, L. Wang1
Abstract
This study established a coupled fluid-electromagnetic numerical model to systematically analyzse the effects of molten steel flow, inclusion transport, and temperature gradients on refractory erosion behaviour within an induction-heated tundish. The results demonstrate that increased induction heating power significantly exacerbates both flow-induced erosion and magneto-thermal corrosion of the refractory lining in the channel region. The erosion rate exhibits a linear increase with power, while the wear coefficient follows a power-law relationship. Concurrently, a higher power level intensifies the inclusion collision source term by a factor of ten, substantially promoting inclusion collision, growth, and removal (increasing the removal rate by 14.86%). However, this also leads to a 51.3% reduction in the outlet inclusion particle size. This research provides a quantitative basis for balancing metallurgical benefits (temperature control and improved steel cleanliness) with the longevity-oriented design of refractory linings.
Keywords induction-heated tundish, refractory erosion, inclusion removal, multi-physical field simulation
Introduction
The tundish is an essential buffer in the continuous casting process, linking ladles to molds. It is widely recognised that the flow characteristics of liquid steel in the tundish critically influence steel purity (Wei et al., 2012; Sheng, 2022; Zhao et al., 2021). To enhance flow dynamics and support the removal of inclusions, flow modification devices such as weirs, dams, and turbulence inhibitors are implemented to promote fluidity. Nonetheless, unsuitable superheat levels of the molten steel can adversely affect billet quality and the operation of casting machines, particularly in low superheat casting scenarios (Xing et al., 2018; Tang et al., 2021; Yong et al., 2020; Xin et al., 2014). Channel-type electromagnetic induction heating tundish (IHT) technology emerges as an innovative solution, enabling consistent-temperature pouring of low-superheat molten steel and facilitating the elimination of non-metallic inclusions (Ghojel, Ibrahim, 2004; Yang et al., 2022). With the continuous advancement in casting technologies and escalating steel quality standards, tundish electromagnetic induction heating technology is progressively evolving to meet these demands (Pan et al., 2022; Bao, Wang, 2021).
The channel-type induction heating tundish represents a novel advancement in the metallurgical field, designed to elevate the pouring temperature of metals, enhance fluidity, and concurrently remove inclusions. Based on electromagnetic induction principles, this technology utilises a tundish—a sizable vessel—to facilitate molten steel transfer and maintain thermal energy during continuous casting. Research predominantly explores the magnetic field characteristics, fluid dynamics, thermal transfer, and inclusion behaviour. Key attributes of the magnetic field include concentrated strength within the channel and an inherent asymmetry, while the flow field is characterised by the altered trajectories influenced by magnetic forces. Thermal dynamics hinge on Joule heating, and inclusion management benefits from heightened collision rates alongside an effective exclusion process. The system encompasses channel induction and plasma heating modalities. Compared to other methods, the channel-type induction heating approach offers superior heating efficiency, user-friendliness, minimal environmental footprint, economic advantages, and an enhancement in metal quality.
The complex dynamics of molten steel flow within a tundish, where an electromagnetic field generates heat, are known to induce significant wear on the refractory lining. Additionally, slag impregnation—which hinges on chemical composition and melting temperature—exacerbates this degradation (Blond et al., 2007; Lian et al., 2018; Rovnushkin et al., 2005). A deeper comprehension of refractory wear during the tundish casting process is crucial for extending the lining's service life. Practical experiments within an actual tundish offer the most direct method for investigating refractory
Quantitative impacts of induction heating power on refractory erosion and inclusion behaviour in tundishes
wear. However, measurement constraints and the intense conditions of the casting process often result in a lack of comprehensive data. It is particularly difficult to accurately assess the molten steel flow pattern, inclusion dynamics, electromagnetic heating, and the variations at the slag-steel interface. Such conditions also accentuate chemical corrosion from metallurgical melts, especially molten slag (Tang et al., 2021; Yong et al., 2020).
Erosion-corrosion synergy accelerates the deterioration of the tundish refractory liner, leading to the presence of exogenous inclusions that compromise the cleanliness of molten steel and the mechanical properties of the final steel product. Tundish refractory wall wear is a pivotal concern that affects sequence life. It has been established that this wear can result from thermal, chemical, or mechanical stresses (Crudu et al.,1998). Specifically, the flow of molten steel alone can cause erosion of the refractory lining, and this effect is amplified by the high temperature and turbulent conditions present, especially in the high-velocity zones near the inlet. Considering the refractory wear induced by magnetic fluid transport and wall shear stress, optimising tundish design can lead to improved sequence life by reducing the rate of refractory wall wear. Understanding the interplay of turbulent flow, heat transfer, and electromagnetic effects within the tundish is essential to mitigate damage to the refractory lining and enhance the purity of molten steel.
Research into the channel-type induction heating tundish has largely focused on the magnetic field, characterised by its closedloop current density, magnetic flux density distributed eccentrically along the circumference, and the asymmetric electromagnetic force across the channel's cross-section. The electromagnetic field within the channel results in an asymmetrical environment, creating rotational flows and vigorous stirring movements in the receiving and discharging chambers, which in turn impacts the temperature field, offering temperature compensation and promoting the removal of inclusions by affecting particle behaviour. Despite the consistent primary issues addressed, there has been limited exploration of certain adverse effects, such as slag-metal interactions, magneto-thermal erosion, and pinch effects. This study delves into the erosion phenomena, inclusion collision source terms, and inclusion behaviours within the tundish, varying the induction heating power. The aim is to assess the detrimental influences these factors may have on the continuous casting process during induction heating.
The article introduces an innovative approach by leveraging a multiphase coupling mathematical model to examine both the fluid dynamics and inclusion trajectories, as well as the temperature distribution within the tundish. This model also evaluates the erosion of the refractory lining triggered by the flow in real-life tundish refining processes, utilising established erosion models and a refractories wear rate factor. It examines the correlation between the average erosion rate, wear coefficient, wall shear stress, and the induction heating power. The k–ε turbulence model is employed to offer a precise depiction of the turbulent flow, and the model for inclusion concentration and mass accurately traces the path of inclusions within the tundish. Using the calculated wall shear stress and turbulence intensity, the model deduces the flow-induced erosion rate on the lining.
Physical description
Figure 1 illustrates the tundish as a hexahedral mesh representation,
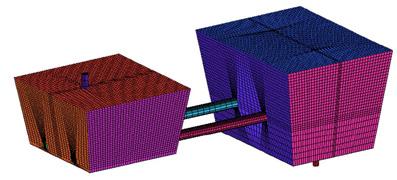
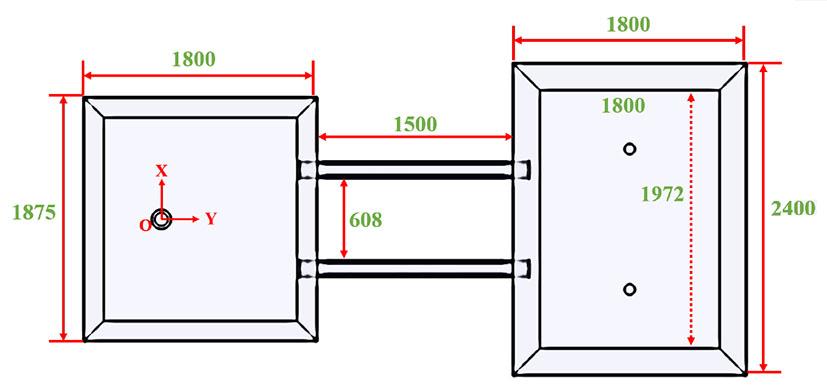
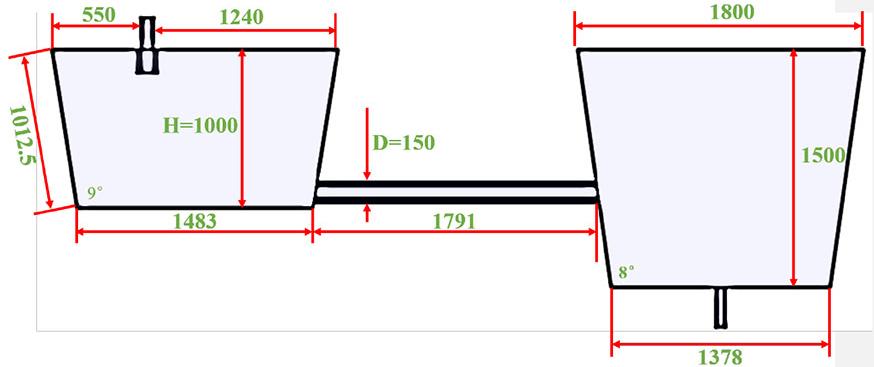
Table 1
The operating and geometry parameters of a tundish with channel type
Depth of receiving chamber
Depth of discharging chamber
mm
mm
Free surface size of receiving chamber 1800 mm × 1875 mm
Bottom size of receiving chamber 1558 mm × 1483 mm
Incline angle of chambers wall
Diameter of channel
mm
Length of channel 1791 mm
Free surface size of discharging chamber 1800 mm × 2400 mm
Bottom size of discharging chamber
×1378 mm
accompanied by its geometric shape parameters. Tables 1 and 2 detail the parameters of the physical model and the computational conditions employed. Induction heating technology is based on the principles of electromagnetic induction, where the field generator, positioned within the tundish, induces an electric current as the molten steel flows through the tundish channel. This induced current generates Joule heat, which is utilised to warm the molten steel.
(a) Mesh of tundish
(b) Overhead view
(c) Main view
Figure 1—Hexahedral tundish mesh and geometry geometric shape of tundish
Quantitative impacts of induction heating power on refractory erosion and inclusion behaviour in tundishes
Table 2
Calculated working conditions
Cases Induction heating power (kW)
Case1 No
Case2
A secondary circulation is established by the flow of the molten steel in the tundish and its channel. When the alternating current (AC) power supply feeds the coil with its power frequency, it creates alternating magnetic flux. According to Faraday's law of electromagnetic induction, this alternating magnetic flux induces an electromotive force (F) and Joule heat (Q) within the molten steel, forming a closed circuit.
Mathematical model description
Assumptions
To manage the complexity of inclusion transport and the electromagnetism fluid coupling processes in the tundish, the following simplifying assumptions were made within the model:
➤ The molten steel was treated as an incompressible Newtonian fluid with temperature-dependent density, ρf = 85230. 8358f , while its other properties were considered constant.
➤ Inclusions were modelled as spherical entities.
➤ Owing to their minimal volume fraction in the liquid steel, inclusions have an insignificant impact on the overall flow pattern.
➤ The trajectory of an inclusion is modelled as independent until it encounters and coalesces with another.
➤ The chemical corrosion of the refractory materials and the chemical dynamics within the tundish were not taken into account.
The following assumptions were adopted to simplify the model due to the complicated inclusion transport phenomena and electromagnetism fluid coupling processes involved in the tundish:
Fluid flow and heat transfer
To depict the turbulent flow, the continuity and time-averaged Navier-Stokes equations were used.
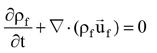
Where, ρf is the fluid density, f is the fluid velocity, ρref is a reference density, P is the pressure, is the gravitational accelerate, T is the temperature, Tref is a reference temperature, FE is the electromagnetic force, and μeff is the effective viscosity, which is defined as:
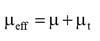
Where μ is the dynamic viscosity and μt is the turbulent viscosity.
Turbulent kinetic energy and rate of dissipation
The conventional k–ε turbulence model is employed in this paper. Equations 4 and 5 are the governing equations for turbulent kinetic energy and rate of dissipation:


[4] [5]
Where k is the turbulence kinetic energy, ε is the turbulent kinetic energy rate, σκ and σε represent the Schmidt number for κ and ε, Gκ is the generation rate of turbulence energy, where Cμ, Cε1, Cε2, σκ, σε are constants taken from Launder and Spalding.
Tracer convection-diffusion equation
To investigate the characteristics of fluid flow within a twochannel tundish, a residence time distribution (RTD) curve is generated (Yang et al., 2020). Additionally, the convection-diffusion mechanism is applied to model the transmission of tracer particles within the molten steel, as depicted in Equation 6. [6]
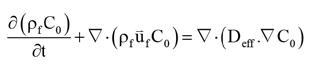
Where C0 is the tracer concentration and Deff is the effective kinematic diffusivity.
Thermal energy equation
The energy conservation equation should be considered as thermocouple heating (σJ2) in the case of channel type induction heating, which is as follows:
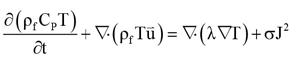
[7]
Where λ is the effective thermal conductivity, Cp is the heat capacity, and σ is the electrical conductivity of molten steel.
Model of inclusion collision-coalescence
Here, we propose a mathematical model that integrates the inclusion population balance with the population conservation model to describe the spatial distribution of inclusions, employing principles of mass conservation and population conservation (Lei et al., 2019).


The rate of inclusion generation per unit volume, represented by SN, can be positive or negative, reflecting the formation of new inclusions or the removal of existing ones. Changes in the inclusion population due to coalescence can be expressed as:

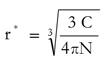
Quantitative impacts of induction heating power on refractory erosion and inclusion behaviour in tundishes
Where SN is the collision-coalescence source term, r* is the characteristic inclusion radius, C is the inclusion volume concentration slipping velocity and N is the inclusion number density slipping velocity, C is the inclusion volume concentration, N is the inclusion number density, and μ1 is the kinematic viscosity.
Erosion and corrosion model
Both physical and chemical erosion contribute to the degradation of the refractory liner. Physical erosion results from the movement of molten steel, while chemical corrosion ensues from hightemperature molten slag and magneto-caloric effects. Consequently, the overall wear rate is the cumulative total of erosion and corrosion rates. In this study, the erosion of the refractory liner is considered as a form of plasticity erosion, where the relative motion between the molten steel and the refractory liner generates shearing stress. Therefore, shearing stress combined with turbulence intensity could serve as predictors for estimating the rate of refractory lining erosion (Huang et al., 2013; Wang et al., 2020):
[12]
turbulent kinetic energy at point p to the wall, k is the von Kármán constant (= 0.4187), and E is the empirical constant (= 9.793) (Singh et al., 2008).
Boundary conditions
The following boundary conditions in the tundish must be quantitatively calculated (Wang et al., 2014):
(1) At the slag surface, the normal derivatives of all variables are zero.
(2) On the tundish walls, the no-slip condition and standard wall functions are enforced, with a specified flux for non-isothermal analysis, detailed in Table 3.
(3) Employing a steady-state flow field, the inclusion collisioncoalescence equation and the transient tracer advectiondiffusion equation were solved to determine the inclusion concentration field and the residence time distribution (RTD) curve, respectively.
Where, Hst is the erosion rate of molten steel, mm/h; τ is the shearing stress, Pa, and I is the turbulence intensity.
Refractories wear factor
A refractory wear model based on instrument wear testing was developed to forecast the wear of refractory materials in metallurgical containers. The wear rate coefficient, w, was calculated as follows (Zhang et al., 2010):
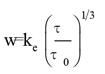
Where, ke is the effective mass transfer parameter determined by the reaction between the refractories and the molten steel. The refractory dissolving rate in molten steel can be measured to determine ke. It can be stated as a formula (Zhang et al., 2010):
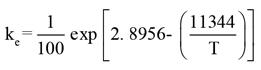
(4) The transfer of inclusions within molten steel occurs predominantly through diffusion and convection, allowing the expression of inclusion flux at the tundish boundaries (top slag, bottom wall, inclined wall, and channel wall) in terms of convection and diffusion flux (Lei et al., 2019).
The boundary conditions of flow, heat transfer, particle motion field, of which some details are shown in the Table 3, and others have been described in the paper (Lei et al., 2019; Yang et al., 2018; Yang et al., 2022; Wang et al., 2014; Yang et al., 2018).
Numerical method
[13]
[14]
Where, τ is shear stress at steel-refractory interface in the tundish and τ0 is reference shear stress. Furthermore, τ0 can be discovered through experimentation and depends on the structure and content of the refractory. The factor of refractories wear, w0, was defined in Equation 15, in order to investigate the impact of campaign conditions on the refractories wear:
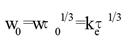
[15]
The W0 is a function of temperature and shear stress at steelrefractory interface. So, w0 solely refers to the campaign condition of refractories and has nothing to do with the type of refractories. The distribution of w0 in the tundish can help with refractory material selection.
Wall shear stress
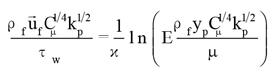
[16]
Where, uf is the mean velocity at the cell center adjacent to the wall, yp is the distance from point p (adjacent to wall) to the wall, kp is the
A three-dimensional structured hexahedral mesh with 300,000 cells is used for numerical simulations, and grid independence is confirmed as described by (Yang et al., 2018). Computational fluid dynamics (CFD) simulations commence with the discretisation of governing equations using the CFX software to calculate the steady flow field. The transport equations are discretised via a second-order upwind scheme to yield an initial solution. The semi-implicit method for pressure-linked equations (SIMPLE) algorithm addresses pressure-velocity coupling and body forces in the momentum equation. The standard k-ε turbulence model,
Table 3
Physical parameters and boundary conditions
Parameter
Free surface heat loss
Value
8000 (W/m2)
Bottom /wide/ narrow wall heat loss 4000 (W/m2)
Channel wall heat loss 1800 (W/m2)
Thermal conductivity of molten steel 41 (W/(m.K))
Heat capacity of l molten steel 750 (J/(kg.K))
Inlet temperature 1800 (K)
Density of molten steel (8523-0.8358T) (kg/m3)
Coefficient of thermal expansion of molten steel 0.0001 (1/K)
Viscosity of the molten steel 0.0061 (kg/(m.s))
Inlet temperature 1800 (K)
Initial inclusion volume concentration 300 ppm
Initial inclusion number density 2.65 × 10¹¹(1/m3)
Quantitative impacts of induction heating power on refractory erosion and inclusion behaviour in tundishes
combined with a second-order upwind method, models turbulence effects. Subsequent to establishing the steady-state flow field, the equations for inclusion collision-coalescence and transport are solved, tracing each inclusion's path through the flow field. Convergence is achieved when the sum of all normalised residuals for all physical variables falls below 10-6
Results and discussions
To elucidate the roles of flow erosion and magnetocaloric hightemperature erosion on refractory wall wear, simulations were conducted under a variety of conditions. The influence of the magnetic field on flow patterns dramatically varies, yielding a consistent erosion pattern on the refractory walls. Additionally, higher induction heating power correlates with increased thermal effects and consequently, more significant thermal deterioration of the refractory material. Thus, erosion, refractory wear coefficients, temperature profiles, and inclusion distributions within the induction-heated tundish are numerically forecasted across four distinct operational scenarios, as validated by (Lei et al., 2019; Yang et al., 2018; Yang et al., 2022; Yang et al., 2018).
Erosion patterns and wear coefficient distribution of refractory materials
Wall erosion in the tundish, induced by flow dynamics and channel effects, prioritises assessing the global zone where core areas impact the metallurgical vessel's lifespan. Figure 2 illustrates the rates of tundish lining wear across four operational conditions. In the absence of induction heating, the highest erosion rate occurs beneath the long nozzle at 1.172 × 10⁻² mm/h and spreads circularly, diminishing from centre to periphery. This pattern ensues from high-velocity flows striking the central zone, where the intense impact translates into significant erosion at the base of the casting package. Such peak erosion exacerbates damage to the tundish refractory material.
An additional region depicted in the image distinctly presents
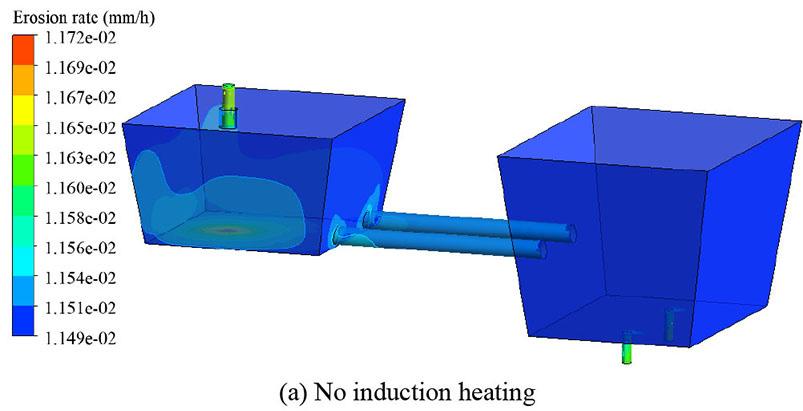
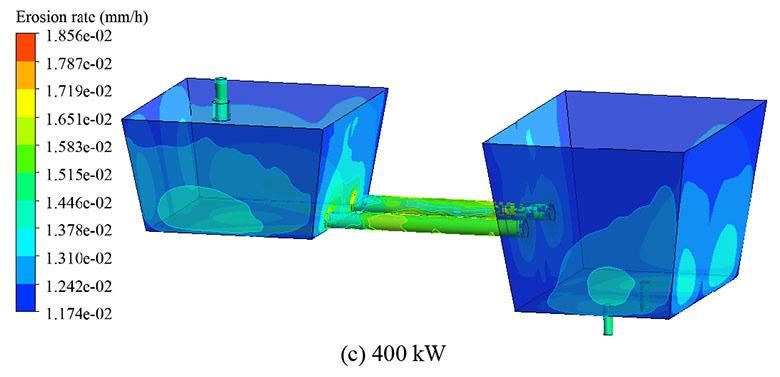
the erosion rate at the junction between the channel and the receiving chamber. Due to its strategic positioning, substantial fluid influx into the channel renders erosion at this intersection inevitable. Erosion across the other tundish refractory linings is relatively uniform, with rates generally hovering between 1.149 × 10⁻² mm/h to 1.154 × 10⁻² mm/h. Concurrently, the channel lining exhibits a marginally accelerated rate of degradation compared to the tundish's sloped wall.
With the induction heating power set to 100 kW, the erosion rate and area affected by flow dynamics undergo significant alterations. Despite the erosion pattern below the long nozzle remaining largely unchanged, its intensity varies due to the electromagnetic forces at play. The peak erosion rate climbs to 1.1348 × 10⁻² mm/h, owing to the enhanced agitation and concentration of the molten steel flow from the long nozzle impacting the bottom surface. This results in notably accelerated wear on the tundish's inclined wall refractory.
The addition of a magnetic field refines the fluid mixing within the tundish, inevitably leading to substantial variations in the wall lining erosion profile. With induction heating, the erosion rate rises from 1.151 × 10⁻² mm/h to a range of 1.155 × 10⁻² mm/h to 1.213 × 10⁻² mm/h. The most pronounced increase is observed at the receiving chamber wall and its interface, where the erosion rate stabilises between 1.232 × 10⁻² mm/h and 1.290 × 10⁻² mm/h. There is a marked escalation in both the erosion rate and the extent of damage at this interface.
In the double-channel region, the swirling flow of the molten steel predominantly dictates the channel lining's erosion. It is notable that the erosion rate at the juncture of the receiving chamber and the channel vastly exceeds that at the discharge chamber's outlet interface. This is attributed to the former being in a dynamic inflow state, subject to continuous fluid impact, in contrast to the latter, which, being in an outflow state, does not sustain direct impactful forces.
Elevating the induction heating power to 400 kW does not shift
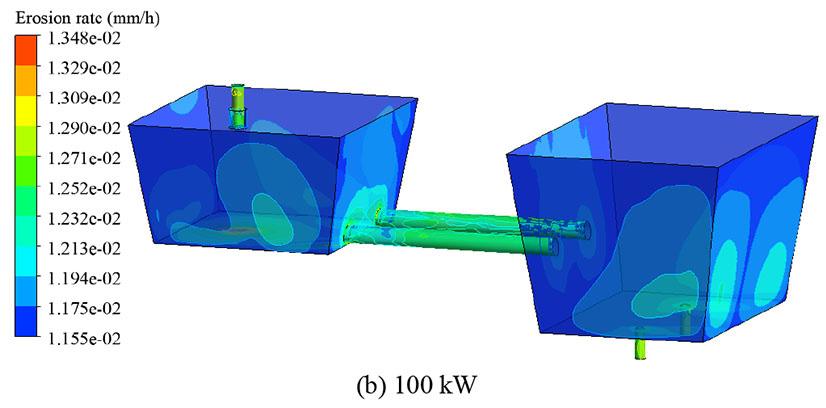
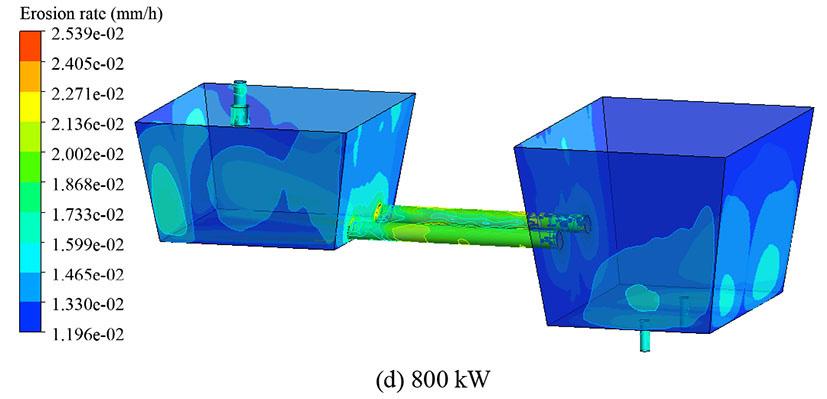
Figure 2—Distribution of flow-induced erosion rate on the refractory lining inner wall
Quantitative impacts of induction heating power on refractory erosion and inclusion behaviour in tundishes
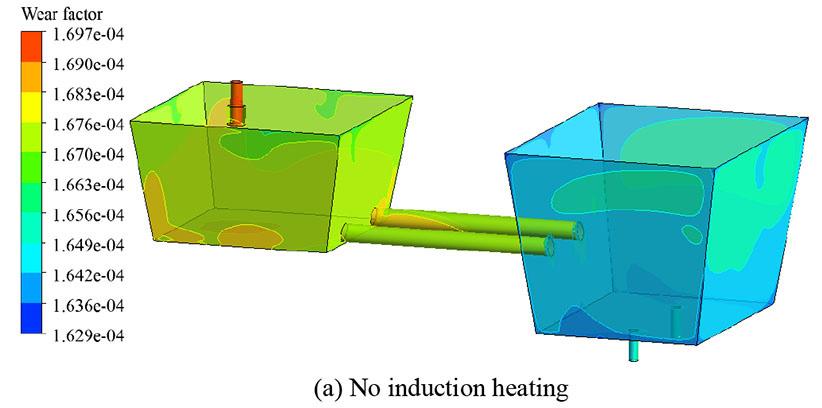
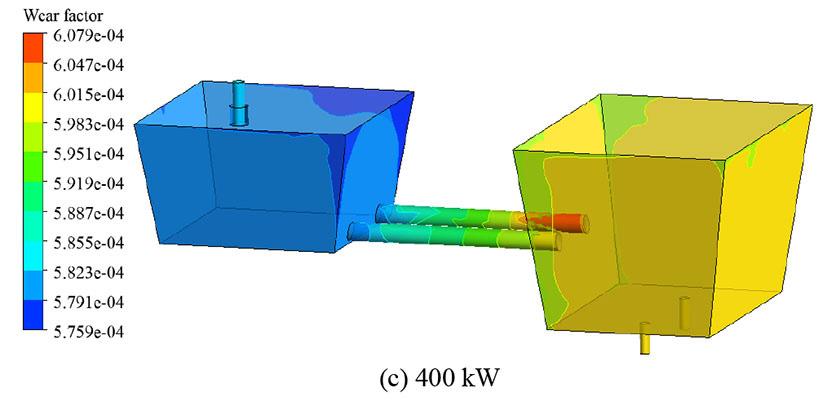
the underlying erosion pattern of the tundish receiving chamber's bottom lining, yet the gradient of the erosion rate diminishes. This attenuation is primarily a consequence of the intensified electromagnetic force, which substantially modifies the molten steel's flow characteristics. Conversely, the erosion expanse of the discharging chamber’s bottom lining experiences a prominent expansion. This phenomenon can be attributed to the vigorous and homogenous mixing of molten steel within the discharging chamber, combined with the steel’s unidirectional egress through the outlet, continuously impacting the lining below.
As the induction heating power is ramped up, there is a corresponding gradual climb in the erosion rate of the channel lining, with figures consistently ranging between 1.446×10⁻² mm/h to 1.651×10⁻² mm/h. Similarly, the erosion rate of the inclined wall lining exhibits an upward trend, typically maintaining within the bounds of 1.174 ×10⁻² mm/h to 1.378×10⁻² mm/h.
Upon increasing the induction heating power to 800 kW, the erosion pattern at the bottom of the receiving chamber undergoes a marked transformation. The once circumferential gradient distribution is replaced by two symmetrical erosion surfaces, illustrating a direct correlation: the stronger the electromagnetic force, the more distinct the deviation in flow patterns and subsequent erosion impact. Meanwhile, the fundamental distribution shape of the discharging chamber's bottom lining remains unaltered, aside from variations in erosion rate. The channel lining's erosion rate consistently lies between 1.733 × 10⁻² mm/h to 2.136 × 10⁻² mm/h, while the inclined wall lining's rate is generally sustained between 1.196 × 10⁻² mm/h to 1.733 × 10⁻² mm/h.
Drawing from the preceding analysis, it is clear that an increase in induction heating power correlates with intensified erosion of the tundish lining, notably within the channel lining. While significant induction heating power does promote the homogenisation of molten steel – enhancing the heat transfer process and facilitating the agglomeration and removal of inclusions – it simultaneously precipitates vigorous erosion of the lining. Consequently,
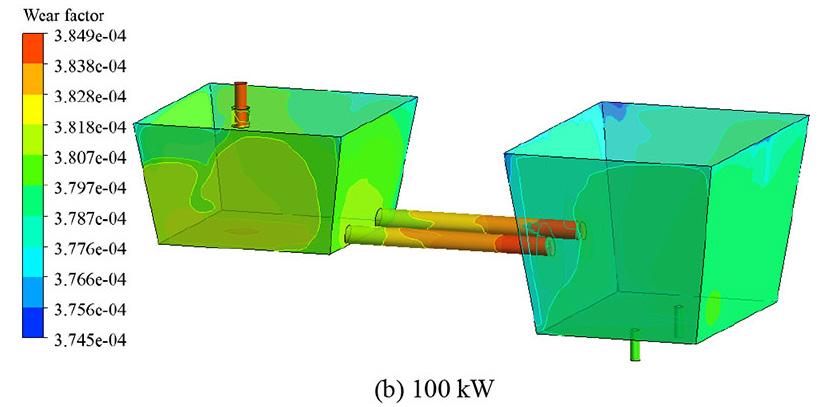
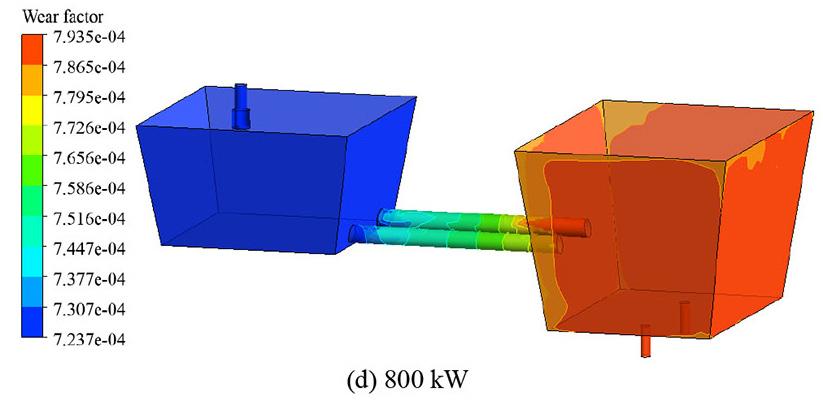
heightened erosion rates within the working zone of the lining merit focused consideration during the optimisation and design of the tundish's working lining.
Figure 3 demonstrates the wear coefficient distribution of tundish liner refractory materials under four different operational scenarios. It is evident that the wear coefficient of the refractory material escalates with the increase in induction heating power. In the absence of induction heating, the wear coefficient of refractories in the receiving chamber is considerably higher compared to that in the distribution chamber. However, with ramped-up induction heating power, the distribution chamber's refractories begin to exhibit a higher wear coefficient than those in the receiving chamber. This trend is largely attributed to the direct proportionality between the wear coefficient of refractory materials and temperature, indicating that the wear coefficient surges with rising temperatures. Notably, the peak wear coefficient of refractory materials is primarily concentrated at the channel exit due to the highest temperature and maximum Joule heat presence. The wear coefficient of refractory materials in the tundish shows a progressive increase from 1.6 × 10⁻⁴ to 3.8 × 10⁻⁴, then to 5.9 × 10⁻⁴, and finally to 7.5 × 10⁻⁴ with the induction heating power escalating from none to 800 kW.
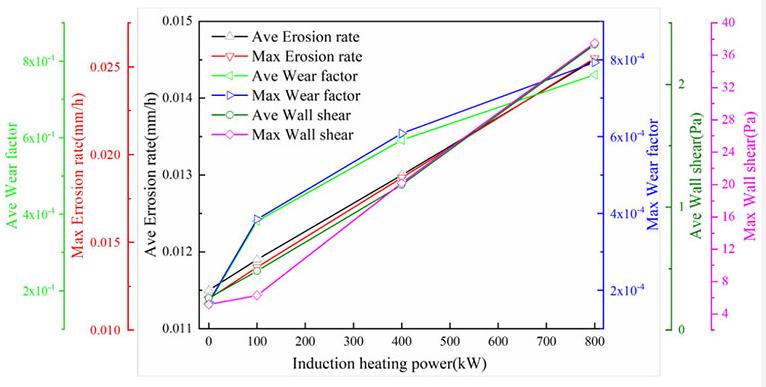
Figure 3—Refractories wear factor distribution caused by magnetocaloric induction on the inner wall of the refractory lining
Figure 4—The characteristic of erosion rate, wear factor, and wall shear
Quantitative impacts of induction heating power on refractory erosion and inclusion behaviour in tundishes
Table 4
Mathematical models of physical parameters vs. power
Physical parameter Fitting formula Correlation
Avg. Erosion Rate (mm/h) Eave = 0.01151 + 3.735 × 10-⁶P
Avg. wear coeff. (×10-⁴) Wave = 7.966 × 10-⁵P
Avg. wall shear stress (Pa)
Save = 0.2475 + 0.00217P + 7.95 × 10-⁸P2 + 5.0×10⁻¹⁰P3
Hence, by understanding the distribution pattern of refractory material wear coefficients, it becomes possible to anticipate the areas or specific locations that will necessitate the use of refractories with superior wear resistance.
Figure 4 and Table 4 illustrate the progression of the erosion rate, wear coefficient, wall shear stress, and power, with maximum and average values of these three physical attributes depicted. Figure 4 indicates that these quantities exhibit an upswing as power intensifies. There is a direct correlation between the average and maximum erosion rates and average wall shear stress with power; while the other three physical properties demonstrate a nonlinear association with power, they exhibit highly predictable trends of variation. The average and maximum wear coefficients change in a nearly identical way, maintaining the same magnitude order, predominantly because the wear coefficient is primarily influenced by fluctuations in temperature.
Analysing the trends in the curves presented in Figure 4, particularly within the average physical fields, allows for the fitting of functional relationships. The correlation between the average erosion rate and power is given by Eave = 0.01151 + 3.735 × 10-⁶P. The relationship between the average wear coefficient and power is modeled by Wave = 7.966 × 10-⁵P0.33676, and the link between average wall shear stress and power is captured by Save = 0.2475 + 0.00217P + 7.95 × 10-⁸P2 + 5.0 × 10⁻¹⁰P3. Utilising these mathematical models, the erosion rate, wear coefficient, and wall shear stress within an induction heating tundish can be accurately predicted and assessed.
Table 5
Consequently, this aids in effectively pinpointing the location and degree of refractory material damage within the reactor.
The data shows that the erosion rate follows a linear growth pattern (increase of 0.00037 mm/h for every 100 kW increase), and the wear coefficient follows a power law W P⁰ 33⁶⁷⁶, reflecting the nonlinear temperature rise effect. For shear stress, it is necessary to warn of the risks carried by high-power turbulence mutations.
Table 5 shows the power-erosion-wear impact, it reveals the main core rule that although power increase improves the metallurgical process, it leads to a linear increase in erosion rate (+ 26%), and a power law increase in wear coefficient (+369%), providing a quantitative decision-making basis for the long life design of the tundish.
Variation characteristics of inclusion number density source term
During the smelting and refining process, chemical reactions lead to the creation and removal of inclusions, a dynamic captured by the volume source term Sc in the Equation 8 for inclusion mass conservation. Conversely, the fluctuation in inclusion count, driven by phenomena such as collisions and agglomeration, is articulated through the number density source term SN in the inclusion quantity conservation Equation 10. In our computational simulations, the secondary oxidation of molten steel is disregarded, thus Sc is set to zero. Yet, while inclusion coalescence and breakage alter their number, the aggregate mass of inclusions remains unchanged. The source term for inclusion number density, SN, is essentially composed of two parts: SN = Sturb + SStokes. By examining the spatial distribution of the source term, one can trace the shifting tendencies and governing patterns of inclusion number density within the reactor, which in turn facilitates industrial predictions, theoretical refinements, and technical enhancements of the refining process.
Figure 5 and Table 6 present the spatial distribution of the contribution of Stokes collisions to the inclusion number density source term. Insights gleaned from Figure 5 are as follows: (1) The collision source term demonstrates its most significant impact at the entrance, diminishing progressively with the outward flow of the liquid steel.
Quantitative impacts of induction heating power on refractory erosion and inclusion behaviour in tundishes
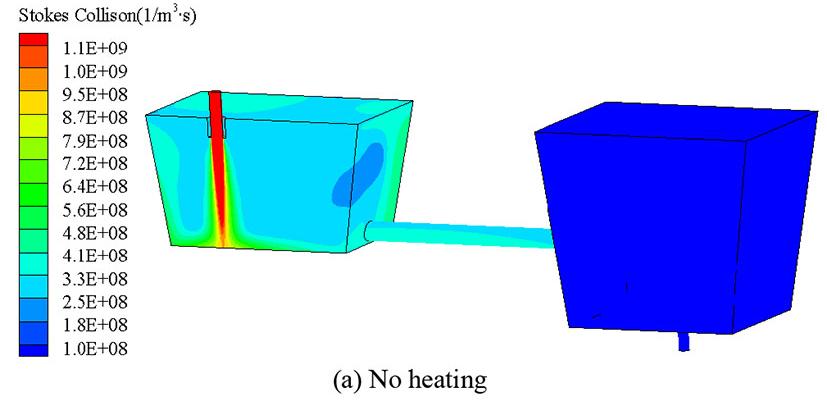
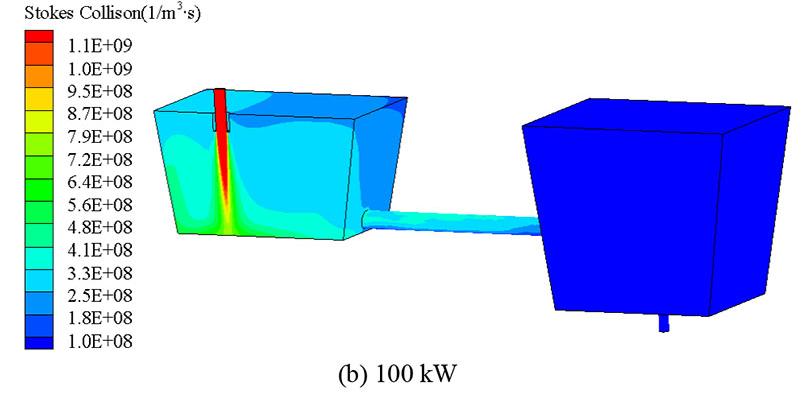
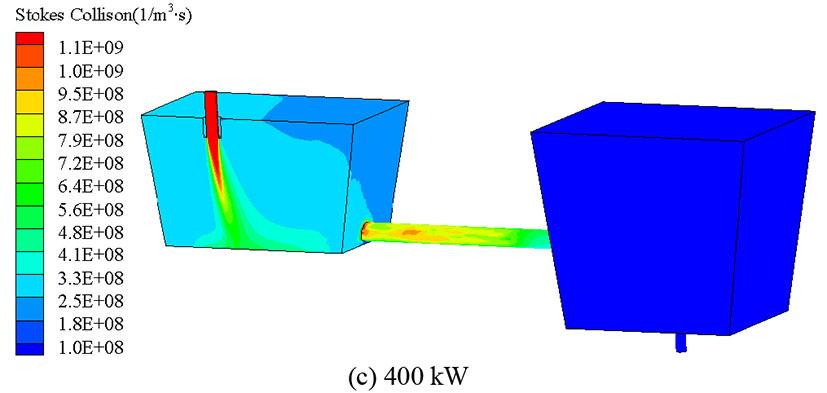
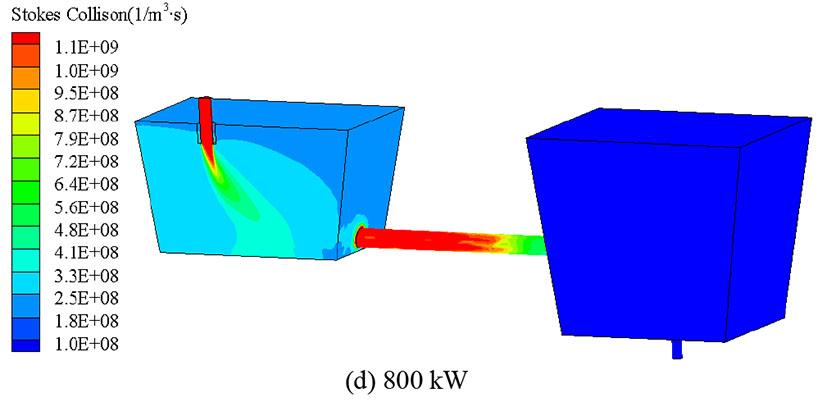
Stokes collision source distribution features
Variation pattern
Inlet zone Peak area Distribution shift Enhanced shift Significant shift EM force alters steel flow direction
(0→800 kW)
Chamber + Channel >95% total contribution >95% >95% >95% Core collision zone (dominant)
Distributor
Channel outlet
Collision drop zone
Collision drop
(2) With an uptick in heating power, there is a noticeable shift in the distribution of the collision source term's contribution at the inlet. This shift occurs because increased power intensifies the electromagnetic stirring force, altering the flow trajectory of steel from the inlet towards the bottom, such that it is no longer strictly perpendicular.
(3) In the absence of induction heating, the contribution gradient of the inclusion number density collision source term in the channel remains modest, hovering between 3.3 × 10⁸(1/m3.s) and 4.1 × 10⁸ (1/m3.s). However, upon the application of induction heating, as the heating power surges from 100 kW to 800 kW, the contribution of this collision source term escalates dramatically from 3.3 × 10⁸ (1/m3.s) to 1.1 × 10⁹ (1/m3.s), signifying a substantial tenfold increase.
(4) The receiving chamber and the channel together constitute over 95% of the Stokes collision contribution concerning inclusions within the tundish. The collision contribution within the distribution chamber largely stabilizes at 1 × 10⁸ (1/m3.s), underscoring the discharging chamber and channel as pivotal zones for Stokes collisions. This is primarily due to the drastic
Stable low (velocity drop reduces collision)
Collision drop Collision drop Rapid velocity decrease lowers collision probability
reduction in velocity of molten steel as it exits the channel outlet, resulting in a marked decrease in the collision source contribution.
(5) An increase in heating power corresponds to a higher contribution from the Stokes collision density source term in the channel. This is largely attributable to the augmented pinch force exerted on the molten steel within the channel, which intensifies in tandem with the rising electromagnetic force.
Figure 6 and Table 7 show the spatial distribution and feature of the contribution of turbulent collision to the inclusion number density source term. It can be seen that its distribution is significantly different from the spatial distribution of the Stokes collision contribution to the inclusion number density source term. Its characteristics are as follows:
(1) The magnitude of the source term of the inclusion number density caused by turbulent collision is basically maintained at 1 × 10⁶~3 × 10⁸ (1/m3.s), which is significantly smaller than the contribution of the Stokes collision source term.
(2) As the induction heating increases, the contribution of the
Figure 5—The spatial distribution of Stokes collision source terms
Table 6
Quantitative impacts of induction heating power on refractory erosion and inclusion behaviour in tundishes
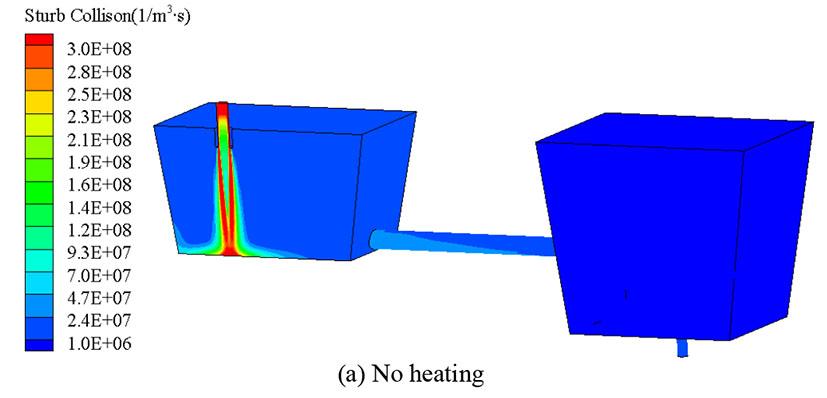
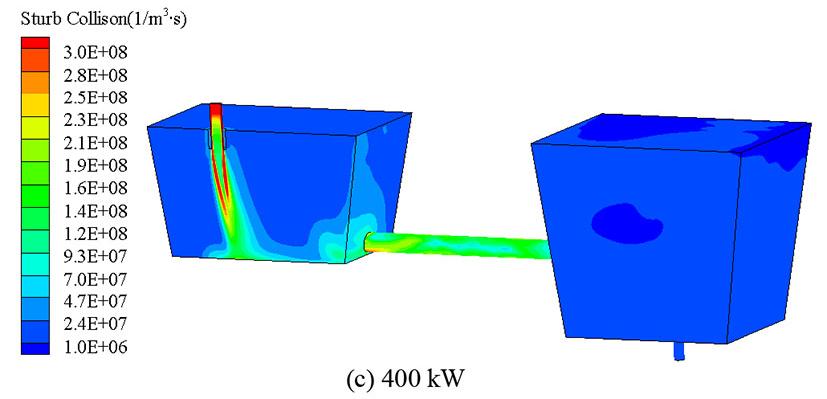
Table 7
Turbulent collision source distribution features
Parameter Value range (1/m³ s) Power impact
Overall magnitude 1 × 10⁶~3 × 10⁸ Increases with power
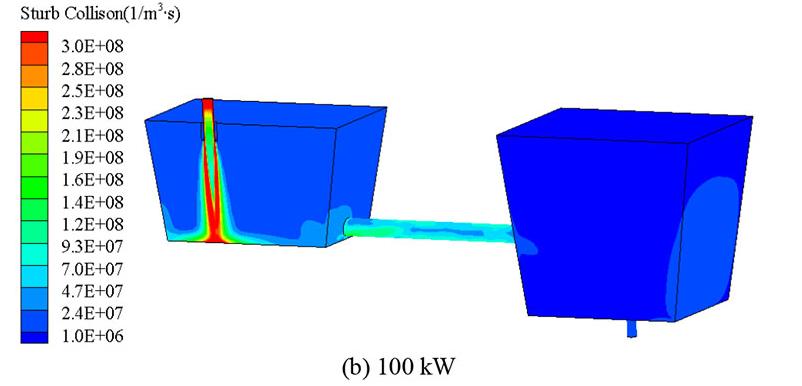
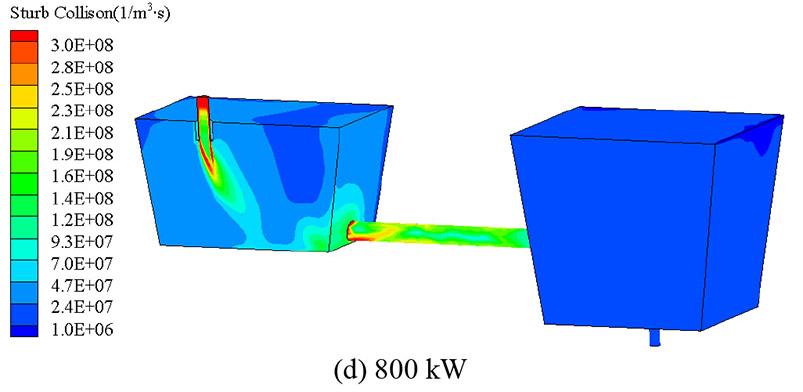
Spatial feature vs. Stokes collision
Distribution differs from Stokes 1-2 orders lower
Channel zone 1 × 10⁶~3 × 10⁸ Significant increase (turbulent kinetic energy ) EM force boosts turbulence Lower sensitivity than Stokes
Vertical inlet Peak zone Large EM-induced deflection Steepest gradient change Consistent trend with Stokes
Other regions Low-value zone Minor increase Relatively uniform distribution Similar contribution magnitude
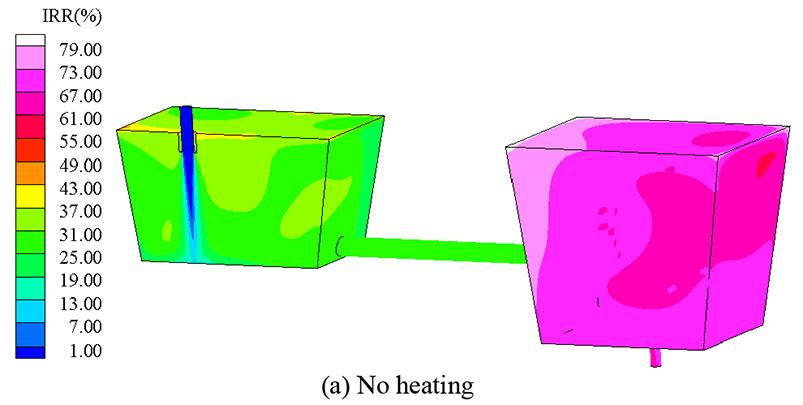
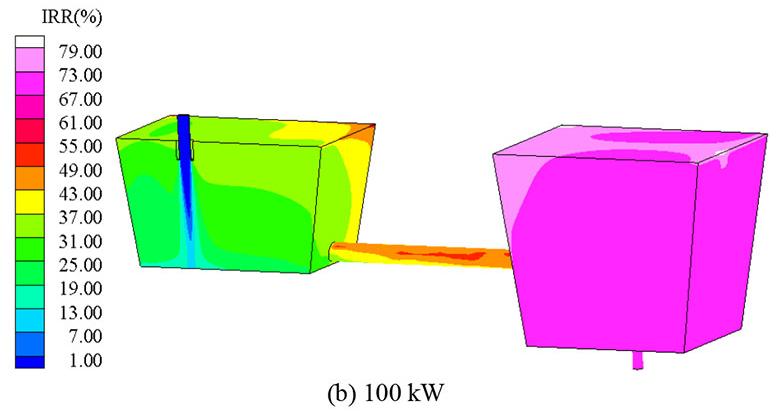
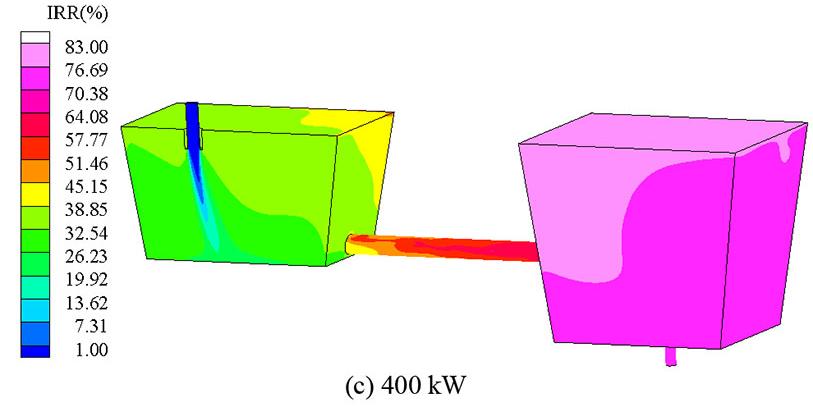
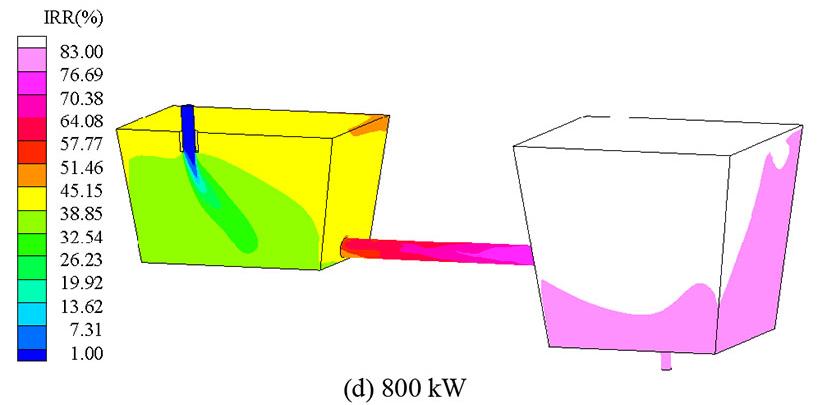
Figure 6—The spatial distribution of turbulent collision source terms
Figure 7—Spatial distribution of inclusion removal rates
Quantitative impacts of induction heating power on refractory erosion and inclusion behaviour in tundishes
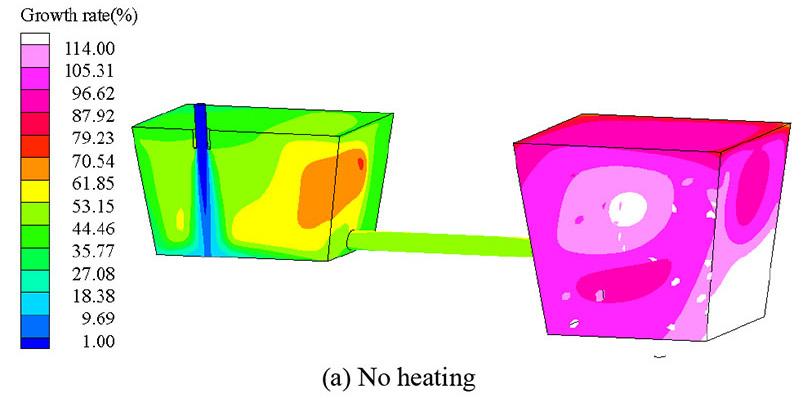
collision source term at the channel increases significantly. This is because the electromagnetic force significantly increases the turbulent kinetic energy in the channel. Collision source terms in other areas will also increase, but the increase is relatively small.
(3) The collision in the vertical direction of the entrance is the most obvious, and the gradient change is also the largest. Its change is consistent with the Stokes collision source term. It is affected by the electromagnetic force and undergoes a large deflection. In summary, induction heating can effectively increase the contribution of collision to the source term of inclusion number density, and the greater the power, the greater the contribution, which means that the collision rate of inclusions is accelerated, the particle size change gradient is large, and inclusion removal will also be improved.
Spatial distribution characteristics of inclusion field features
Figure 7 depicts the spatial distribution of the characteristic inclusion removal rates in the midsection under four operational scenarios. In the absence of induction heating, the inclusion removal rate in the receiving chamber stabilises at around 25%. As the fluid traverses the channel, this rate remains largely constant, illustrating that without induction heating, the channel's role in inclusion removal is minimal, functioning primarily as a conduit for fluid flow. Upon entering the discharging chamber, the removal rate ascends to approximately 70%.
When the induction heating power reaches 100 kW, there is a marked shift in the gradient of the inclusion removal rate within the receiving chamber, particularly at the corners near the slag surface; here, the rate peaks at 50%, with the removal at the slag surface substantially surpassing that of its inner regions. Compared to the scenario without induction heating, the inclusion removal rate within the channel has notably increased, and the gradient variation in the discharging chamber has lessened. This is attributed to the electromagnetic force's influence, where the majority of inclusions are eliminated within the receiving chamber and channel, thereby diminishing the inclusion removal in the discharging chamber and
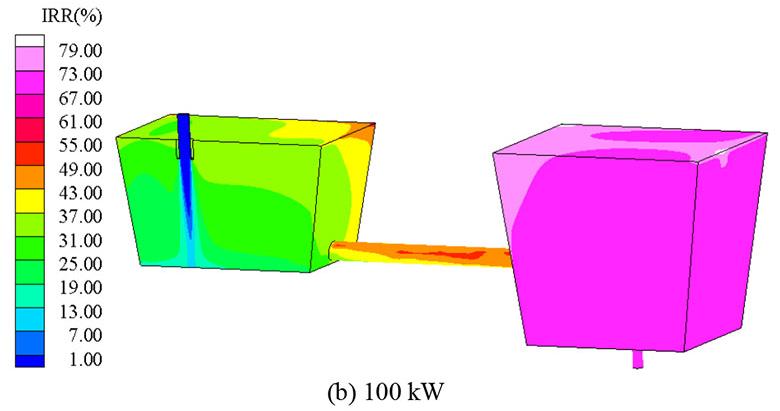
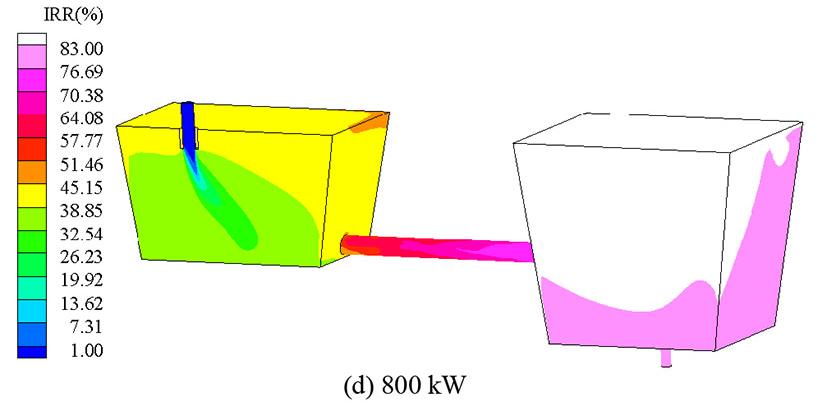
reducing its capacity for removal.
With induction heating powers set at 400 kW and 800 kW, the inclusion removal rates in the discharging chamber surge to 40%, representing a significant enhancement, while the channel’s removal rate climbs to 60%. Furthermore, there is an upturn in the gradient of the inclusion removal rate within the channel. As for the distribution chamber, the removal rate is consistently maintained at around 80%, with a more subdued gradient in the inclusion removal rate.
Figure 8 illustrates the spatial distribution of inclusion growth rates within the tundish across four operational conditions. In the absence of induction heating, the growth rate intensifies progressively from the receiving to the discharging chamber, with inclusion particle size reaching its maximum in the discharging chamber. As induction heating power increases from 100 kW to 800 kW, the total inclusion growth rate decreases markedly from 76% to 28%, and specifically within the discharging chamber, the rate descends from 70% to 20%, with a concomitant decline in the gradient. This pattern indicates that a higher induction heating power correlates with an expedited removal of inclusions, leading to a significant reduction of large-sized inclusions before their transit into the discharging chamber.
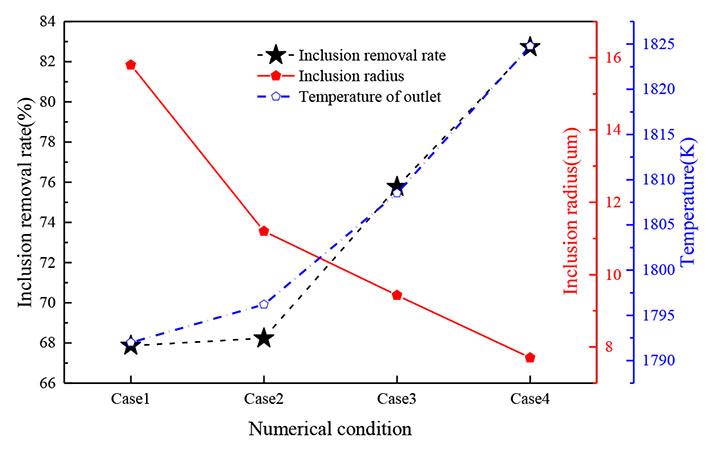
Figure 8—Spatial distribution of inclusion growth rate
Figure 9—Multiple physics of tundish outlet
Quantitative impacts of induction heating power on refractory erosion and inclusion behaviour in tundishes
Table 8
Power-driven refining efficiency enhancement


Figure 9 presents the variations in inclusion removal rate, radius, and temperature correlating with power at the tundish outlet across four distinct operational scenarios. With the sole exception of the state without induction heating, there exists a linear relationship function that ties together the inclusion removal rate, inclusion radius, outlet temperature, and the power of induction heating. This linear function provides a reliable prediction of the physical field for a specific magnitude. The inclusion removal rates for the four respective conditions are 67.87%, 68.23%, 75.77%, and 82.73%. As indicated, the impact of low power on enhancing inclusion removal is negligible, with a mere 0.36% increase in removal rate when escalating from the absence of induction heating to 100 kW. The liquid steel temperatures at the outlets for these conditions are 1792 K, 1796.2 K, 1808.5 K, and 1824.8 K. Notably, at 100 kW, the outlet temperature remains 3.8 K lower than the inlet. This provides a reference for the apt selection of induction heating power corresponding to diverse operational scenarios. Inclusion particle sizes at the tundish exit under these conditions measure at 15.8 um, 11.2 um, 9.43 um, and 7.7 um, demonstrating that the electromagnetic field effectively reduces the inclusion particle size in the continuous casting billet.
The inclusion particle sizes measured at the tundish outlet across the four operational states are 15.8 µm, 11.2 µm, 9.43 µm, and 7.7 µm, respectively. This trend signifies the effectiveness of the electromagnetic field in reducing inclusion particle sizes within the continuous casting billet.
Table 8 shows that EM forces achieve synergistic refining via collision efficiency (Sec. 4.2) and flow optimisation, realising "removal + size ". Peak efficiency is at 800 kW. Furthermore, 400 kW is the efficiency tipping point for cost-effective refining and 800 kW maximises quality (removal rate , size ) but intensifies refractory erosion. Particle size control dominates low-power stages, while removal rate drives high-power benefits.


Conclusion
(1) An increase of 100 kW in induction heating power linearly raises the average erosion rate by 0.00037 mm/h. The channel lining experiences the most severe erosion, reaching 2.136 × 10-² mm/h at 800 kW.
(2) The refractory wear coefficient follows a power-law relationship with power (W P⁰ 33⁶⁷⁶), attaining 7.5 × 10-⁴ at 800 kW—a 369% increase versus no-heating conditions.
(3) At high power (800 kW), the Stokes collision source term intensity in the channel surges to 1.1 × 10⁹ m-³ s-¹, marking a 233% increase compared to unheated operations and accelerating
Significant size distribution optimisation
Revolutionary refining enhancement
Full optimisation: removal + size + temp. control
inclusion agglomeration.
(4) At 800 kW, the inclusion removal rate rises to 82.73% with a reduced outlet average particle size of 7.7 μm. Notably, 400 kW represents the cost-effective tipping point (removal rate: 75.77%).
(5) While high power improves steel cleanliness and temperature homogeneity, it intensifies refractory erosion. This necessitates balancing strategies such as local reinforcement (e.g., SiC composites at channel exits) or flow-field optimisation.
Acknowledgement
We thank the Fundamental Research Funds for the Liaoning Universities (LJ212410146002) and the University of Science Technology of Liaoning United Fund (HGSKL-USTLN(2022)07), Project supported by the Natural Science Foundation of Liaoning Province, China (Grant No.2024-BS-219), and the National Natural Science Foundation of China (Grant NO.NSFC52074151) as well as the Education Department Project of Liaoning Province (Grant NO.2020LNJC03), and the Department of Science & Technology of Liaoning Province (Grant NO.2022JH2/101300079) for the financial support of the current work.
Conflict of interest
The authors declare no conflict of interest.
References
Bao, Y.P., Wang, M. 2021. Development trend of tundish metallurgical technology. Continuous Casting, vol. 40, no. 5. pp. 2–11.
Blond, E., Schmitt, N., Hild, F., Blumenfeld, P., Poirier, J. 2007. Effect of slag impregnation on thermal degradations in refractories Journal of the American Ceramic Society, vol. 90. pp. 154–161.
Crudu, I., Ionescu, M.P., Munteanu, V., Sandu, I.F., Nedelcu, P. 1998. A tribosystemic approach to refractory lining destruction in blast furnaces. Wear, vol. 216, no. 2. pp. 251–261.
Ghojel, J.I., Ibrahim, R.N. 2004. Computer simulation of the thermal regime of double loop channel induction furnaces. Journal of Materials Processing Technology, vol. 153–154. pp. 386–391.
Huang, A.O., Gu, H., Zhang, M., et al. 2013. Mathematical Modeling on Erosion Characteristics of Refining Ladle Lining with Application of Purging Plug. Metallurgical and Materials Transactions B, vol. 44, no. 3. pp. 744–749.
Quantitative impacts of induction heating power on refractory erosion and inclusion behaviour in tundishes
Lei, H., Yang, B., BI, Q., Xiao, Y.Y., Chen, S.F., Ding, C.Y. 2019. Numerical simulation of collision coalescence and removal of inclusion in tundish with channel type induction heating. ISIJ International, vol. 59. pp. 1811–1819.
Lian, P., Huang, A., Gu, H., et al. 2018. Towards prediction of local corrosion on alumina refractories driven by Marangoni convection. Ceramics International, vol. 44, no. 2. pp. 1675–1682.
Pan, D., Guo, Q.T., Yu, F.Z., Xiao, Y.B. 2022. Research and Application Progress of Tundish Electromagnetic Induction Heating Technology. Continuous Casting, vol. 41, no. 2. pp. 2–7.
Rovnushkin, V.A., Visloguzova, E.A., Spirin, S.A., Shekhovtsov, E.V., Kromm, V.V., Metelkin, A.A. 2005. Composition of ladle slag and refractory materials and its effect on the wear resistance of the lining of an rh vacuum degasser. Refractories and Industrial Ceramics, vol. 46, no. 3. pp. 193–196.
Sheng, D.Y. 2022. Mean Age Theory in Continuous Casting Tundish Metallurgical and Materials Transactions B, vol. 53. pp. 2735–2752.
Singh, V., Pal, A.R., Panigrahi, P. 2008. Numerical simulation of flow induced wall shear stress to study a curved shape billet caster tundish design. ISIJ International, vol. 48, no. 4. pp. 430–437.
Tang, H.Y., Liu J.W., Wang, K.M., Xiao, H., Li, A.W., Wang, J.Q. 2021. Hydrodynamic modeling and mathematical simulation on flow field and inclusion removal in a seven-strand continuous casting tundish with channel type induction heating. Acta Metallurgica Sinica, vol. 57. pp. 1229–1240.
Wang, Q., Jia, S., Qi, F., et al. 2020. A CFD Study on Refractory Wear in RH Degassing Process. ISIJ International, vol. 60, no. 9. pp. 1938–1947.
Wang, Q., Qi, F.S., Li, B.K., Tsukihashi, F. 2014. Behavior of non metallic inclusions in a continuous casting tundish with channel type induction heating. ISIJ International, vol. 54, no. 12. pp. 2796–2805.
Wang, Y., Zhao, M.J., Yang, S.F., Li, J.S., Zhang, G.X., Xi, X.J. 2020. Physical simulation of plasma heating in tundish. Chinese Journal of Engineering, vol. 42, no. z1. pp. 68–73.
7-11 September 2026
Expo Centre, Nasrec, Johannesburg
9am - 5pm daily
Wei, G., Jiang, Z.H., Zhan, D.P., Yang, X.Y. 2012. Research on induction heating apparatus of tundish. Journal of Iron and Steel Research International, vol. S2. pp. 726–730.
Xie, W.X., Bao, Y.P., Wang, M., Zhang, L.Q. 2014. Application of Induction Heating Liquid in a 30 t Tundish in Continuous Casting Production of Special Steels. Special Steel, vol. 35, no. 6. pp. 28–31.
Xing, F., Zheng, S.G., Zhu, M.Y. 2018. Motion and removal of inclusions in new induction heating tundish. Steel Research International, vol. 89. https://doi.org/10.1002/srin.201700542
Yong, W., Zhao, M.J., Yang, S.F., Li, J.S., Zhang, G.X., Xi, X.J. 2020. Physical simulation of plasma heating in tundish. Chinese Journal of Engineering, vol. 42, no. z1. pp. 68–73.
Yang, B., Deng, A.Y., Kang, X.L., Duan, P.F., Wang, E.G. 2022. Numerical Study on the influence of distributing chamber volume on metallurgical effects in two strand induction heating tundish. Metals, vol. 12, no. 3. https://doi.org/10.3390/met12030509
Yang, B., Lei, H., Bi, Q., Jiang, J.M., Zhang, H.W., Zhao, Y., Zhou, J.A. 2018. Fluid flow and heat transfer in a tundish with channel type induction heating. Steel Research International, vol. 89. https://doi.org/10.1002/srin.201800173
Yang, B., Lei, H., Bi, Q., Jiang, J.M., Zhang, H.W., Zhao, Y., Zhou, J.A. 2018. Electromagnetic conditions in a tundish with channel type induction heating. Steel Research International, vol. 89, no. 10. https://doi.org/10.1002/srin.201800145
Yang, B., Liao, X.W., Liu, K., Zhao, C.L., Han, P. 2022. Numerical simulation of residence time distribution (RTD) in tundish with channel type induction heating. JOM, vol. 74, no. 5. pp. 2129–2138.
Zhang, M.J., Lin, X.L., Yan, W., et al. 2010. Numerical Simulation of Flow Induced Corrosion in One Strand Tundish. Advanced Materials Research, vol. 105–106. pp. 142–145.
Zhao, M.J., Wang, Y., Yang, S.F., Li, J.S., Liu, W., Song, Z.Q. 2021. Flow behavior and heat transfer of molten steel in a two strand tundish heated by plasma. Journal of Materials Research and Technology, vol. 13. pp. 561–572. u
A World of
Where business communities connect, transact, and grow


Affiliation:
1,2 Department of Mining Engineering, University of South Africa, South Africa
Correspondence to:
S. Ncube
Email: 22871845@mylife.unisa.ac.za
Dates:
Received: 20 Aug. 2025
Revised: 01 Dec. 2025
Accepted: 15 Jan. 2026
Published: May. 2026
How to cite:
Ncube, S., Mulenga, F. 2026. A comprehensive evaluation of non-explosive rock fragmentation techniques with a focus on the potential of soundless chemical demolition agents in the surface mining of gemstone in Zambia – Sishen Iron Ore Ccompany (Pty) Ltd v Commissioner for the South African Revenue Service. Journal of the Southern African Institute of Mining and Metallurgy, vol. 126, no. 5, pp. 309–318
DOI ID:
https://doi.org/10.17159/2411-9717/3792/2026
ORCiD:
S. Ncube
https://orcid.org/0009-0002-4187-9333
F. Mulenga
https://orcid.org/0000-0002-9631-2986
A comprehensive evaluation of non-explosive rock fragmentation techniques with a focus on the potential of soundless chemical demolition agents in the surface mining of gemstone in Zambia
by S. Ncube1, F. Mulenga2
Abstract
Rock fragmentation methods in open pit gemstone mining have developed to give priority to safety, environmental sustainability, and crystal integrity. Though effective, traditional drilland-blast techniques can generate vibrations, adverse emissions, and structural damage, all of which could be detrimental in fragile geological settings. Costs, application in hard rocks, and operational inefficiency remain issues, despite the fact that mechanical excavation and evolving thermal and hydraulic technologies have provided some solutions. In response, there has been a growing interest in non-explosive alternatives, particularly soundless chemical demolition agents. This paper provides a comprehensive evaluation of non-blasting rock fragmentation techniques with an emphasis on the efficiency, economic considerations, and operational constraints of soundless chemical demolition agents SCDAs in gemstone mining. Soundless chemical demolition agents technology has shown promising results in preserving gem purity and reducing environmental impact, despite ongoing challenges. These include increased reaction times that hinder output, decreased performance in saturated or high-stress environments, and temperature sensitivity. The contextual relevance of soundless chemical demolition agent application in lateritic regions, such as Zambia, is discussed based on published studies and reported operational experience. Developments in formulation chemistry, fracture modelling, and borehole design have also demonstrated promise in overcoming current limitations. This review identifies the main factors that affect soundless chemical demolition agent performance and brings together reported strategies that can improve their use in high-value mineral extraction through a comprehensive review of recent studies. Ultimately, this article supports a paradigm change towards excavation techniques based on state-of-the-art non-explosive technology that are safer, cleaner, and more accuracy focused.
Keywords
Soundless chemical demolition agents, non-explosive rock breakage, gemstone mining, environmental benefits, safety, economic viability of soundless chemical demolition agents
Introduction
Rock excavation techniques have evolved considerably over time. They are generally categorised into three principal approaches: conventional drill-and-blast method, mechanical excavation, and emerging specialised techniques that are free from explosives (Rudakov et al., 2021; Habib et al., 2022). Recent research still demonstrates that blasting using explosives remains the primary method for fragmenting hard rock in open pit mining and quarries (Batouche et al., 2024; Manyepa, Mutambo, 2021). Explosives, or blasting agents, are chemicals or mixtures that, when initiated by heat or stress, undergo rapid chemical decomposition, releasing substantial amounts of heat and gas. The products from this reaction are generally high-pressure and high-temperature gases that generate shockwaves within the rock mass, facilitating fragmentation. Ideally, a stoichiometric and oxygen-balanced detonation yields mostly water vapour (H₂O), carbon dioxide (CO₂), and nitrogen (N₂). However, in practice, deviations from ideal conditions often occur, resulting in the generation of undesirable by-products such as nitric oxide (NO), ammonia (NH₃), methane (CH₄), and elemental carbon. These noxious gases are harmful to health and the environment, especially at high concentrations, which impacts air quality around the pit mining sites (Biessikirski et al., 2025). In addition to environmental and health concerns, conventional blasting can introduce structural issues. The high-energy release can cause damage to the surrounding rock mass by inducing new fractures or back break, commonly referred to as blast damage (Brisebois, 2007). Moreover, suboptimal blast performance due to unfavourable joint orientations can result in oversized boulders and/or in finely sized fragments, which compromise muck pile quality and downstream processing.
A comprehensive evaluation of non-explosive rock fragmentation techniques
In surface mining operations, the drill-and-blast cycle typically encompasses drilling, charging, blasting, evacuation near the blasting zones, and the following of re-entry periods. The necessity to vacate the site before blasting diminishes the effectiveness of this rock breaking approach, which then constrains the overall productivity (Habib et al., 2022). For example, in Mongolia, at the Erdenet open pit mine, equipment utilisation and overall productivity are reported to have been constrained due to a mandatory stand-down period following blasting, during which personnel and equipment must remain clear of the blast zone to ensure safety. Significant production time is lost between the detonation and the resumption of drilling and hauling activities (Kyelgyenbai et al., 2021). In Russian mines, Rudakov et al. (2021) note that drill-and-blast operations in surface mining can release significant nitrogen oxide (NOx) emissions. They argue that these gases negatively affect operational efficiency by extending re-entry times and limiting equipment productivity. The authors recommend reducing NOx emissions through optimised explosive compositions and blasting parameters.
However, drill-and-blast remains the predominant method for mine development and ore production in both underground and surface mining. A transition to other rock breaking techniques is gaining prominence. For example, in granite surface mining diamond wire sawing has gained popularity, particularly in mining dimension stone. The method is mainly used for block separation, selective extraction of gem-bearing veins, and trimming of the surrounding host rock. It relies on continuous cutting with diamond-coated beads mounted on a steel wire. This allows controlled excavation with very low vibration, elimination of blast-induced gases, and limited damage to the dimension stone (Ersoy, Atici, 2004). Nonetheless, the method presents its own set of challenges, including a significant drop in cutting efficiency in hard, quartz-rich rocks. Diamond wire cutting is known to work best in more uniform and less abrasive formations (Buyuksagis, Goktan, 2005; Buyuksagis, 2007). This reflects the inherent trade-off between high selectivity and lower production rates when diamond wire sawing is compared with conventional drilling and blasting methods.
Concurrently with advances in the drill-and-blast method and diamond wire cutting techniques, there has been growing interest in developing specialised explosion-free techniques. These emerging methods aim to mitigate the environmental, operational, and structural drawbacks of conventional techniques in surface mining; in turn offering the potential for continuous excavation, reduced ground disturbance, and improved safety. It is in this setting that explosive-free approaches are reviewed in this paper, with a focus on their underlying mechanisms, benefits, and limitations in the context of modern gemstone mining practices.
This paper is presented as a critical review rather than an experimental study. This paper contributes to the synthesis of various literature on non-explosive rock fragmentation with specific emphasis on soundless chemical demolition agents (SCDA) and their suitability for gemstone mining in lateritic geological settings. Even though several reviews exist on SCDA technology in construction and tunnelling, few have examined its relevance to gemstone mining, where crystal integrity, selective breakage, and environmental sensitivity are critical. Therefore, by investigating technical, operational, environmental, and economic considerations, this review provides a focused framework for assessing the role of SCDAs in gemstone open pit mining. All observations discussed in this paper are derived from previously published laboratory studies, field reports, and peer-reviewed literature; no new experimental or field data were generated.
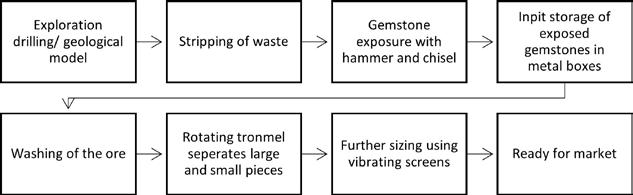
Traditional gemstone rock fragmentation techniques
Before reviewing the development of non-explosive rock fragmentation techniques, it is important to cover the traditional techniques used in gemstone mining. Figure 1 provides an overview of the process of mining gemstones (Cartier, 2019).
The process involves the use of explosives to uncover the schist rock that contains emeralds with blasting done in a series of holes next to the veins. This exposure of the host rock is preceded by "chisellers" meticulously extracting the emerald mineral using a hammer and chisel. The process usually continues by placing the discovered emeralds in padlocked metal boxes or inside linen. Following this is the mineral processing phase, which entails the washing, screening, and sizing of the ore. A rotating trammel is then used to separate the larger and smaller pieces before being taken for further sorting on vibrating screens. Most of the smallscale miners cannot afford the processing machines needed in the implementation of the steps in Figure 1. Hence, they rent equipment to keep their costs low (Oliveira, Ali, 2011; Brandao et al., 2021). One of the most significant challenges in gemstone mining is rock fragmentation. This is because the host rock is highly competent and requires significant energy input for breakage. Adjusting conventional blasting techniques to this requirement therefore poses a risk to the integrity of the gemstones which in turn lead to mineral loss (Giuliani et al., 2019; Zwaan et al. 2005). Alternative non-explosive rock-breaking methods, such as chemical expansion agents and hydraulic splitting, are being explored to mitigate damage and improve recovery rates (De Silva et al., 2016).
Most emerald mines in the Kafubu region, Zambia, have experimented with controlled blasting and the diamond wire sawing method, discussed in the aforementioned, [A1.1][A1.2] in an attempt to reduce waste and enhance extraction efficiency (Mashikinyi, 2020). Being among the first to investigate the extraction of emeralds in the Kafubu region, Zwaan et al. (2005) observed the use of bulldozers, excavators, and dump trucks for waste removal. Moreover, surface mining techniques were widely utilised in the region to exploit emerald deposits. Underground mining was not regarded as a possibility due to the abundance of water during the rainfall period running from November through to March every year.[A2.1][A2.2]
In terms of the drilling and blasting of gemstones, Netecha et al. (2017) argued that the use of high-impact explosives on gemstones increased the chances of mineral losses. They believe that this phenomenon is due to the substantial energy released on the stones that create cracks and irregular shapes. The overall value and significance of the material are decreased when fractures and irregularities develop because they weaken the crystals and render them damaged. In contrast, very low-impact explosives loaded in specially designed blasthole patterns were used at Ural Emerald Mines in Russia. vv and Zhernakov (1995) specifically tested whether this would lead to reduced damage made to the emerald crystals. The two researchers also tested the use of expanding
Figure 1—Schematic diagram of the gemstone mining process produced, after Cartier (2019)
A comprehensive evaluation of non-explosive rock fragmentation techniques
plastics and hydraulic wedge devices inserted into the drill holes in place of explosives. What they found is that the mine was able to extract record quantities of emeralds. For example, a famous extraction being the 11,000-ct crystal with an excellent green colour quality currently housed in a museum. While Netecha et al. (2017) seemed to recommend the use of low impact explosives to break rock, the investigation by Laskovenkov and Zhernakov (1995) appeared to yield better results for gemstone mining and crystal preservation.
Referring again to the drilling and blasting of gemstones, Alam et al. (2019) recommend the adoption of best charging practice. This is because the combined use of hand-held drilling tools and high-impact explosives causes undue damage to the emerald crystals. Alam et al. (2019) explain that good blasting outcomes hinge on the correct stemming length and associated aggregates, the right placement of the blasting caps in the drilled hole, and the correct hole diameter for explosives. When correctly implemented, the guidelines increase the likelihood of achieving efficient fragmentation while conserving the integrity of mineralised crystals.
Another study by Eniowo et al. (2022) found that small-scale gemstone mining required geological and structural knowledge of an orebody's location, shape, size, and quality. They also noted that, without ore modelling data, high-energy explosives may be used unintentionally on gemstone crystals. This is largely the reason why emerald minerals have been observed to sustain inadvertent damage during blasting activities, thereby decreasing its overall worth. The absence of useful data most common in artisanal and small-scale gemstone mines therefore presents an opportunity for gentle rock breaking alternatives. These are reviewed in the section that follows.
A review of selected non-explosive rock fragmentation methods for gemstone mining
In sensitive mining environments like gemstone mining, the use of non-explosive rock fragmentation methods offers safer and more environmentally friendly alternatives as compared to high-energy explosives (De Silva et al., 2016). Hydraulic splitters, rock breakers, thermal lancing, and expansive grouts are some of the alternatives employed as opposed to traditional blasting methods. Particularly, hydraulic splitters and rock breakers fitted to hydraulic excavators are mostly used in operations near infrastructure as they offer precise fracturing with minimal vibration. However, Singhal (2014) reported that the major limitation of this technique is the slow cycle times that limit productivity, especially for large scale operations. Soundless chemical demolition agents (SCDA), on the other hand, offer controlled expansion, but their efficiency is limited by the porosity and temperature of the rock (Yapici, 2023). So, although non-explosive rock fragmentation techniques improve safety and lessen regulatory hazards, they are not widely used in large scale mines. This is because of their greater costs and slower rates of fragmentation when compared to explosive mining techniques (Wang et al., 2023). In gemstone mining, where preserving the integrity of mineral crystals is critical, non-explosive techniques like manual splitting and controlled wedge-and-feather methods are preferred to minimise damage. In countries like Zambia, which is dominated by lateritic and weathered formations, manual wedge-and-feather techniques as well as hydraulic and chemical alternatives are gaining popularity (Mashikinyi, 2020). However, for the purpose of this article, thermal fragmentation, plasma blasting technology, control form injection, radial axel splitter, superficial carbon dioxide, and SCDA’s non-explosive rock fragmentation techniques are reviewed for gemstone mining. SCDAs are given
further attention in subsequent sections with focus on their use in gemstone mining.
Supercritical carbon dioxide (SC-CO₂) has been explored as a non-explosive rock breaking method, initially for hydrocarbon reservoir stimulation (Ishida et al., 2012) and later in tunnelling and mining projects. Operating above CO₂’s critical temperature and pressure, it behaves as a dense fluid with high diffusivity and dissolving capacity, allowing energy transfer and rock fracturing. Various researchers have demonstrated its potential; Kolle (2000) showed that SC-CO₂ can cut through hard rocks at lower pressures, while Wang et al. (2019) found reductions in water use and improved fracture networks compared to hydraulic fracturing. Li et al. (2020) also reported reduced noise and dust in metro construction projects. Despite these advantages, SC-CO₂ presents several challenges for gemstone mining. It requires precise pressure and temperature control, adding to operational complexity and cost (Li et al., 2020). Scaling up for continuous mining is also still difficult (Hu et al., 2024). More critically, the aggressive fracturing could damage delicate crystals. While effective in other contexts, its suitability for gemstones remains uncertain.
Controlled foam injection (CFI) is another method developed by injecting foam into a drilled hole, building pressure that fractures the rock in tension rather than compression, usually below 50 MPa (Pickering, Young, 2017). The foam forms an effective seal and allows a controlled release of energy, which improves safety and reduces dust (Pickering, Young, 2017). However, limitations exist. Penetration depth is restricted (Pickering, Young, 2017), and there are concerns over possible air bursts and fly rock (Liu et al., 2021). Bilgin et al. (2013) also noted that fracturing can be slow and unpredictable. For gemstone extraction, where precise and gentle breakage is essential, these factors could increase the risk of crystal damage (Singhal, 2014).
Thermal fragmentation was developed to reduce ore dilution in narrow vein deposits (Brisebois, 2007; Habib et al., 2022). The technique involves drilling a pilot hole and inserting a diesel- or plasma-powered burner, generating temperatures up to 800 °C. This causes ore to spall into small fragments while leaving surrounding rock mostly intact (Drake et al., 2020), which improves efficiency in high-grade, thin ore veins. The method, however, poses challenges for gemstone mining. The extreme heat increases ventilation requirements and energy costs (Drake et al., 2020: Vogt, 2016). Furthermore, the method requires specialised equipment and skilled operators and is designed for ore minerals rather than fragile crystals. The thermal stress could damage gemstones, making its application uncertain despite success in metalliferous mining.
Plasma blasting technology (PBT) uses electrical pulses through an electrolyte in a drilled hole to generate shockwaves exceeding 1 GPa, causing rock fragmentation comparable to conventional explosives (Kitzinger, Nantel, 1992; Lee et al., 2018). The process avoids traditional explosives and has been noted for environmental and safety advantages. Nonetheless, its use in gemstone mining may be limited. Significant electrical infrastructure is required, and the sequential activation of plasma shots reduces operational efficiency (Kitzinger, Nantel, 1992). The high shockwave pressures also present a risk of damaging delicate crystals, suggesting that careful consideration is needed before applying PBT to gemstone recovery. Finally, the radial-axial splitter (RASP) is a mechanical rock fragmentation method that generates radial and axial forces in a pre-drilled borehole. Based on the penetrating cone fracture principle, the method propagates fractures outward from the hole, often forming a cone-shaped failure zone with depths up to 254
A comprehensive evaluation of non-explosive rock fragmentation techniques
mm per split (Anderson, Swanson, 1987; De Graaf, Spiteri, 2018).
Despite these promising results, RASP has operational limitations. It is not a continuous method, limiting throughput for high productivity, and requires significant thrust force for anchoring, which depends on operator skill (Paraszczak, Planeta, 2003). For gemstone mining, where efficiency and careful extraction are critical, these factors suggest that its applicability may be limited.
Overall, while each of these methods offers advantages in various mining contexts, their specific characteristics such as aggressive fracturing, high energy input, or limited control, highlight potential challenges for application in gemstone mining, where preservation of delicate crystals and selective extraction are paramount. Given the limitations of the methods presented, the following section explores SCDAs as a potentially suitable technique for gemstone mining, focusing on their ability to break rock gently and selectively, while preserving fragile gemstone crystals.
Soundless chemical demolition agents for gemstone mining
Soundless chemical demolition agents’ (SCDA) commercial use only started about 10 to15 years ago, especially for controlled fracturing in rock and concrete demolition uses. SCDAs, sometimes known as expansive cements or non-explosive expansive materials (NEEM), were first created over three decades ago. Usually, the main active ingredient of these agents is quicklime (CaO), which comes in the form of cementitious powders. Mixed with water and kept under confinement, these cementitious powders undergo a hydration process that causes a notable volume increase and high expansive pressure that can induce tensile cracks in the surrounding material (Harada et al., 1989). SCDAs can therefore be defined as "cementitious powdery materials with quicklime (CaO) as the main component that expands upon contact with water, producing high expanding pressure under confined conditions" (De Silva et al., 2016).
SCDAs operate by injecting the hydrated mixture into a borehole pre-drilled inside the rock or concrete substrates. The resulting chemical process, which is mostly the creation of calcium hydroxide from the reaction between calcium oxide and water, generates significant crystallisation pressure. This force is directed radially against the borehole walls that then creates tangential tensile stress (see Figure 2).
Usually starting along the weakest channel in the borehole circle, a fracture propagates outward under pressure of magnitude exceeding the tensile strength of the host material (De Silva et al., 2016; Harada et al., 1989). Products like Bristar and Dexpan are now commercially available and widely employed, particularly in urban infrastructure rehabilitation projects where the use of conventional explosives is banned or limited (Habib, 2022). Indeed, concordant studies have underlined the increasing relevance of non-
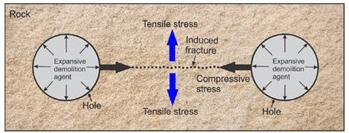
blasting techniques in the framework of safe and environmentally benign rock fragmentation. For example, De Silva et al. (2016) and Netecha et al. (2017) found methods like hydraulic fracturing, hydro-wedging, electro-disintegration, diamond wire cutting, and the application of non-destructive demolition mixtures (NDM) as acceptable substitutes for traditional explosives. SCDAs stand out among these for their low environmental impact since their use does not generate vibrations, pollutants, or fly rock, which are especially important in urban and fragile biological contexts. This is because the usual uniaxial compressive strength (UCS) of concrete is exceeded by expansive pressures over 44 MPa levels and heat up to 150 °C produced by this reaction. Note that the UCS of concrete ranges from 10 MPa to 20 MPa (Arshadnejad et al., 2011; Al-Bakri, Hefni, 2021).
Parameters such as water content in the rock mass, borehole diameter, borehole spacing, and ambient temperature affect the performance of the expansive pressure generated. Indeed, as can be seen in Figure 3, a 4% increase in water content leads to a 17.6% decrease in the expansive pressure, while a reduction of 12 °C in the ambient temperature results in a 23.5% decrease in the expansive pressure. For optimal performance, Arshadnejad et al. (2011) as well as Al-Bakri and Hefni (2021) suggested ideal operating parameters of roughly 34 °C ambient temperature and a moisture content of the rock mass of about 30% (Figure 3).
Other notable research by Hinze and Brown (1994) showed that the expanding pressure generated under a limited application of SCDA is inversely proportional to water content. This means that a lower water-to-cement ratio results in great packing density and less spacing. Consequently, more concentrated hydration reactions are encouraged, which then explain the high expanding pressure generated. Researchers such as Natanzi et al. (2019), Laefer et al. (2010), and others also revealed that expansive pressure usually rises proportionally with temperature. However, a blowout can occur beyond a particular temperature limit, forcing the pressure to escape too soon before complete fracturing can take place (Natanzi et al., 2019; Hinze, Brown, 1994).
Although SCDAs offer a safe, silent, and emission-free substitute to blasting, some restrictions remain. Chief among these is the slow rate of fracturing, usually needing more than 10 h for the procedure to fully propagate the rock. This, together with quite low efficiency, especially in large-scale operations, are the primary reasons why the broad use of SCDAs in high-productivity mining settings is limited (Zhou et al., 2018b; Maubane, Ngwenyama, 2025). Their use, however, is still quite beneficial in delicate or limited work areas where traditional techniques have legal, environmental, or safety concerns, like gemstone mining. Therefore, this methods of extraction will be explored further in the gemstone mining context.
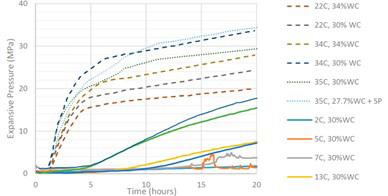
Figure 2—Principle of rock breakage using SCDAs, after Al-Bakri and Hefni (2021)
Figure 3—Effects of moisture content and ambient temperature on the expansive pressure of a typical SCDA (Al-Bakri, Hefni, 2021)
A comprehensive evaluation of non-explosive rock fragmentation techniques
Classification and characteristics of soundless chemical demolition agents
The classification of soundless chemical demolition agents (SCDA) is generally guided by the nature of their expansive constituents. According to the Standard Specification for Expansive Hydraulic Cement (ASTM C845, 2018), there are three primary types of expansive cements: Type K, Type M, and Type S. These three types of cement differ in their specific aluminate components but share a common mechanism of action responsible for the production of expansive ettringite crystals during hydration and, subsequently, their swelling behaviour. In addition to these three common types, there is a special type called Class G that acquires its swelling properties mainly from the creation of portlandite, Ca(OH)₂, when it hydrates.
Looking at Type K expansive cement, this is made from a mix of three components: anhydrous calcium-alumino-sulphate, calcium sulphate, and uncombined calcium oxide. In this case, Equation 1 shows the hydration reaction, which governs the expansive mechanism (ASTM C845, 2018; Habib et al., 2022):
Improvements to the wide-ranging capabilities of Type K cements have been noted by adding silica fume and plasticisers. Calcium aluminate (CaOAlO) and calcium sulphate combine to form this type of cement. Its reaction proceeds in Equation 2 (ASTM C845, 2018; Habib et al., 2022):
[2]
The second type of expansive cement or Type M demonstrates significant ettringite formation, which in turn leads to producing effective expansive pressure (ASTM C845, 2018). Type M expansive cement is a blend of calcium aluminate (CaOAlO) and calcium sulphate combined to form this type of cement. Its reaction is given in Equation 3:
[3]
The last type of Type S expansive cement comprises tricalcium aluminate (3CaOAl₂O₃ or C₃A) and calcium sulphate. The hydration pathway for Type S cement can be expressed as Equation 4 (ASTM C845, 2018):
[4]
The reaction in Equation 4 also yields ettringite, an expansive product offering similar capabilities for pressure generation to Types K and M. The special type of cement, known as Class G cement, is unique in the sense that most of its expansion comes from the hydration of lime, which makes up 80% to 90% of the mix. Other constituents include SiO₂, Al₂O₃, and Fe₂O₃, responsible for regulating the rate and extent of expansion. The fundamental hydration reaction in the Class G cement is given by Equation 5 (De Silva et al., 2016):
[5]
However, the main differences between the reviewed expansive classes are the amount of aluminate compounds contained and the optimal temperature they function at, which affects the selection of the expansive agent to use. Type K operates optimally at -5 °C and 10 °C, type M at 10 °C to 20 °C, while type S at 20m°C to 35m°C, and type G at 35m°C and higher (Maubane, Ngwenyama, 2025). For gemstone mining, especially in Zambia, Type S and G are ideal for the climate and recommended for use.
Applications of soundless chemical demolition agents in surface mining
Increasingly, SCDAs are being acknowledged worldwide in the mining industry for their part in regulated rock fragmentation. Though their use in gemstone mining is underexplored, several research in mining and quarrying settings offer insightful information that might be used in gemstone operations. Recent studies by Zhang et al. (2020) considered how well SCDA fractured granite. The reported findings indicate that drilling spacings of 15 cm – 20 cm could generate expansive pressures between 30 MPa and 80 MPa. These magnitudes of pressure were deemed sufficient to cause fractures within 12 to 48 h after SCDA loading. Applying this in more capable lithologies like quartzite and basalt, however, has been less efficient. Research by Chen et al. (2019) provided evidence that SCDAs do not perform well in hard rocks like quartzite and basalt, particularly when the temperature rises to more than 30 °C, which can lead to unequal curing outcomes.
In terms of empirical description, Arshadnejad et al. (2011) proposed a model to forecast the optimal distance between boreholes considering the strength, elasticity, and toughness of the rock. The inclusion of these factors was to address limitations of previous models reported by Jin et al. (1988), Wang et al. (1988), and Jana et al. (1991). In doing so, the predictive model led to the enhanced use of SCDAs. The proposed empirical model is provided in Equation 6 (Arshadnejad et al., 2011):`

[6]
Where S is the borehole spacing (mm); P is the expansive pressure (MPa); σ_t is the uniaxial tensile strength (MPa); t is the charging time (h); E is Young’s modulus (GPa); d is the borehole diameter (mm); and K_IC is the Mode I fracture toughness (MPa·m0.5). Mode I fracture toughness is used when assessing the resistance of rock masses to tensile failure and fracture toughness; it is the perpendicular propagation of cracks to the crack plane (Chang et al., 2002).
Later, Arshadnejad (2019) confirmed the validity of Equation 6 by means of field tests in an Iranian granite quarry. Various borehole diameters (i.e., 32 mm, 38 mm, and 44 mm) were employed. The experimentally measured fractures were then found to closely match predictions produced with Equation 6, thereby showing its robustness for practical application. Note that earlier empirical models, such as those suggested by Jin et al. (1988) and Wang et al. (1988), employed simplified relationships for calculating borehole spacing. They are provided in Equations 7 and 8:
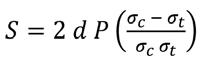
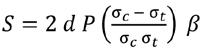
[7]
[8]
Here, σc indicates the uniaxial compressive strength of the rock mass while β is an empirical coefficient set at β = 1 for rock (Wang et al., 1988). Although simpler to calculate, Equations 7 and 8 ignore the modulus of elasticity and the fracture toughness of the rock and therefore lack accuracy in varied geological environments like gemstone mining.
Shang et al. (2018) also investigated the effects of hole spacing on the expansive pressure generated in pre-drilled holes of different sizes. The aim of the study was to develop a mathematical model of the relationship between the stresses produced between two neighbouring holes while subjected to the incremental expansive pressure of the SCDA. Shang et al. (2018) conducted a parametric
A comprehensive evaluation of non-explosive rock fragmentation techniques
study using a developed analytical model on a soft rock Midgely Grit sandstone (MGS) and a hard rock Horton Formation siltstone (HFS). Various hole spacings of 50 mm intervals between 20 mm and 2000 mm were tested. Stresses produced were then monitored at seven different loading times t = 1, 2, 3, 4, 10, 15, 20, and 25 hrs. The experimental findings showed that with both rocks an increase in hole spacing between drill holes, the time required to fragment the rock increased significantly. For example, at a hole diameter of 100 mm for soft rock with tensile strength of 2.0 MPa, rock fracture time increased by 24 h when the hole spacing was increased from 0.29 m to 1.21 m. Interestingly, hole diameter was shown to greatly affect the level of hole pressure that could be generated within. Chen et al. (2023) reported that borehole spacing had more impact on stress fluctuation than diameter. However, this study excluded changes in ambient temperature, an aspect deserving attention in future research.
Other studies have expanded SCDA applications. Tang et al. (2021) used computer simulations to study SCDA performance and borehole angles. The researchers subsequently found that a drill elevation angle affected SCDA breakage performance more than an azimuth angle. Wang et al. (2022) examined granite fracture propagation under different initial stress levels. Their experimental results highlighted the need of pre-existing stress fields within the rock mass. This is because these fields affect fracture behaviour following SCDA treatment.
However, a closer look at these studies reveals a crucial gap in the known data. While the effects of spacing and diameter are clearly demonstrated, the experiments were conducted in controlled laboratory environments. Additionally, relatively small-diameter boreholes were used. Shang et al. (2018) tested diameters up to only 100 mm, while Chen (2023) only went as far as 86 mm. These sizes fall short of the actual borehole diameters used in gemstone mining operations, which often exceed 100 mm. This research though, offers promising evidence that SCDAs can be effective in larger diameter holes. It highlights the need for further studies to validate their performance under field-scale conditions. The most important question is: Will similar results be seen in hole diameters greater than 100 mm and in uncontrolled field environments?
Comparison of environmental effects of SCDA and traditional explosives
The inherent safety of SCDAs is one of their most important advantages compared to explosives. Several researchers have conducted comparative analyses of toxic emissions due to the use of SCDAs versus that of traditional explosives. Ferreira et al. (2015), for example, evaluated the life-cycle energy and environmental impacts of producing emulsion explosives, which are based on ammonium nitrate. They highlighted the significant environmental footprint associated with the production and use of such explosives. Indeed, some of the emissions from explosives include CO₂ and NOₓ, emissions, both of which are key greenhouse gases responsible for climate change. De Silva and Ranjith (2016) concluded that, unlike ammonium nitrate-based explosives (e.g., ANFO), which release CO₂, NOₓ, and other toxic gases into the air, SCDAs undergo a non-explosive chemical reaction that does not produce harmful emissions. Both authors emphasised the need for the adoption of SCDAs, as they offered a safer, cleaner, and more sustainable alternative to conventional explosives.
For many years, researchers have also been investigating the effects of explosives on the environment. Concordant findings, e.g., Habib (2022), Bajpayee et al. (2004), Persson et al. (2018), and
Vogt (2016), clearly highlight the environmental and operational disadvantages of using traditional explosives. Bajpayee et al. (2004), for example, investigated blasting-related injuries in surface mining throughout the United States of America. What they found is that fly rock was the most prevalent hazard, responsible for over 60% of all documented injuries. The unpredictable nature of explosive blasts and inadequate safety zones were the primary causes of these risks. In contrast, SCDAs do not generate high-velocity debris, which renders them a much safer option, particularly in urban or sensitive environments. It should be noted that conventional explosives can easily surpass 120 dB, necessitating hearing protection, while SCDAs remain below 85 dB, allowing their use without extra noise safety gear. SCDAs outperform typical explosives in gemstone mining circumstances in terms of the environment and safety, according to the studies in this section. They demonstrate that SCDAs reduce hazardous fumes and vibrations and reduce fly rock and inadvertent detonations. SCDAs are safe and easy to handle for miners.
Economic benefits of SCDA over traditional explosives
The financial viability of SCDAs is a critical consideration for their adoption. Maneenoi et al. (2022) argue that even though SCDAs reduce noise, vibration, fumes, dust, and toxic emissions into the environment, they are usually considered less cost-effective when compared to explosives. Furthermore, the authors believe that the slower reaction rates seen have the potential to lead to increased production and labour costs. Habib et al. (2022) and Laefer et al[HS1.1]. (2010) agree with this argument by adding that the prolonged reaction time of more than 10 hrs in some instances, has led to elevated labour costs and extended project timelines. They further explain that these costs far outweigh the environmental and safety benefits of the SCDAs.
A dominant cost component in SCDA-based rock breakage systems that cannot be overlooked is the increased cost of drilling. De Silva and Ranjith (2016) and Musunuri and Mitri (2009) highlighted that effective rock breakage requires closely spaced boreholes. This leads to significantly higher drilling intensity, when compared to conventional explosive blasting where wider hole spacing and burden are possible. Jimeno et al. (1995) explained that expansive motors required hole spacings of 5 to 10 times the hole diameter compared to explosives which allow for hole spacings that are 20 to 40 times the hole diameter, demonstrating that SCDAs require higher drilling effort compared to blasting with explosives. To achieve good fragmentation with SCDAs there needs to be a cost trade-off between drilling and fragmentation quality.
Other authors like De Silva and Ranjith (2016) justify the use of SCDAs by suggesting that the cost savings that SCDAs generate from the decreased insurance premiums, minimal regulatory compliance costs, and the need for specialised labour mitigated, contribute to the overall financial benefit of SCDAs. Furthermore, the removal of costs connected to blast-induced damages and environmental remediation supports the economic justification for SCDAs (Hinze, Nelson, 1996). Hinze and Brown (1994) also add that the continuous nature of SCDA application, without the need for extensive safety evacuations, partially compensates for the extended reaction periods. In any case, operational efficiency is enhanced because SCDAs are seen not to require post-blast mucking and scaling and leads to a reduction in the damage to surrounding structures (De Silva, Ranjith, 2016).
While literature does not seem to offer specific figures on cost reductions that can be incurred from implementing SCDA
A comprehensive evaluation of non-explosive rock fragmentation techniques
rock-breaking methods, the potential for saving mining costs exists through reduced explosive usage and reduced disturbances from blast evacuations and re-entry periods (Sakhno, Sakhno, 2024. This makes SCDA a potential and viable option to explore for gemstone rock breaking. Arguably in the case of gemstone mining, where the reduction of cracks induced in the crystal is far more valuable as opposed to cost-saving, the use of SCDAs becomes an appealing option for breaking the host rock.
Challenges and limitations of soundless chemical demolition agents
Inasmuch as SCDAs have gained popularity and have shown potential for great use in mining operations, there are still several challenges and limitations associated with their use. Limitations presented here are also a concern to gemstone mining operations. Natanzi et al. (2016) investigated the efficiency of SCDAs under varying temperatures. They were able to show that sudden changes in temperature had a great effect on the expansive pressure generated in the boreholes. They further noted that elevated temperatures had the potential to cause blowouts in the charged holes before the rock started to break. De Silva et al. (2016) added that the calcium oxide contained in SCDAs is accelerated quickly with high temperatures, while lower temperatures slow the chemical reaction. This limitation compromises the predictability and efficiency of the crack propagation, especially in regions with variable weather.
Looking at the washout of SCDAs in saturated conditions, rock breaking with SCDAs occurs when calcium oxide is hydrated. However, too much water content in the mixture tremendously reduces the efficiency of the expansion process (Arshadnejad et al., 2011; Al-Bakri, Hefni, 2021). De Silva et al. (2016; 2021) suggested that viscosity-enhancing admixtures (VEA), such as welan gum, could mitigate this issue by improving resistance to washout. However, more research on the admixtures needs to be conducted to ascertain their effectiveness and usage in controlling washout. This challenge places a limitation on the use of SCDAs in deep, wet underground mines and waterlogged drill holes compared to the use of traditional explosives.
Finally, the inherent challenge observed with larger drill holes is the reduced efficiency of the SCDA. Most studies, including Shang et al. (2018), Chen (2023), Arshadnejad et al. (2011), and Arshadnejad et al. (2019), to name but a few, focused on testing SCDAs in smaller diameter holes less than 100 mm. It therefore seems, to the best of our knowledge, that little research has been conducted on the use of SCDAs in large-diameter holes greater than 100 mm and its optimal drilling and blasting design. Notably, research papers available in the body of knowledge tend to agree that higher diameter holes improve the initial crack propagation time significantly when compared to diameter holes smaller than 70 mm. This then requires that follow-up research is conducted on the requirements for optimal drilling and blasting design patterns when larger diameter holes are used.
Prospects for future work
In the present review, it is evident that the use of SCDAs in rock breaking is emerging as a practical and safer alternative to traditional explosives. The potential of SCDAs to minimise toxic fumes, fly rock, dust, and especially seismic vibration, therefore makes it a viable option for gemstone mining. Gemstone mining is concerned with controlled explosive pressure release, precision cutting, and the reduction of collateral damage to the
surrounding rock and structures. All these features can be offered with SCDAs, which makes them a good candidate for use in the fragmentation of gemstone rock. However, there is a need for more comprehensive studies of SCDAs that are focused more on field trials and laboratory-based simulations mimicking realistic mining conditions. Zhang et al. (2025), for instance, performed biaxial confinement tests on granite panels and showed that SCDA-induced fractures could propagate effectively under increased in situ stress conditions when combined with optimised drilling patterns. They subsequently found that SCDAs may be more viable in deep and high-pressure environments than was previously believed. Future research should also concentrate on the suitability of SCDAs in large-diameter boreholes utilised by both small-scale and large-scale mines. It is equally crucial for future research to focus on improving the reliability and consistency of SCDA in terms of rock breakage performance.
Lastly, Maneenoi et al. (2022) emphasised that the rate and magnitude of expansion pressure are significantly affected by environmental factors like ambient temperature, humidity, and rock saturation. As a result, currently reported experiments have been including chemical admixtures such as retarders or accelerators to tailor SCDAs to different field conditions. This may facilitate their use in more unpredictable or extreme environments. Future research and technology should equally focus on addressing the slow reaction time of SCDAs, especially for operations that are sensitive to time.
Conclusion
The development of rock fragmentation methods reflects a more general industrial shift towards safer, more sustainable, and precision-driven approaches, particularly in the field of gemstone mining. Though speed and established operational infrastructure keep conventional drill-and-blast techniques dominant, their associated environmental and occupational hazards (e.g., unintentional damage to precious crystal structures) have increasingly called into question their widespread use. Mechanical excavation has provided a partial solution in suitable lithologies, but large capital costs and low adaptability in geologically complex regions often restrict its application. Non-explosive rock fragmentation techniques, particularly soundless chemical demolition agents (SCDA), offer a good replacement in this respect. Though, SCDAs still suffer significant practical constraints despite their potential. Their temperature sensitivity, washout vulnerability, shorter reaction times, and variable performance in hard rock or high-stress geological settings question their scalability. A lack of field-based empirical data, especially in bigger borehole applications, has also hampered the development of prediction models and undermined more general industry confidence in their use. Economically speaking, while SCDAs may not yet rival conventional explosives in throughput efficiency, their indirect cost benefits are more important than output. As field trials increase and formulations improve, the cost-performance ratio is expected to shift further in favour of SCDAs.
In the end, non-explosive fragmentation techniques, particularly SCDA-based systems, may position themselves and start offering a hopeful and increasingly important instrument in the quest for responsible mining. Their application, especially in gemstone open pit operations, may also suggest a paradigm shift away from high energy excavation towards a more intelligent, environmentally responsive, and minerally conservative approach to resource recovery. Transforming the potential of SCDAs into
A comprehensive evaluation of non-explosive rock fragmentation techniques
industry-standard practice will eventually depend on continuous multidisciplinary research supported by empirical validation and pragmatic application.
It should be noted that this paper does not present new experimental or field data, instead, it consolidates and critically evaluates existing studies to highlight current capabilities, limitations, and research gaps associated with SCDA use in gemstone mining.
References
Al-Bakri, A., Hefni, M. 2021. A review of some nonexplosive alternative methods to conventional rock blasting. Open Geosciences, vol. 13, no. 1, pp. 431–442. https://doi.org/10.1515/ geo-2020-0245
Alam, M., Ali, S., Khan, G., Alam, M., Bano, Y., Khan, A. 2019. An overall view on gemstone mining in Gilgit-Baltistan: Problems and mitigations. Journal of Mountain Area Research, vol. 4, no. 1, pp. 3–39. https://doi.org/10.53874/jmar.v4i0.57
Anderson, S.J., Swanson, D.E. 1987. Capability evaluation of the radial-axial splitter. (Vol. 9071). US Department of the Interior, Bureau of Mines
Arshadnejad, S. 2019. Design of hole pattern in static rock fracture process due to expansion pressure. International Journal of Rock Mechanics and Mining Sciences, vol. 123, no. 1, pp.104100. https://doi.org/10.1016/j.ijrmms.2019.104100
ASTM International. 2018. ASTM C845/C845M-18: Standard specification for expansive hydraulic cement. West Conshohocken, PA: ASTM International. https://doi. org/10.1520/C0845_C0845M-18 [Accessed: 12 August 2025].
Arshadnejad, S., Goshtasbi, K., Aghazadeh, J. 2011. A model to determine hole spacing in the rock fracture process by nonexplosive expansion material. International Journal of Minerals, Metallurgy, and Materials, vol. 18, no. 5, pp. 509–514. https:// doi.org/10.1007/s12613-011-0470-5
Bajpayee, T.S., Rehak, T.R., Mowrey, G.L., Ingram, D.K. 2004. Blasting injuries in surface mining with emphasis on flyrock and blast area security. Journal of Safety Research, vol. 35, no. 1, pp.47–57. https://doi.org/10.1016/j.jsr.2003.07.003
Batouche, T., Tabet, A., Zerzour, O., Hadji, R., Benyoucef, A.A., Moueri, A., Dinar, H. 2024. Optimizing rock fragmentation in open pit mining: Blasting plan refinement using WipFrag and Kuz-Ram method. Geomatics, Land management and Landscape. vol. 1, no. 4, pp. 77–89. https://doi.org/10.15576/ GLL/193744
Biessikirski, A., Dworzak, M., Pytlik, M., Nachlik, S. 2025. Impact of the Type of Energetic Material on the Fume Emission in OpenPit Mining. Sustainability, vol. 17, no. 5, pp. 2071−1050. https://doi.org/10.3390/su17052075
Bilgin, N., Copur, H., Balci, C. 2013. Mechanical excavation in mining and civil industries. 1st ed. CRC press. Florida.
Brandao, L., De Alencar Naas, I., Neto, P.L.D.O.C. 2021. Sustainable development of gem production: An application of the Analytical Hierarchy Process. International Journal of the Analytic Hierarchy Process, vol. 13, no. 3, pp 1−8. https://doi. org/10.13033/ijahp.v13i3.880
Brisebois, D., Rocmec International Inc. 2007. Thermal rock fragmentation application in narrow vein extraction. U.S. Patent
7,195,320.
Buyuksagis, I.S. 2007. Effect of cutting mode on the sawability of granites using segmented circular diamond sawblade. Journal of Materials Processing Technology, vol. 183 no. 2-3, pp. 399−406. https://doi.org/10.1016/j.jmatprotec.2006.10.034
Buyuksagis, I.S., Goktan, R.M. 2005. Investigation of marble machining performance using an instrumented block-cutter. Journal of Materials Processing Technology, vol. 169, no.2, pp. 258−262. https://doi.org/10.1016/j.jmatprotec.2005.03.014
Cartier, L.E. 2019. Gemstones and sustainable development: Perspectives and trends in mining, processing and trade of precious stones. The extractive industries and society, vol. 6 no. 4, pp.1013−1016. https://doi.org/10.1016/j.exis.2019.09.005
Chang, S.H., Lee, C.I., Jeon, S. 2002. Measurement of rock fracture toughness under modes I and II and mixed-mode conditions by using disc-type specimens. Engineering Geology, vol. 66, no. 1−2, pp. 79−97. https://doi.org/10.1016/S0013-7952(02)00033-9
Chen, T. 2023. Explosive-Free Breakage of Biaxially Loaded Rock Using Soundless Chemical Demolition Agents. PhD thesis, McGill University, Montreal, Canada.
Chen, T., Vennes, I., Mitri, H.S. 2023. Biaxially confined rock breakage with SCDA: large-scale tests and numerical modelling. Rock Mechanics and Rock Engineering, vol. 56, no. 8, pp.5525−5541. https://doi.org/10.1007/s00603-023-03332-0
De Graaf, W.W., Spiteri, W. 2018. A preliminary qualitative evaluation of a hydraulic splitting cylinder for breaking rock in deep-level mining. Journal of the Southern African Institute of Mining and Metallurgy, vol. 118, no. 8, pp.891–897. https://doi. org/10.17159/2411-9717/2018/v118n8a13
De Silva, R.V., Ranjith, P.G. 2016. An alternative to conventional rock fragmentation methods using SCDA: A review. Energies, vol. 9, no. 11, pp.958−989. https://doi.org/10.3390/en9110958
De Silva, V.R.S., Ranjith, P.G., Perera, M.S., Wu, B., Rathnaweera, T.D. 2019. The influence of admixtures on the hydration process of soundless cracking demolition agents (SCDA) for fragmentation of saturated deep geological reservoir rock formations. Rock Mechanics and Rock Engineering, vol. 52, no. 2, pp.435−454. https://doi.org/10.1007/s00603-018-1596-9
Drake, B., Koroznikova, L., Tuck, M., Durkin, S. 2020. Application of thermal fragmentation in Australian hard rock underground narrow-vein mining. Mining, Metallurgy & Exploration, vol. 37, no. 1, pp.219−229. https://doi.org/10.1007/s42461-019-00154-z
Eniowo, O.D., Kilambo, S.R., Meyer, L.D. 2022. Risk factors limiting access to formal financing: Perceptions from artisanal and small-scale mining (ASM) operators in Nigeria. The Extractive Industries and Society, vol. 12, no. 1, p.101181−101193. https:// doi.org/10.1016/j.exis.2022.101181
Ersoy, A., Atici, U. 2004. Performance characteristics of circular diamond saws in cutting different types of rocks. Diamond and Related Materials, vol. 13, no. 1, pp. 22–37. https://doi. org/10.1016/j.diamond.2003.08.016
Ferreira, C., Freire, F., Ribeiro, J. 2015. Life-cycle assessment of a civil explosive. Journal of Cleaner Production, vol. 89, no. 1, pp.159−164. https://doi.org/10.1016/j.jclepro.2014.11.027
Giuliani, G., Groat, L.A., Marshall, D., Fallick, A.E., Branquet, Y. 2019. Emerald deposits: A review and enhanced classification.
A comprehensive evaluation of non-explosive rock fragmentation techniques
Minerals, vol. 9, no. 2, p.105−168. https://doi.org/10.3390/ min9020105
Habib, K.M. 2022. Development of explosive-free method for the breakage of hard rock using soundless chemical demolition agents. PhD Thesis, McGill University, Montreal, Canada.
Habib, K.M., Shnorhokian, S., Mitri, H. 2022. Evaluating the application of rock breakage without explosives in underground construction—a critical review of chemical demolition agents. Minerals, vol. 12, no. 2, p.220−237. https://doi.org/10.3390/ min12020220
Harada, T., Idemitsu, T., Watanabe, A., Takayama, S.I. 1989. The design method for the demolition of concrete with expansive demolition agents. In Fracture of Concrete and Rock: SEMRILEM International Conference June 17–19, 1987, Houston, Texas, pp. 47−57. https://doi.org/10.1007/978-1-4612-3578-1_5
Hinze, J., Brown, J. 1994. Properties of soundless chemical demolition agents. Journal of construction engineering and management, vol. 120, no. 4, pp.816-827. https://doi. org/10.1061/(ASCE)0733-9364(1994)120:4(816)
Hinze, J., Nelson, A. 1996. Enhancing performance of soundless chemical demolition agents. Journal of construction engineering and management, vol. 122, no. 2, pp.193−195. https://doi. org/10.1061/(ASCE)0733-9364(1996)122:2(193)
Hu, S.B., Zhang, L., Cai, Y.K., Pang, S.G., Yan, Z.Y., Zhang, Q. 2024. Study on the influence factors of rock breaking by supercritical CO2 thermal fracturing. Petroleum Science, vol. 21, no. 6, pp.4328−4343. https://doi.org/10.1016/j.petsci.2024.07.028
Ishida, T., Aoyagi, K., Niwa, T., Chen, Y., Murata, S., Chen, Q., Nakayama, Y. 2012. Acoustic emission monitoring of hydraulic fracturing laboratory experiment with supercritical and liquid CO2. Geophysical Research Letters, vol. 39, no.16, pp. 1−6. https://doi.org/10.1029/2012GL052788
Jana, S. 1991. Non-explosive expanding agent–an aid for reducing environmental pollution in mines. Indian Mining and Engineering Journal, vol. 1, no. 1, pp.31−35.
Jimeno, C.L., Jimeno, E.L., Carcedo, F.J.A., De Ramiro, Y.V. 1995. Drilling änd blasting of rocks. USA CRS Press, 41, pp. 35947.
Jin, Z.Z., Liao, H., Zhu, W. 1988. Splitting mechanism of rock and concrete under expansive pressure. Proceedings of Demolition and Reuse of Concrete and Masonry. 1st ed. CRC press. Hong Kong, pp.141−148.Kitzinger, F. and Nantel, J., Noranda Inc, 1992. Plasma blasting method. U.S. Patent 5,106,164.
Kolle, J.J. 2000. November. Coiled-tubing drilling with supercritical carbon dioxide. Proceedings of SPE/CIM international conference on horizontal well technology, SPE/CIM international conference on horizontal well technology, Alberta, pp. 1−9. https://doi.org/10.2118/65534-MS
Kyelgyenbai, K., Pysmennyi, S., Chukharev, S., Purev, B., Jambaa, I. 2021. Modelling for degreasing the mining equipment downtime by optimizing blasting period at Erdenet surface mine. In E3S Web of Conferences EDP Sciences, vol. 280, no. 1, pp. 08001. https://doi.org/10.1051/e3sconf/202128008001
Laefer, D.F., Ambrozevitch-Cooper, N., Huynh, M.P., Midgette, J., Ceribasi, S., Wortman, J. 2010. Expansive fracture agent behaviour for concrete cracking. Magazine of Concrete Research, vol. 62, no.6, pp.443−452. https://doi.org/10.1680/
macr.2010.62.6.443
Laskovenkov, A.F., Zhernakov, V.I. 1995. An update on the Ural emerald mines. Gems and Gemology, vol. 31, no. 2, pp. 106−113.
Lee, B., Shin, Y., Jang, B., Hur, K. 2018. July. Waterless fracturing for shale gas/oil production using plasma blasting. Proceedings of the 45th EPS Conference on Plasma Physics, Prague, pp. 2−6.
Li, Q.Y., Chen, G., Luo, D.Y., Ma, H.P., Liu, Y. 2020. An experimental study of a novel liquid carbon dioxide rock-breaking technology. International Journal of Rock Mechanics and Mining Sciences, vol. 128, no. 1, pp.104244. https://doi.org/10.1016/j. ijrmms.2020.104244
Liu, S., Cui, Y., Cui, S., Li, Z., Zhou, F., Wang, H. 2021. Experimental investigation on rock fracturing performance under highpressure foam impact. Engineering Fracture Mechanics, vol. 252, no. 1, pp.107838−107851. https://doi.org/10.1016/j. engfracmech.2021.107838
Maneenoi, N., Bissen, R., Chawchai, S. 2022. Influence of admixtures on the performance of soundless chemical demolition agents and implications for their utilization. Journal of Sustainable Mining, vol. 21, no. 2, pp. 93−111. http://dx.doi. org/10.46873/2300-3960.1350
Manyepa, J., Mutambo, V. 2021. Approaches for designing extraction methods for randomly occurring pocket formation of gemstones: A case of Musakashi emerald area, Solwezi, Zambia. Journal of Mining and Environment (JME), vol. 12, pp. 605−618. https://doi.org/10.22044/jme.2021.10661.2024
Mashikinyi, M. 2020. Investigating the technical, financial and regulatory challenges in the Zambian gemstone mining sector: a case study of gemcanton investment holdings limited. PhD Thesis, The University of Zambia, Lusaka
Maubane, I., Ngwenyama, P.L. 2025. The use of soundless chemical demolition agents in large scale in situ rock breaking applications in the mining industry. Journal of the Southern African Institute of Mining and Metallurgy, vol. 125, no. 7, pp. 371−384. https://doi.org/10.17159/2411-9717/3204/2025
Musunuri, A., Mitri, H. 2009. Laboratory investigation into rock fracturing with expansive cement. International Journal of Mining and Mineral Engineering, vol. 1, no. 4, pp.327−345. https://doi.org/10.1504/IJMME.2009.029318
Natanzi, A.S., Laefer, D.F., Connolly, L. 2016. Cold and moderate ambient temperatures effects on expansive pressure development in soundless chemical demolition agents. Construction and Building Materials, vol.110, no. 1, pp.117−127. https://doi.org/10.1016/j.conbuildmat.2016.02.016
Natanzi, A.S., Laefer, D.F., Kakali, G., Iman Zolanvari, S.M. 2019. Temperature-induced chemical changes in soundless chemical demolition agents. Journal of Materials in Civil Engineering, vol. 31, no. 7 pp.04019098. https://doi.org/10.1061/(ASCE)MT.19435533.0002653
Netecha, M.V., Shevchenko, S.V., Strilets, O.P. 2017. Jaspilites and other gemstones of post-jaspilite genesis: Mining, treatment, and enhancement. Scientific Bulletin of National Hirnichoho University, vol. 1, no. 17, pp. 28−33. https://nbuv.gov.ua/UJRN/ Nvngu_2017_2_6
Paraszczak, J., Planeta, S. 2003. Feasibility of Narrow Vein Mining Using a Mechanical Rock Splitter. Mine Planning Equipment. Vol. 1, no. 1, pp.415-422.
A comprehensive evaluation of non-explosive rock fragmentation techniques
Persson, P.A., Holmberg, R., Lee, J., 2018. Rock blasting and explosives engineering. 1st ed. CRC press, Boca Raton. https:// doi.org/10.1201/9780203740514
Pickering, R.G.B., Young, C. 2017. Controlled foam injection: A new and innovative non-explosive rockbreaking technology. Journal of the Southern African Institute of Mining and Metallurgy, vol. 117, no. 3, pp.237−243. https://doi.org/10.17159/24119717/2017/v117n3a5
Rudakov, M., Babkin, R., Medova, E. 2021. Improvement of working conditions of mining workers by reducing nitrogen oxide emissions during blasting operations. Applied Sciences, vol. 11, no. 21, pp.9969−9982. https://doi.org/10.3390/app11219969
Sakhno, I., Sakhno, S. 2024. Directional fracturing of rock by soundless chemical demolition agents. Heliyon, vol. 10, no. 4, pp. 1−20. https://doi.org/10.1016/j.heliyon.2024.e26068
Shang, J., Zhao, Z., Aliyu, M.M. 2018. Stresses induced by a demolition agent in non-explosive rock fracturing. International Journal of Rock Mechanics and Mining Sciences, vol. 107, no. 1, pp. 172−80. https://doi.org/10.1016/j.ijrmms.2018.04.049
Singhal, R.K. 2014. Mechanical excavation in mining and civil industries. International Journal of Mining, Reclamation and Environment, vol. 28, no. 3, pp.214−214. https://doi.org/10.1080/ 17480930.2014.912821
Tang, W., Zhai, C., Xu, J., Sun, Y., Cong, Y., Zheng, Y. 2021. The influence of borehole arrangement of soundless cracking demolition agents (SCDAs) on weakening the hard rock. International Journal of Mining Science and Technology, vol. 31, no. 2, pp.197−207. https://doi.org/10.1016/j.ijmst.2021.01.005
Vogt, D. 2016. A review of rock cutting for underground mining: past, present, and future. Journal of the Southern African Institute of Mining and Metallurgy, vol. 116, no. 11, pp.1011−1026. https://doi.org/10.17159/2411-9717/2016/ v116n11a3
ESGS CONFERENCE 2026
CLIMATE CHANGE IN MINING
Risks, Governance, Sustainability, and Environmental Management
DATE: 26-27 AUGUST 2026
VENUE:
Wang, L., Duan, K., Zhang, Q., Li, X., Jiang, R. 2022. Study of the dynamic fracturing process and stress shadowing effect in granite sample with two holes based on SCDA fracturing method. Rock Mechanics and Rock Engineering, vol. 55, no. 3, pp.1537−1553. https://doi.org/10.1007/s00603-021-02728-0
Wang, L., Duan, K., Zhang, Q., Li, X., Jiang, R., Zheng, Y. 2023. Stress interference and interaction between two fractures during their propagation: insights from SCDA test and XFEM simulation. International Journal of Rock Mechanics and Mining Sciences, vol. 169, no. 1, pp.105431−105445. https://doi. org/10.1016/j.ijrmms.2023.105431
Wang, M., Huang, K., Xie, W., Dai, X. 2019. Current research into the use of supercritical CO2 technology in shale gas exploitation. International Journal of Mining Science and Technology, vol. 29, no. 5, pp.739−744. https://doi.org/10.1016/j. ijmst.2018.05.017
Wang, Y.S., You, B.K., Zhang, G.Q. 1988. Application of soundless cracking agent in China. Proceedings of Demolition and Reuse of Concrete and Masonry. Japan: [publisher unknown], pp.149.
Zhang, F., Yang, L., Hu, Y., Ma, J., Liu, N., Yang, R. 2025. Experimental and Numerical Study on Mechanical Response Mechanism of Granite Under Coupled Confining Pressure and Blasting Load. Rock Mechanics and Rock Engineering, vol. 58, no. 2, pp.1617−1637. https://doi.org/10.1007/s00603-024-04295-6
Zhou, H., Xie, X., Feng, Y. 2018b. March. Rock breaking methods to replace blasting. In IOP Conference Series: Materials Science and Engineering, vol. 322, No. 2, pp. 022014−022021 https:// iopscience.iop.org/article/10.1088/1757-899X/322/2/022014
Zwaan, J.H., Seifert, A.V., Vrána, S., Laurs, B.M., Anckar, B., Simmons, W.B.S., Falster, A.U., Lustenhouwer, W.J., Muhlmeister, S., Koivula, J.I., Garcia-Guillerminet, H. 2005. Kafubu Area, Zambia. Gems and Gemology, vol. 41, no. 2, pp.

Building on the success of the inaugural 2025 event, the second ESGS Conference in 2026 will focus on the overarching theme of Climate Change in Mining. The conference will bring together mining leaders, policymakers, financiers, and sustainability experts to explore how the industry can adapt, innovate, and thrive in the face of climate challenges.
Affiliation:
1 Faculty of Mining Engineering, Kim Chaek University of Technology, Democratic People’s Republic of Korea
2 School of Science and Engineering, Kim Chaek University of Technology, Pyongyang 999093, Democratic People’s Republic of Korea
3 Faculty of Mechanical Engineering, Pyongyang University of Transport
Correspondence to: U.C. Han
Email: huch8272@163.com
Dates:
Received: 21Jul. 2022
Revised: 8 Feb. 2025
Accepted: 2 Mar. 2026
Published: May 2026
How to cite:
Paek, I.C., Han, U.C., Tae, I.K., Jong, K.S., Kim, C.I., Thak, P.J. 2026. Analysing the energy consumption according to the type of dump scroll track during skip discharging of an inclined shaft hoist in an open pit mine. Journal of the Southern African Institute of Mining and Metallurgy, vol. 126, no. 5, pp. 319–326
DOI ID:
https://doi.org/10.17159/2411-9717/2187/2026
ORCiD:
U-C. Han
http://orcid.org/0000-0002-0677-714X
Analysing the energy consumption according to the type of dump scroll track during skip discharging of an inclined shaft hoist in an open pit mine
by I.C. Paek1, U.C. Han2, I.K. Tae1, K.S. Jong1, C.I. Kim1, P.J. Thak3
Abstract
This paper analyses the energy consumption according to the type of dump scroll track during skip discharging in an inclined shaft hoist for an open pit mine. For the purpose of the project, it was necessary to set up an equation for a geometrical locus of a skip dump scroll track, and from the need for technical engineering and study purposes, to derive equations for two track types by using cam design theory (cosine track and linear accretion track). Skip discharging is analysed using discrete element method software, and dynamic simulation of its run is performed using Visual Nastran software. The energy consumption during skip discharging can be calculated from the rope tension obtained by dynamic simulation, and graphs obtained from the simulated results using discrete element method and Visual Nastran software. From this, the study demonstrates that the energy consumption at the cosine track is always lower than that at the linear accretion track, without regard to the property change of a payload depending on grain size distribution.
Keywords
open pit mine, inclined shaft hoist, dump scroll track, skip discharging
Introduction
A mine hoist is an essential part of an underground mine. In addition to extracting the ore from the mine, this machine transports the miners from the surface to the various underground levels of the mine (Giraud, Galy, 2018).
Skip hoists are the main haulage units transporting minerals on the surface. Tiley (2011) recognised six drum hoist arrangements (single drum, divided single drum, differential drum, double drum, double-drum Blair, and bicylindrical conical) and two friction hoist arrangements (ground-mounted Koepe and tower-mounted Koepe). Bail-type and most uni-body skips use fixed dump scroll tracks to initiate skip discharge. These tracks are mounted to the headframe structure, and the skip travels into them by interfacing with rollers on the skip (Gorzalczynski, 2014). Rokita (2016) precisely describes the computational models developed for the currently used sheaves in mine skip hoists and presents the results of the strength calculations. Plachno (2018) has carried out a mathematical model of transverse vibration experienced by high-capacity mining skips due to misalignment of the guiding tracks in the hoisting shaft while traversing it.
Until now, dynamic research on the skip dump cycle has received much attention because of the large dynamic force presented by the skip discharging via the dump scroll track. Most studies have focused on the skip structure, kinematics, and skip dynamics during discharging.
Many attempts have been made to determine the relationship between structural dimensions such as cross-section and rib distance; after which, they determine optimised structural parameters and main factors affecting the strength coefficient of the skip (Jin, Zhang, 2014).
Yan (2012) further demonstrated the utility of virtual design by completing 3D modelling, virtual assembly, and motion simulation of an up-open fan gate mine skip using Pro/Engineer software. This approach allows for the early detection of static and dynamic interference faults prior to manufacturing, thereby facilitating design optimisation, shortening the development cycle, and reducing costs. According to Gorzalczynski (2014), the largest force on the skip structure comes from redirecting the discharging muck stream from the bucket into the headframe dump chute. In addition, under poor alignment conditions of guide rollers and wear shoes, severe impact forces can be imparted into the roller assembly and scroll tracks upon negotiating the skip dump cycle. Gorzalczynski has reported that this loading slowly moves the guide from its theoretical position and affects the alignment requirement
Analysing the energy consumption according to the type of dump scroll track during skip discharging
between the scroll entry point and the dump roller on the skip.
More recently, Yin et al. (2022) investigated the impact wear characteristics of the skip liner, a primary component subjected to direct impacts and friction from coal. By designing a skip tester and combining it with experimental analysis, they found that liner failure results from both impact and abrasive wear, with higher impact velocities and coking coal causing greater wear severity. Their study provides valuable insights into the optimisation of liner materials and parameters to improve service life.
Yan and Liu (2007) have proposed a smoothness of skip discharging for optimisation aimed to improve the balance grade of the impulsive force between the skip and the dump scroll track during the dump cycle of an overturning skip of a shaft hoist and have established an optimal design model for a dump scroll track. Based on this model, they determined that an optimal solution can be found through the use of ideal point law; the impulsive force on the dump roller and the acceleration of the dump roller were decreased, and the smoothness of discharging was also enhanced.
Several studies have analysed the influence on kinematics and dynamics of a skip by the type of dump scroll track. More recent evidence showed that the larger the frictional coefficient between the coal and the skip's arc gate and the skip's initial speed, the larger the impulsive force on the dump scroll track. Yan et al. (2006) analysed the motion of the skip's arc gate as it travels along the dump scroll track, which is composed of a straight line, a curve, and another straight line. Building on this kinematic analysis, they conducted a dynamic analysis of the impulsive force between the dump roller and the dump scroll track using LabVIEW software. Their results demonstrated that a larger frictional coefficient between the coal and the arc gate, as well as a higher initial skip speed, lead to a greater impulsive force on the dump scroll track.
Xiao and Zhang (2003) have described the advantages and disadvantages of a movable dump scroll track and a fixed dump scroll track for overturning the skip. They analysed the problems using two dump scroll tracks and determined the transverse force on the guide of skip through theoretical analysis and mathematical derivation. Also, they determined the allowable creep speed of the skip and suggested the method of calculating the radius of a dump scroll track.
It is well known that energy problems are presented as a pressing issue. So, in the design branch, energy consumption in the operation process becomes the main design parameter, and studies to reduce energy consumption are being identified. As described in the aforementioned, similar research data for energy consumption during skip discharging at an inclined shaft hoist in Unryul open pit mine is limited. This paper presents the results of investigations into how the type of dump scroll track influences energy consumption during skip discharging. The linear accretion and cosine curves are selected as the geometrical locus of dump scroll tracks for a skip from cam design theory, which has a small acceleration variation. Then, the skip discharging process on two dump scroll tracks is simulated using DEM and Visual Nastran software, which provided an evaluation of comparison.
Structure of the skip
The detailed structure of the skip of the inclined shaft hoist in an open pit mine is shown in Figure 1. As shown in Figure 1, the skip consists of a bucket (1) and trolley (2), and there is an axis of the bucket revolution (8 and 9) during skip discharging, and the dump roller (4) moving via the dump scroll track. Also, a trolley consists of the door (10), which prevents the outflow of the payload when
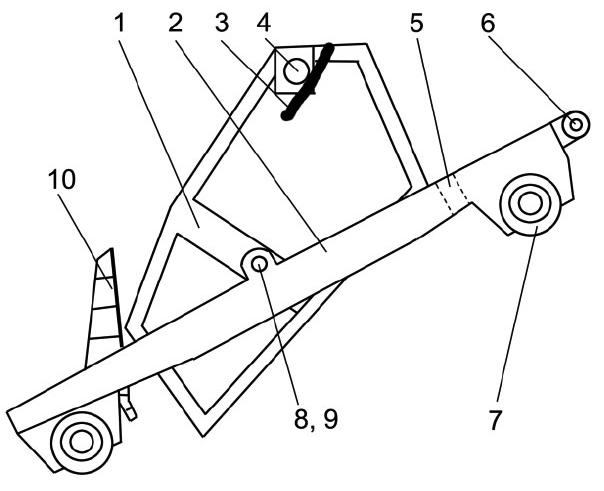
loads skip with a payload and the skip moves on the subgrade, a bearing of the bucket, a coupling link for the hoisting rope (3), as well as a wheel (4) and lip (5) for supporting the bucket. During the loading and moving of the skip, two points of bearing and lip support the bucket, and the distance between the bucket and the door fixed to the trolley is very small so that rocks do not spill out. In the discharging area, the skip will move at 1 m/s with a creep speed of 0.5 m/s, the dump roller enters into the dump scroll track and the bucket rotates around a bearing. Then, the distance between the bucket and the door gets bigger, and the payload begins to be discharged.
Selecting a geometrical locus of dump scroll track
A geometrical locus of dump scroll track must be designed in order to simulate the skip discharging process (Figure 2).
The equation for the geometrical locus of a dump scroll track can be described as shown in the following:
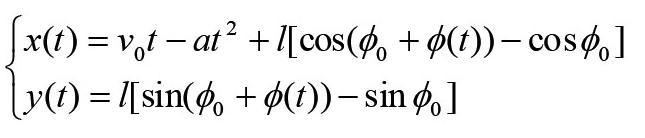
Where Ø(t) is the rotation angle of the skip bucket over time; X(t) and y(t) are individually x, y- coordinates of a geometrical locus at any time t; v0 is the initial speed of the skip entering into the dump scroll track, m/s; α is the deceleration of the skip during skip discharge, m/s2; l is the distance from the dump roller to the rotation centre of the bucket, m; Ø0 is the angle between (AO) – and (OO’) –, °; Ø(t) is a function of the rotation angle of the bucket.
As shown in Equation 1, x(t) and y(t) can be obtained by Ø(t) When a geometrical locus of a dump scroll track for a large capacity
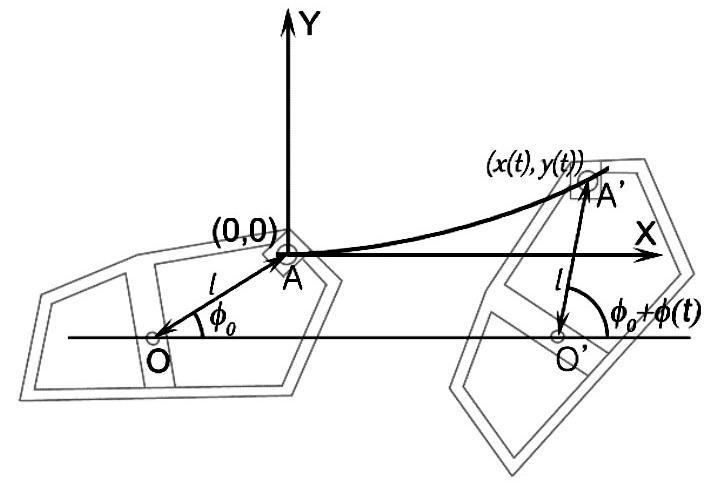
Figure 1— 1. bucket, 2. trolley, 3. dump scroll track, 4. dump roller, 5. lip for supporting bucket, 6. coupling link for hoisting rope, 7. wheel, 8.,9. axis of bucket revolution, 10. door fixed to trolley
Figure 2—Skip bucket moving via a dump scroll track
Analysing the energy consumption according to the type of dump scroll track during skip discharging
skip is designed, the following condition must be adhered to, that is, a derivative at the starting point of a geometrical locus must be equal to zero. If not, at the specific moment that the skip enters the dump scroll track, the scroll rollers will not run smoothly, and the impact load occurs. Therefore, to analyse and select the geometrical locus of a dump scroll track from an energy consumption point of view, two lows of change of Ø(t) are introduced, namely (Rothbart, 2004):
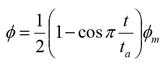
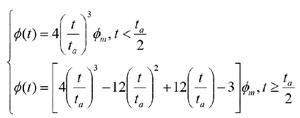
Where ta is the discharging time of the skip, s; Øm is the maximum rotation angle of bucket, °.
Equation 2 is derived from the simple harmonic motion curve and Equation 3 is derived from the 2-3 polynomial cam curve (Rothbart, 2004). These expressions are substituted into Equation 1, and then, two equations for a geometrical locus of dump scroll tracks can be obtained, respectively. Ultimately, in this paper, they are called the cosine track and linear accretion track, respectively. These track curves are shown in Figure 3.
Simulation and analysis of the skip discharging process by discrete element method (DEM)
For a dynamic simulation of the skip discharging process, the
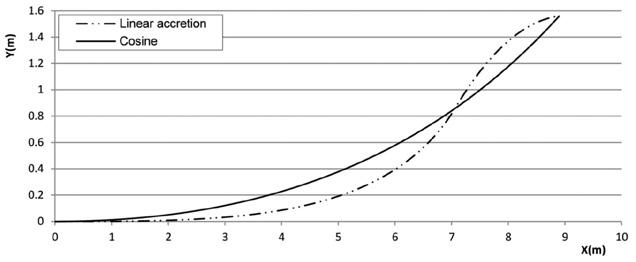
Table 2
Parameters for interaction between cherty limestone and steel
Table 3
Grain size distribution of cherty limestone grain in bucket
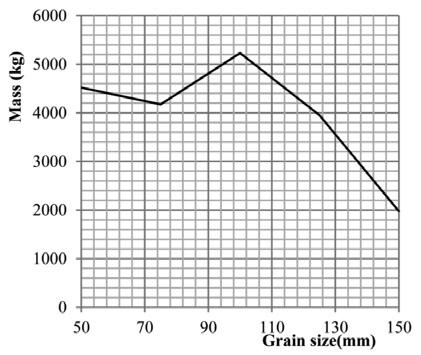
discharging characteristic must be analysed, which results in analysing the change characteristic of the mass of the skip payload. Many factors affect the discharging characteristics, which differ for each skip load. In this section, assuming that the cherty limestone with a certain grain size distribution is loaded on the skip bucket, the skip discharging process is simulated, whereafter the change of the discharging characteristic for the change of the grain size distribution of the payload is considered.
Cherty limestone is selected as the material for simulation, as it is the principal component of the top rock of the Youth ore district in the Unryul mine. Material properties needed for simulation are shown in Tables 1 to 3 (Gang, 2018).
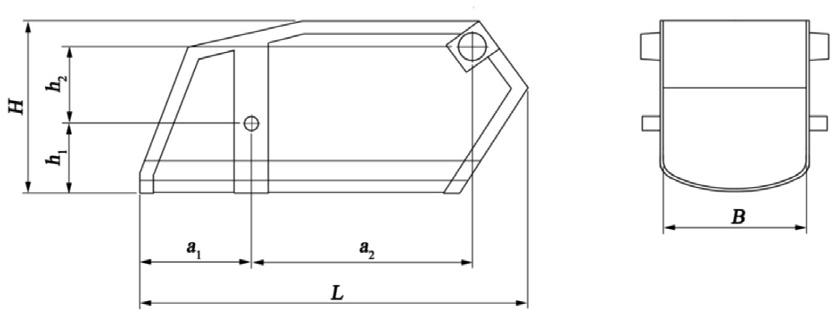
Figure 3—Two track curves
Table 1
Properties of cherty limestone and steel
Figure 4—Size distribution of grain
Figure 5—Structure scheme of the bucket
Analysing the energy consumption according to the type of dump scroll track during skip discharging
Table 4
Size and mass of the bucket
In the simulation, it is assumed that the type of payload grain is rectangular due to the operational load and that its size is not less than 50 mm, after which the skip discharging process on two dump scroll tracks is simulated.
The data for cherty limestone shown in Table 3 and Figure 4 are obtained by repeatedly measuring in the exact same position. The structure scheme of the bucket is shown in Figure 5, and the structural parameters and motion characteristic values are given in Tables 4 and 5.
Table 5
Table 6
Rotation angles of the bucket on two types of dump scroll tracks
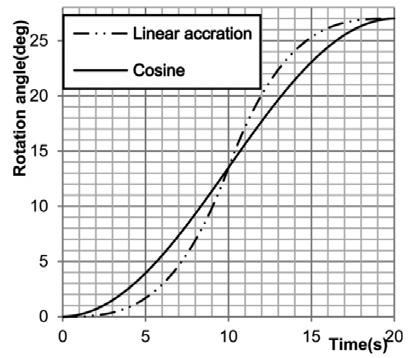
In the simulation, the area of the dump scroll track is divided into 100 partitions, and the rotation angles of the bucket at 20 positions are listed in Table 6 and Figure 6.
The simulation results for the skip discharging process on the linear accretion track and cosine track are shown in Figures 7 and 8, respectively.
As seen in the aforementioned figures, much more payload is unloaded from a bucket on the cosine track than on the linear accretion track, that is, 12.5 s, and much more on the linear accretion track than on the cosine track, that is,17.5 s.
The mass variation contrast of payload in the bucket during the skip discharging is given in Figure 9.
During the simulation, the time needed to create material is from 0 seconds to 2.5 seconds, so the base point of the graph is 2.5 s, as shown in Figure 9. Figure 9 illustrates that the mass variation
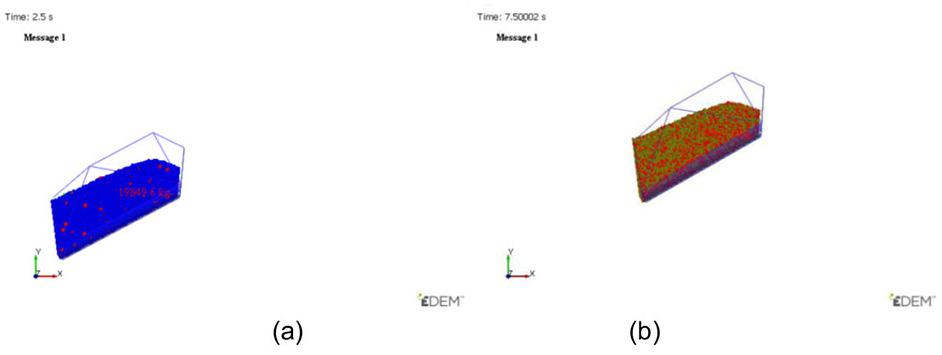
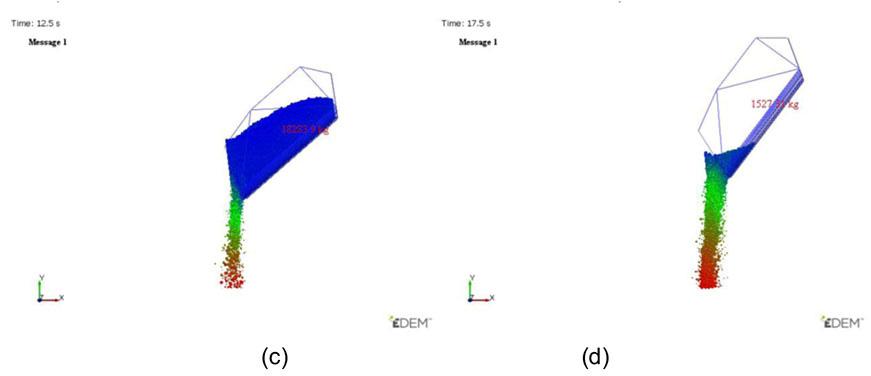
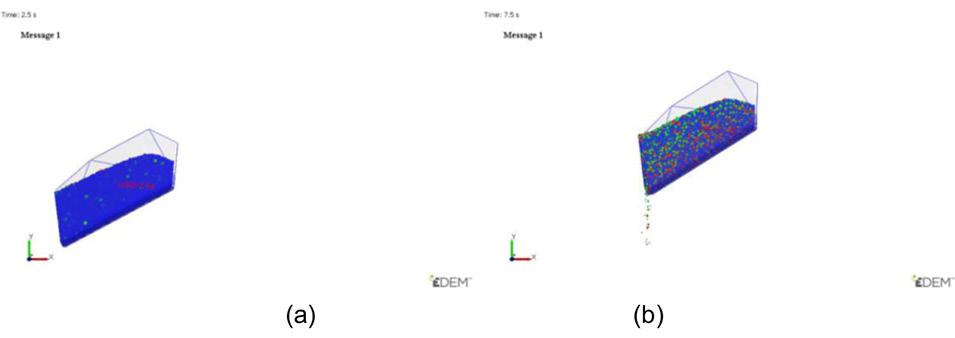
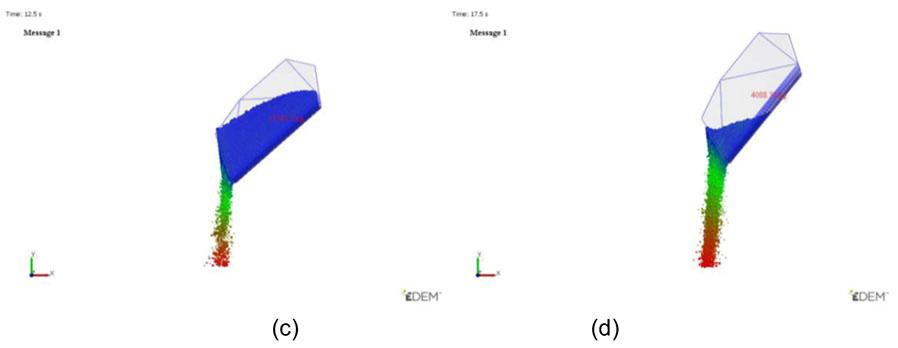
Figure 6—The rotation angle of the bucket in accordance with time
Figure 7—Simulation result for linear accretion track: a) t = 2.5 s, b) t = 7.5 s, c) t = 12.5 s, d) t = 17.5 s
Figure 8—Simulation result for cosine track; a)
Analysing the energy consumption according to the type of dump scroll track during skip discharging
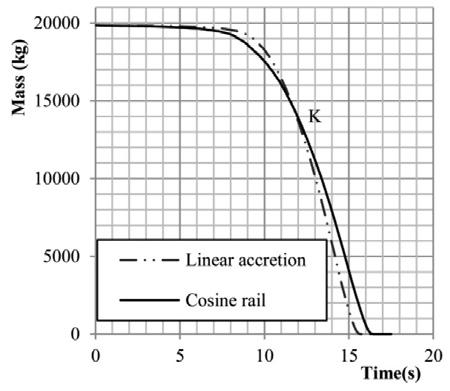
of the payload in the buckets is different from each other in accordance with time on two types of dump scroll tracks. From this, a discharging speed graph may be obtained. The discharging speed at any moment is:
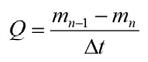
Where Q is the discharging speed, kg/s; mn-1 and mn the mass of the payload in the bucket at the calculation steps n – 1 and n, respectively, kg; and Δt is the time distance, s.
The discharging speed graphs of a loaded skip moving via the linear accretion track and cosine track are given in Figure 10.
For a definite analysis, the graph in Figure 10 b) is divided into four sections, i.e., A, B, C, and D.
Section A of the graph is not located in the discharging area, and section B is the starting area of discharging. In this section, the distance (an outlet width) between the fixed door and the bucket is too small, and the effect of the grain size on the discharging characteristics is considerable. Section C is the basic discharging area, so the outlet width is large enough to discharge, and the effect of the grain size on the discharging characteristics can be ignored
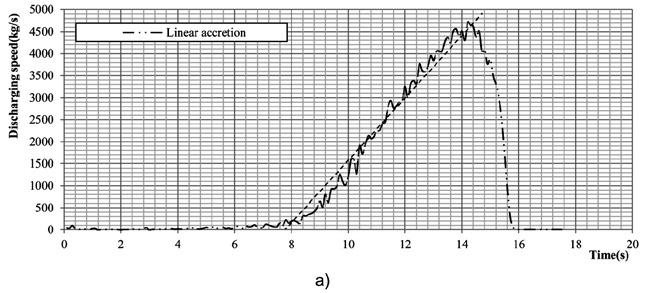
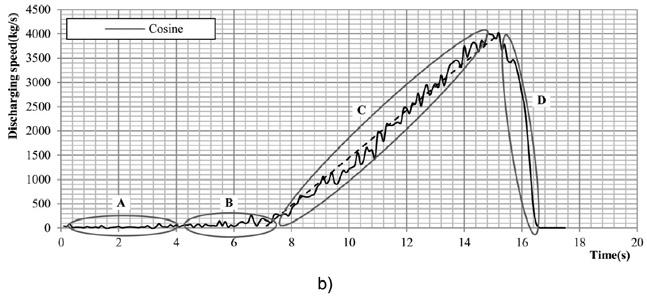
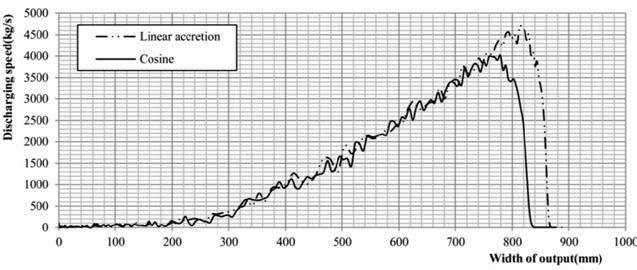
in this section. Here, the discharging speed is related to the outlet width, which is illustrated clearly through the discharging speed graph, as shown in Figure 11.
These graphs clearly show that, regardless of the variation characteristic of a dump scroll track, the discharging speed of a skip on two types of dump scroll tracks are equal under the same outlet width, thus, in this section the discharging speed is not influenced by the grain size, namely the grain size distribution.
Section D is the final area for skip discharging. The effect of the grain size change in section C, together with the discharging area, is considered. As the grain size increases, the longer it takes for section C to start, the discharging section in the graph is moved to the right on the time-axis (See Figure 9). In contrast, with the smaller grain size, the sooner section C starts, the discharging area is moved to the left. In both these cases, the gradients of the mass variation graph are almost the same as in the simulation. It is important to consider the position change of point K, as shown in Figure 9, when the grain size decreases. Up until point K, the quantity discharged on the cosine dump track is much more than that on the linear accretion track, and after point K, the quantity discharged on the linear accretion track is much more than on the cosine track. If the grain size of the payload gets smaller, point K is moved to the right in Figure 9.
The discharging speed on the cosine track is higher than on the linear accretion track, up to 10 s, while point K in Figure 9 occurs at approximately 12 s. Thus, with smaller grain sizes, section C on the cosine track starts sooner, moving point K to the right on the time-axis.
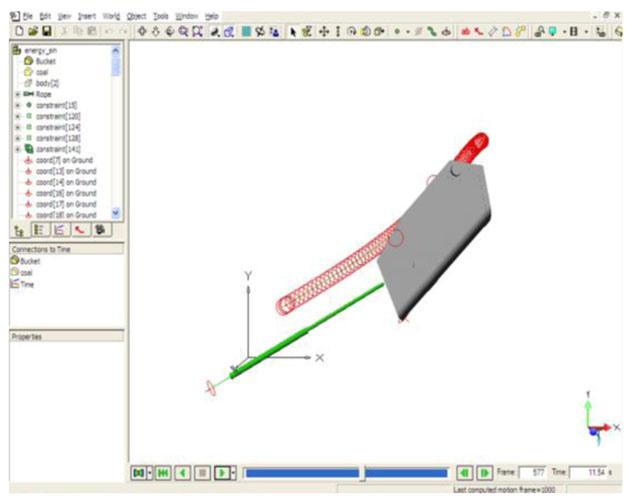
Figure 9—Mass variation of payload in the bucket during skip discharging on the linear accretion track and cosine track
Figure 10—Discharging speed graph: a) linear accretion track, b) cosine track
Figure 11—Discharging speed by outlet width for two dump scroll track types
Figure 12—Dynamic simulation of the discharging process of the bucket
Analysing the energy consumption according to the type of dump scroll track during skip discharging
Table 7 x- and y-coordinates of two dump scroll tracks
Dynamic simulation and energy analysis during skip discharging
To analyse energy consumed in skip-hoisting rope systems during skip discharging, dynamic simulation is carried out by using MSC Visual Nastran software. The dynamic simulation model for the discharging process is given in Figure 12.
The model is composed of a bucket and the payload, as well as the dump scroll track and the hoisting rope. The trolley and fixed door are ignored in the simulation because they do not affect energy change. "Revolute on slot" restraint is applied to the rounded support of the bucket to induce translation and rotary motion on the bucket. The gravity acceleration acts on the y-axis as -9.81 m/s2, and the influence of friction is ignored. The x- and y-coordinates for ten points of two dump scroll tracks are listed in Table 7, where x (28°) and y (28°) are the x- and y-coordinates rotated by 28° because the loaded skip moves on the sub-grade inclined by 28°.
From Figure 13, the energy consumed during a skip discharging is expressed as follows:
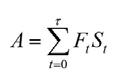
Where A is the energy consumed in the system, J; Ft is the tension of the hoisting rope at any time t, N; St is the distance travelled by the loaded skip via the dump scroll track at time t , m; and τ is the motion time, s.
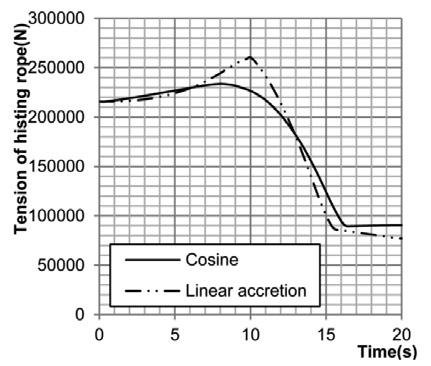
[5]
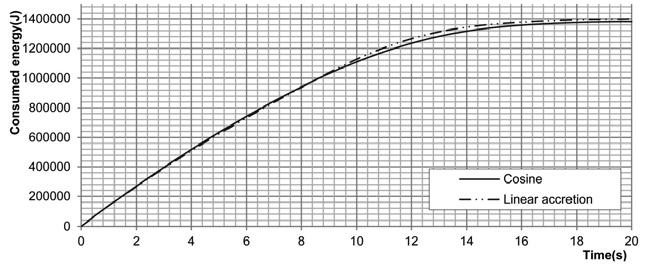
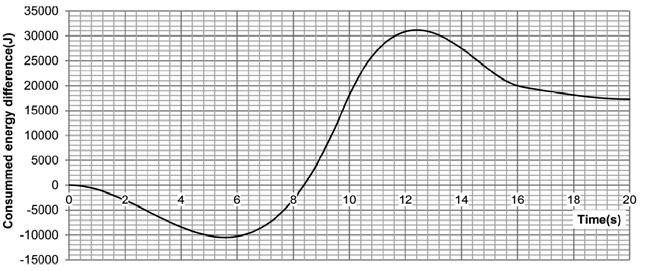
The energy that is consumed while the loaded skip discharges via the two dump scroll tracks is illustrated in Figure 14, and the difference between the energy consumed on the two dump scroll tracks is illustrated in Figure 15, respectively. The energy consumption in the entire section of discharging is 1 398 622 J on the linear accretion track and 13 813 32 J on the cosine track, so it is illustrated that the energy consumed on the linear accretion track is more significant, by 17 290 J, than that on the cosine track. Thus, the output of the hoisting system during skip discharging is: [6]
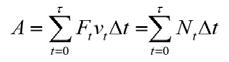
Where ∆t is the simulation step, s; V is the translation velocity of skip at time t,
and Nt is the system output at time t, W.
Figure 13—Tension variation of the hoisting rope during skip discharge
Figure 14—Energy consumed on the two types of dump scroll tracks during skip discharge
Figure 15—Difference of energy consumed on the two dump scroll tracks (based on cosine track)
Analysing the energy consumption according to the type of dump scroll track during skip discharging
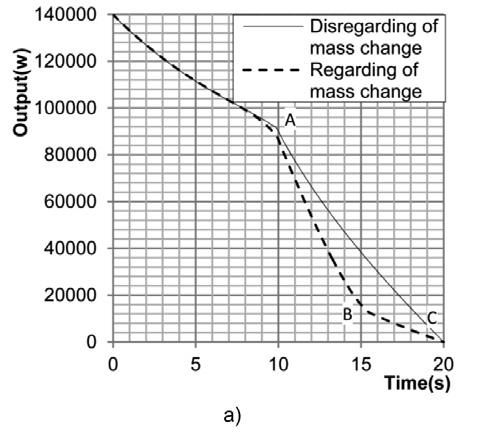
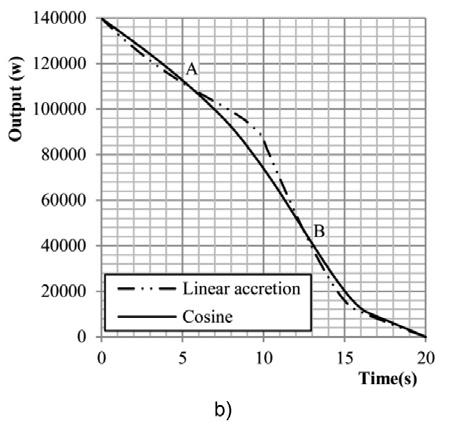
Figure 16 a) shows both output changes in the case of disregarding the mass change. Regarding the mass change, the area of closed district indicates the energy consumed during skip discharging (for the purpose of this paper, the effective area of mass variation). Figure 16 b) represents the difference of output change between the two dump scroll tracks, based on the cosine track; the output for the cosine track is significant in the section where the closed district is located below (for the purpose of this paper, the cosine inferiority area) and in contrast with this, is small in the section where the closed district is situated above (for the purpose of this paper, the cosine superiority area). As illustrated in Figure 16b, the difference in the energy consumption of the two dump scroll tracks is calculated by subtracting the area below the zero line (cosine inferiority area) from the area above the zero line (cosine superiority area) on the output difference graph.
Under this condition, the variation of energy difference depending on the property of the payload is estimated. If the commencing moment of discharging is moved to the right because the grain size gets bigger or the humidity increases, the effective area of mass variation decreases, and point B is moved towards point B'. Therefore, the energy consumption is higher on linear accretion dump scroll tracks than on cosine dump scroll tracks.
In contrast with this, namely, if the grain size of the payload is smaller than the one in the simulation, the effective area of mass variation increases and point A in Figure 17 is moved to an earlier time. Point K in Figure 9 is moved to the right on the time-axis of a point in the simulation. This illustrates that the energy consumption on the cosine dump scroll track is less than that of the linear accretion dump scroll track. The movement of point K to the right makes point B move to the right. The smaller the grain size is, the larger the area of the cosine superiority area, and the smaller the area of the cosine inferiority area. Thus, the energy difference gets higher.
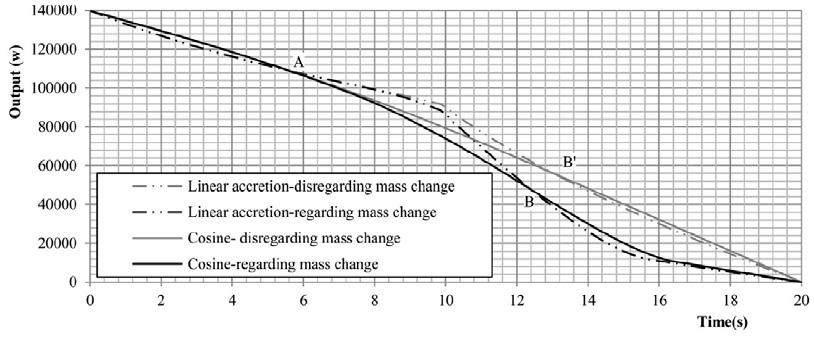
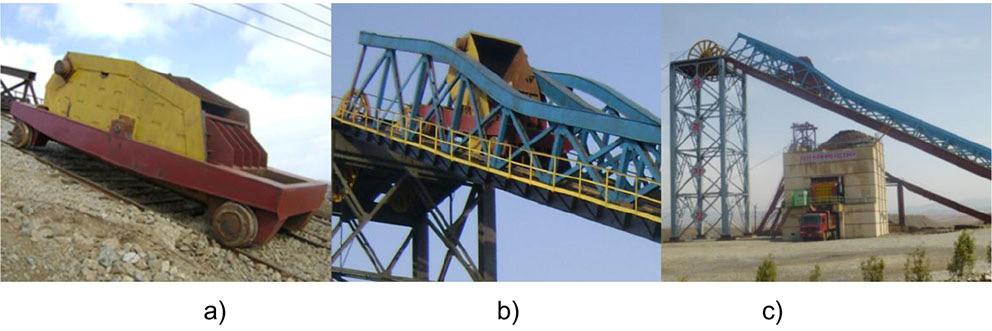
Figure 16—Graph of output change: a) reduced energy in dump process, b) difference of output change
Figure 17—The output contrast graph for two dump scroll tracks
Figure 18—The actual operational site of the skip and cosine track: a) skip with a 42-tonne payload; b) full discharged skip on the cosine dump scroll track; c) skip discharging station
Analysing the energy consumption according to the type of dump scroll track during skip discharging
Investigating the actual operation situation in field
At the time of preparing this manuscript, the inclined shaft hoisting system was in the final installation and commissioning stages. A 1600 kW rock winder with a 42-tonne capacity skip operating at a speed of 4 m/s was utilised. It is confidently anticipated that the system, once in service, will demonstrate the incremental improvements which have taken place in the Unryul mining context. Figure 18 shows a skip with a 42-tonne payload and cosine track installed at the Youth Ore district in Unryul mine.
As shown in Figure 18, the skip discharges its payload on the asymmetrical truss girder where the cosine track consists of the upper chord. Compared with the simulation results, the bucket fully discharges by rotating at 27° and then the angle of inclination between the bucket and the surface is 55°.
Conclusions
This paper has attempted to analyse the energy consumption according to the type of dump scroll track during a skip discharge at an inclined shaft hoist in an open pit mine.
When a skip discharges, the energy consumption is mainly related to the type of dump scroll track; namely, should a skip move via a dump scroll track, and the scroll rollers do not run smoothly, and the acceleration variation thereof is high, at the moment when the impact load occurs, the energy consumption of the system increases.
In this paper, the linear accretion curve and the cosine curve were selected as the geometrical locus of dump scroll tracks for a skip from cam design theory, which has a small acceleration variation. The skip discharging process on two types of dump scroll tracks was simulated by using DEM and Visual Nastran software and a comparison evaluation was provided.
In conclusion, it can be said that the energy consumption on the cosine track is less than on the linear accretion track, regardless of the property of the payload during skip discharge.
Further work is required to fully map the relationships for a design parameter of a skip dump, a scroll track, and energy.
Data availability
The data used to support the findings of this study are available from the corresponding author upon request.
Conflict of interest
The authors wish to confirm that there are no known conflicts of interest associated with this publication, and there has been no significant financial support for this work that could have influenced its outcome.
Credit author statement
In Chol Paek: Conceptualisation, methodology, software; Un Chol Han: Data curation, writing, original draft preparation; Il Kwang Tae: Investigation; Kwang-Sok Jong: Supervision, funding; Chang-Il Kim: Writing, reviewing and editing; Phyong Jon Thak: software.
Acknowledgements
This study is financially supported by the Scientific and Technological Advance of DPR Korea (Grant No. 2017-08-730621).
References
Gang, G. 2018. Study on the application of rational combined haulage system in deep open pit mine. PhD thesis, Kim Chaek University of Technology, DPR Korea.
Giraud, L., Galy, B. 2018. Fault tree analysis and risk mitigation strategies for mine hoists. Safety Science, vol. 110, pp. 222−234. https://doi.org/10.1016/j.ssci.2018.08.010
Gorzalczynski, S. 2014. Lightweight skips-Factors influencing operational reliability. In Proceedings of the Seventh International Conference on Deep and High Stress Mining, Australian Centre for Geomechanics, Perth, pp. 533-543. https:// doi.org/10.36487/ACG_rep/1410_37_Gorzalczynski
Jin, H. W., Zhang, X. 2014. The Structural Optimization of Large Capacity Skip Based on ANSYS. In Advanced Materials Research, vol. 1037, pp. 75–78. Trans Tech Publications, Ltd. https://doi.org/10.4028/www.scientific.net/amr.1037.75
Plachno, M. 2018. Mathematical model of transverse vibrations of a high-capacity mining skip due misalignment of the guiding tracks in the hoisting shaft. Archives of Mining Sciences, vol. 63, no.1, pp. 3−26. https://doi.org/10.24425/118882
Rokita, T. 2016. Tests and examination of drive sheave in mine skip hoist. Archives of Mining Sciences, vol. 61, no. 2, pp. 415−424. https://doi.org/10.1515/amsc-2016-0030
Rothbart, H.A. 2004. Cam design handbook. McGraw-Hill, pp.27−91.
Tiley, P. 2011. Hoisting systems. In SME Mining Engineering Handbook. 3rd ed. Littleton, CO: SME. pp.20−1296.
Xiao, Y., Zhang, Z. 2003. Some issues need to be noticed in dump track design of bottom dumping skip. Nonferrous Mines, vol. 32, no. 3, pp. 25−27. (in Chinese).
Yan, M. 2012. 3D Modeling and Motion Simulation of Mine Skip Getting through Dump Rail Based on Pro/E. Advanced Materials Research, Vols. 557−559, pp 2176−2180. https://www. scientific.net/AMR.557-559.2176
Yan, M., Liu, L. 2007. Optimal design of dump rail curve parameter of skip with up- open fan gate. Journal of China Coal Society, vol. 32, no. 10, pp. 1102−1104. (in Chinese).
Yan, M., Liu, L., Shi, B. 2006. Dynamic stress analysis of dump rail during skip with up-open fan gate getting through dump rail. Journal of China Coal Society, vol. 31, no. 3, pp. 391−395. (in Chinese).
Yin, Z., Li, T., Wang, N., Mi, Z. 2022. Experimental study on impact wear characteristics of the skip liner under different impact velocities and coal types. Advances in Mechanical Engineering, Vol. 14(6), pp. 1–16. https://doi. org/10.1177/16878132221106914 u
NATIONAL & INTERNATIONAL ACTIVITIES
2026
22-26 June 2026 — Management in Mineral Exploration
University of the Witwatersrand, Johannesburg
Contact: Camielah Jardine
Tel: 011 538-0237
E-mail: camielah@saimm.co.za
Website: http://www.saimm.co.za
24-25 June 2026 — Global Best Practices in Thickener and Dewatering Operations for Low-Grade and Complex Deposits Conference 2026
Introduce advanced solutions to improve thickener and filtration efficiencies amid changing ores
Southern Sun Rosebank, Johannesburg
Contact: Gugu Charlie Tel: 011 538-0238
E-mail: gugu@saimm.co.za
Website: http://www.saimm.co.za
7-8 July 2026 — SANIRE Symposium 2026
Balancing Judgement, Technology, and Sustainability in Rock Engineering Practices
Emperors Palace Convention Centre, Kempton Park
Contact: Gugu Charlie Tel: 011 538-0238
E-mail: gugu@saimm.co.za
Website: http://www.saimm.co.za
30-31 July 2026 — Critical Minerals 2026 Conference
From Potential To Prosperity – Building Africa’s Critical Minerals Value Chains Through Collaboration, Innovation and Governance
Royal Majestic Hotel, Rosebank, Johannesburg
Contact: Gugu Charlie Tel: 011 538-0238
E-mail: gugu@saimm.co.za
Website: http://www.saimm.co.za
18-20 August 2026 — CAVING 2026
Ulaanbaatar, Mongolia
Website: https://www.acgcaving.com/
18-21 August 2026 — SAIMM Uranium Conference 2026
Swakopmund Hotel and Entertainment Centre, Swakopmund, Namibia
Contact: Gugu Charlie Tel: 011 538-0238
E-mail: gugu@saimm.co.za
Website: http://www.saimm.co.za
26-27 August 2026 — ESGS Climate Change in Mining Conference 2026
Climate Change in Mining: Risks, Governance, Sustainability, and Environmental Management
Glenburn Lodge, Muldersdrift
Contact: Gugu Charlie
Tel: 011 538-0238
E-mail: gugu@saimm.co.za
Website: http://www.saimm.co.za
22-25 September 2026 — XIX International Society for
Mine Surveying Congress 2026
Century City, Cape Town
Contact: Gugu Charlie
Tel: 011 538-0238
E-mail: gugu@saimm.co.za
Website: http://www.saimm.co.za
7-11 September 2026 — Electra Mining Africa 2026
Expo Centre, Nasrec, Johannesburg
Contact: Gugu Charlie
Contact: Camielah Jardine
Tel: 011 538-0237
Website: http://www.saimm.co.za
21-24 September 2026 — XIX 2026 International Society for Mine Surveying Congress
Century City, Cape Town
Contact: Gugu Charlie
Tel: 011 538-0238
Website: http://www.saimm.co.za
29-30 September 2026 — 7TH Young Professionals Conference 2026
Mintek, Randburg, Johannesburg
Contact: Gugu Charlie
Tel: 011 538-0238
E-mail: gugu@saimm.co.za
Website: http://www.saimm.co.za
12-16 October 2026 — 19TH South African Geophysical Association Conference 2026
Lagoon Beach Hotel & Spa, Cape Town
Website: https://sagaconference.co.za/
18-22 October 2026 — IMPC 2026 XXXII International Mineral Processing Congress
Empowering a future-fit mineral processing industry
Cape Town, South Africa
Contact: Camielah Jardine
Tel: 011 538-0237
E-mail: camielah@saimm.co.za
Website: http://www.saimm.co.za
4-6 November 2026 — Southern African Mine Water Conference 2026
Let’s Connect
Glenburn Lodge, Muldersdrift
Contact: Gugu Charlie
Tel: 011 538-0238
E-mail: gugu@saimm.co.za
Website: http://www.saimm.co.za
11-13 November 2026 — MineSafe 2026 Mine Health and Safety Conference
Engineering Health & Safety For Sustainable Future-Ready Mines
Gallagher Convention Centre, Johannesburg, South Africa
Contact: Gugu Charlie
Tel: 011 538-0238
E-mail: gugu@saimm.co.za
Website: http://www.saimm.co.za
Company affiliates
The following organizations have been admitted to the Institute as Company Affiliates
OPTRON
Wekaba Engineering (Pty) Ltd
Jones & Wagener Pty Ltd
CYMOT (PTY) Ltd
Kelnir Projects (Pty) Ltd
DQS Pty Ltd
M84 Geotech Pty Ltd
Sulzer Pumps (South Africa) (Pty) Ltd
EKATO South Africa
CARBOCRAFT (PTY) LTD
Solenis
Pump and Abrasion Technologies (PTY) Ltd
CIGroup ACE Pty Ltd
Sebotka (Pty) Ltd
Mech-Industries (Pty) Ltd
Anton Paar Southern Africa
Trans-Caledon Tunnel Authority
acQuire Technology Solutions
EHL Consulting Engineers (Pty) Ltd
DDP Specialty Products South Africa (Pty) Ltd
Allied Furnace Consultants
Gravitas Minerals (Pty) Ltd
Mining Projection Concepts (Pty) Ltd
African Pegmatite
Ex Mente Technologies (Pty) Ltd
MLB Investments CC
Micromine Africa (Pty) Ltd
Ingwenya Mineral Processing
Maptek (Pty) Ltd
G H H Mining Machines (Pty) Ltd
OPTRON
Geobrugg Southern Africa (Pty) Ltd
Ivanhoe Mines SA
Weir Minerals Africa
Herrenknecht AG
Becker Mining (Pty) Ltd
Rosond (Pty) Ltd
Sound Mining Solution (Pty) Ltd
Roytec Global (Pty) Ltd
Caledonia Mining South Africa
Elbroc Mining Products (Pty) Ltd
Modular Mining Systems Africa (Pty) Ltd
Paterson & Cooke Consulting Engineers (Pty) Ltd
SENET (Pty) Ltd
Tomra (Pty) Ltd
Ukwazi Mining Solutions (Pty) Ltd
Arcus Gibb (Pty) Ltd
SRK Consulting SA (Pty) Ltd
ZUTARI (Pty) Ltd
Minerals Council of South Africa
Bluhm Burton Engineering Pty Ltd
Hatch (Pty) Ltd
Anglogold Ashanti Ltd
Digby Wells and Associates
AMIRA International Africa (Pty) Ltd
Malvern Panalytical (Pty) Ltd
MineRP Holding (Pty) Ltd
FLSmidth Minerals (Pty) Ltd
Glencore
Murray & Roberts Cementation (Pty) Ltd
Redpath Mining (South Africa) (Pty) Ltd
Sibanye Gold Limited
AECI Mining Chemicals, a division of AECI Mining Ltd
Exxaro Resources Limited
IMS Engineering (Pty) Ltd
Rustenburg Platinum Mines Limited - Union
Impala Platinum Holdings Limited
Mintek
The Focus for SAMCODES in 2026
In 2026, the SAMCODES and its committees will prioritise monitoring and providing feedback on developments arising from the JORC Code review and associated updates. The SSC will also focus on the review of the SAMREC Code guidelines, while continuing to advance discussions on international liaison initiatives, particularly with neighbouring jurisdictions such as Mozambique and Botswana.
In addition, the SAMREC Committee will maintain its ongoing collaborative engagement with CRIRSCO to support alignment with global reporting standards.
A dedicated LinkedIn page for SAMCODES is maintained and regularly updated to ensure that members and interested parties remain informed of current developments and industry updates. https://www.linkedin.com/company/samcodessa/
SAMCODES App

• The App offers a useful platform to access current SAMCODES information.
• The SAMCODES application has recently undergone an update, and the latest version is now availablefor download on the Google Play Store. Check out the SAMCODES App User Guide for step-by-step instructions: https://lnkd.in/emT8976z
Committee updates





International Liaison
The SAMREC Committee is currently in the process of finalising a Memorandum of Understanding (MOU) with neighbouring countries, such as Mozambique and Botswana, which are seeking support in the development of their respective reporting codes. Emphasis is being placed on the adoption of the SAMREC Code, where appropriate, to minimise duplication of existing work and ensure alignment.
The Committee held a joint workshop with the SAMREC Committee in December 2025 to review the comprehensive 200-page JORC Code survey and will provide detailed feedback in a formal report.
SAMOG Code updates were sent for public comments, and the launch event will be communicated in due course. Link to updates.
The Committee discussed strategic initiatives to diversify SAMCODES membership, with a particular focus on increasing participation from early-career professionals.
Rob Ingram has announced his retirement as Chair of the JSE Readers Panel after 26 years of dedicated service to the Johannesburg Stock Exchange and the broader minerals industry. Andy McDonald has assumed the role of Chair from 1 March 2026. We extend our sincere appreciation to Rob for his distinguished career in the mining industry and for his exemplary leadership as Chair since 2012. His meticulous record-keeping, professionalism, and unwavering willingness to assist others have made a lasting and meaningful contribution to the industry.
The UNECE Resource Management Week 2026 will be held between the 27th of April – 01st of May 2026 emphasizing the importance of UNFC classifications for strategic projects in the EU.
SSC representatives attended the Annual General Meeting of CRIRSCO that was held online on 16th March 2026.
The China Association of Mineral Resource Appraisers was officially approved as the 16th member of CRIRSCO on 16 October 2025. This development has coincided with a significant increase in traffic to the SAMCODES website, particularly from users based in China.
Management Update
Joseph Mainama who has been deputy chairperson of the SSC has taken over from Sifiso Siwela. The handover took place at the February 2026 SSC Co-patrons oversight meeting. Jacques Nel has assumed the role of deputy chairperson.