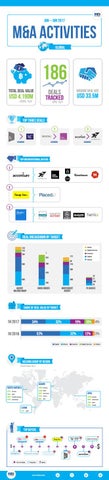
Jan – Jun 2017
M&A activities GLOBAL
186 deals tracked -9% YoY
average deal size
1
2
3
Acquiring
Acquiring
Acquiring
Total deal value
USD 4,190m -39% YoY
USD 33.5m
top three deals
TOP UNCONVENTIONAL BUYERS
1 + 2
3
deal breakdown by target Media
110 113 164
Digital Service
7
Creative
112
291
Others
50 116
169
568
Digital
365 470 32 71 145 82
480
600 245
Agency holding group
Cross border
Independent agency
PE Backed
share of deal value by target
1H 2017
34%
1H 2016
33%
19%
53%
10% 4%
32% Digital
Others
Creative
12%
3%
Digital Service
Media
HOLDING GROUP BY REGION (Deal Value $m)
EUROPE NORTH AMERICA
$303 m Dentsu $156 M WPP
$77 m Dentsu
APAC
$45 M Omnicom
$78 M WPP
$28 M Havas
$25 M Publicis Groupe
$6 M
$14 M Hakuhodo
$146 m Dentsu
IPG
$84 M Hakuhodo $73 M WPP $24 M HAVAS
LATAM $7 m
WPP
top buyers
shenzhen media group
$1
1
china media capital
2
1
1
1
1 MCH Group
No. of Deals
Acquirer
$ Value
www.rthree.com
18
5
15
$