4 minute read
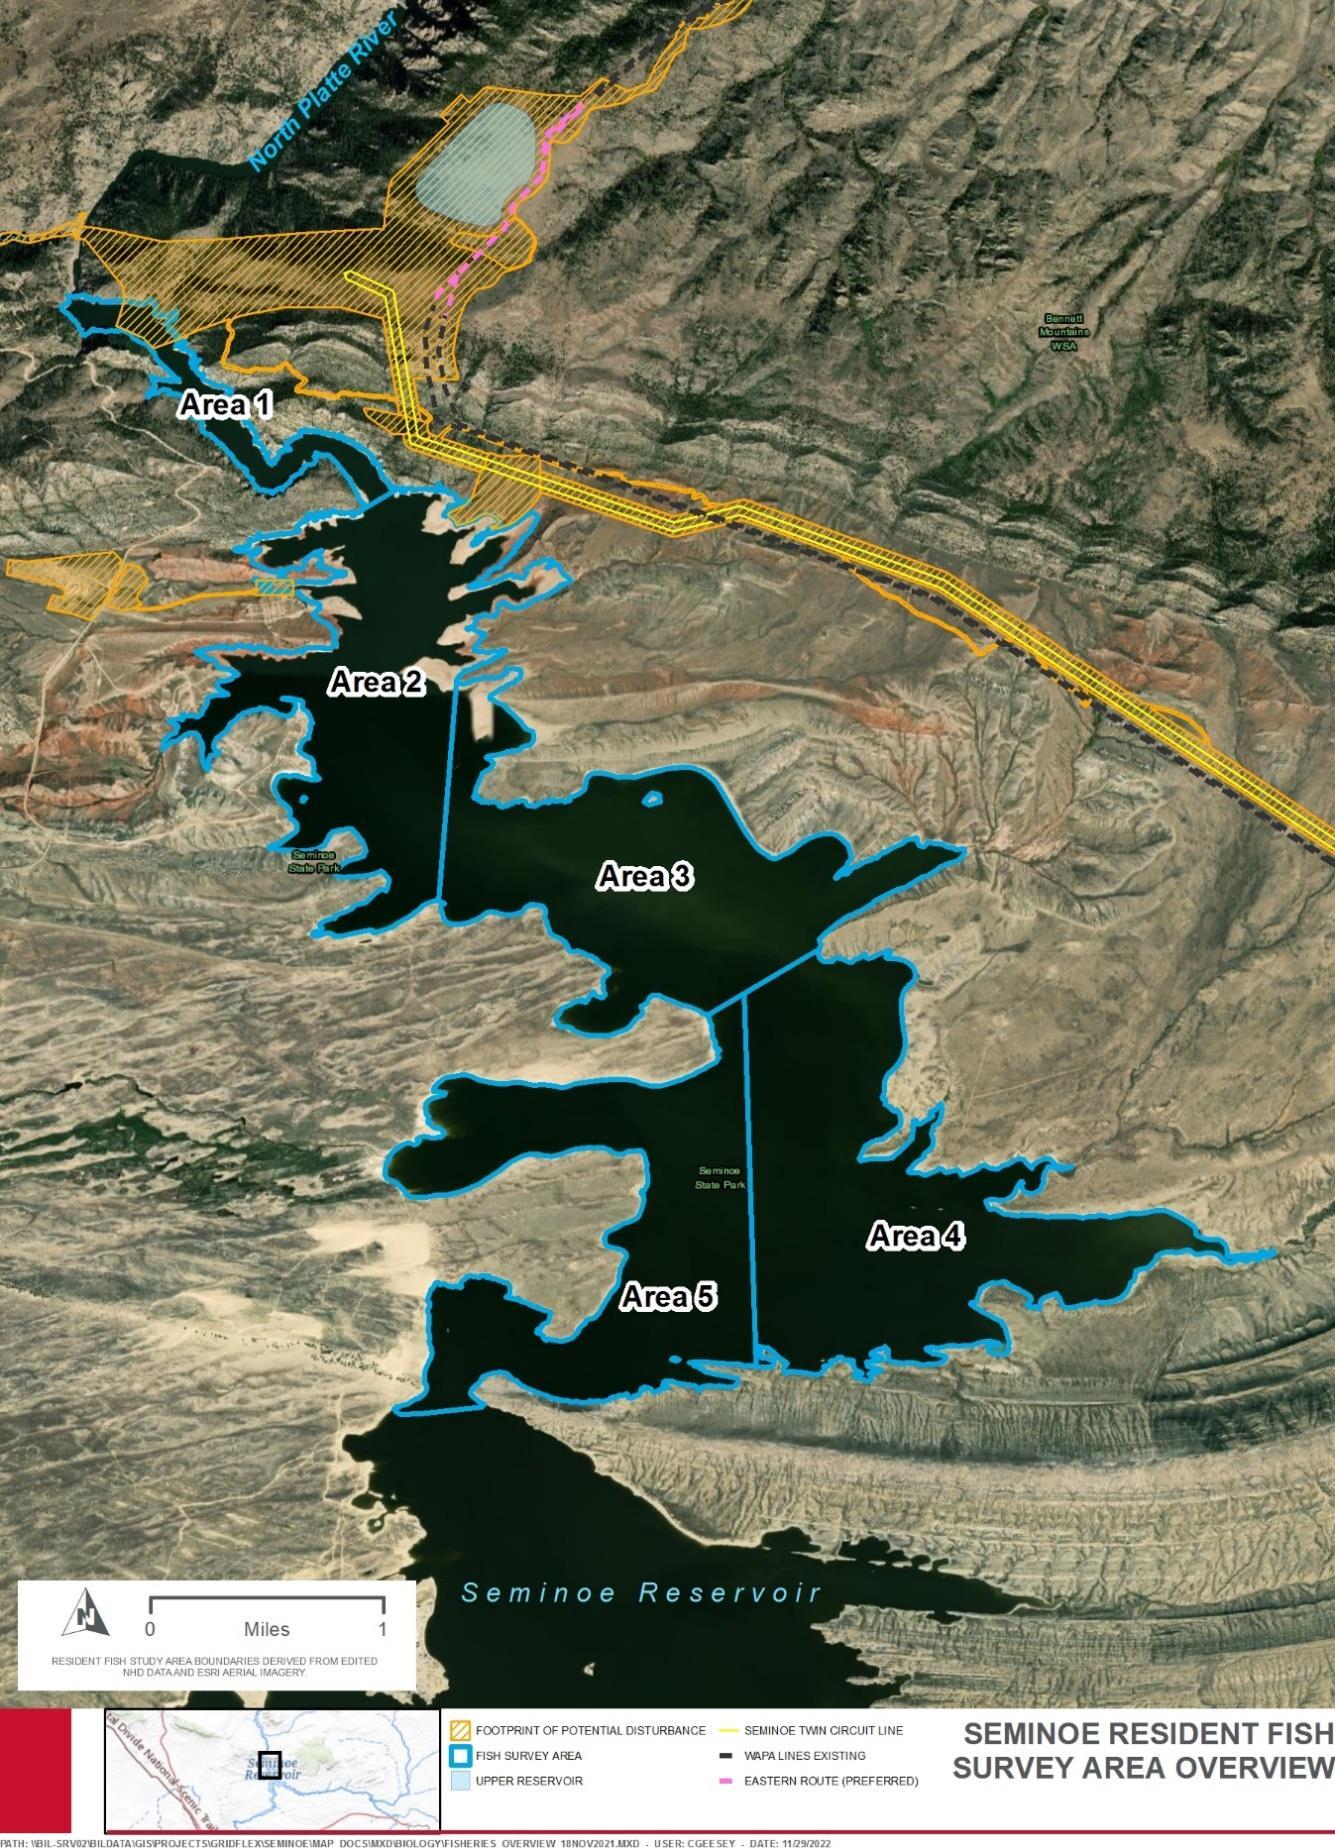
Figure 3.5-1. Seminoe Resident Fish Survey Area Overview


Figure 3.5-1. Seminoe Resident Fish Survey Area Overview
A total of 2,637 fish representing 11 species were collected from the study area during the 2021 seasonal surveys. Table 3.5-7 provides a species list, an overall total and total for each sampled area, and the overall relative abundance of the fish species collected. Table 3.5-7 also provides the number of individual fish by sampled areas and combines the results of both seasonal events and all gear types. Based on the results of the Resident Fish Survey Study (HDR 2022b), fish density was highest in Area 2 with 10 species; the highest abundance occurred in Area 5, largely due to the presence of Emerald Shiners and minnow species which comprised over 45 percent of the total catch in that area.
Table 3.5-7. Seminoe Reservoir 2021 Resident Fish Survey Catch Data Species Seminoe Reservoir Sampled Area Total Relative Common Area 1 Area 2 Area 3 Area 4 Area 5 Abundance (%)
Sucker1 (Catostomidae) 108 120 58 114 62 462 17.5
Longnose Sucker - 5 3 4 6 18 0.7 White Sucker 108 115 55 110 56 444 16.8
Carps and Minnow (Cyprinidae) 40 151 322 130 1,046 1,689 64.1
Lake Chub - - - - 1 1 0.0 Common Carp 7 16 24 18 14 79 3.0 Minnow spp. - 95 254 - - 349 13.2 Emerald Shiner 33 40 44 112 1,031 1,260 47.8
Perch (Percidae) 25 91 14 35 26 191 7.2
Jonny Darter - 9 2 3 3 17 0.6 Walleye 25 82 12 32 23 174 6.6
Trout 97 61 19 53 65 295 11.2 (Salmonidae)
Cutthroat Trout 7 8 - 1 5 21 0.8
Rainbow Trout 74 39 13 35 38 199 7.5
Brown Trout 16 14 6 17 22 75 2.8
Total Captured 270 423 413 332 1,199 2,637 100 Total Species 7 10 9 9 8 11
1 Bold text indicates cumulative family totals.
Walleye and Rainbow Trout were the most abundant species collected during the WGFD 2021 sampling as described above; however, White Sucker and the minnow species were the most abundant of the Black Canyon sampling due to the difference in sampling gear
used. Cyprinids were the most abundant and diverse group (Table 3.5-7) comprising over 64 percent of the total combined catch and consisting of at least 4 taxa. White Sucker, Walleye, and Rainbow Trout dominated most catches with Common Carp, Brown Trout, and Longnose Sucker comprising the remaining catch. The larger individuals of game species and suckers were dominant in the lower areas of the reservoirs (i.e., Areas 1 and 2) while smaller individuals of all species and minnow species were dominant in the upper sections of the reservoir (Areas 4 and 5) (HDR 2022b).
Active fish sampling consisted of 21.1 hours of boat electrofishing (actual time “on”) and 15 seine events as shown below in Table 3.5-8. Boat electrofishing was the most effective sample gear, which produced a total catch of 1,994 fish (75.6 percent) with a catch per unit effort (CPUE) of 94.65 fish per hour. While most sampling occurred during daylight hours, specific areas were targeted for night electrofishing (HDR 2022b).
Passive fish sample methods involved the deployment of gillnets for a total of 196.7 hours which included day and night sets as well as bottom (deep nets) and suspended (floating) net sets. Gillnets are beneficial in sampling deep littoral and pelagic water habitat and were used in each of the five sampled areas, resulting in a CPUE of 0.9 fish per hour (HDR 2022b).
Method Table 3.5-8. 2016 Total Effort, Catch and CPUE by Season and Gear Types
Late Spring/Early Summer Late Summer/Early Fall Total
Hours/ Events Number of Fish CPUE Hours/ Events Number of Fish CPUE Hours/ Events Number of Fish CPUE
Boat Electrofishing 8.9 (2.9)2 499 55.9 11.2 (3.3)2 1,495 133.4 21.1 (6.2)2 1994 94.7
Seining 8.0 8 11 7.0 455 651 15 463 20.11 Gillnet 106.8 (46.1)2 106 1.0 89.8 (24.4)2 74 0.8 196.7 (70.5)2 180 0.9 1 = Indicates per pass. 2 = Indicates Nighttime fishing or net sets. Source: HDR 2022b.
Proportional Size Distribution (PSD) is a measure of species size structure (Murphy and Willis 1996). The metric is a ratio (expressed as a percentage) between the number of quality-sized individuals or larger individuals and stock sized individuals. PSD measures for Walleye and the three trout species (Brown Trout, Rainbow Trout, and Cutthroat Trout) were determined according to the length categories (based on total length) described in Gablehouse (1984). The following figures provide graphical representation of the PSDs of Walleye, Brown Trout (lentic), Rainbow Trout, and Cutthroat Trout for Seminoe Reservoir. PSD values that range from 40 to 60 indicate a structurally balanced population. Values <40 indicate an abundance of small fish and values > 60 indicate and abundance of large fish. Descriptions of these PSD metrics in relation to Seminoe Reservoir are provided below, by species.


