3 minute read
Project Updates


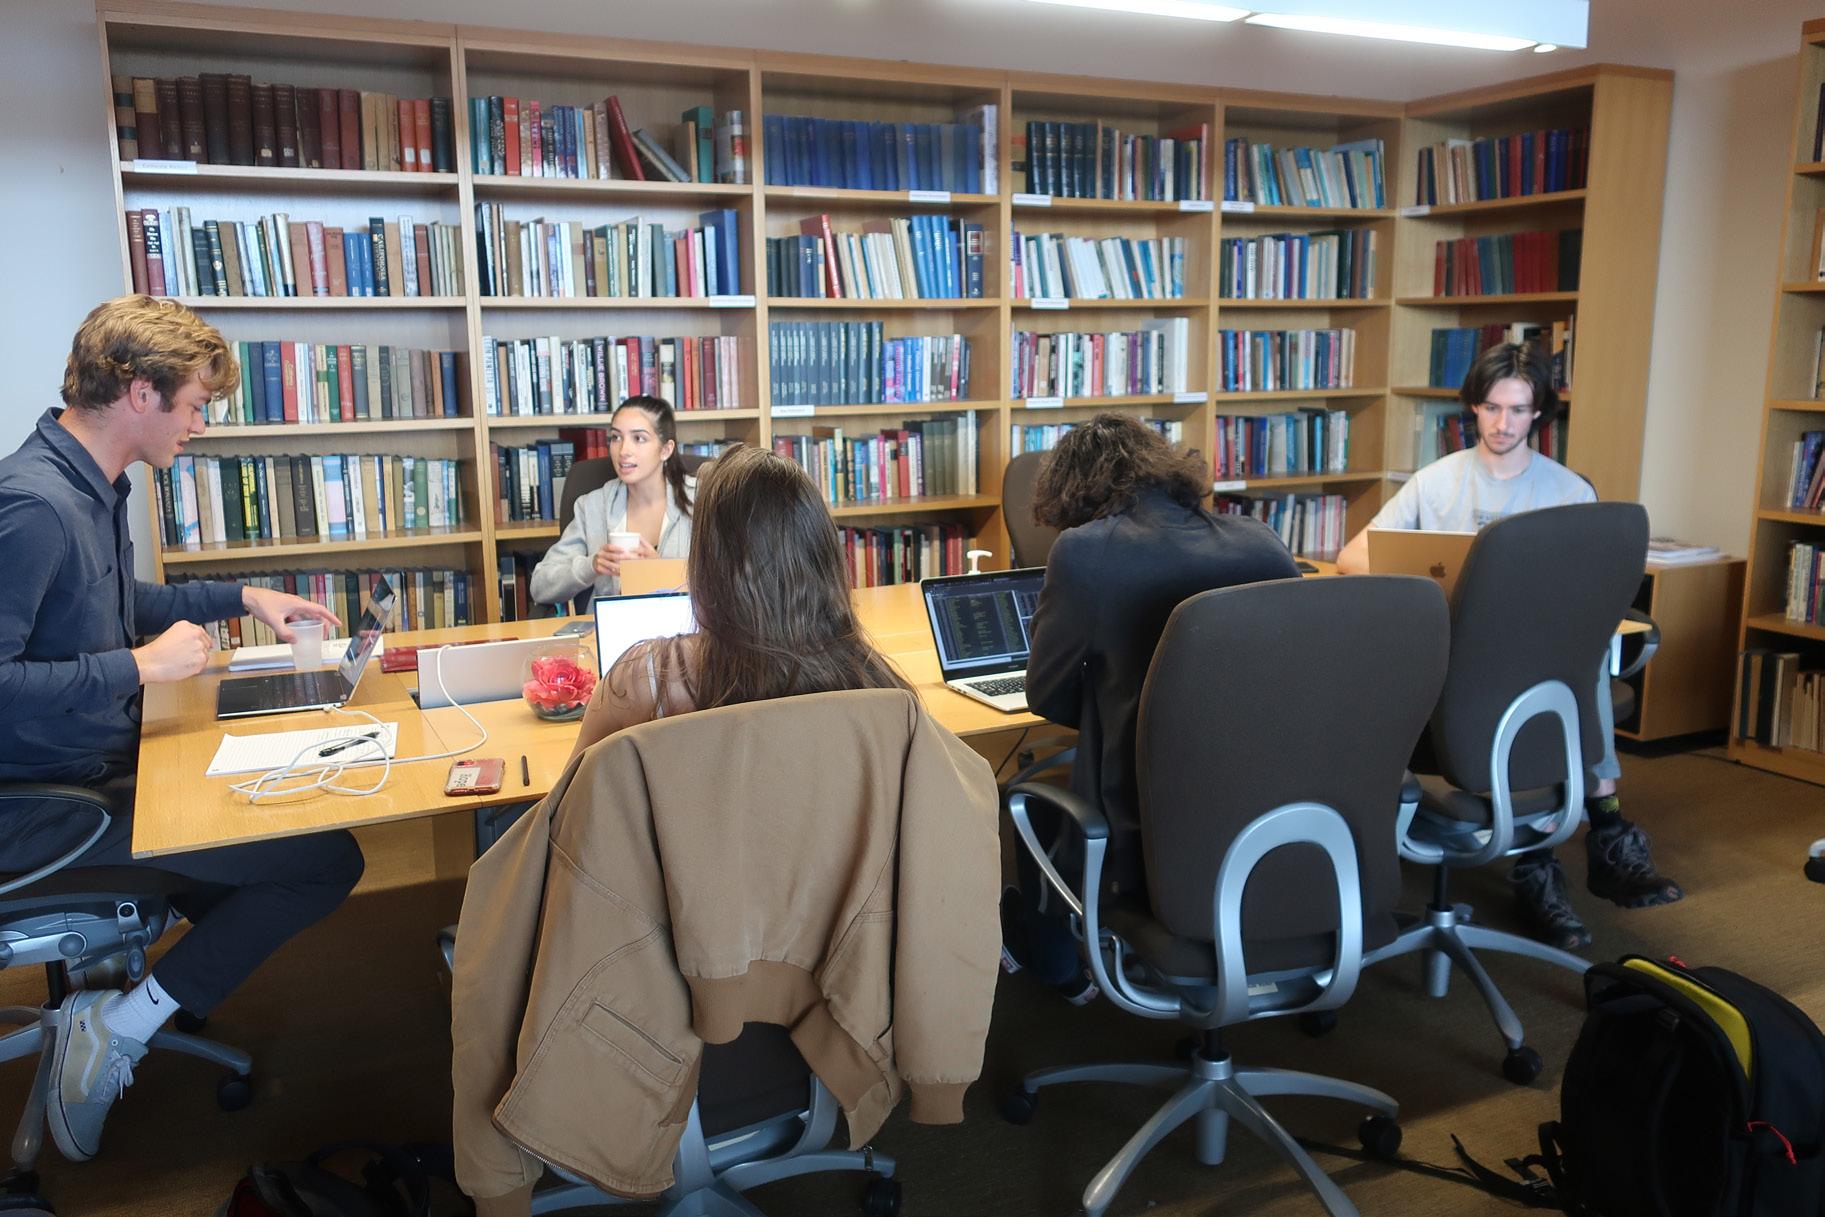
Cameron Stevens ’23 (from left), Tara Mehra ’23, Helen Bovington ’24, Thomas Short PO’24. and Nolan Windham ’25 together in the Rose Institute workroom. Photo courtesy of Marionette Moore.
Vernon Incorporation
Tara Mehra ’23
This semester, the City Incorporation project has been using Vernon, California as a case study for understanding how small, industrial California cities become and remain incorporated cities. In particular, the project team is compiling a report that examines the history of Vernon, quantifies changes following a 2012 report from the state auditor, and considers some of the legal complexities of incorporation and disincorporation. The team is also taking advantage of the National Establishment Time Series (NETS) database to aid our analysis. Vernon is a city of industry; despite having just over 200 residents, around 50,000 individuals work there each day. The NETS data helps us understand the value proposition of Vernon.
California Competitiveness
Cameron Stevens ’23
In collaboration with economists from the Inland Empire Economic Partnership and the Lowe Institute of Political Economy, our team is investigating trends in business migration, business formation, and the composition of the California economy. The project primarily analyzes the National Establishment Time-Series (NETS) database, which tracks over 9 million business establishments in California from the past 30 years. With the NETS data, our team has built visualizations of business relocations from California to other states and demonstrated how these migration patterns have changed the Inland Empire’s dominant industries. The California Competitiveness project plans to dive deeper into the NETS database, moving the analysis level down to cities and even zip codes.
Rose-Kosmont Cost of Doing Business Survey
Desmond Mantle ’23
The Rose-Kosmont Cost of Doing Business Study is now well underway, with research assistants collecting data such as sales tax, crime rate, and the presence of opportunity zones for over 100 cities in the Southern California region as well as several outof-state cities for comparison. Research assistants are currently exploring visualizations to display our data in an attractive, professional format. Additionally, we have identified a number of surprising outliers among our data, and the unique characteristics of these cities may be of interest to not only the Rose community but also the general public more broadly. We are exploring ways to present these findings to media outlets to publicize our research and inform Southern California residents about the nuances of their cities’ business policies.
Miller-Rose Initiative Database
Marshall Bessey ’23
The goal of the Miller-Rose Initiative Database is to provide a comprehensive database of every citizeninitiative initiative that has passed nationwide. The database includes every initiative from the first one in 1904 until the present day. The database is particularly unique because it also contains every legal challenge to passed initiatives. The team undertook three primary assignments during this semester. First, we drafted summaries for each state’s page on the database. The overviews share the state’s history with the initiative process, the types of initiatives allowed, the signature requirements, and the policy areas addressed through the initiative process. We are finalizing these summaries, and they should go on the website by the end of the semester. Second, the team will research and update the legal challenges side of the database, and the updates should appear on the website by the end of the semester. Finally, the team is preparing for a substantial update to the database in the fall.
Redistricting
Pieter Van Wingerden ’24, George Ashford ’25, and Nikhil Agarwal ’24
This project shows how the latest round of redistricting has changed the representation of Los Angeles County municipalities at the federal, state, and local level. Our team created GIS maps of the County’s past and present congressional, state legislative, and county supervisorial districts, charted in relation to municipal boundaries. The maps also noted any incumbents running in the new districts, indicating where the new lines have created open seats or competition between incumbents. Doug Johnson, President of the National Demographics Corporation and a Rose Institute Research Affiliate, presented the maps to LA County municipal leaders at a National League of Cities conference in early March.
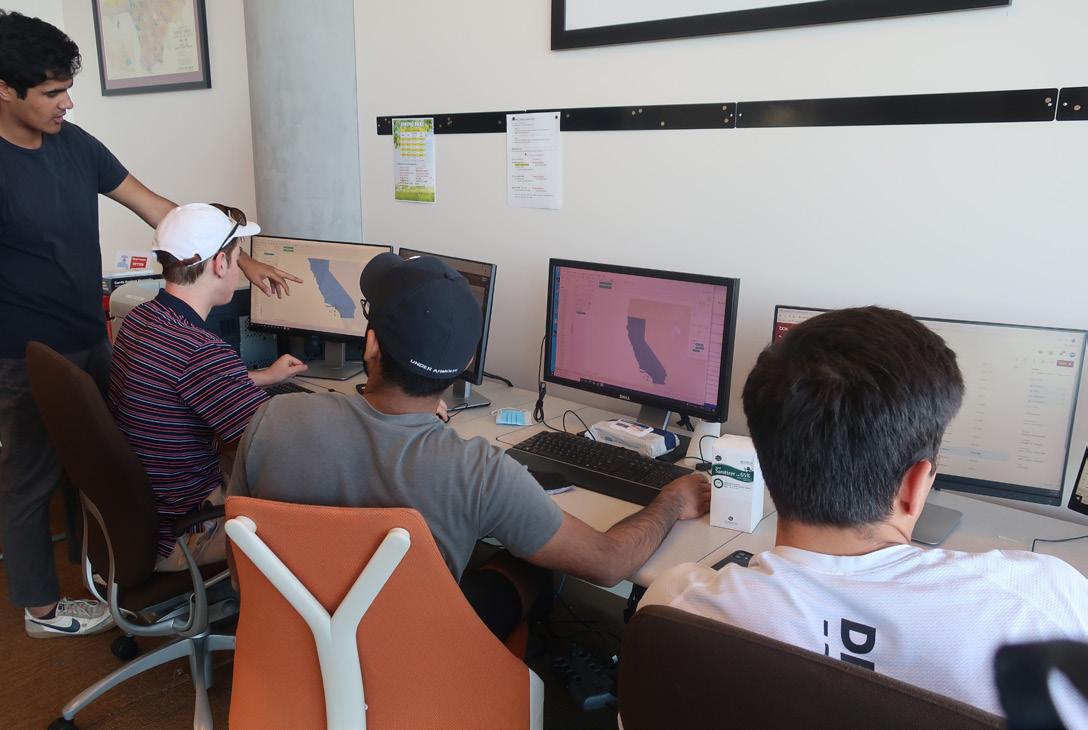
Adhitya Venkatraman ’22 (left) trains the redistricting team in
data analysis and visualization. Photo courtesy of Marionette Moore.


