10 minute read
COVID-19, School Closure and Learning Loss


PHOTO CREDIT: Kontakt5956 | Dreamstime
by Daniela Corona ’23
On March 13, 2020, President Donald Trump declared the coronavirus a national emergency. In the days that followed, schools across the country shut their doors and sent students home for what they initially believed would be a couple of weeks. Schools took a variety of approaches to tackle learning amidst the pandemic. Whether that was remote learning, hybrid classes, outdoor or restricted in-person classes, students across the country experienced learning loss as a result of the pandemic. Learning loss affected students from K-12 to higher education and had a disproportionate effect on historically disadvantaged groups. Some of the effects of learning loss also appear to have lasting effects on absenteeism and on the future outcomes of a generation of students.
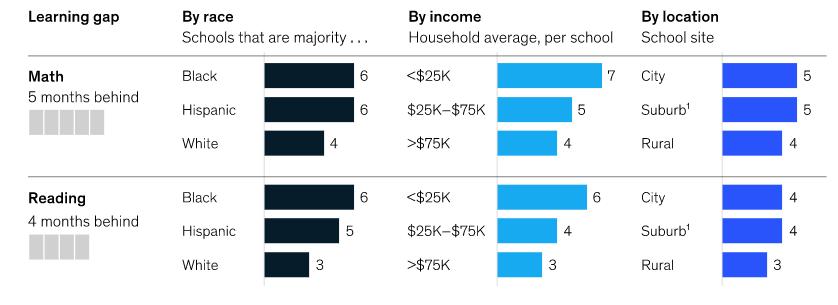
The pandemic appears to have widened the achievement gap across student groups. According to a McKinsey & Company study, elementary school students are roughly four months behind in reading and five months behind in math. The same study also found that Black and Hispanic students are an additional one to two months behind in both subjects when compared to White students. These trends are also reflected when comparing lower income and high-income students. Additionally, underserved families continued to struggle with illness, death, economic woes and other stressors associated with the pandemic. These groups have historically been lagging behind their student counterparts and the research shows that the pandemic exacerbated these effects.
Remote learning contributed to learning loss caused by the pandemic. A study by the World Bank, using data from nineteen countries, shows that the longer schools were closed the greater the learning loss students experienced. Wealthier students who do not belong to historically disadvantaged groups are more likely to have access to strong, reliable Wi-Fi connections, adequate technology to take classes, and a quiet work environment. Thus, while all groups experienced some learning loss from remote learning, remote learning had a greater impact on disadvantaged groups. A Harvard study also found that wealthier schools may have had a smoother transition to remote learning. Wealthier schools were also more likely to have the resources to equip their teachers for more effective remote teaching.
Source: Dorn, Hanock,Srakatsannis, Viruleg, COVID-19 and education: The lingering effects of unfinished learning, McKinsey & Company, July 27, 2021.
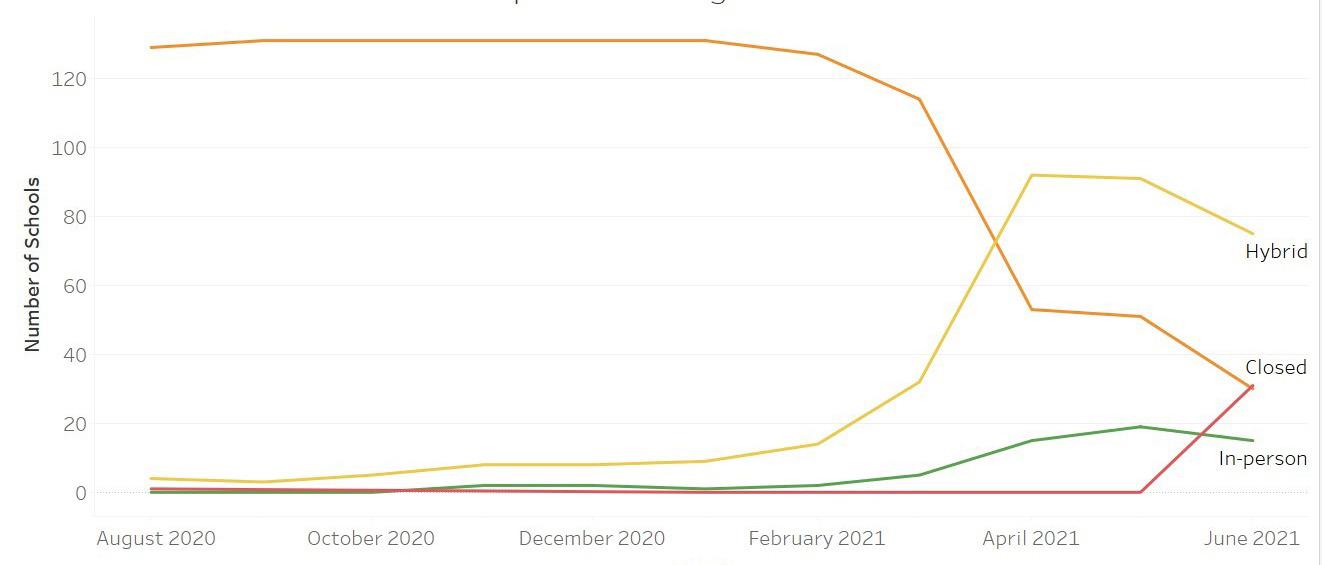
School reopenings varied depending on the state. California and several other coastal states tended to remain virtual for longer than other states. The American Enterprise Institute (AEI) tracked which states were the most aggressive or cautious in terms of school reopenings. They based their measure on the number of COVID-19 cases per week per 100,000 people compared to the school district operational status. The AEI ranked California as the most cautious state. This meant that California, more than any other state, delayed school reopenings even as COVID-19 cases declined. California was followed by Arizona and Illinois. Conversely, the three most aggressive states were Alaska, Wyoming, and Louisiana. This finding suggests that school districts in California may be at risk for the most severe learning loss. Within California, school reopenings began in Northern California and in rural areas. Most school districts did not transition to hybrid or in-person classes until about March 2021. In the Inland Empire specifically, the majority of school districts remained virtual until April 2021 At the start of the 2020-21 school year, about 97 percent of school districts in the Inland Empire were operating virtually (Image 1). In April of 2021, the percentage of school districts operating virtually dropped from 85 percent in March to about 40 percent in April (Image 1). By April, most school districts shifted to a hybrid model, increasing from 24 percent in March to 70 percent. This meant that most school districts in the Inland Empire did not return to either hybrid or in-person instruction for more than a year after the start of the pandemic. By June only about 22 percent of school districts remained virtual (Image 1).
Image 1. School Districts in the Inland Empire - learning model
Virtual
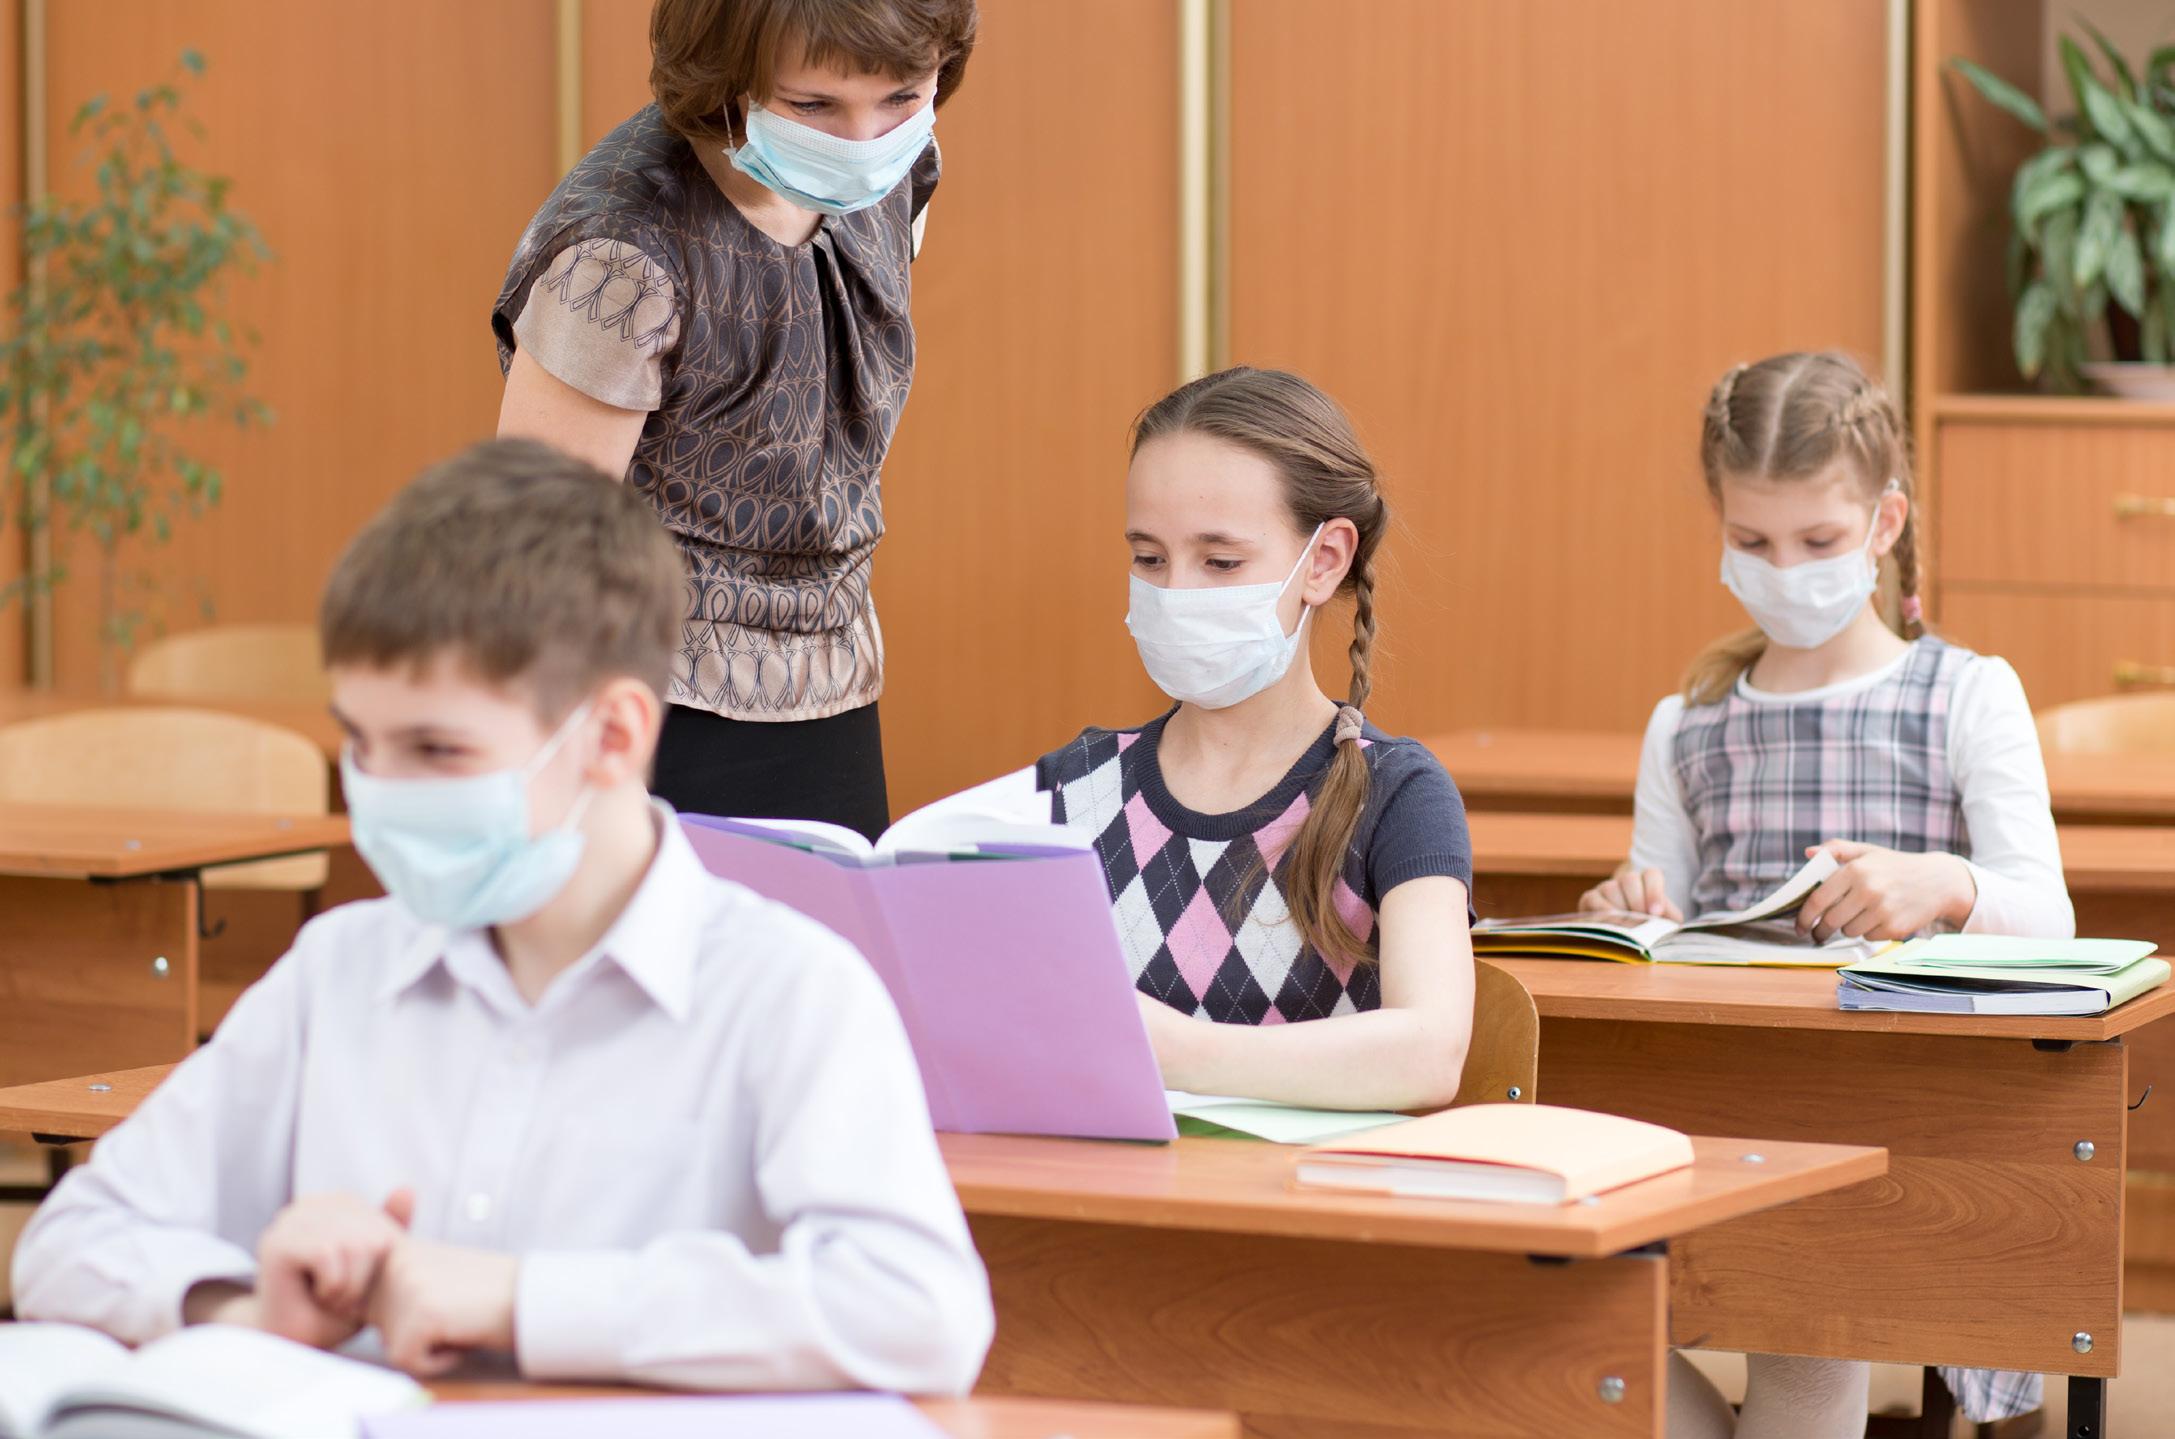
PHOTO 107810140 @ Oksun70 | Dreamstime.com
Learning Loss in the Inland Empire
High school completion rates and post high school metrics did not change significantly during and after the start of the pandemic. School districts in the Inland Empire saw no differences in the percentages of students meeting University of California or California State University requirements (Table 1).
School districts in all three counties saw slight dips in high school graduation rates in 2019-20 (Table 2). San Bernardino county saw the greatest drop in average graduation rates, going from 85.88% in 2018-19 school year to 80.7% the following school year.
Certain counties in the Southern California saw slight declines in standardized test scores. California administers the California Assessment of Student Performance and Progress (CAASPP) test in math and English/language arts to various grade levels, including high school students in 11th grade. The assessments rank scores according to four levels: standard exceeded (4), standard met (3), standard nearly met (2), standard not met (1). California did not administer tests for 2019-20 be-
Table 1. Percentage of student meeting UC or USC requirements
County 2017-2018 2018-2019 2019-2020 2020-2021
Los Angeles 52.41% 52.62% 52.38% 55.53%
Riverside 38.23% 41.63% 42.45% 42.09%
San Bernardino 31.37% 32.22% 33.40% 33.93%
Source: DataQuest, California Department of Education, 2021.
Table 2. Average High School Graduation rates
County 2017-2018 2018-2019 2019-2020 2020-2021
Los Angeles 90.68% 91.35% 89.55% 90.68%
Riverside 83.69% 85.31% 82.81% 84.56%
San Bernardino 85.09% 85.88% 80.70% 85.38%
Source: DataQuest, California Department of Education, 2021.
cause of the COVID-19 pandemic. For English/Language Arts, Riverside saw several percentage point declines in level four and three while the other two counties saw little differences between 2018-19 and 2020-21 (Table 3). For math, none of the three counties saw any significant difference between the two school years (Table 4).
These findings suggest that the pandemic had minimal immediate impact on high school standardized test scores. This outcome can be attributed to the fact that the material covered in the standardized tests tend to be taught in the first two years of high school.
The Inland Empire saw overall increases in chronic absenteeism with greater rates in Riverside and San Bernardino Counties. The California Department of Education defines chronic absenteeism as a student missing 10 percent or more of their total instructional days. The majority of school districts in San Bernardino and Riverside counties saw drastic increases in chronic absenteeism from 2018-19 to 2020-21 (Image 2). The California Department of Education stated that the chronic absenteeism rates for the 2019-20 school year are not valid or reliable because of COVID-19; therefore, they are not used in this paper. Two San Bernardino school districts, Chaffey Joint Union and Oro Grande, had the greatest increases in chronic absenteeism at 33.4% and 33.6% respectively (Image 2). Overall, Riverside County had a 6.23% increase in chronic absenteeism, San Bernardino had a 5.67% increase (Table 5).
According to the McKinsey report, the historic links between increased chronic absenteeism and dropout rates suggest that an estimated additional 617,000 to 1.2 million 8th to 12th graders could drop out of school in the upcoming years. This suggests that chronic absenteeism is likely to have lasting effects on the school districts in the Inland Empire.
School districts in the region have not put federal funding to use to combat learning loss. The Elementary and Secondary School Emergency Relief fund distributed new federal money to schools, with at least 20% of the
Table 3. English/Language Arts Scores for 11th Grade
Avg. Standard Exceeded: Level 4 Avg. Standard Met: Level 3 Avg. Standard Nearly Met: Level 2 Avg. Standard Not Met: Level 1
County 2019 2021 Change 2019 2021 Change 2019 2021 Change 2019 2021 Change
Los Angeles 26.26% 26.97% 0.71% 30.19% 30.42% 0.23% 22.04% 22.08% 0.04% 21.51% 20.54% -0.97%
Riverside 23.36% 21.18% -2.18% 30.74% 28.97% -1.77% 22.76% 24.88% 2.12% 23.14% 24.97% 1.83%
San Bernardino 21.38% 23.95% 2.57% 30.47% 30.61% 0.14% 23.86% 24.21% 0.35% 24.29% 21.23% -3.06%
Source: California School Dashboard, California Department of Education, 2021.
Table 4. Math Scores for 11th Grade
Avg. Standard Exceeded: Level 4 Avg. Standard Met: Level 3 Avg. Standard Nearly Met: Level 2 Avg. Standard Not Met: Level 1
County 2019 2021 Change 2019 2021 Change 2019 2021 Change 2019 2021 Change
Los Angeles 13.10% 13.11% 0.01% 18.09% 19.03% 0.94% 22.57% 25.88% 3.31% 46.24% 41.98% -4.26%
Riverside 9.03% 6.90% -2.13% 17.62% 16.75% -0.87% 23.51% 27.60% 4.09% 49.84% 48.75% -1.09%
San Bernardino 8.76% 10.04% 1.28% 16.81% 18.51% 1.70% 22.78% 25.38% 2.60% 51.65% 46.07% -5.58%
Source: California School Dashboard, California Department of Education, 2021.
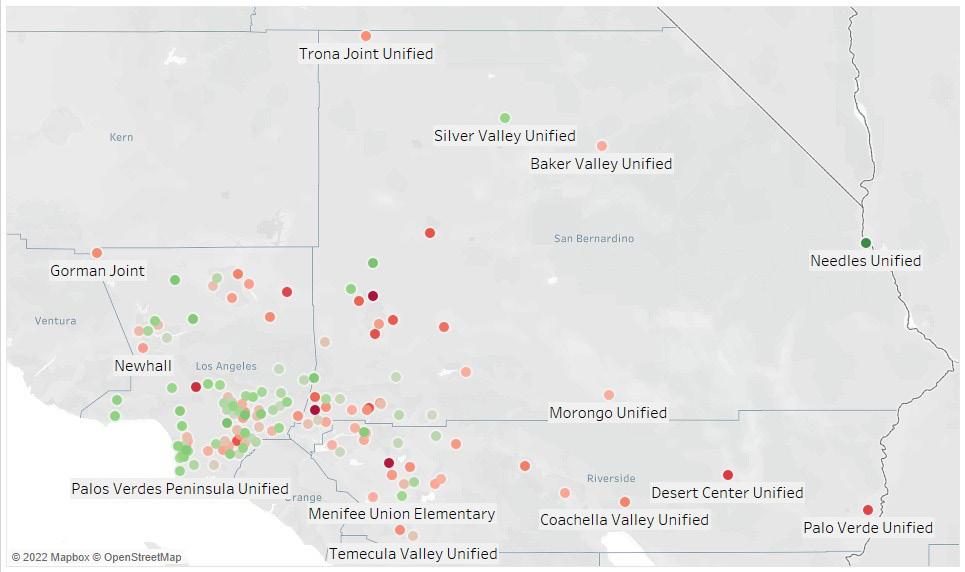
Data Source: DataQuest, California Department of Education, 2021. Map: Daniela Corona ’23
funding was specifically set aside to combat learning loss. Yet, as of August 2022, many school districts in the Inland Empire have not yet spent any of these funds (Image 3).
Only ten school districts in the Inland Empire have used 50% or more of their learning loss allocation. So far, San Bernardino school districts spent the most with 14.18% of the learning loss allocation fund spent, followed by Riverside and Los Angeles County with 11% and 10.29% respectively (Table 6).
The Inland Empire in particular faces increased staffing shortages and changes in administrative positions that may explain why school districts have delayed implementation of initiatives to combat learning loss. ESSER III Funds will be available only until September 30th, 2024. Thus, school districts will need to make use of the funds soon.
Several school districts did take action to combat learning loss sooner. Montebello Unified School District is one of two school districts that have used all of their
Table 5. Changes in Absenteeism by County
County
Los Angeles
Riverside
Change
0.48%
6.23%
San Bernardino 5.67%
Data Source: DataQuest, California Department of Education, 2021.
Table 6. Percent of ESSER III Funds Spent
County
Avg. % of ESSER III Spent
Avg. % of Learning Loss Fund Spent
Los Angeles 18.23% 10.29%
Riverside 19.33% 11.07%
San Bernardino 21.83% 14.18%
Source: CA ESSER III Allocation & Funds Spent, Edunomics Lab at Georgetown, August 8, 2022.
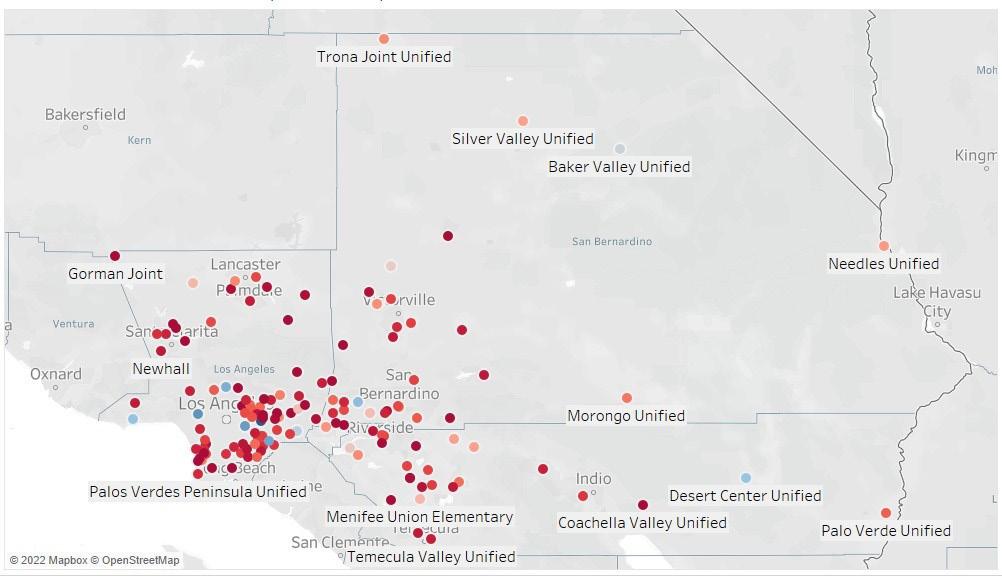
Data Source: CA ESSER III Allocation & Funds Spent, Edunomics Lab at Georgetown, August 8, 2022. Map: Daniela Corona ’23
learning loss allocation. Montebello school district spent a significant chunk of its ESSER allocation to improve classroom safety and prepare for a safe return to school, such as installing air purifiers, fixing air conditioning, and purchasing other protective safety equipment. The school district spent more than half a million dollars to implement online assessments to track and assess learning loss. Montebello Unified spent the rest of its learning loss allocation on homeless and foster student liaisons and on summer school.
The COVID-19 effects on high school student learning loss do not appear to be as severe as the learning loss experienced by younger students. Reports on elementary and middle school children show drastic drops on national assessments and delays in meeting developmental milestones. High school students in the Inland Empire show little change on national assessments and in graduation or college requirement completion. However, recent reports find that increases in chronic absenteeism and increases in the achievement gap between lower income and minority students and their peers will contribute to declines in college enrollment and overall lifetime earnings. Therefore, learning loss experienced in younger students and high school students as a result of the pandemic is likely to exacerbate existing inequities among students and impact future success of students.◆
2020. 2019-20 Absenteeism Data Message. California Department of Education. https://dq.cde.ca.gov/dataquest/ DQCensus/AttAbs1920Message.aspx.
AJMC STaff. 2020. COVID-19 Roundup: Coronavirus Now a National Emergency, With Plans to Increase Testing. 13 March. https://www.ajmc.com/view/covid19-roundup2.
American Enterprise Institute . 2021. Change in Instructional Status. 7 June. https://www.returntolearntracker.net/ instructional_status/.
2021. California School Dashboard. California Department of Education. https://www.caschooldashboard.org/.
2019. Chronic Absenteeism Indicator. California School Dashboard, California Department of Education. https:// www.cde.ca.gov/ta/ac/cm/documents/chronicabsenteeism.pdf.
2021. DataQuest. California Department of Education. https://dq.cde.ca.gov/dataquest/.
Dorn, Emma, Bryan Hancock, Jimmy Sarakatsannis, and Ellen Viruleg. 2021. COVID-19 and education: the lingering effects of unfinished learning. 27 July. https://www.mckinsey.com/industries/education/our-insights/ covid-19-and-education-the-lingering-effects-of-unfinished-learning.
Edunomics Lab at Georgetown. 2022. CA ESSER III Allocation & Funds Spent. 5 August. https://public.tableau.com/ app/profile/edunomicslab/viz/CAESSERIIIAllocationFundsSpent/Dashboard1.
2021. ESSER III Fund Frequently Asked Questions. https://www.cde.ca.gov/fg/cr/esseriiifaqs.asp.
Goldhaber, Dan, Thomas J Kane, Andrew McEachin, Emily Morton, Tyler Patterson, and Douglas O Staiger. 2022. The Consequences of Remote and Hybrid Instruction During the Pandemic. Harvard University, Center for Education Policy Research. https://cepr.harvard.edu/files/cepr/files/5-4.pdf?m=1651690491.
2021. Latest News and Tips for the CAASPP Administration. California Department of Education. https://www. caaspp.org/.
Oster, Emily. 2021. COVID-19 School Data Hub. https://www.covidschooldatahub.com/.
Patrinos, Harry A., Emiliana Vegas, and Rohan Carter-Rau. 2022. COVID-19 school closures fueled big learning losses, especially for the disadvantaged. 16 May. https://blogs.worldbank.org/developmenttalk/ covid-19-school-closures-fueled-big-learning-losses-especially-disadvantaged.
2022. Test Development & Design. Smarter Balanced. https://contentexplorer.smarterbalanced.org/test-development#contentSpecs.

