MARKET RESEARCH BRIEFING · 2025 –2035
Renewable Energy Storage Market
Firming the grid: how a USD 104.87 billion market scales to USD 428.63 billion by 2035
$88.42B
$428.63B
Market value, 2025
Forecast, 2035
$323.76B
16.9% CAGR, 2026–2035
New revenue pool, 2026–35
Executive Summary
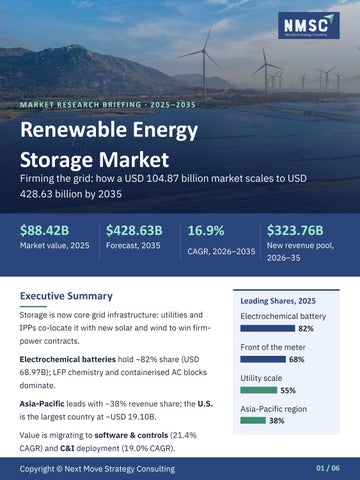
Leading Shares, 2025
Storage is now core grid infrastructure: utilities and
Electrochemical battery
IPPs co-locate it with new solar and wind to win firmpower contracts.
82% Front of the meter
Electrochemical batteries hold ~82% share (USD 68.97B); LFP chemistry and containerised AC blocks dominate.
Asia-Pacific leads with ~38% revenue share; the U.S. is the largest country at ~USD 19.10B.
68% Utility scale
55% Asia-Pacific region
38%
Value is migrating to software & controls (21.4% CAGR) and C&I deployment (19.0% CAGR). Copyright © Next Move Strategy Consulting
01 / 06
01 · MARKET LANDSCAPE
A 4.8× expansion in ten years, led by battery battery storage USD 323.76B
New revenue pool, 2026–35
~55%
Utility-scale share, 2025
~46%
Hybrid-with-solar share
~64%
Sold via direct B2B channels
Revenue by Storage Medium, 2025 (USD Billion) Electrochemical battery · 68.97 (~82%) Mechanical 10.61
Thermal 5.31
Chemical 2.65
Other 0.88
Industry Ecosystem: Upstream to End-of-Life Materials Lithium, nickel, graphite
Cells & Parts Parts Cells, BMS, PCS
Integration Systems & software
Deployment Utility, C&I, homes
Lifecycle O&M, recycling
Key Insights Utility-scale deployment and lithium-ion adoption drive the dominant shifts to 2035.
Integrated providers gain over hardware-only suppliers as firm-power rules tighten. Chemical storage (20.8% CAGR) grows fastest as hydrogen scales for long duration.
Copyright © Next Move Strategy Consulting
02 / 06
02 · GROWTH DRIVERS & OPPORTUNITIES
Renewable build-out and AI power demand demand fuel the growth engine Impact on CAGR (percentage points) Utility-scale renewable additions Data-center & AI power demand U.S. IRA storage tax credit Falling Li-ion pack costs Hybrid solar-plusstorage pipelines Grid-code dispatch mandates Critical-mineral supply limits Interconnection & permitting delays
High-Growth Segments +3.4
CAGR 2026–2035 Software & controls 21.4%
+2.6
Chemical storage
20.8%
+2.1
Hybrid solar + wind 20.3%
+1.9
IPP buyers
+1.5 +1.3
19.8%
Off-grid connection 19.5% C&I deployment
19.0%
Energy arbitrage
18.6%
−1.4 −1.1
Whitespace Opportunities, 2026–2035 Long-Duration Chemical Storage Hydrogen and power-to-
Software & Asset Optimisation Bidding and dispatch
gas for multi-day,
platforms with recurring
storage for rural Africa &
seasonal balancing
subscriptions
Southeast Asia
20.8% CAGR
21.4% CAGR
19.5% CAGR
Off-Grid Hybrid Systems Modular solar-plus-
Implications for Investors & B2B Buyers Renewable firming leads use cases (USD 26.53B, 2025); arbitrage grows fastest as price spreads widen. Software & controls outpace hardware, shifting value toward recurring service revenue. Mineral supply and grid queues are the key risks; scale buyers hedge best. Copyright © Next Move Strategy Consulting
03 / 06
02 · REGIONAL OPPORTUNITIES
Asia-Pacific leads in scale; MEA and India set the growth pace Growth Opportunity Map · bubble = 2035 market size Europe $72.87B · 14.8%
North America $102.87B · 14.1% Asia-Pacific $188.60B · 18.9%
MEA · fastest $38.58B · 20.3%
Latin America $25.72B · 19.3%
2035 value · CAGR 2026–2035
Key Country Markets · 2025 value and CAGR 2026–2035 U.S.
China
India · fastest
Canada
Germany
UK
$19.10B · 14.0% CAGR
$5.31B · 14.5% CAGR
$17.47B · 18.8% CAGR
$4.60B · 15.2% CAGR
$6.05B · 24.3% CAGR
$3.89B · 15.2% CAGR
Regional Demand Signals Asia-Pacific: China's integrated manufacturing and India's BESS mission drive scale.
MEA: Vision 2030 diversification adds firming for desert solar. North America & Europe: IRA credits and REPowerEU sustain mature pipelines. Latin America: storage tenders target curtailment in Brazil and Chile.
Copyright © Next Move Strategy Consulting
04 / 06
03 · COMPETITIVE SCENARIO
Scale cell makers vs. software-led integrators Competitive Positioning Matrix
Software & integration depth →
Software-led Integrators Fluence Wärtsilä Schneider
Integrated Leaders Tesla BYD Sungrow
Recent Strategic Moves Moves APR 2024 · CATL Unveiled TENER: 6.25 MWh system with zero degradation in first five
HyperStrong
years
Canadian Solar
2025 · FLUENCE Expanded Mosaic software
Specialists & LongDuration Eos Energy
Scale Cell Manufacturers CATL LG Energy
Energy Vault Saft
Samsung SDI
SMA Solar
EVE Energy REPT
GoodWe
HiTHIUM
to optimise renewable &
storage assets APR 2025 · TESLA Reported 31+ GWh of storage deployed in 2024, a record year
20
Alpha ESS Manufacturing scale & cost leadership → Indicative placement of the 20 profiled players
players profiled
Top 10 share data
Key Strategies M&A · Vertical Cell makers merge with
Software Buys Hardware OEMs acquire
Partnerships EPC expansion in APAC &
system integrators
controls platforms
Middle East
Market is moderately consolidated among the top 10, with a long tail of regional EPC
players. Bids are won on cell cost, safety certification and delivery speed. Warranty, cycle-life and domestic-content compliance increasingly decide utility tenders.
Copyright © Next Move Strategy Consulting
05 / 06
Thank You Connect with our analysts for in-depth insights and strategic guidance on the renewable energy storage market.
Official Website
www.nextmsc.com
20
33
Top 10
2035
Twitter / X
Companies profiled
Number+1 857 758 5017
Market share data
info@nextmsc.com
Countries covered
Forecast horizon
C lick here fo r the co m p lete rep o rt Renewable Energy Storage Market · 2025–2035
Follow Us
YouTube
Data source: Next Move Strategy Consulting, Renewable Energy Storage Market report. Base year 2025; forecast 2026–2035. Copyright © Next Move Strategy Consulting
06 / 06