MARKET RESEARCH BRIEF · 2026 EDITION
Investor & Strategy Briefing
Metal Matrix Composite Market Lightweight strength meets thermal performance — a market set to grow from USD 920.2 Mn to USD 2,241.2 Mn by 2035
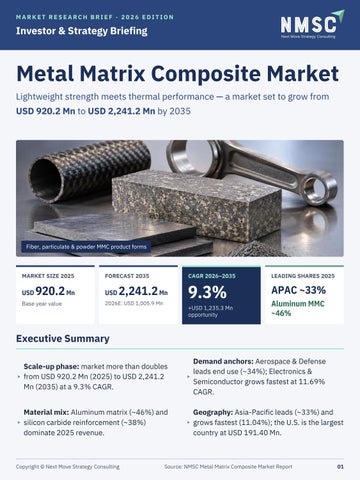
Fiber, particulate & powder MMC product forms
MARKET SIZE 2025
USD
920.2 Mn
Base year value
FORECAST 2035
USD
2,241.2 Mn
2026E: USD 1,005.9 Mn
CAGR 2026–2035
LEADING SHARES 2025
9.3%
APAC ~33%
+USD 1,235.3 Mn opportunity
Aluminum MMC ~46%
Executive Summary Scale-up phase: market more than doubles ▸ from USD 920.2 Mn (2025) to USD 2,241.2 Mn (2035) at a 9.3% CAGR.
Demand anchors: Aerospace & Defense leads end use (~34%); Electronics & ▸ Semiconductor grows fastest at 11.69% CAGR.
Material mix: Aluminum matrix (~46%) and ▸ silicon carbide reinforcement (~38%) dominate 2025 revenue.
Geography: Asia-Pacific leads (~33%) and ▸ grows fastest (11.04%); the U.S. is the largest country at USD 191.40 Mn.
Copyright © Next Move Strategy Consulting
Source: NMSC Metal Matrix Composite Market Report
01
01 · MARKET LANDSCAPE
A USD 920 Mn market set to more than double by 2035 Market Size & Growth
Share by Matrix Material
USD Million
2025 revenue share
9.3% CAGR 2026– 2035
46%
2,241.2
Aluminum
+USD 1,235.3 Mn absolute opportunity
920.2
(2026–2035) 1,005.9 Aluminum 46%
Magnesium 12%
Titanium 11%
Copper 10%
Nickel 8%
Refractory 8%
Other 5%
2025
2026E
2035F
Industry Ecosystem — Leading Segment at Each Value-Chain Stage (2025) ① MATRIX METAL
② REINFORCEMENT
③ REINFORCEMENT FORM
④ PROCESS
Aluminum
Silicon Carbide
Particulate
Stir Casting
~46%
~38%
~42%
~27%
⑤ PRODUCT FORM
⑥ FUNCTION
⑦ CHANNEL
⑧ END USE
Near Net Shape
Structural
Direct OEM
Aerospace & Defense
~29%
~36%
~47%
~34%
Key Takeaways ▸ ▸ ▸
Aluminum MMC led with USD 423.29 Mn in 2025, backed by cost efficiency and established processing infrastructure. Scope spans Al, Mg, Ti, Cu and Ni matrices with ceramic or carbon reinforcement, supplied via OEM, Tier 1 and contract channels. Producers are shifting from casting toward additive manufacturing and pressure infiltration for near-netshape parts.
Copyright © Next Move Strategy Consulting
Source: NMSC Metal Matrix Composite Market Report
02
02 · GROWTH DRIVERS & OPPORTUNITIES
Lightweighting and thermal management lead demand Growth Catalyst & Risk Matrix — Impact on CAGR (percentage points) Aerospace & defense lightweighting
+2.4
Semiconductor packaging thermal mgmt.
+2.0
Additive manufacturing (near net shape)
+1.3
Electric vehicle power module adoption
+1.1
Defense procurement modernization
+0.9
Wear-resistant industrial machinery High cost of ceramic reinforcements
+0.6 −1.0
Limited manufacturing standardization Long aerospace qualification cycles
Driver
Restraint
−0.8 −0.6
Impact window: 2026–2035 (additive mfg., standardization & defense modernization: 2026–2032)
Fastest-Growing Segments
End-Use Demand Expansion
CAGR 2026–2035, by segmentation category
USD Mn, 2025 → 2035
Additive Mfg.
18.06%
Engineering Contract
14.35%
Thermal Management
13.47%
Continuous Fiber
13.08%
Finished Component
12.86%
Carbon Reinforcement
12.40%
Electronics & Semi.
11.69%
Titanium Matrix
11.36%
▸ ▸
Aerospace & Defense
312.9 → 806.8
Automotive
184.0 → 425.8
Electronics & Semi.
128.8 → 381.0
Industrial Machinery
101.2 → 224.1
2025
2035F
Defense pull: U.S. DoD advanced-materials initiatives and programs such as FLRAA anchor Al and Ti MMC consumption. Thermal pull: SiC-reinforced aluminum gains in power modules and semiconductor packaging as power density rises.
▸ Watch-out: SiC and boron carbide price volatility squeezes margins of smaller, non-integrated fabricators.
Copyright © Next Move Strategy Consulting
Source: NMSC Metal Matrix Composite Market Report
03
02 · REGIONAL OPPORTUNITY MAP
Asia-Pacific leads on both scale and speed Growth Opportunity Map — 2025 Market Size & CAGR 2026–2035 USD 239.25 Mn · 8.34% USD 294.46 Mn CAGR 8.12%
USD 303.67 Mn
Europe
CAGR 11.04%
N. America
AsiaPacific
Fastest
MEA LATAM
USD 36.81 Mn · 9.31% USD 46.01 Mn · 9.31%
Region
2025 (USD Mn)
2035 (USD Mn)
CAGR
Key Driver
Asia-Pacific
303.67
851.66
11.04%
Electronics manufacturing scale-up
North America
294.46
649.95
8.12%
Defense procurement modernization
Europe
239.25
537.89
8.34%
Aerospace lightweighting programs
Latin America
46.01
112.05
9.31%
Industrial machinery demand
Middle East & Africa
36.81
89.65
9.31%
Emerging defense investment
High-Growth Countries
Where to Play
CAGR 2026–2035 · 2035 size (USD Mn)
China
12.1% · 344.8
India
11.6% · 68.9
S. Korea Japan U.S.
▸ ▸
10.2% · 118.6 9.4% · 148.9
▸
APAC: fastest regional CAGR; China is the fastestgrowing country at ~12.1%. U.S.: largest single market (USD 191.40 Mn in 2025), defense-led. Europe: Germany (USD 76.60 Mn) and UK (USD 68.10 Mn) lead aerospace demand.
8.1% · 424.0
Copyright © Next Move Strategy Consulting
Source: NMSC Metal Matrix Composite Market Report
04
03 · COMPETITIVE SCENARIO
Certification and application expertise decide wins Competitive Positioning Matrix
Key Strategic Moves
Qualitative placement based on NMSC archetype analysis
Aerospace & defense certification depth →
NICHE DEFENSE / ARMOR
PRODUCT INNOVATION · APR 2025
Mitsubishi Materials high thermal conductivity, low
DIVERSIFIED LEADERS
Materion Corp.
expansion & good workability. LICENSING PARTNERSHIP
3M Company
CPS Technologies secured exclusive Fiber-Reinforced Aluminum manufacturing rights. CAPACITY EXPANSION
CPS Technologies added 5-axis CNC machining and
CPS Technologies
grew Al-MMC heat-sink output. Thermal Transfer Composites THERMAL SPECIALISTS
Niche
PROGRAM WIN
Materion selected to supply SupremEX MMC for
Portfolio breadth →
Diversified materials group
U.S. Army FLRAA prototypes.
BROAD INDUSTRIAL
Diversified
Specialized manufacturer
TECHNOLOGY INVESTMENT
Plansee Group investing in additive manufacturing of refractory materials.
Key Market Players — 20 companies profiled · market share available for top 10 Materion Corporation
3M Company
Denka Company Limited
CPS Technologies Corp.
Ferrotec Holdings Corp.
Mitsubishi Materials Corp.
Proterial, Ltd.
Plansee Group
H.C. Starck Solutions
CeramTec GmbH
DWA Aluminum Composites USA
TISICS Ltd.
ADMA Products, Inc.
Alvant Ltd.
Ultramet
Thermal Transfer Composites
Santier Inc.
GRINM Metal Composites Tech.
M Cubed Technologies Inc.
Toyo Aluminium K.K.
Competitive Insights ▸ ▸
Moderately fragmented: global materials groups compete with specialized regional fabricators serving niche defense and industrial uses. Basis of competition: aerospace & defense certification, materials engineering capability and applicationspecific customization.
▸ Deal pattern: selective capacity investment and licensing partnerships rather than large-scale consolidation. ▸ Early co-qualification: primes now engage MMC suppliers earlier in programs, favoring certified incumbents.
Copyright © Next Move Strategy Consulting
Source: NMSC Metal Matrix Composite Market Report
05
04 · CONNECT WITH US
Turn market insight into your next move
Thank You Connect with our analysts for in-depth segment data, company market shares and strategic guidance on the Metal Matrix Composite market.
OFFICIAL WEBSITE
CONTACT NUMBER
www.nextmsc.com
+1 857 758 5017
info@nextmsc.com
Click here Metal Matrix for the Composite complete Market report· → 2025–2035 · 20 companies · 38 countriesGet the Report
Click here for the complete report →
Metal Matrix Composite Market · 2025–2035 · 20 companies · 38 countriesGet the Report
2025–2035
8
20
38
Analysis period
Segmentation lenses
Companies profiled
Countries covered
Follow Us
YouTube
Twitter / X
Custom research, competitive intelligence and go-to-market advisory for investors and B2B leaders
Copyright © Next Move Strategy Consulting
www.nextmsc.com
06