MARKET RESEARCH BRIEFING · 2026
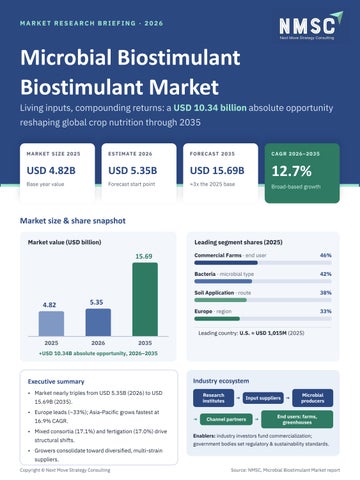
Microbial Biostimulant Biostimulant Market Living inputs, compounding returns: a USD 10.34 billion absolute opportunity reshaping global crop nutrition through 2035
MARKET SIZE 2025
ESTIMATE 2026
FORECAST 2035
CAGR 2026–20 35
USD 4.82B
USD 5.35B
USD 15.69B
12.7%
Base year value
Forecast start point
≈3x the 2025 base
Broad-based growth
Market size & share snapshot Market value (USD billion)
Leading segment shares (2025)
15.69
4.82
Commercial Farms · end user
46%
Bacteria · microbial type
42%
Soil Application · route
38%
Europe · region
33%
5.35
Leading country: U.S. ≈ USD 1,015M (2025)
2025
2026
2035
+USD 10.34B absolute opportunity, 2026–2035
Executive summary
Industry ecosystem
• Market nearly triples from USD 5.35B (2026) to USD
Research institutes
15.69B (2035).
→
Input suppliers →
• Europe leads (~33%); Asia-Pacific grows fastest at 16.9% CAGR. • Mixed consortia (17.1%) and fertigation (17.0%) drive structural shifts.
→
Channel partners
→
Microbial producers
End users: farms, greenhouses
Enablers: industry investors fund commercialization; government bodies set regulatory & sustainability standards.
• Growers consolidate toward diversified, multi-strain suppliers. Copyright © Next Move Strategy Consulting
Source: NMSC, Microbial Biostimulant Market report
02 · GROWTH DRIVERS & OPPORTUNITIES
What is powering 12.7% annual growth Growth catalysts & risks: impact on CAGR (2026–2035) Driver (+)
Restraint (−)
Percentage-point impact on CAGR
Rising input-cost pressure on fertilizers
+2.4%
EU fertilizing-products regulation
+1.9%
Organized agri-input retail in Asia-Pacific
+1.7%
Government soil-health & subsidy programs
+1.5%
Integrated nutrient management shift
+1.2%
Precision fertigation & digital agriculture
+1.0%
Strain stability & shelf-life limits
−1.3%
Inconsistent regulatory classification
−0.9%
Competition from synthetic fertilizers
−0.7%
High-growth segments (CAGR 2026–2035) MI CRO B I AL TY P E
AP P L I CATI O N RO UTE
EN D U S ER
Mixed Consortia
Fertigation
Greenhouse Operations
17.1%
17.0%
16.3%
USD 0.39B → 1.60B
USD 0.43B → 1.79B
USD 0.77B → 3.01B
Whitespace opportunities 1
Encapsulated seed-treatment delivery Polymer-coated, temperature-stable strains capture recurring sales as seed firms shift to pre-inoculated seed.
2
Research & demonstration farms Trial-ready formulations with replicated data packages build credibility that spills into commercial farms.
3
Digital sales channels E-commerce ordering plus remote soil testing gives smallholder-focused distributors direct grower access.
Copyright © Next Move Strategy Consulting
Source: NMSC, Microbial Biostimulant Market report
03 · REGIONAL OPPORTUNITY MAP
Where the next USD 10.34B will be won Growth opportunity map: 2025 size vs. 2026–2035 CAGR
Region
2025
2035
CAGR
Key driver
Europe
USD 1.59B
USD 4.69B
12.8%
EU Fertilizing Products Regulation & REACH-aligned strain approval
North America
USD 1.30B
USD 3.74B
12.5%
USDA soil-health programs & integrated nutrient management
Asia-Pacific
USD 1.16B
USD 4.72B
16.9%
Organized agri-input retail & government subsidy programs
Latin America
USD 0.43B
USD 1.42B
14.1%
Row-crop consumption & modern agri-distribution
Middle East & Africa
USD 0.34B
USD 1.12B
14.3%
Agricultural diversification & soil-restoration programs
Country hotspots (2025 → 2035, CAGR 2026–2035) INDIA · FASTEST
CHINA
SAUDI ARABIA
U.S. · LARGEST
19.5%
17.5%
15.0%
USD 1,015M
USD 255M → 1,267M
USD 347M → 1,481M
USD 81M → 285M
2035
→ 2,815M · 12.0%
Asia-Pacific edges past Europe to become the largest region (USD 4.72B vs. USD 4.69B), led by India and China. Europe remains the regulatory benchmark.
Copyright © Next Move Strategy Consulting
Source: NMSC, Microbial Biostimulant Market report
04 · COMPETITIVE SCENARIO
Fragmented today, consolidating fast
20
key companies profiled
33
Moderately fragmented
countrie s covered
Shift favors multi-strain portfolios
Competitive positioning matrix Positioning archetypes Integrated chem-bio: Bayer & BASF pair chemical and biological portfolios. Broad crop compatibility: Syngenta & Corteva serve multinational distributors. Specialists: Koppert & Andermatt focus on
horticultural and greenhouse demand. Regional specialists: Rizobacter competes on localized strain adaptation. Winning edge: multi-strain bundling, registration speed, and efficacy-trial data.
Key strategic moves: partnerships, launches, M&A Jun 2026 · Novonesis PARTNERSHIP Distribution tie-up with Rovensa Next for U.S. row crops.
May 2026 · UPL REGISTRATION India FCO approval for Bioclassic plus four products.
Jan 2026 · Bayer LAUNCH Yoalo seed-applied bacterial biostimulant for corn.
Dec 2025 · BASF Morocco PARTNERSHIP Elite Sea multi-crop biostimulant with Acadian Plant Health.
Nov 2025 · UPL LAUNCH Hycoxa technology in its seaweed-based range.
Oct 2025 · Corteva RESTRUCTURING Separation into two independent listed companies.
Corteva → Symbiomics INVESTMENT Series A stake to speed microbial strain discovery.
Takeaway Partnerships and fast-track registrations lead the playbook.
Key players profiled: Novonesis · Syngenta AG · Corteva Agriscience · Bayer AG · UPL Limited · BASF SE · Valent BioSciences · Lallemand Inc. · Koppert Biological Systems · Biobest Group · Andermatt Biocontrol · Rizobacter S.A. · Verdesian Life Sciences · BioConsortia · Seipasa · Futureco Bioscience · Agricen · Groundwork BioAg · ProFarm Group · AMVAC Chemical
Copyright © Next Move Strategy Consulting
Source: NMSC, Microbial Biostimulant Market report
05 · CONNECT WITH US
Thank You Connect with our analysts for in-depth insights, custom segment data, and strategic guidance on the Microbial Biostimulant Market.
O FFI CI AL W EB S I TE
CO N TACT N UMB ER
EM A I L
www.nextmsc.com
+18577585017
info@nextmsc.com
nextmsc.com/report/microbial-biostimulant-market-ag5415
→
Click here for the complete report
→
nextmsc.com/report/microbial-biostimulant-market-ag5415
Follow Us LinkedIn
YouTube
2025–2035
20
33
Top 10
analysis period
companies profiled
countries covered
company shares
Copyright © Next Move Strategy Consulting
www.nextmsc.com