GLOBAL INDUSTRY REPORT Market Landscape · Forecast 2026–2035
Direct Battery Recycling Market Regenerating cathodes instead of melting them down — a USD 7.6 Bn circular-materials materials market by 2035
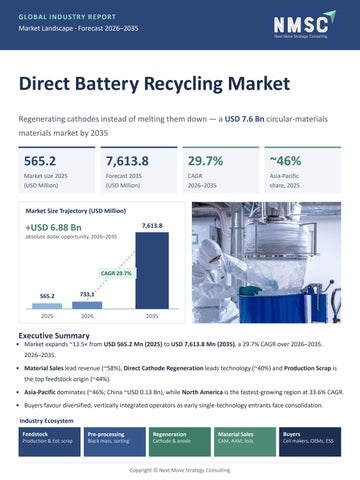
565.2
7,613.8
29.7%
~46%
Market size 2025 (USD Million)
Forecast 2035 (USD Million)
CAGR 2026–2035
Asia-Pacific share, 2025
Market Size Trajectory (USD Million) 7,613.8
+USD 6.88 Bn absolute dollar opportunity, 2026–2035
CAGR 29.7%
565.2
733.1
2025
2026
2035
Executive Summary • Market expands ~13.5× from USD 565.2 Mn (2025) to USD 7,613.8 Mn (2035), a 29.7% CAGR over 2026–2035. 2026–2035. • Material Sales lead revenue (~58%), Direct Cathode Regeneration leads technology (~40%) and Production Scrap is the top feedstock origin (~44%). • Asia-Pacific dominates (~46%; China ~USD 0.13 Bn), while North America is the fastest-growing region at 33.6% CAGR.
• Buyers favour diversified, vertically integrated operators as early single-technology entrants face consolidation. Industry Ecosystem Feedstock
Pre-processing
Regeneration
Material Sales
Buyers
Production & EoL scrap
Black mass, sorting
Cathode & anode
CAM, AAM, foils
Cell makers, OEMs, ESS
Copyright © Next Move Strategy Consulting
S E G M E NT A NA L Y S IS
Where the Value Pools Sit Incumbent segments hold today's revenue, but LFP, anode regeneration and technology licensing compound fastest to 2035. By Revenue Type — 2025 vs 2035 (USD Million) Mix shifts toward service fees and technology licensing as direct routes scale
2025
Material Sales 327.8
2035
Material Sales 3,942.0
Service 169.6
67.8
Service 2,382.0
Tech 1,290.0
By Technology Type — 2035 Forecast (USD Million) & CAGR Direct Cathode Regeneration
2,727.0 · 28.3%
Pre-processing for Direct Routes
2,064.0 · 29.3%
Direct Hydromet. CAM Synthesis
1,748.0 · 30.3%
Anode Regeneration ▲ fastest
1,074.0 · 34.3%
Direct Cathode Regeneration held ~40% share (USD 226.1 Mn) in 2025.
By Feedstock Chemistry (USD Million)
Leader vs. Fastest Grower
C hem istry
2025
2035
C AG R
N MC
214.8
2,484.0
27.7%
LFP ▲
169.6
3,103.0
33.7%
NCA
79.1
988.0
28.7%
Toll Processing ~36% · JV Tolling ~33.0% CAGR
LC O
56.5
604.0
26.7%
BUYER TYPE
LM O
28.3
280.0
25.8%
O ther chem istries
16.9
154.0
24.7%
SCRAP ORIGIN
Production Scrap ~44% · EoL Automotive Traction ~33.0% CAGR COMMERCIAL MODEL
Battery Cell Makers ~32% · Energy Storage Developers ~34.0% CAGR
LFP overtakes NMC as the largest chemistry by 2035.
WHAT IT MEANS • Investors: technology revenue (34.3% CAGR) offers asset-light, licensing-led upside. • Strategy teams: secure LFP and production-scrap feedstock to ride the fastest volume curves. • B2B buyers: JV tolling structures are gaining share over pure toll processing.
Copyright © Next Move Strategy Consulting
G RO W T H D RIV E RS & O P P ORTUNITIE S
Policy Pull Meets Scrap Push
Impact on CAGR (+/− %) Drivers vs. restraints, 2026–2035 horizon
+5.8
EU recycled-content mandates +4.6
Critical minerals supply policy
+3.9
Direct regeneration cost & yield
+3.2
Rising production scrap volumes Second-life / storage integration
+2.1
OEM low-carbon material demand
+1.8 −3.4
Limited EoL volumes pre-2030s
−2.6
Early-operator financial distress
−1.9
Commodity price volatility
Demand Drivers • EU Battery Regulation: minimum recycled Co, Li, Ni content from 1 Jan 2030. • Scrap ≈ two-thirds of feedstock through 2030 (IEA, cited by NMSC). • Direct routes: >97% yield, 38% lower cost at commercial scale.
Regional Growth Opportunity Map — USD Million, 2025 → 2035 Tile size reflects 2035 market; green tiles grow faster than the 29.7% global CAGR
North America
Asia-Pacific
Europe · 28.6%
Fastest-growing region
Largest region · ~46% share
113.0 → 1,402.0 EU recycled-content mandates
33.6%
27.6%
CAGR
CAGR
158.3 → 2,876.0
260.0 → 2,985.0
Critical minerals policy & domestic capacity build-out
India fastest country at ~36.0% CAGR; China ~USD 0.13 Bn (2025)
MEA · 26.7% 22.6 → 240.0
LATAM · 25.7% 25.7% 11.3 → 111.0
Strategic Opportunities 2026–2035 Production-Scrap Offtake
EU Compliance Demand
Second-Life Integration
Dedicated supply deals with cell and
Audit-ready recycled-content
Staged value extraction — stationary
CAM makers lock in stable, high-purity
documentation wins long-term contracts
stationary storage first, then direct
feedstock ahead of EoL volumes.
contracts with European OEMs before
recycling — improves unit economics.
before 2030.
economics.
Copyright © Next Move Strategy Consulting
C O M P E T ITIVE S C E NA RIO
A Fragmented Field, Consolidating Diversified materials majors compete with direct-recycling specialists; winners combine validated yield, feedstock diversity and capital resilience. Market Positioning
Competitive Positioning Matrix
BASF, Umicore offer direct recycling among
Capital Resilience & Feedstock Diversity →
DIVERSIFIED MAJORS
SCALED SPECIALISTS
Redwood Materials
BASF
several routes, leveraging broad chemicalprocessing expertise. Princeton NuEnergy: plasma-assisted process, >97% yield, 38% lower cost, 69% lower
Umicore Princeton NuEnergy
environmental impact.
Redwood Materials adds second-life repurposing to improve unit economics.
Regional recyclers
Ascend Elements
Ascend Elements, Li-Cycle: single-technology entrants hit by feedstock timing and policy shifts.
Li-Cycle
NICHE / REGIONAL
DISTRESSED PIONEERS
Multi-route
Direct-regeneration specialist
Technology Focus → Qualitative placement based on NMSC market-structure archetypes
Key Strategic Moves
Key Companies Profiled (20)
May 2025
Restructuring: Li-Cycle enters creditor protection despite USD
Brunp Recycling
Redwood Materials
475 Mn DOE loan commitment.
Ascend Elements
GEM Co.
Encory
SungEel HiTech
Princeton NuEnergy
RecycLiCo
Jun 2025
Diversification: Redwood launches Redwood Energy for second-life storage.
Aug 2025 Jan 2026 Jan 2026
BASF
Fortum
Expansion: PNE commissions Chester, SC — 5,000 tpa, scaling
Umicore
Duesenfeld
tpa, scaling to 15,000 tpa in 2026.
Green Li-ion
Northvolt
Partnership: Honda–PNE MOU on next-gen recycling
EcoPro CnG
Aqua Metals
technologies.
GRST
OnTo Technology
Funding: Redwood closes USD 425 Mn Series E with Google
Redivivus
LOHUM Cleantech
participating. Apr 2026
Consolidation: Ascend Elements files for Chapter 11.
STRATEGIC TAKEAWAY Buyers increasingly favour suppliers with diversified feedstock contracts spanning production scrap and end-of-life sources — rewarding vertically integrated, well-capitalised operators through 2035.
Copyright © Next Move Strategy Consulting
DIRECT BATTERY RECYCLING MARKET
Thank You Connect with our analysts for in-depth insights, custom segment and country data, and strategic guidance on the USD 7.6 Bn direct recycling opportunity.
Click here for the complete report →
Get in Touch WEB
TEL
@
Inside the Full Report
Official Website
• Forecasts 2026–2035 across 6 segmentation segmentation axes • 38 countries covered • 20 company profiles • Market share for top 10 companies • PESTEL and driver-impact analysis
www.nextmsc.com Contact Number
+1 857 758 5017 Email
info@nextmsc.com
Follow Us
Copyright © Next Move Strategy Consulting