GLOBAL MARKET RESEARCH BRIEF · 2025 –2035
Printed Circuit Heat Exchanger Market
Compact, diffusion-bonded thermal technology powering the LNG, hydrogen and sCO2 buildout — a USD 2.57 billion opportunity through 2035 Market size, 2025
Forecast, 2035
CAGR, 2026–2035
Leading share
USD 1.85B
USD 4.60B
9.5%
~33%
Base year value
From USD 2.03B in 2026
Broad-based growth
North America, 2025
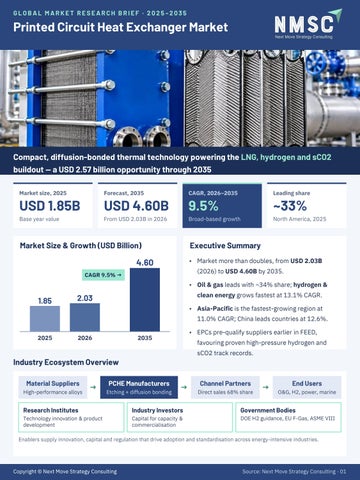
Market Size & Growth (USD Billion)
Executive Summary • Market more than doubles, from USD 2.03B
4.60
(2026) to USD 4.60B by 2035.
CAGR 9.5% →
• Oil & gas leads with ~34% share; hydrogen &
1.85
clean energy grows fastest at 13.1% CAGR.
2.03
• Asia-Pacific is the fastest-growing region at 11.0% CAGR; China leads countries at 12.6%.
2025
2026
• EPCs pre-qualify suppliers earlier in FEED,
2035
favouring proven high-pressure hydrogen and sCO2 track records.
Industry Ecosystem Overview Material Suppliers High-performance alloys
→
PCHE Manufacturers Etching + diffusion bonding
→
Channel Partners Direct sales 68% share
→
End Users O&G, H2, power, marine
Research Institutes
Industry Investors
Government Bodies
Technology innovation & product development
Capital for capacity & commercialisation
DOE H2 guidance, EU F-Gas, ASME VIII
Enablers supply innovation, capital and regulation that drive adoption and standardisation across energy-intensive industries.
Copyright © Next Move Strategy Consulting
Source: Next Move Strategy Consulting · 01
MARKET LANDSCAPE · SEGMENTATION
Where the Value Sits Today — and Tomorrow Oil & gas anchors today's revenue, but hydrogen & clean energy more than triples — from USD 0.35B to USD 1.20B — closing most of the gap by 2035.
Revenue by Application (USD Billion) 0.63
Oil & Gas Hydrogen & Clean Energy
Power Generation Chemical Processing
2025 2035 CAGR
1.39
8.2%
1.20 · fastest
13.1%
0.35
0.31
9.2%
0.75 0.27
8.7%
0.62
Marine
0.14 0.33
9.0%
Aerospace & Defence
0.07 0.15
7.9%
Food & beverage, HVAC & district energy, research & test and other industrial: USD 0.08B (2025) → USD 0.16B (2035)
2025 Revenue Share by Segment Offering Finished PCHE 79%
Aftermarket 21%
Construction Material Stainless Steel 46%
Titanium 23%
Nickel 21%
Other 10%
Sales Channel Direct Sales 68%
Distributor & Agent 32%
High-Growth Segments · CAGR 2026–2035
13.1%
12.4%
10.8%
10.7%
10.4%
Hydrogen & Clean Energy
Multi Stream
Aftermarket Services
Distributor & Agent
Titanium & Alloys
Sales channel
Construction material
Application
Heat transfer (Gas-toLiquid leads, 36%)
Copyright © Next Move Strategy Consulting
Offering
Source: Next Move Strategy Consulting · 02
GROWTH DRIVERS & OPPORTUNITIES
LNG Scale-Up and Hydrogen Build-Out Set the Pace Growth Catalysts vs. Risks · Impact on CAGR (percentage points) +2.1
Global LNG liquefaction capacity expansion
+1.8
Green & blue hydrogen infrastructure investment
+1.4
Advanced nuclear & sCO2 power cycle deployment
+0.9
Recyclability & compact-footprint retrofit demand
+0.7
Offshore & marine LNG carrier fleet growth
High fabrication & code-certification cost
−1.1 −0.8
Limited certified diffusion-bonding capacity
−0.6
Nickel & titanium price volatility
−0.4
Long qualification & lead-time cycles
Drivers add up to +6.9 pts vs. −2.9 pts from restraints. LNG impact window 2026–2032; hydrogen 2026–2035; nuclear/sCO2 2028–2035.
Regional Growth Opportunity Map · USD Billion, 2025 → 2035 Asia-Pacific
11.0% CAGR · fastest
Middle East & Africa
10.6%
0.52 → 1.48
CAGR
Shipbuilding & nuclear
0.15 → 0.41
power buildout
Green hydrogen mega-
Latin America
Europe
North America
9.4%
8.7%
8.5%
CAGR
CAGR
CAGR · largest (~33%)
0.11 → 0.27
0.46 → 1.06
0.61 → 1.38
Offshore gas processing
Hydrogen hubs & F-Gas
LNG export capacity
expansion
compliance
expansion
projects
Country Hotspots · CAGR
Whitespace Opportunities to 2035
China
12.6%
India
12.3%
Brazil
12.2%
Saudi Arabia
11.6%
UAE
11.0%
U.S.
8.2%
U.S. is the largest country market: USD 0.41B (2025) → USD 0.90B (2035).
Copyright © Next Move Strategy Consulting
Modular sCO2 waste-heat recovery Skid-mounted, nickel-alloy recuperators for mid-sized chemical & metals processors
Compact LNG bunkering vaporizers Deck-mountable units for dual-fuel vessels at APAC & European bunkering hubs
Standardized H2 refuelling modules Factory-tested precoolers that unlock recurring inspection & monitoring revenue
Source: Next Move Strategy Consulting · 03
COMPETITIVE SCENARIO
Certified Capacity Is the Moat in a Consolidating Field
20
33
Companies profiled
Countries covered
Moderately consolidated Top 10 companies account for a majority of certified diffusion-bonded fabrication capacity
Competitive Positioning Matrix · Business Archetype × Home Region Diversified Industrial Groups
Specialized Heat-Transfer Makers
Bundle PCHE with adjacent equipment
Edge in custom sCO2 & hydrogen duty
Parker Hannifin
Vacuum Process Engineering
Alfa Laval
Kelvion
Americas & Europe
Nexson Industry Tempco
Mitsubishi Heavy Industries
Kobe Steel
Sumitomo Precision Products
Asia-Pacific
Doosan Enerbility
Microchannel Devices
Precision Micro
DongHwa Entec
Energyn
Shanghai Heat Transfer GOT (Shanghai)
Morimatsu
Hangzhou Shenshi
Lanzhou LS
Jiangsu Sunpower Indicative placement of the 20 profiled players. Suppliers with in-house diffusion bonding and photochemical etching retain pricing power; company-level shares are available for the top 10 in the full report.
Key Strategic Moves JUNE 2026 · TECHNOLOGY DEMO
MAY 2025 · PARTNERSHIP / REFERENCE WIN
Sumitomo Precision Products completed Japan's first
Parker Hannifin (Heatric) selected for Highview Power's
real-world-level demonstration of its liquefied-hydrogen
300 MWh UK long-duration storage facility.
heat exchanger.
MAY 2026 · PRODUCT LAUNCH
M&A · SELECTIVE
Alfa Laval commercially launched its TS45 semi-welded
Deals target regional fabrication footholds and aftermarket
plate heat exchanger; HyBloc targets H2 station
service capability.
precooling.
MAY 2026 · CONTRACT EXPANSION
SERVICE BUNDLING
Doosan Enerbility signed a U.S. deal for four 370 MW
Inspection & monitoring subscriptions sold with new units
steam turbines & generators for Texas by 2029.
to lock in recurring revenue.
Copyright © Next Move Strategy Consulting
Source: Next Move Strategy Consulting · 04
LET'S CONNECT
Thank You
Turn a USD 2.57 billion opportunity into your next move. Connect with our analysts for in-depth segment, regional and competitive insights — and strategic guidance tailored to your investment or growth agenda.
→
Click here for the complete report
2025–2035
20
33
Top 10
Analysis period
Companies profiled
Countries covered
Company market shares
CONTACT US Official Website
Contact Number
www.nextmsc.com
+1 857 758 5017
info@nextmsc.com
Custom research, segment deep-dives and competitor benchmarking available on request.
Follow Us
Copyright © Next Move Strategy Consulting
YouTube
Twitter / X
www.nextmsc.com · 05