MARKET INTELLIGENCE REPORT · 2025–2035
Title Slide & Market Landscape
Global Compliance Carbon Market Carbon pricing becomes market infrastructure — a USD 489.98 billion opportunity by 2035
USD BILLION
USD BILLION
USD BILLION
GROWTH RATE
128.74
145.20
489.98
14.3%
Market size, 2025
Estimated size, 2026
Forecast, 2035
CAGR, 2026–2035
Executive Summary
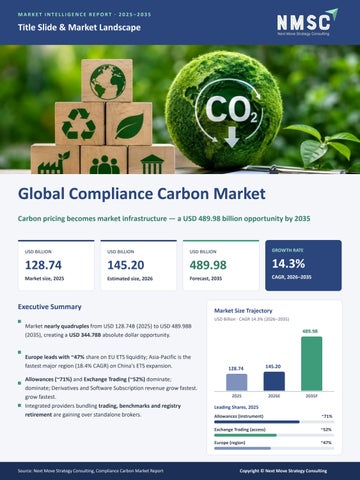
Market Size Trajectory USD Billion · CAGR 14.3% (2026–2035)
Market nearly quadruples from USD 128.74B (2025) to USD 489.98B (2035), creating a USD 344.78B absolute dollar opportunity.
Europe leads with ~47% share on EU ETS liquidity; Asia-Pacific is the fastest major region (18.4% CAGR) on China's ETS expansion. Allowances (~71%) and Exchange Trading (~52%) dominate; dominate; Derivatives and Software Subscription revenue grow fastest. grow fastest. Integrated providers bundling trading, benchmarks and registry retirement are gaining over standalone brokers.
Source: Next Move Strategy Consulting, Compliance Carbon Market Report
489.98
128.74
145.20
2025
2026E
2035F
Leading Shares, 2025 Allowances (instrument)
~71%
Exchange Trading (access)
~52%
Europe (region)
~47%
Copyright © Next Move Strategy Consulting
MARKET LANDSCAPE
Market Structure & Industry Ecosystem Allowances, Exchange Trading and Europe anchor a USD 128.74 billion market market (2025) Regional Revenue Share, 2025
Instrument Mix: 2025 → 2035
USD Billion · share of global market
USD Billion · CAGR 2026–2035 71%
Europe ~47% USD 60.51B
2025 share of market value (Derivatives ~8%)
Asia-Pacific ~24%
Instrument
USD 30.90B
128.74
North America ~22% ~22%
USD Bn
21%
2025
2035
CAGR
Allowances
91.41
313.59
13.1%
Offsets
27.04
112.70
15.3%
Derivatives
10.30
63.70
20.0%
USD MEA28.32B ~4%· USD 5.15B Latin America ~3%· 3.86B
3.86B
Segment Leadership Snapshot S eg m entatio n
Larg est sub - seg m ent (2025 share)
Fastest- g ro wing (C A G R 2026 –35)
Trad ing & M arket A ccess
Exchang e Trad ing · ~ 52%
Retail A g g reg atio n · 20.0%
Po st- Trad e Infrastructure
C learing & S ettlem ent · ~ 64%
Reg istry & Retirem ent · 15.5%
S chem e
EU ETS · ~ 38%
C O R S IA · 19.8%
End - U ser Ind ustry
Po wer G eneratio n · ~ 39%
Transp o rt · 19.0%
Techno lo g y & Infrastructure
Exchang e & Reg istry S o ftware · ~ 48%
C o nnectivity & A PIs · 16.0%
Revenue Stream
Fee Revenue · ~ 38%
S oftware S ub scrip tio n · 24.0%
Industry Ecosystem: From Credit Origination to Compliance Retirement 1 · Origination Project developers, validation & verification bodies
›
2 · Trading
3 · Post-Trade
4 · Intelligence
Exchanges, primary auctions,
Clearinghouses, settlement,
Data & price benchmarks,
OTC brokerage
›
›
registries & retirement
compliance advisory
KEY INSIGHTS
Market spans exchanges, clearinghouses, registries, developers, verifiers, data and advisory firms. Recurring software revenue (24.0% CAGR) is reshaping a fee-led revenue model. API connectivity and cloud-native registries are automating retirement and chain of custody.
Source: Next Move Strategy Consulting, Compliance Carbon Market Report
Copyright © Next Move Strategy Consulting
GROWTH DRIVERS & OPPORTUNITIES
What Is Powering 14.3% Annual Growth China's ETS expansion and rising EU allowance prices lead a USD 344.78 billion 344.78 billion growth window ABSOLUTE DOLLAR OPPORTUNITY
USD 344.78B Incremental value created, 2026–2035 Concentrated in exchange infrastructure, registry services and carbon market data platforms.
Growth Catalyst & Risk Matrix
Impact on CAGR, percentage points
China national ETS expansion to new sectors
+3.2
Rising EU ETS allowance prices
+2.6
Planned UK–EU ETS linkage
+2.4
New national ETS programs in emerging economies
+2.1
Growing CORSIA aviation offset obligations
+1.8
Cloud-native registry & API connectivity adoption
+1.6
Institutional participation in allowance derivatives
+1.4
Uncertainty on free allowance allocation reform−1.5 Price volatility from energy & geopolitical shocks Fragmented scheme design limiting fungibility
−1.2 −1.0
High-Growth Segments · CAGR 2026–2035 Software Subscription Revenue stream
24.0%
Derivatives Instrument
20.0%
Retail Aggregation Market access
20.0%
CORSIA Scheme
19.8%
Transport End user (EU ETS2)
19.0%
Aviation End user
18.6%
INVESTOR TAKEAWAYS
Seven drivers outweigh three restraints; China's ETS alone adds +3.2 pts to CAGR. Registry software and API platforms offer recurring subscription revenue across linked schemes. Watch EU free-allocation reform and energy-price volatility as the key near-term risks.
Source: Next Move Strategy Consulting, Compliance Carbon Market Report
Copyright © Next Move Strategy Consulting
GROWTH DRIVERS & OPPORTUNITIES
Regional Growth Opportunity Map Latin America and Asia-Pacific outpace a Europe-led market through 2035 2035
Europe USD 186.19B by 2035
11.9% ~47% share
Asia-Pacific
18.4%
12.0%
USD 166.59B by 2035
North America USD 88.20B by 2035
16.9%
Middle East & Africa USD 24.50B by 2035
Latin America
20.3%
USD 24.50B by 2035
Bubble size ∝ 2035 market size · Label = CAGR 2026–2035
Fastest-growing Scale markets
North America
Europe
Asia-Pacific
Middle East & Africa
Latin America
28.32 → 88.20
60.51 → 186.19
30.90 → 166.59
5.15 → 24.50
3.86 → 24.50
USD Bn, 2025 → 2035
USD Bn, 2025 → 2035
USD Bn, 2025 → 2035
USD Bn, 2025 → 2035
USD Bn, 2025 → 2035
State cap-and-trade
Most liquid EU ETS market
(California, RGGI) and
and pending UK–EU ETS
voluntary-to-compliance
linkage
National carbon pricing tied
China national ETS expansion; schemes in South Korea and Australia
compliance linkage
to net-zero diversification goals
Country Hotspots · CAGR 2026–2035
National pricing initiatives and compliance-linked project development
Market size USD Bn, 2025 → 2035
India
24.2%
2.47 → 21.66
U.S.
11.6%
20.67 → 61.74
China
19.2%
16.07 → 93.29
Germany
11.4%
13.31 → 39.10
Japan
15.3%
4.02 → 16.66
UK
11.1%
8.47 → 24.20
Canada
12.5%
5.95 → 19.40
U.S. is the largest country market (USD 20.67B, 2025); India is the fastestgrowing.
Asia-Pacific adds ~USD 136B by 2035, the largest regional increment, led by China's ETS. Early verification capacity in new APAC and LATAM schemes is a first-mover advantage. UK–EU linkage opens cross-scheme clearing and fungibility contracts for exchanges.
Source: Next Move Strategy Consulting, Compliance Carbon Market Report
Copyright © Next Move Strategy Consulting
COMPETITIVE SCENARIO
Competitive Positioning & Strategies A moderately consolidated market: exchanges win on liquidity, registries on trust registries on trust ▲ GLOBAL, MULTISCHEME REACH
STANDARD - SET T ER S & O RIGINAT O RS
GLO BAL MARKET INFRAST RUCT U RE LEADERS
Program administration, certification and project development for offset credits
Deep liquidity across linked schemes, clearing, benchmarks and data
Verra
Gold Standard
Climate Impact Partners
South Pole
ICE
Anew Climate
Xpansiv
CME Group
EEX
Nasdaq
S&P Global Commodity Insights
MERCHANTS, BROKERS & OFFTAKERS
REGIO NAL & EMERGING EXCHANGES
OTC brokerage, project offtake and portfolio trading for compliance buyers
Venue for domestic schemes and newly launched national ETS programs
Trafigura
Vitol
Mercuria
Marex
STX Group
REGIONAL /
Japan Exchange Group Climate Impact X
B3 (Brazil) Abaxx Exchange
SPECIALIZED ▼
CREDIT ORIGINATION & CERTIFICATION
Key Strategies Shaping the Field
Positioning is qualitative, by NMSC-identified archetype
Product Expansion
Partnerships
ICE launched EU Carbon Allowance 2 futures (May 2025) ahead of 2027 ETS2 roll-out.
Gold Standard × Trovio launched a nextgeneration Impact Registry (May 2026) for traceability and interoperability.
Record 20.9M environmental contracts in 2025; USD 117B in physically delivered allowances.
TRADING & MARKET INFRASTRUCTURE
Registry and data providers partner to extend coverage into new national schemes.
M&A & Bundling Selective consolidation through platform and data acquisitions. Exchanges bundle benchmarks + registry registry retirement with trading, favoring favoring integrated providers over standalone standalone brokers.
STRATEGIC IMPLICATIONS
20 companies profiled; a few global exchanges hold most compliance trading volume. Competition centres on liquidity, scheme coverage breadth and registry integration. Providers lacking cross-border settlement capability risk exclusion from institutional mandates.
Source: Next Move Strategy Consulting, Compliance Carbon Market Report
Copyright © Next Move Strategy Consulting
LET'S CONNECT
Thank You & Contact
Thank You Connect with our analysts for in-depth insights, segment-level forecasts and strategic guidance on the compliance carbon market.
Click here for the complete report →
WEBSITE
www.nextmsc.com
PHONE
+1 857 758 5017
info@nextmsc.com
FOLLOW US z
z LinkedIn
Source: Next Move Strategy Consulting, Compliance Carbon Market Report
YouTube
Twitter / X
Copyright © Next Move Strategy Consulting