
17 minute read
Lead Story: A Brief History of Notable Colorado Seismicity & Seismic Stations


By Kyren Bogolub

A Brief History of NOTABLE COLORADO SEISMICITY & Seismic Stations
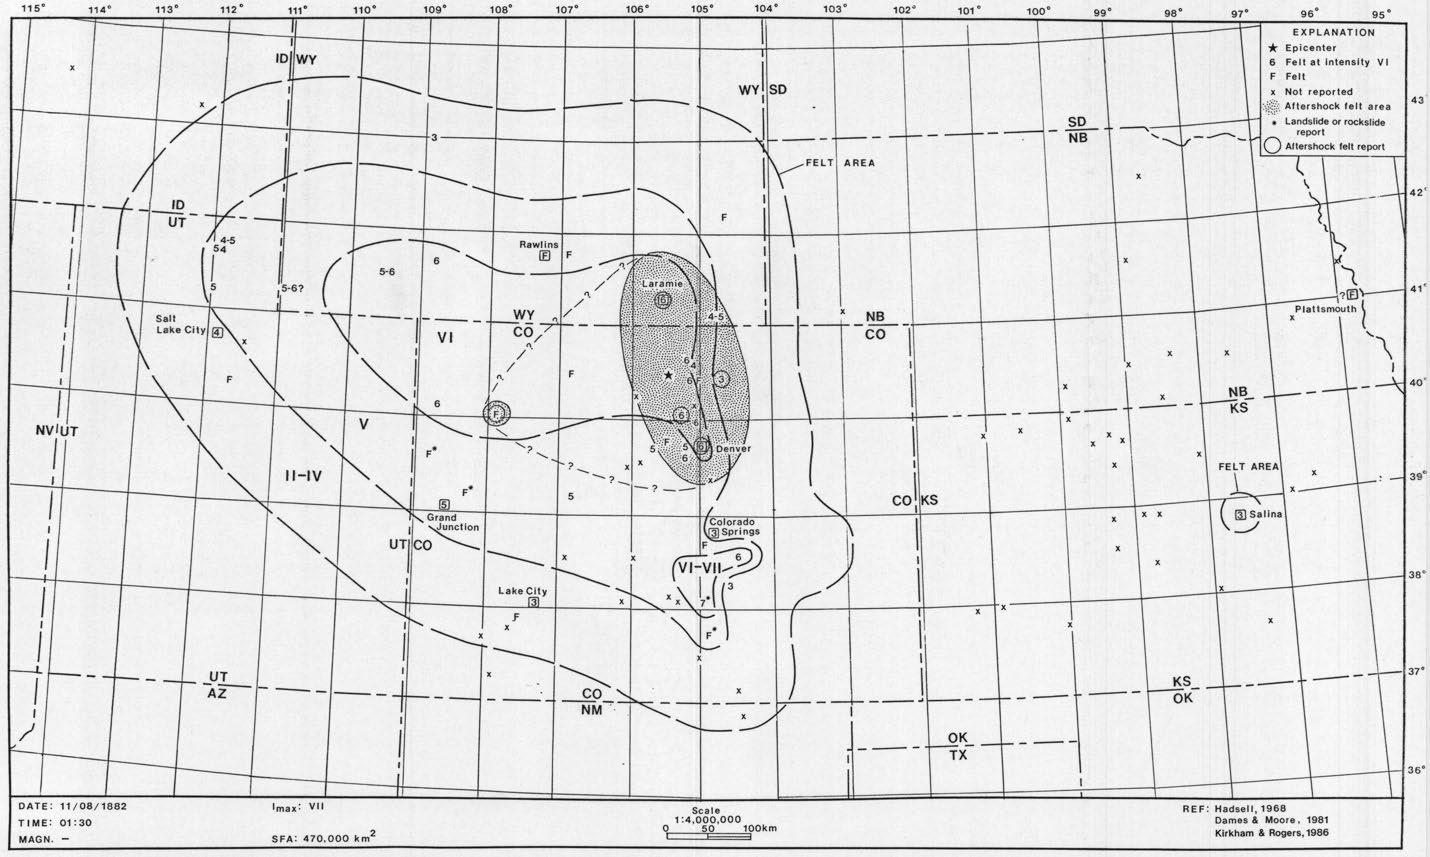
FIGURE 1: Isoseismal map for the 1882 Colorado earthquake from Kirkham and Rogers (1986)
Colorado’s largest known historical earthquake occurred on November 7th 1882. At the time of this earthquake, Colorado’s population was around 200,000 and its largest cities barely had 4,000 people (Kirkham and Rogers, 1986). Therefore, the reports of the earthquake being felt by people (known as “felt reports”) in various documents are sparse and unevenly distributed geographically across the state. Due to a lack of seismometers at the time, these felt reports are all we have to pin down the location, time of occurrence, and approximate magnitude of this historical earthquake, which has been a challenge. Estimates of these parameters are generally made by careful evaluation of historical records such as newspaper articles, government documents, and other archives maintained for historical purposes.
Analyzing these felt reports requires not only a good deal of assessment of each source’s reliability, but also a methodology for converting qualitative observations, such as plaster falling off a wall, into quantitative estimates of distance from the epicenter, and magnitude of the earthquake. One common method for doing this is by using the Modified Mercalli Intensity Scale. This scale assigns a value for “severity of ground shaking” to a location based on the various effects of the shaking on the landscapes, structures, or people. For example, an intensity of VIII or “severe” is assigned to an area if damage is great to poorly built structures and heavy furniture has been overturned. An intensity of IV or “light” applies to an area if the shaking is felt by many indoors, but few outdoors; dishes, windows and doors are disturbed. Assigning these intensities to historical records can be tricky since there are often unanswerable questions such as whether the person who felt the event was indoors or outdoors, or if a particular building that experienced damage was well built.
Once the intensities are assigned on the basis of historical records, the data points are contoured using the estimated intensity values. These contours, called isoseismals or isoseismal lines, create a sort of bullseye around the area of maximum intensity which can help narrow down the possible epicenter location. Local geology and known fault systems can further refine estimates of the epicenter location and magnitude. The isoseismal map for the 1882 » CONTINUED ON PAGE 14
Table 1 Colorado’s largest historic earthquakes from Colorado Geological Survey Publication MI-95
Date
1870, Dec. 4 1871, Oct. 1880, Sep. 17 1882, Nov. 7 1891, Dec. 1901, Nov. 15 1913, Nov. 11 1944, Sep. 9 1955, Aug. 3 1960, Oct. 11 1966, Jan. 4 1966, Jan. 23 1967, Aug. 9 1967, Nov. 27 2011, Aug. 22
Location
Pueblo/Ft. Reynolds Lily Park, Moffat Co Aspen North-Central CO Maybell Buena Vista Ridgeway area Montrose/Basalt Lake City Montrose/Ridgway N. E. of Denver CO-NM border near Dulce, NM N. E. of Denver N. E. of Denver Trinidad
Magnitude
6.6
5.5 5 5.5 5.3 5.2 5.3
Intensity
VI VI VI VII VI VI VI VI VI V V VII VII VI VII
»CONTINUED FROM PAGE 13 earthquake from Kirkham and Rogers (1986) is shown in Figure 1. Researchers typically compare isoseismal maps of pre-instrumental earthquakes to similar maps for modern earthquakes, for which the epicentral location, depth, and magnitudes are better known because of instrument recordings. Kirkham and Rogers (1986) concluded the 1882 earthquake probably occurred within the area where aftershocks were felt (stippled area in Figure 1). Spence et al. (1996) compared the felt effects of Colorado’s 1882 earthquake to Wyoming’s more recent 1984 Laramie Mountains earthquake. They concurred with Kirkham and Rogers’ epicentral location for the 1882 earthquake, and increased the estimated moment magnitude to 6.6.
Several other historical earthquakes are documented in Colorado (Table 1), with one of the largest being a 5.5 in 1960 (Talley and Cloud, 1962). This event was also assigned a location and magnitude using felt reports and the Modified Mercalli Intensity Scale to create an isoseismal map by Tally and Cloud (1962).
The arrival of seismographs in Colorado greatly improved our understanding of its seismicity. The first seismometer in Colorado was installed in 1909 at Regis University (at the time Regis College) in Denver and operated until 1988 (Udias and Stauder, 1996) when the Regis College Seismological Observatory ceased operations. This was the only station in the state until 1954 when the University of Colorado at Boulder installed a seismograph that operated until 1959 (Healy et al., 1968). In 1961, the Colorado School of Mines installed a station named GOL in Bergen Park near Evergreen Colorado.
A few months later in March of 1962, the Chemical Corps of the US Army began injecting waste water into a disposal well at Rocky Mountain Arsenal (RMA) (Evans, 1966). In April of 1962 a magnitude 1.5 earthquake occurred near Denver marking the beginning of a series of earthquakes, commonly known as The Denver Earthquakes (Figure 2). The Denver Earthquakes consisted of over 1000 events in the 1960’s including a magnitude a 5.3 on August 9th 1967. In 1966, David » CONTINUED ON PAGE 15
»CONTINUED FROM PAGE 14 M. Evans published a paper demonstrating a spatial and temporal correlation between the monthly rate of waste water injected at RMA and the monthly rate of earthquake occurrences in the Denver area. The original plot from his paper summarizing the temporal correlation is shown in Figure 3. This correlation demonstrated one of the earliest known cases of human-induced seismicity. Although it was only briefly installed, the University of Colorado at Boulder seismic station along with the Regis station were important for validating the induced seismicity hypothesis because it demonstrated a lack of seismicity in the area prior to onset of wastewater injection (Healy et al., 1966).
The identification of induced seismicity at RMA inspired decades of research projects and experiments. One of the most significant was the Rangely Oil Field experiment (Raleigh et al., 1976). In this experiment, researchers attempted to test the feasibility of controlling seismicity through fluid injection. Researchers selected the Rangely Oil Field in northwestern Colorado and northeastern Utah as a desirable location for this experiment because it was known to experience induced earthquakes, the geology was well studied, and the fluid pressure could be measured and controlled. In the experiment, researchers deployed an array of seismometers to record seismic activity in the oil field and then reduced the fluid pressure of the subsurface by backflowing injection wells. After concluding that the decrease in pressure correlated with a decrease in seismicity, they again increased the pressure to verify that fluid pressure can trigger earthquakes. This was a robust and significant conclusion; however, they also determined that induced earthquakes tend to occur on preexisting faults. This conclusion is intuitive, but also suggests a complicated relationship between fluid injection location and earthquake location. » CONTINUED ON PAGE 16
FIGURE 2: Map of Colorado seismicity from USGS catalog, 1960-2020. Highlighted areas show regions discussed in the text.

»CONTINUED FROM PAGE 15
The 1980’s and 1990’s saw the installation of several local seismic networks in Colorado and increased the capacity of researchers to publish seismicity catalogs. However, these networks were mostly targeting specific geographic regions and statewide coverage was still lacking (Sheehan, 2000). Still, these new networks enabled the study of a few notable earthquakes including the 1986 Crested Butte earthquake swarm (Figure 2). This series of about 200 earthquakes was partially recorded by an array of portable seismometers deployed by the U.S. Geological Survey (USGS) to monitor the swarm, which collectively was one of the largest releases of seismic energy in Colorado during modern times (Bott and Wong, 1995). At less than 10km spacing, this dense coverage of stations allowed for more accurate events locations, magnitudes as well as focal mechanisms. Focal mechanisms indicate the orientation of the fault and direction of slip that the earthquake occurred on. The earthquakes locations defined a northwest-striking and northeast-dipping fault plane which was consistent with many of the focal mechanisms in the swarm (Bott and Wong, 1995). The focal mechanisms also suggested that the events occurred on normal faults, leading researchers to conclude that crust in this region is subjected to » CONTINUED ON PAGE 17

FIGURE 3: Plot from Evans (1966) showing the number of earthquakes per month recorded in the Denver area and the monthly volume of contaminated wastewater injected into the Rocky Mountain Arsenal well.

FIGURE 4:
Map of Transportable Array station locations color coded by installation year. Map courtesy of USArray.
»CONTINUED FROM PAGE 16 an extensional stress regime. Apart from these instrument-recorded earthquakes, historical records also suggest that this region has a relatively high rate of seismicity (Kirkham and Rogers, 2000).
One of the notable seismic networks installed beginning in the 1980s was the Paradox Valley Seismic Network (PVSN). This network is owned and operated by the U.S. Bureau of Reclamation as part of the Paradox Valley Unit project. This project was a result of the U.S. Colorado River Basin Salinity Control Act of 1974 which was passed to help reduce the salinity of the Colorado River by preventing briny ground water from entering the river. This is accomplished by extracting the ground water and then reinjecting it 4.7 km underground in one of the deepest waste water wells in the world (Kharaka et al., 1997). Because of earlier studies on induced seismicity, the PVSN was installed several years prior to the onset of injection beginning in 1985 and has continued to operate in some configuration to this day. As predicted, induced earthquakes occurred as a result of the wastewater injection (Figure 2), notably a magnitude 3.9 in 2013 and a magnitude 4.5 in 2019 (USGS 2020). While the data is not publicly available, the stations of the PVSN have been used by the USGS to locate both local and global earthquakes.
A new window into Colorado seismicity arrived in 2004, when the EarthScope Transportable Array (TA) began making its way across the United States. This was an array of transportable seismometers that was designed to monitor a swath of land with instruments at a spacing of about 70 km for a period of two years before moving east to the next swath. Figure 4 shows the progression of the TA stations across the contemporaneous US. The TA stations occupied Colorado primarily from 2007-2010. From 2008-2009 the density of stations was further increased by the Colorado Rocky Mountain Experiment and Seismic Transects known as the CREST array. These stations provided unprecedented statewide seismic station coverage of Colorado. Seismicity studies from these two arrays provided a much more complete picture of statewide seismicity patterns.
Nakai et al. (2017a, b) used these two arrays to create a comprehensive catalog of Colorado seismicity from 2008-2010. The analysis of this catalog formed the basis of two papers, the first of which largely focused on the seismicity of the Rio Grande Rift (Nakai et al., 2017a). In this study, they found higher seismicity rates in northwestern Colorado than previously observed and used these seismicity patterns to confirm that the Rio Grande Rift extends into north-central Colorado. These patterns suggest that the extensional tectonic regimes inferred from earlier earthquake studies (such as the Crested Butte studies) are related » CONTINUED ON PAGE 18
»CONTINUED FROM PAGE 17 to this broad impact from extension of the northern Rio Grande Rift (Nakai et al., 2017a). Nakai et al. confirmed previous observations that seismicity in Colorado tends to manifest in localized swarms. A recent example of this is an east-west-trending swarm of small earthquakes (Figure 2) from late 2018 to 2019 located south and southeast of Great Sand Dunes National Park (Bell, 2020). The largest event of this Sand Dunes swarm was a magnitude 3.4 in February of 2019 (USGS, 2020).
The second paper focused on the seismicity of the Raton Basin in southern Colorado and northern New Mexico (Nakai et al., 2017b). This was the most seismically active area in the state of Colorado during the 2008-2010 study period (Figure 2). It is believed that most earthquakes in the Raton Basin are induced by wastewater injection, again due to a temporal correlation between injection rates and seismicity rates (Nakai et al., 2017b). In addition to the seismicity analysis, Nakai et al. (2017b) also used pore pressure modeling to show that the local geology and preexisting faults can cause fluid migration from the injection depth into deeper basement rocks causing induced earthquakes even at great distances from the injection location.
The current Colorado Geological Survey Seismic Network (CGSSN) began as four TA stations that were adopted by the Colorado Geological Survey (CGS) in 2010. The University of Colorado, Colorado State University and Colorado College all helped support CGS’s adoption efforts. Of all the TA stations that formally occupied Colorado, these sites were selected based on proximity to the Front Range, where most of Colorado’s population is concentrated, and data quality. Landowner permission was also a factor since the original TA agreements with station hosts were based on two year deployments only.
CGS formally named the CGSSSN in 2016 when they installed their first seismic station near Briggsdale in Weld County. This station was installed because a magnitude 3.2 induced earthquake shook the city of Greeley in 2014. This station also helped support a temporary regional network (with network code XU) deployed by Anne Sheehan and the University of Colorado. The XU network was used to study various aspects of induced seismicity including mitigation strategies (Yeck et al., 2016). Since its deployment, the XU network has been used to locate over 1200 small magnitude earthquakes from 2014-2019 most of which are in the vicinity of the Greeley Airport (Figure 2).
Since 2018, CGS has installed 4 more stations near Hayden, Lamar, Estes Park, and Greeley (station at Briggsdale was relocated to Greeley), these stations and others are shown on the map in Figure 5. The CGS stations are used to more precisely locate earthquakes not only in Colorado but all over the globe. CGS staff collaborate with many universities and colleges in Colorado including Colorado School of Mines, University of Colorado-Boulder, Colorado State University and Colorado Mountain College. These collaborations often help with gaining land access, providing students to assist with station installation and analyzing data. Over the next two years, CGS plans to install an additional four stations along the Front Range and central Colorado.
A typical set up for a CGSSN seismic station is shown in Figure 6. The seismic sensor is buried underground and a cable is run underground to the tower which hosts the solar panel, cellular antenna, GPS antenna, and a box with other needed equipment. The tower is located 15-20 feet from the sensor in order to reduce noise on the seismic records from the motion of the tower caused by wind. Figure 7 shows inside the equipment box which houses the battery, the charge controller, the cellular modem and the all-important digitizer/data logger. The digitizer takes the analog electronic signal from the sensor and converts it to digital counts which is then saved to a hard disk and telemetered to the USGS National Earthquake Information Center via cellular antenna.
Colorado has a long history of both natural and induced earthquakes, some of which have caused significant damage to buildings and infrastructure. Colorado is at a distance from active plate boundaries so its seismicity is unique, providing an opportunity to study as of yet poorly understood intraplate tectonics and the effects and mechanics of human induced earthquakes. Future seismic monitoring by CGS and others will help understand the geology and tectonics of our state as well as better assess the hazard and risks that this tectonic environment poses.
It is to the credit of William “Pat” Rogers that we have as much knowledge of Colorado Quaternary tectonics and earthquake hazards as we do. Pat Rogers » CONTINUED ON PAGE 19

FIGURE 5:
Map of longterm deployment seismic stations in Colorado. C0 is network code for stations operated by Colorado Geological Survey Seismic Network. N4 is the Central and Eastern U.S. Network. US is the United States National Seismic Network.
»CONTINUED FROM PAGE 18 was the former Chief of the Engineering an Environmental Section at the Colorado Geological Survey for decades and the interim Colorado State Geologist after John Rold retired and Vicki Cowart was appointed to the position. Pat spearheaded research into Quaternary faulting, paleoseismicity, and earthquake history. In addition to blazing trails in science, he was known for his love of the outdoors and volunteered many hours building and restoring hiking trails in Colorado. Pat Rogers passed away on September 5th, 2020. He will be missed and remembered by those who knew him and appreciated for the scientific legacy he left. On behalf of the Colorado Geologic Survey, I humbly say thank you, and good bye.
REFERENCES
Bell, J., 2020, Seismic Activity in the Northern Sangre de
Cristo Fault Zone: Master’s thesis, University of Colorado, Boulder Colorado, 60 p. Bott, J. and Wong, I.G., 1995, The 1986 Crested-Butte
Earthquake Swarm and Its Implications for Seismogenesis in Colorado: Bulletin of the Seismological Society of America, v. 85, p. 1495–1500.
Colorado Earthquake Hazard Mitigation Council,
2013, Colorado Earthquake Hazards: Colorado Geological Survey Publication MI-95, 1 p. Evans, D.M., 1966, The Denver Area Earthquakes and
The Rocky Mountain Arsenal Disposal Well: The
Mountain Geologist, v. 3, p. 23–36.
Healy, J.H., Jackson, W.H. and Van Schaack, J.R, 1966,
Microseismicity studies at the site of the Denver earthquakes, Geophysical and geological investigations relating to earthquakes in the Denver area, Colorado:
U.S. Geological Survey Open-File Report 66-60, 56 p.
Healy, J.H., Rubey, W.W., Griggs, D.T. and Raleigh, C.B.,
1968, The Denver Earthquakes: Science, v. 161, p. 1301–1310.
Kharaka, Y.K, Ambats, G., and Thirdsen, J.J., 1997,
Deep well injection of brine from Paradox Valley, Colorado: Potential major precipitation problems remediated by nanofiltration: Water Resources Research, v. 33, p. 1013-1020. Kirkham, R.M., and Rogers, W.P., 1986, An interpretation of the November 7, 1882 Colorado earthquake:
Colorado Geological Survey Open File Report 86-8, 39 p. » CONTINUED ON PAGE 21
FIGURE 6:
Installation of LAMA near Lamar Colorado.


FIGURE 7:
Equipment stored on tower at seismic station LAMA.
»CONTINUED FROM PAGE 19 Kirkham, R.M., and Rogers, W.P., 2000, Colorado
Earthquake Information, 1867-1996: Colorado Geological Survey Bulletin 52, 161 p. Nakai, J.S., Sheehan, A.F. and Bilek, S.L., 2017a, Seismicity of the Rocky Mountains and Rio Grande Rift from the EarthScope Transportable Array and CREST temporary seismic networks, 2008-2010: Journal of
Geophysical Research, v. 10, p. 31–20.
Nakai, J.S., Weingarten, M., Sheehan, A.F., Bilek, S.L.
and Ge, S., 2017b, A Possible Causative Mechanism of Raton Basin, New Mexico and Colorado Earthquakes Using Recent Seismicity Patterns and Pore
Pressure Modeling: Journal of Geophysical Research, v. 122, p. 8051–8065.
Raleigh, C.B., Healy, J.H. and Bredehoeft, J.D., 1976,
An Experiment in Earthquake Control at Rangely,
Colorado: Science, v. 191, p. 1230–1237. Sheehan, A.F., 2000, Microearthquake Study of the Colorado Front Range: Combing Research and Teaching in Seismology: Seismological Research Letters, v. 71, p. 175–179. Spence, W., Langer, C.J. and Choy, G.L., 1984, Rare,
Large Earthquakes at the Laramide Deformation
Front Colorado (1882) and Wyoming (1984): Bulletin of the Seismological Society of America v. 86, p. 1804–1819. Talley, H.C., and Cloud, W.K, 1962, United States
Earthquakes, 1960: U.S. Geological Survey Open-File
Report 84-960, 95 p. Udias, A. & Stauder, W., 1996, The Jesuit Contribution to Seismology: Seismological Research Letters, v. 67, p. 10–19. US Geological Survey, 2020, USGS Earthquake Catalog.
Yeck, W.L., Sheehan, A.F., Benz, H.M., Weingarten, M.
and Nakai, J., 2016, Rapid Response, Monitoring, and Mitigation of Induced Seismicity near Greeley,
Colorado: Seismological Research Letters, v. 87, p. 837–847.
KYREN BOGOLUB is responsible for maintaining the Colorado Geological Survey Seismic Network. Kyren is also a Ph.D. candidate in Geophysics at the University of Colorado, Boulder. Aside from Colorado seismicity, Kyren is also interested in western United States tectonics, in particular the formation of the Rocky Mountains.

