Palm Beach County, FL Market Trends
Prepared for Cogent Bank
EFFECTIVE DATE FEBRUARY 2025



Palm Beach County
Prepared for Cogent Bank
EFFECTIVE DATE FEBRUARY 2025

• Member of the Counselors of Real Estate (CRE)
• 40 Years Experience as a Real Estate Economist and Consultant
• Market and Feasibility Studies
• Economic Impact Studies
• New Community Product and Amenity Planning
• Consumer Preference and Engagement Analysis
• Private Club Amenity analysis
• Real Estate Investment Advisory
• 25 Years experience using GIS and Data Analytics tools to provide clients with a clear picture of market trends.
• Real Estate and Community Planning education from the Appraisal Institute and Urban Land Institute.
• Frequent Speaker and Lecturer on Economic and Real Estate Trends Analysis.
AND HOW DO I READ IT TO GET MEANINGFUL INSIGHTS.

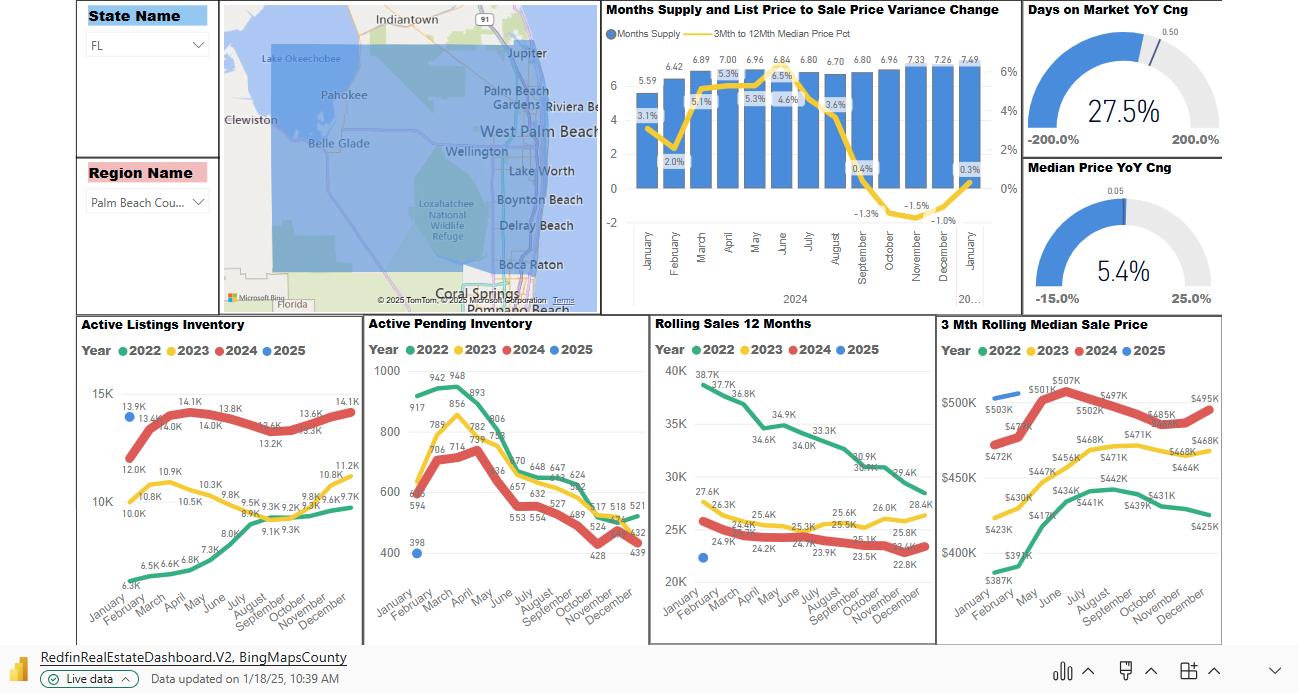
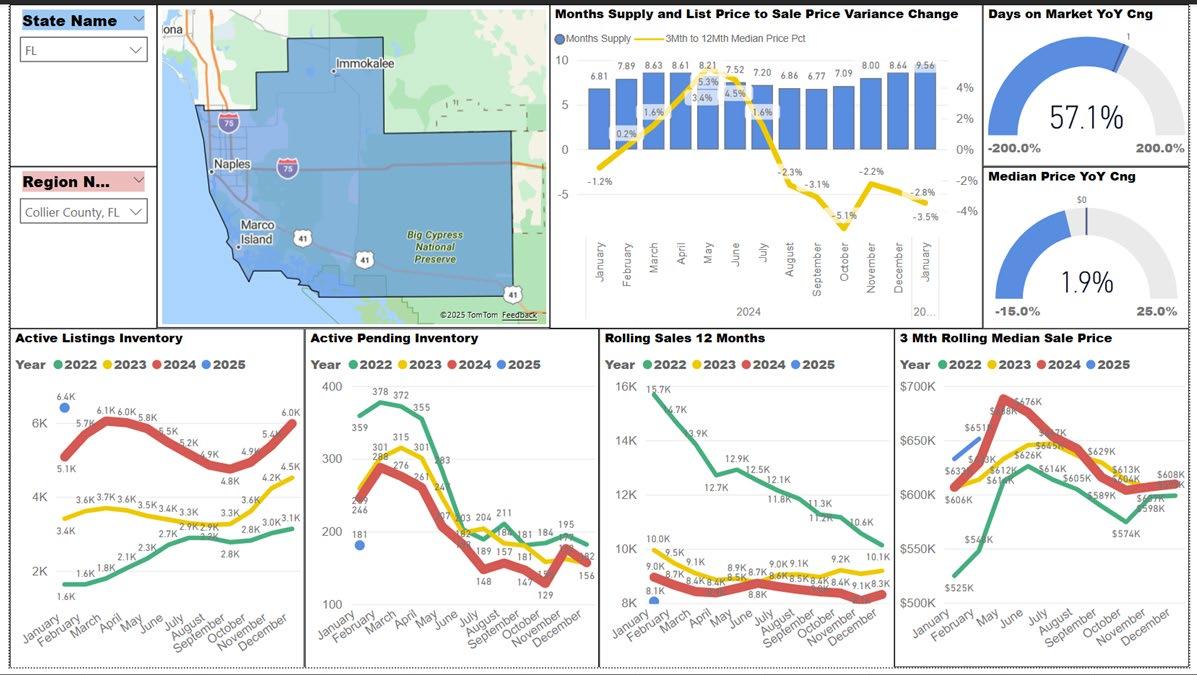
1. State Filter
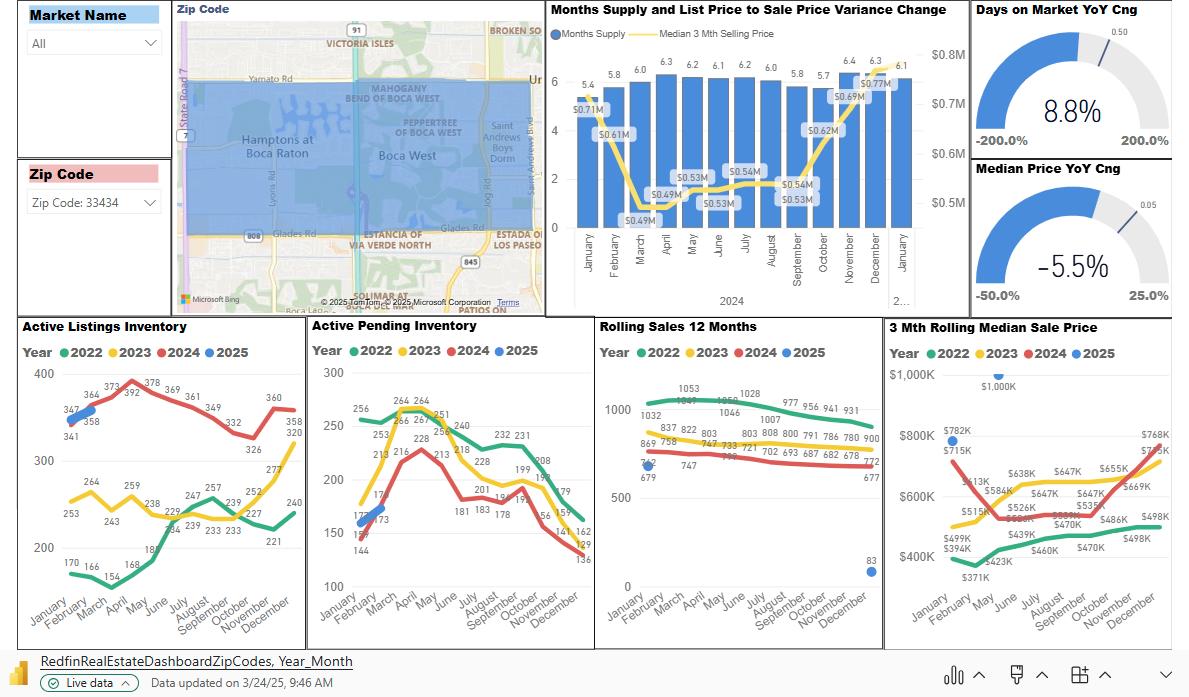
2. Region Name – County or Zip Code
3. Month over Month Year Comparison – These graphs show monthly trends for the same period for the past four years. Market Trends include;
• Active Listings Inventory
• Active Pending Inventory
• Rolling Sales 12 Months
• 3 Mth Rolling Sales Price
4. Map of the County or Region boundary
5. Months Supply and Percentage difference between List Price and Sales Price
• Months Supply – This shows the measure of Supply (Active Listings Inventory) divided by the Demand (Rolling Sales 12 Months). This shows active monthly inventory that sales over the past 12 sales.
• The percentage difference is the List Price by Sales Price for each month.
6. Days on Market YoY Change
• This shows the Change in Days on Market the prior year.
7. Median Price YoY Change
• This shows the Change in Median Price from the prior year.
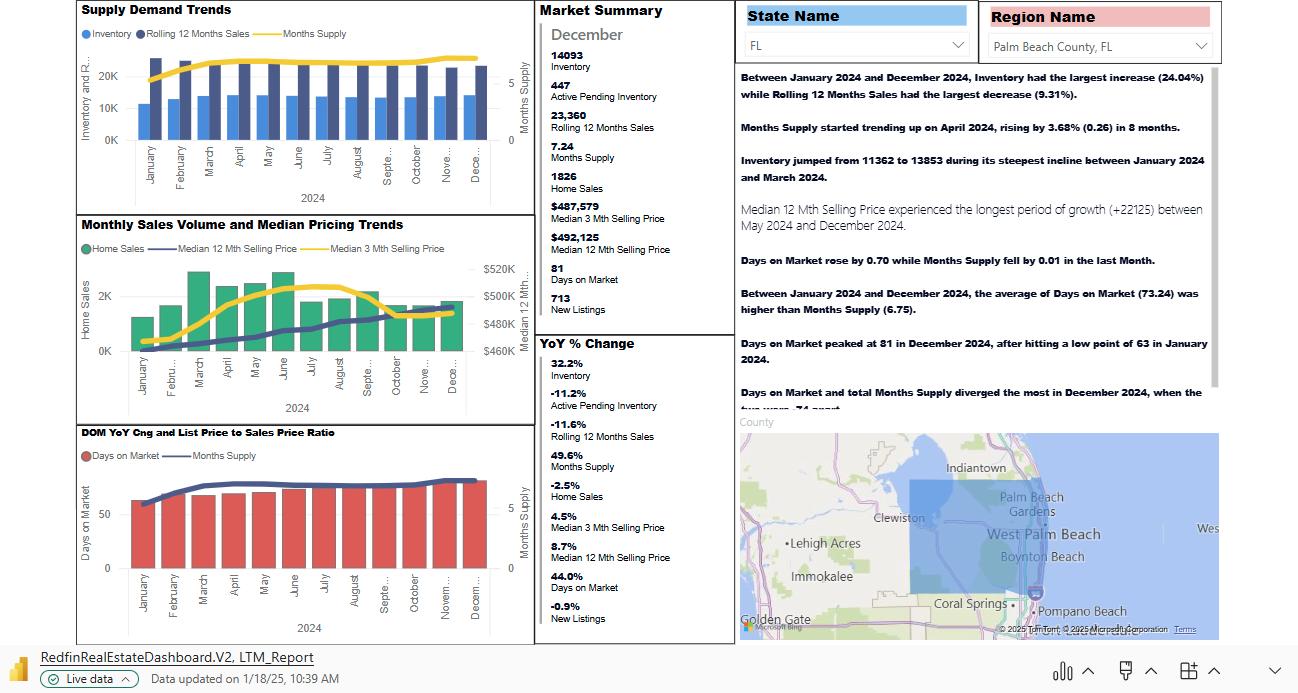
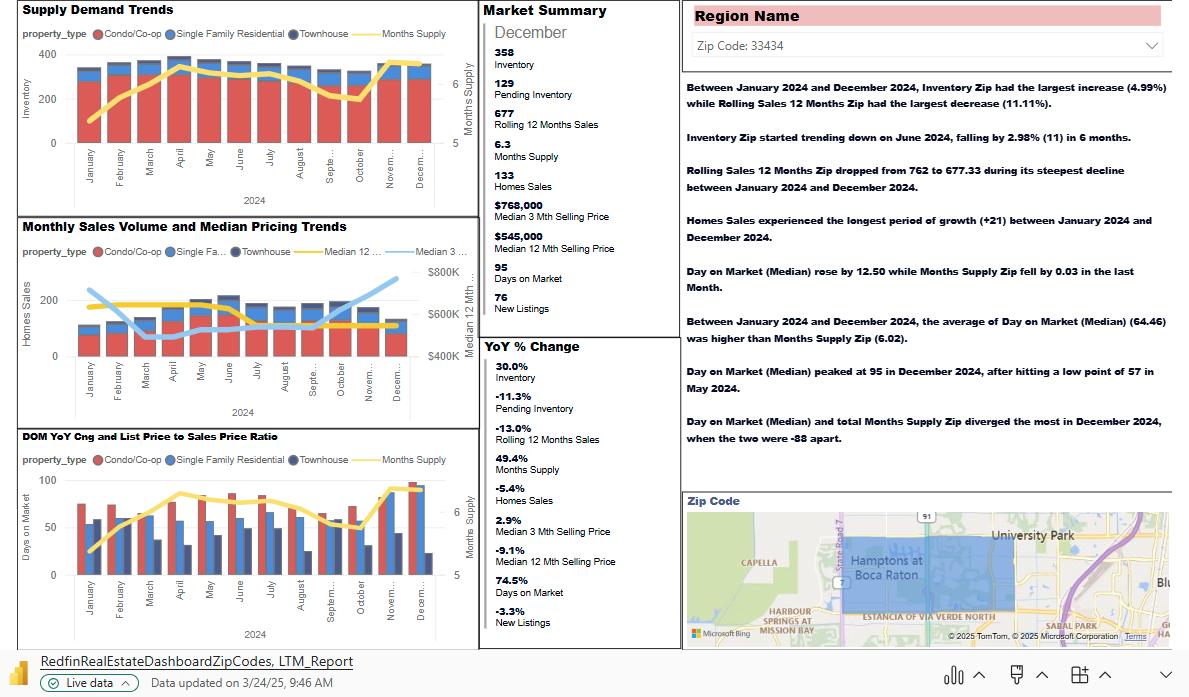
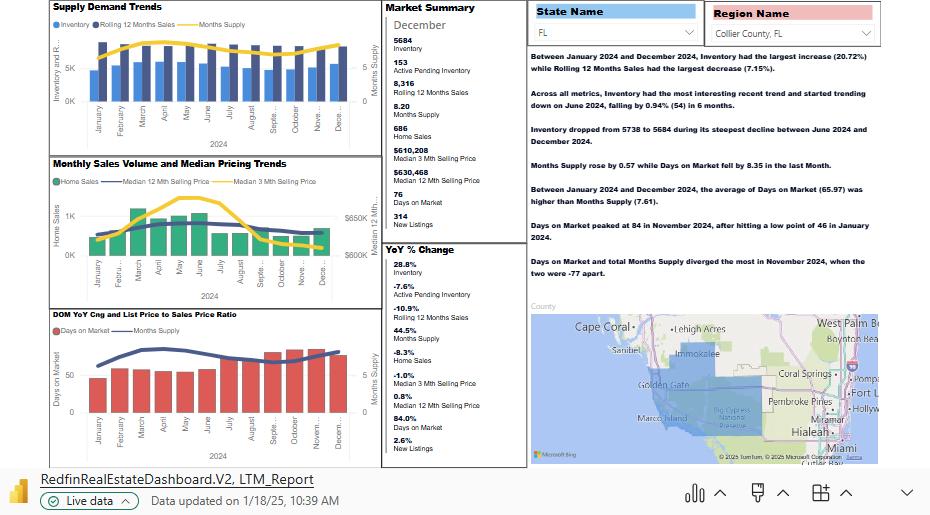
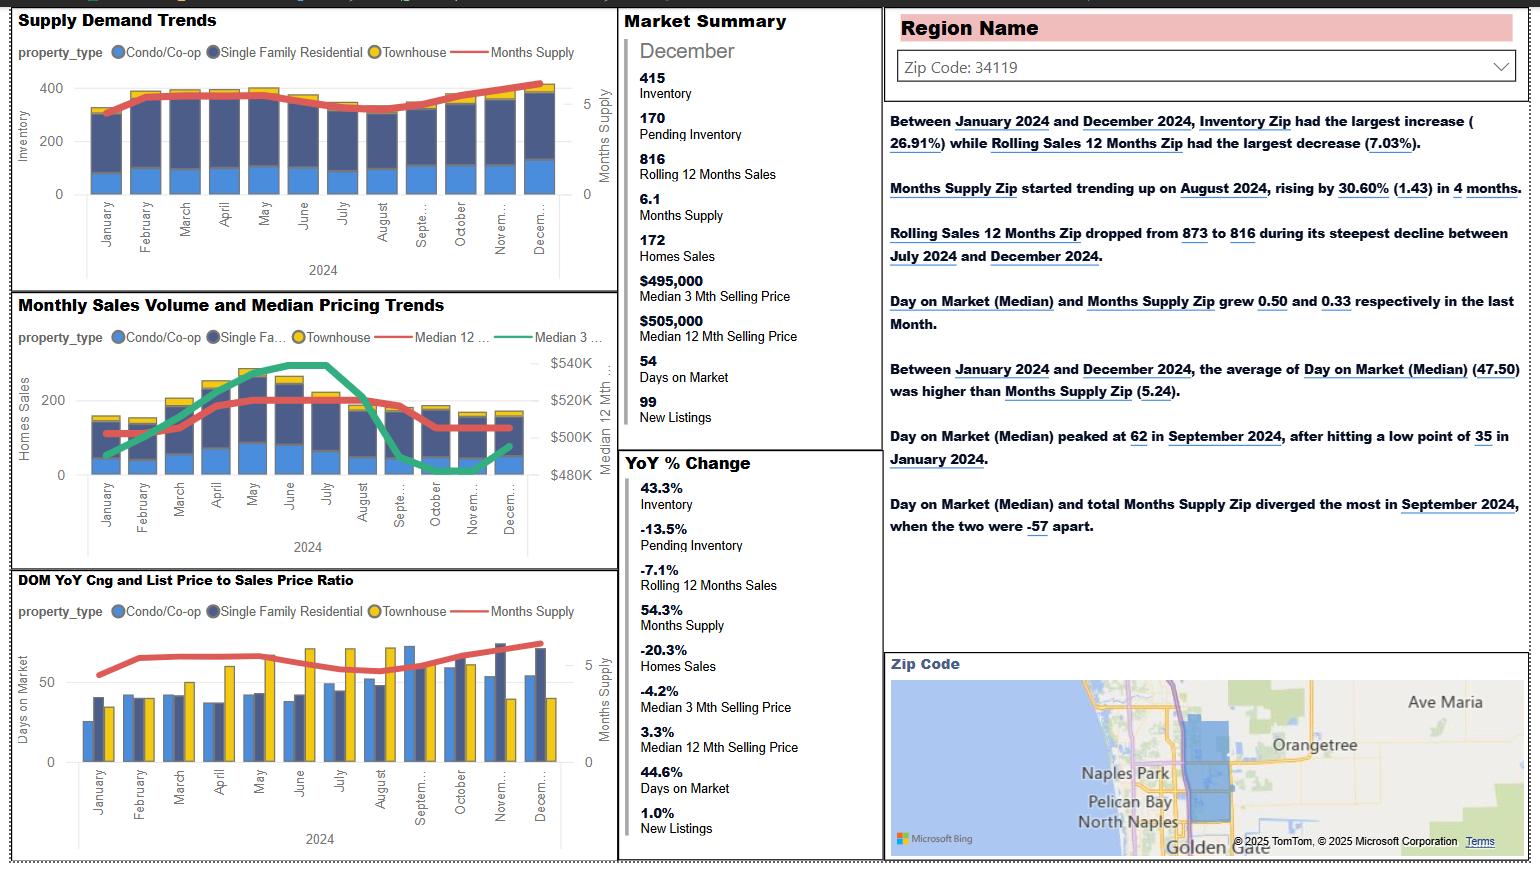
1. Supply Demand Trends – Months Supply shows the measure of Supply (Active Listings Inventory) divided by the Demand (Rolling Sales 12 Months). This shows active monthly inventory that sales over the past 12 sales.
2. Monthly Sales Volume and Median Pricing TrendsHomes sales by month and the rolling 12 and 3 monthly rolling median price.
3. Days on Market (DOM) YoY Cng and List Price to Sale Price Ratio – Days on Market YoY change by month by the Red bars and the List Price to Sale Price Ratio in the blue line.
4. Market Summary – A snapshot for the current month’s metrics for Inventory, Pending Inventory, Rolling 12 Months sales, Month Supply, Home Sales, Median 3 and 12 Mth Selling Price, Days on Market, New Listings and the Year of Year change for each metric.
5. State and Region (County or Zip Code) Filter
6. Discussion of Summary of Market Trends for the current market.
7. Map of the market.
Each metric is segregated by Condos (Light Blue), Single Family (Dark Blue) and Townhomes (Yellow)
1. Supply Demand Trends by product design – Months Supply shows the measure of Supply (Active Listings Inventory) divided by the Demand (Rolling Sales 12 Months). This shows active monthly inventory that sales over the past 12 sales.
2. Monthly Sales Volume and Median Pricing TrendsHomes sales by month and the rolling 12 and 3 monthly rolling median price.
3. Days on Market (DOM) YoY Cng and List Price to Sale Price Ratio – Days on Market YoY change by month by the Red bars and the List Price to Sale Price Ratio in the blue line.
4. Market Summary – A snapshot for the current month’s metrics for Inventory, Pending Inventory, Rolling 12 Months sales, Month Supply, Home Sales, Median 3 and 12 Mth Selling Price, Days on Market, New Listings and the Year of Year change for each metric.
5. State and Region (County or Zip Code) Filter
6. Discussion of Summary of Market Trends for the current market.
7. Map of the market.
Each metric is segregated by Condos (Light Blue), Single Family (Dark Blue) and Townhomes (Yellow)
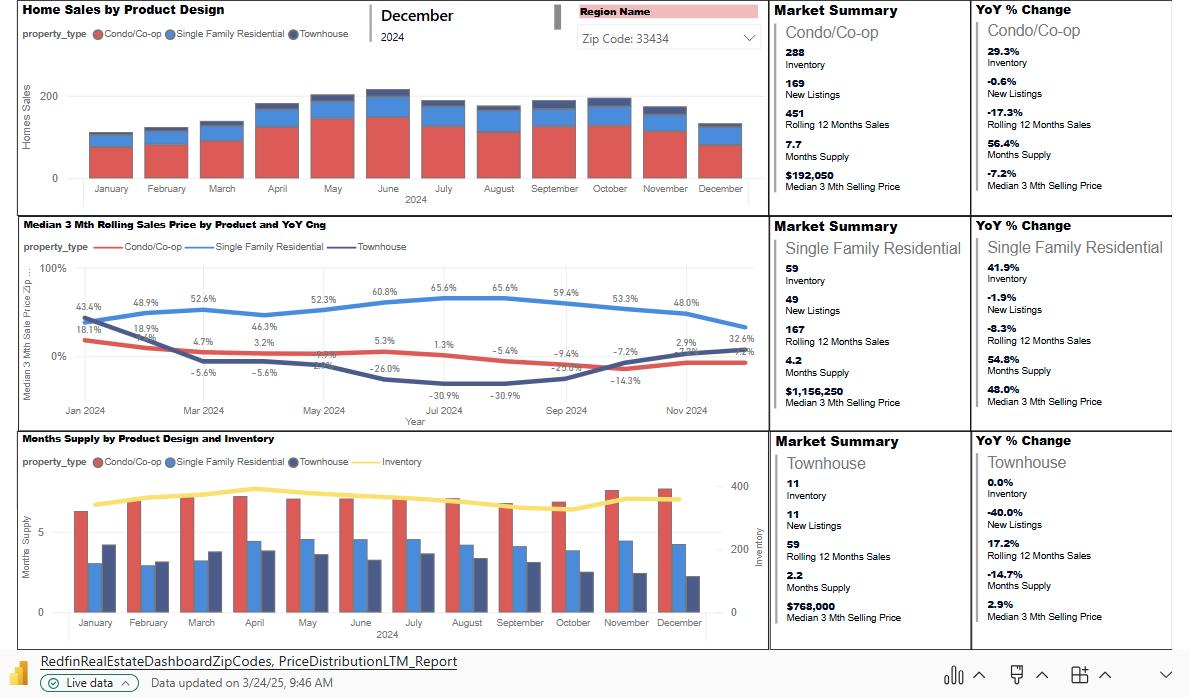
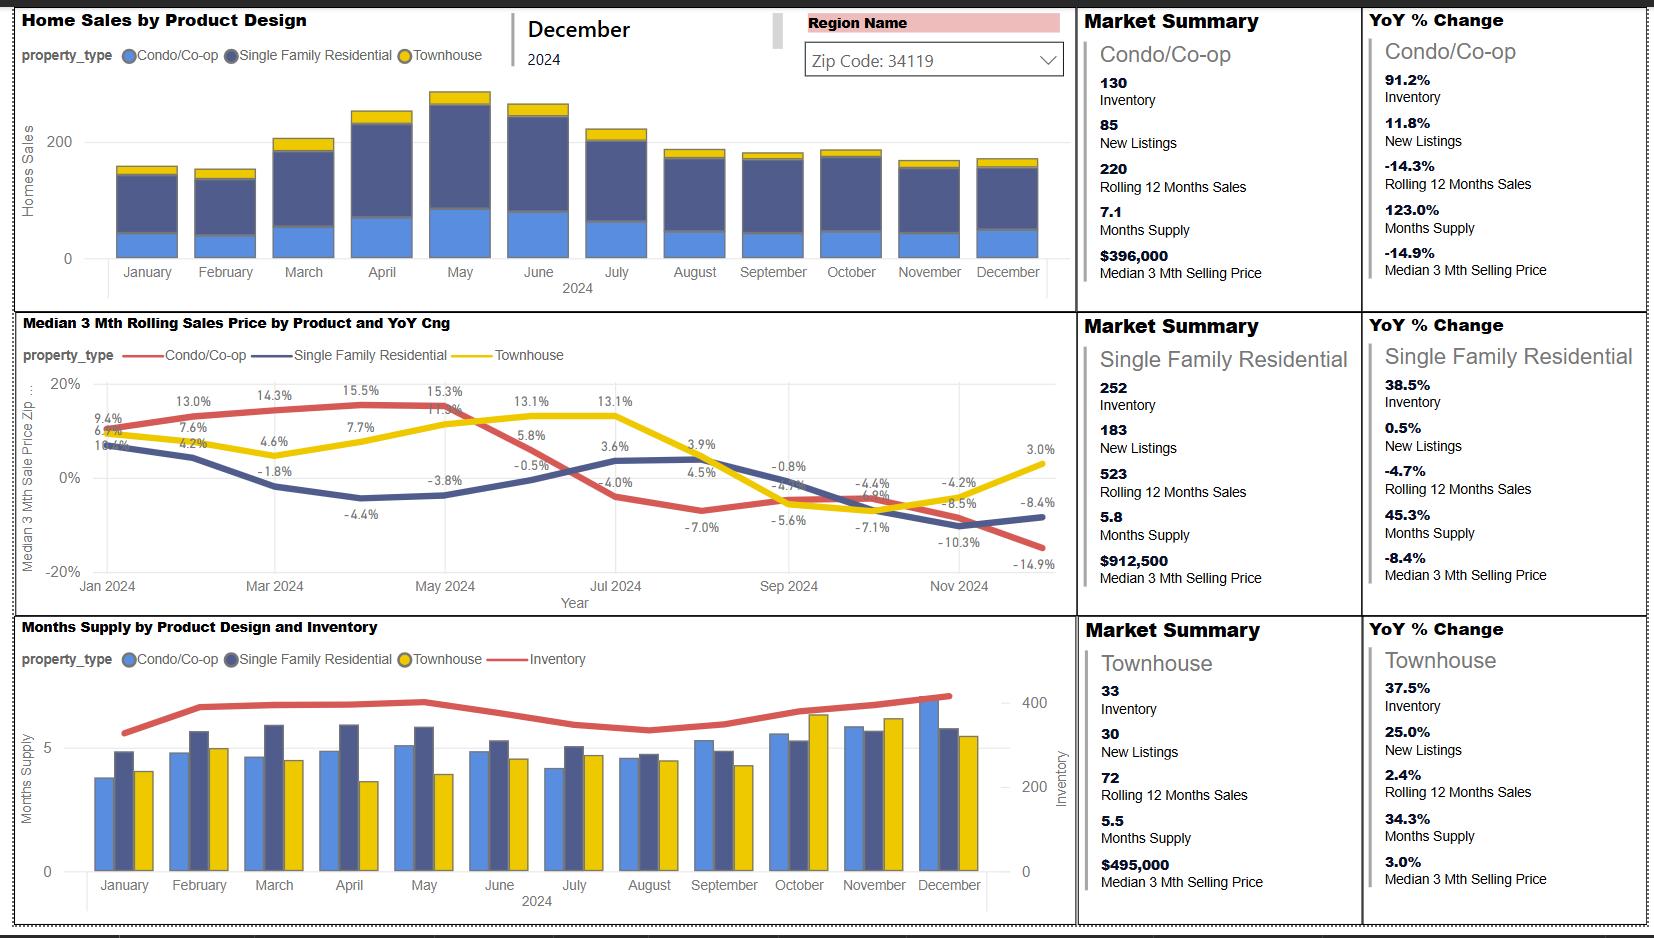
1. Home Sales by Product Design – The bar graphs show the monthly sales pace of homes segregated by product design.
2. Median 3 Mth Rolling Sales Price by Product and YoY Change - The line graph bars show the Median 3 Month Rolling Sales price for Condo’s, Single Family Homes and Town Homes
3. Month Supply by Product Design and InventoryThe bar graphs show the monthly supply segregated by product design and the line graph shows the monthly inventory.
4. Market Summary – A snapshot of the current month’s metrics for Inventory, New Listings, Rolling 12-month sales, Month Supply, and Median 3 3month selling price for each product design.
5. YoY % Change - A snapshot of the Year over Year Change (YoY %) for the current month’s metrics for Inventory, New Listings, Rolling 12-month sales, Month Supply, and Median 3 3-month selling price for each product design.
• Last Twelve Months (LTM) - also known as "Trailing Twelve Months" (TTM) or "Rolling Twelve Months," refers to the most recent 12-month period for which real estate trends are available.
• Inventory - refers to the number of properties available for sale for the period as determined by the MLS, Developer, or Builder.
• Pending Inventory - refers to the number of properties that currently have a contract but have not yet closed and settled as determined by the MLS, Developer, or Builder.
• New Listings - refers to the number of properties that have been listed for sale within the last 30 days as determined by the MLS, Developer, or Builder.
• 12-Month Rolling Sum of Sales - is a financial metric that calculates the total sales over the most recent 12-month period, updating continuously as each new month concludes. This approach provides a dynamic view of the real estate market’s performance, smoothing out short-term fluctuations and highlighting longer-term trends.
• Months of Supply – this metric indicates how many months it would take to sell all the current homes on the market (Inventory), given the current sales pace. It's calculated by dividing the total number of active listings by the number of 12 Months Rolling sum of sales for the current month. The calculation is “Current Months Inventory” – 5687 divided by the “Current Months Rolling 12 Months Sales” – 8315, resulting in the monthly supply at .63 times 12 months for a result of 8.20 months supply.
• Home Sales – Home sales are the number of closed properties settled for the current month.
• Median Value – is the value that separates a data set into two halves, with 50% of the data points falling below it and 50% above. The data must first be arranged in ascending order to determine the median.
• Average Value - is a single value representing a data set’s central point. The most commonly used average is the arithmetic mean, calculated by summing all the numbers in the data set and then dividing by the count of those numbers.
• 12-Month Rolling Selling Price – is a statistical measure used to analyze trends by smoothing out short-term fluctuations in data over a continuous 12-month period. This method calculates the average price of a particular item or metric for the most recent 12 months, updating the calculation with each new month.
• 3-Month Rolling Selling Price – is a statistical measure used to analyze trends by smoothing out short-term fluctuations in data over a continuous 3-month period. This method calculates the average price of a particular item or metric for the most recent 3 months, updating the calculation with each new month.
• Days on Market—In real estate, this reflects the total time the property is on the market from the initial listing date to the date it is put under contract.
• Year over Year Change – The percentage change for each variable used in the analysis.
• Zip Code – A ZIP Code is a numerical code used by the United States Postal Service (USPS) to facilitate the efficient sorting and delivery of mail. In this report, it identifies a geographic boundary to denote a demographic area for the larger municipality.
• Product Design—The report included product designs for Condominiums, which include a single unit within a multi-family building, Single-Family Homes, which are detached, single-structure, and Town homes, which are multi-story residential dwellings that share one or more walls with adjacent units. Each unit typically has its separate entrance and may include private outdoor spaces such as a small yard or patio.