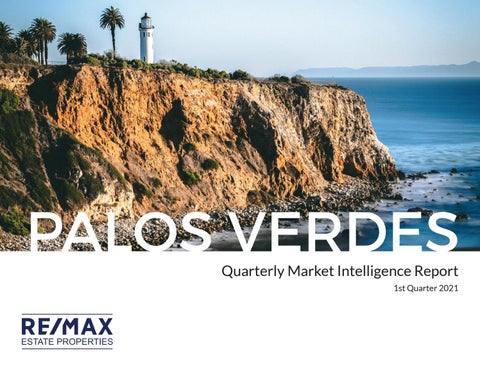
PALOS VERDES Quarterly Market Intelligence Report 1st Quarter 2021
PALOS VERDES MARKETS Harbor City
4
Palos Verdes Estates
6
Rancho Palos Verdes
8
Rolling Hills
10
Rolling Hills Estates
12
San Pedro
14
Wilmington
16
REAL ESTATE KEY TERMS MEDIAN PRICE: The price of the property that falls in the middle of the total number of properties sold in the given time period.
PRICE PER SQUARE FOOT: Measures the home’s sales price for an individual square foot.
PROPERTIES FOR SALE: The total number of available properties for sale.
DAYS ON MARKET (CLOSED SALES): The number of days a property is on the market prior to accepting an offer.
SALES RATIO: Defines market speed and determines whether the market currently favors buyers or sellers. A Buyer’s Market is a ratio from 0% to 14%; A Balanced market ratio is from 15 to 20%; A Seller’s Market ratio starts at 21% and up. If the sales ratio exceeds 100%, it means that the sales from previous month exceed current inventory.
The Palos Verdes Quarterly Market Intelligence Report is published quarterly based on the data available at the start of each month. All data presented is based on data supplied by CRMLS. Neither the Associations of REALTORS® nor their MLS’s guarantees or is in any way responsible for its accuracy. Information is deemed reliable, but not guaranteed. Copyright © 2021.
HARBOR CITY Harbor City is a growing, vibrant community just east of the Palos Verdes Peninsula and 30 minutes south of downtown Los Angeles. Ideally located as a gateway between the port cities and beach cities, residents have easy access to explore the greater Los Angeles area. Harbor City is home to an expansive Kaiser hospital, regional park, and community college - providing avenues for wellness and work opportunities. Housing in Harbor city is a mixture of single-family residences and low rise apartments, many of which are walkable to delicious restaurants and parks.
ATTRACTIONS
RESTAURANTS
• Ken Malloy Harbor Park
• Harbor City Library
• Tacos El Goloso
• Philipo's Pizza and Pasta
• Machado Lake
• Harbor City Skatepark
• Raku Sushi Tonkatsu
• Monarca's Mexican Food
• Los Angeles Harbor College
• The Skating Edge Ice Arena
• Baja Fish Grill
• Chicken Maison
MARKET SUMMARY
1ST QUARTER 2021 TOTAL INVENTORY
TOTAL SALES
MEDIAN SALES PRICE
MEDIAN DAYS ON MARKET
MEDIAN PRICE PER SQUARE FOOT
SALES RATIO
42
49
$681K
7
$419
117%
2020
55
31
$549K
32
$392
56%
PERCENT CHANGE
-24%
+58%
+24%
-77%
+7%
+107%
1ST QUARTER
2021 1ST QUARTER
YEAR-OVER-YEAR TRENDS $775,000
$597,000 $625,000
$542,203
$641,620
$507,500 17
14
Jan-20
20
20
18 9 Feb-20
8 Mar-20
9
Jan-21
17
16
Feb-21
16
13
Mar-21
PALOS VERDES ESTATES Master-planned by noted landscape architect Fredrick Law Olmstead Jr., Palos Verdes Estates is perched on the northwestern edge of the Palos Verdes Peninsula. The city ideally located for postcard perfect views and privacy while still offering close proximity to South Bay beach city nightlife. Known for it's high performing schools, Palos Verdes Peninsula High School is consistently found in top ranks in national publications. Residences in the area are pleasantly placed in between several open and green spaces and range from mid-century modern family homes to $10 million+ palatial estates - offering many options for buyers.
ATTRACTIONS
RESTAURANTS
• Palos Verdes Golf Club
• Flat Rock Point & Beach
• Salsa Verdes
• Malaga Cove Ranch Market
• Bluff Cove Trail
• George Allen Field
• Black Bamboo Sushi
• Rafaello's Pizza
• Malaga Dunes
• Roessler Point
• The Cove Cafe
• Lunada Market & Deli
MARKET SUMMARY
1ST QUARTER 2021 TOTAL INVENTORY
TOTAL SALES
MEDIAN SALES PRICE
MEDIAN DAYS ON MARKET
MEDIAN PRICE PER SQUARE FOOT
SALES RATIO
120
52
$2.01M
19
$799
43%
2020
123
24
$1.89M
49
$698
20%
PERCENT CHANGE
-2%
+117%
+7%
-61%
+14%
+119%
1ST QUARTER
2021 1ST QUARTER
YEAR-OVER-YEAR TRENDS $2,337,500
$2,220,000
$1,677,000
$1,611,250
$1,932,000
48
46
45
$1,875,000
32
44
28
8 Jan-20
6 Feb-20
10
Mar-20
13
Jan-21
20
Feb-21
19
Mar-21
RANCHO PALOS VERDES Anchored by the iconic Point Vicente Lighthouse and dramatic coastal views of Catalina Island and beyond, Rancho Palos Verdes is the largest city on the peninsula. Like it's neighbors, the city enjoys highly ranked schools and is consistently ranked as one of the wealthiest zip codes in the United States. Recreation activities abound in the many horse and hiking trails as well as two golf courses, the Terranea resort, and several parks. Top city employers are in the education, resort, and real estate industries. Real estate opportunities are largely singlefamily homes that range from mid-century traditional single-story homes to truly exceptional estates.
ATTRACTIONS
RESTAURANTS
• Los Verdes Golf Course
• Peninsula Raquet Club
• Mar'sel
• Tomatillo Mexican Grill
• Point Vicente Lighthouse
• Terranea Resort
• Swan Thai
• Nelson's
• Abalone Cove Trail & Beach
• Del Cerro Park
• Avenue Italy
• Peninsula Tap House
MARKET SUMMARY
1ST QUARTER 2021 TOTAL INVENTORY
TOTAL SALES
MEDIAN SALES PRICE
MEDIAN DAYS ON MARKET
MEDIAN PRICE PER SQUARE FOOT
SALES RATIO
198
121
$1.45M
10
$653
61%
2020
303
93
$1.26M
29
$550
31%
PERCENT CHANGE
-35%
+30%
+15%
-64%
+19%
+99%
1ST QUARTER
2021 1ST QUARTER
YEAR-OVER-YEAR TRENDS $1,312,500
$1,500,000
$1,262,500
$1,437,500
$1,417,500
$1,200,000
97
109
97 32
Jan-20
76
75
31
Feb-20
30
Mar-20
47
34
Jan-21
35
Feb-21
52
Mar-21
ROLLING HILLS For those ultimate privacy seekers, Rolling Hills is the perfect community. This equestrian friendly city is entirely comprised of private land and is only accessible by three gates with 24/7 staffing. Located in the central portion of the Palos Verdes Peninsula, residents are still treated to stunning coastal views and outdoor parks and trails for outdoor activities. Bordered by Portuguese Canyon, Rolling Hills Estates, and Rancho Palos Verdes, Rolling Hills offers a peaceful setting while within close proximity to fine dining, sport and recreation areas, and professional services.
ATTRACTIONS • Hesse's Gap
• Aqua Magna Canyon
• Saffo's Rest
• Westfield Park
• Stormhill Park
• Portuguese Canyon
MARKET SUMMARY
1ST QUARTER 2021 TOTAL INVENTORY
TOTAL SALES
MEDIAN SALES PRICE
MEDIAN DAYS ON MARKET
MEDIAN PRICE PER SQUARE FOOT
SALES RATIO
36
12
$3.81M
72
$912
33%
2020
35
7
$2.73M
159
$733
20%
PERCENT CHANGE
+3%
+71%
+39%
-55%
+24%
+67%
1ST QUARTER
2021 1ST QUARTER
YEAR-OVER-YEAR TRENDS $4,100,000
$4,050,000
$4,000,000 $3,385,000
$2,575,000 $1,525,000
13
10 1 Jan-20
12 1
Feb-20
5
Mar-20
9
14
13 5
Jan-21
3 Feb-21
4 Mar-21
ROLLING HILLS ESTATES Founded in 1957, Rolling Hills Estates offers small town, semi-rural living with a thriving city organization. Residents are afforded three convenient shopping centers, dining, trail access, and a myriad of local community events throughout the year. The city is best known for it's love of all things equestrian, offering over 25 miles of scenic horse trails and an Equestrian Center. Real estate is largely single-family homes with nods to several custom architectural styles to choose from. Located on the northern end of the Peninsula, residents enjoy the tight-knit community as well as the close proximity to urban centers, industry, and world-famous beaches.
ATTRACTIONS
RESTAURANTS • Mama Terrano
• South Coast Botanic Garden
• Rolling Hills Park Tennis Club • Chicken Maison
• Peter Weber Equestrian Center
• Promenade Ice Chalet
• The Original Red Onion
• The Crepery Cafe
• Rolling Hills Little League
• Giorgio's
• TantaWan Thai Cuisine
MARKET SUMMARY
1ST QUARTER 2021 TOTAL INVENTORY
TOTAL SALES
MEDIAN SALES PRICE
MEDIAN DAYS ON MARKET
MEDIAN PRICE PER SQUARE FOOT
SALES RATIO
58
75
$1.39M
9
$642
129%
2020
192
69
$1.12M
13
$579
36%
PERCENT CHANGE
-70%
+9%
+24%
-30%
+11%
+260%
1ST QUARTER
2021 1ST QUARTER
YEAR-OVER-YEAR TRENDS $1,368,500 $1,068,000
24
$1,444,500
$935,000 74
63
55
$1,458,000
$1,265,000
23
22
20
21
19
30
36
7
Jan-20
Feb-20
Mar-20
Jan-21
Feb-21
Mar-21
SAN PEDRO San Pedro is a unique and vibrant community that feels like it's own city. San Pedro is one of the cities with direct access to The port of Los Angeles, a major international seaport. Originally dominated by the fishing industry, San Pedro has grown into a working class community with a wide variety of outdoor recreation spaces, family-friendly activities, and a thriving shopping and dining scene. San Pedro is also hosts the annual Shakespeare by the Sea festival every summer. Real estate offerings include single-family homes with some condos available, offering a multitude of styles and finishes.
ATTRACTIONS
RESTAURANTS
• Point Fermin Park
• Cabrillo Beach Yacht Club
• Raffaello Ristorante
• J. Trani's Ristorante
• Cabrillo Aquarium
• Crafted at the Port of LA
• Crazy Fish - Grill & Market
• Sebastians's Mediterranean
• Deane Dana Friendship Park
• Old San Pedro
• Sirinat Thai & Sushi Bar
• Compagnon Wine Bistro
MARKET SUMMARY
1ST QUARTER 2021 TOTAL INVENTORY
TOTAL SALES
MEDIAN SALES PRICE
MEDIAN DAYS ON MARKET
MEDIAN PRICE PER SQUARE FOOT
SALES RATIO
152
152
$743K
10
$468
100%
2020
306
130
$595K
21
$402
42%
PERCENT CHANGE
-50%
+17%
+25%
-51%
+16%
+135%
1ST QUARTER
2021 1ST QUARTER
YEAR-OVER-YEAR TRENDS $801,000
$615,500 $595,000
$780,000
$650,250
$575,000 104
99
39
Jan-20
103
48
Feb-20
43
Mar-20
50 29
Jan-21
65
58
61
41
Feb-21
Mar-21
WILMINGTON Wilmington is one of the oldest communities in Los Angeles and enjoys a long and proud history of being the gateway to Los Angeles. Inside the area, you will find many historical museums, military installations, six parks, and waterfront attractions as well as a community center and skate plaza. Wilmington has a heavy concentration of industry and the third largest oil field in the United States, offering several employment opportunities. Wilmington is primarily comprised of single-family homes perfect for families and professionals. Bordered by Long Beach, Carson, and San Pedro, Wilmington offers convenient freeway access to explore greater Los Angeles and beyond.
ATTRACTIONS
RESTAURANTS
• Vincent Thomas Bridge
• The Banning Museum
• San Pedro Fish Market Grille
• Montoya's
• Terminal Island
• California Yacht Marina
• Issac's Cafe
• Hojas Premium Tea House
• Wilmington Waterfront Park
• John Mendez Baseball Park
• The Chowder Barge
• Eat at Rudy's
MARKET SUMMARY
1ST QUARTER 2021 TOTAL INVENTORY
TOTAL SALES
MEDIAN SALES PRICE
MEDIAN DAYS ON MARKET
MEDIAN PRICE PER SQUARE FOOT
SALES RATIO
27
39
$533K
13
$421
144%
2020
88
31
$446K
18
$400
35%
PERCENT CHANGE
-69%
+26%
+19%
-25%
+5%
+310%
1ST QUARTER
2021 1ST QUARTER
YEAR-OVER-YEAR TRENDS $550,000
$547,500
$472,500
$500,000
$440,000
$425,000
31
30
27
20
12
Jan-20
10
Feb-20
9 Mar-20
5
7
Jan-21
10
12
Feb-21
12
Mar-21
BEVERLY HILLS 9454 Wilshire Blvd., Suite 600 Beverly Hills, CA 90212 310.205.0050
PALOS VERDES - MIRALESTE 5 Miraleste Plaza Rancho Palos Verdes, CA 90275 310.831.0222
EL SEGUNDO 402 Main Street El Segundo, CA 90245 310.322.1425
REDONDO BEACH 1720 S. Elena Avenue Redondo Beach, CA 90277 310.378.7747
PALOS VERDES - MALAGA COVE 63 Malaga Cove Plaza Palos Verdes Estates, CA 90274 310.378.9494
PALOS VERDES - SILVER SPUR 450 Silver Spur Road Rancho Palos Verdes, CA 90275 310.544.9999
MANHATTAN BEACH 1040 Manhattan Beach Blvd. Manhattan Beach, CA 90266 310.376.2225
TORRANCE 23740 Hawthorne Blvd. Torrance, CA 90505 310.378.9889
MANHATTAN BEACH / DOWNTOWN 1401 Highland Avenue Manhattan Beach, CA 90266 310.937.5700
WEST LOS ANGELES 10500 W. Pico Blvd. Los Angeles, CA 90064 310.559.5570
MARINA DEL REY / VENICE 124 Washington Blvd. Marina Del Rey, CA 90292 310.577.5300
WESTCHESTER / SILICON BEACH 7131 W. Manchester Avenue Los Angeles, CA 90045 310.802.6000
W E A R E T H E COA S T
600+ Local Agents | 12 Offices Luxury Residential | Commercial Investment Division | International DRE: #01879720