Social Impact Measurement: How to Prove What Actually Changed Social impact programs are designed to improve lives, strengthen communities, and address social, economic, and environmental challenges. But doing good and proving that good are two different things. An organisation may conduct hundreds of activities, distribute resources, or reach thousands of people without being able to demonstrate whether those efforts actually produced meaningful change.
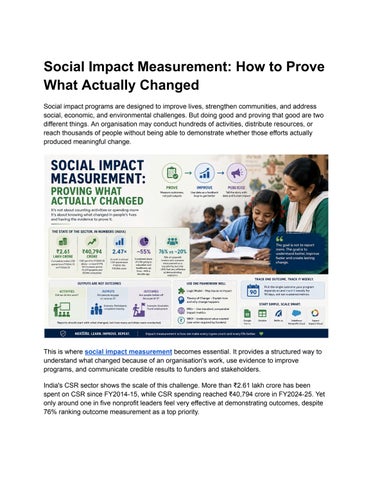
This is where social impact measurement becomes essential. It provides a structured way to understand what changed because of an organisation's work, use evidence to improve programs, and communicate credible results to funders and stakeholders. India's CSR sector shows the scale of this challenge. More than ₹2.61 lakh crore has been spent on CSR since FY2014-15, while CSR spending reached ₹40,794 crore in FY2024-25. Yet only around one in five nonprofit leaders feel very effective at demonstrating outcomes, despite 76% ranking outcome measurement as a top priority.
What Is Social Impact Measurement? Social impact measurement is the systematic process of collecting, analysing, and reporting the social, economic, and environmental changes resulting from an organisation's work. Unlike traditional reporting, which may focus heavily on expenditure and activities, impact measurement looks at outcomes and longer-term effects. For example, saying that an organisation spent ₹500 crore on community development shows financial commitment, but it does not explain whether children became healthier, families improved their livelihoods, or communities experienced lasting benefits. Social impact measurement is designed to answer those questions. The strongest approach combines quantitative data with qualitative evidence. Numbers demonstrate the scale of change, while stories and experiences help explain how and why that change happened.
Outputs vs. Outcomes vs. Impact One of the most important concepts in impact measurement is understanding the difference between activities, outputs, and outcomes.
Activity Metrics Activity metrics answer the question: Did we do the work? Examples include the number of workshops conducted, volunteers deployed, or funds distributed. These metrics demonstrate implementation, but completing an activity does not prove that it created a benefit.
Output Metrics Output metrics ask: Did people participate or receive the intended service? Examples include participants completing training, families receiving water-purification kits, or students receiving certificates. Outputs show delivery and engagement, but participation does not automatically mean transformation.
Outcome Metrics Outcome metrics answer the more important question: Are people better off because of the intervention? Examples include graduates finding jobs, reductions in waterborne illness, or improvements in student mathematics proficiency. These indicators provide evidence of actual change.
The key lesson is that organisations should not spend most of their reporting space proving that they were busy. They should demonstrate what changed as a result of their work.
The 3 P's Framework The document presents a practical framework for managing social impact measurement through three steps: Prove, Improve, and Publicise.
Prove: Measure Outcomes The first step is to identify and measure the change that matters. Activities such as workshops, tree planting, or distributing supplies are relatively easy to count. Outcomes such as improved skills, increased forest cover, or greater household food security demonstrate whether those activities produced meaningful results.
Improve: Use Data as a Feedback Loop Measurement should not be treated as a final verdict. Instead, it should help teams identify what is working and what needs to change while a program is still running. The document gives the example of a rural water project in Rajasthan that tracked pump failures. The data showed that high mineral content in the local water was damaging components, allowing the team to switch to more durable materials. Measurement therefore helped improve the intervention rather than simply evaluate it afterward.
Publicise: Report Impact Effectively Good impact reporting combines evidence with human stories. Data provides credibility and scale, while stories communicate the human experience behind the numbers.
Why Both Quantitative and Qualitative Data Matter Quantitative data explains what happened and how much. It can measure indicators such as school attendance, households reached, or money saved. Qualitative data explores why and how something happened. It can capture beneficiary experiences through questions about changes in daily routines, health, confidence, or other aspects of life. Using only numbers can make a report feel like an audit, while using only stories can make it sound like a promotional brochure. Combining the two creates a stronger and more credible account of impact.
Build a Logic Model A Logic Model is one of the simplest ways to organise an impact measurement strategy. It connects the different stages of a program: Inputs → Activities → Outputs → Outcomes → Impact Inputs include resources such as funds, volunteers, and equipment. Activities are the work an organisation carries out. Outputs are immediate results, outcomes describe short- to medium-term changes, and impact represents longer-term change. A Theory of Change complements the Logic Model. It explains why an organisation believes its activities will lead to the desired change and makes its underlying assumptions explicit. The Theory of Change is essentially the argument, while the Logic Model is the visual map.
Key Frameworks for Measuring Impact Different organisations may require different measurement frameworks. The Impact Management Project's Five Dimensions provide a shared language for describing impact: What, Who, How Much, Contribution, and Risk. These dimensions consider the outcome being affected, the people experiencing it, the scale and duration of change, the organisation's contribution, and the possibility that the expected impact may not occur. IRIS+, managed by the Global Impact Investing Network, provides a free catalogue of standardised metrics. These metrics are mapped to the Sustainable Development Goals and aligned with the Five Dimensions, helping organisations use comparable definitions when measuring impact. Social Return on Investment (SROI) takes a different approach by expressing social, environmental, and economic value in monetary terms. The basic formula is: SROI = Present Value of Social Value Created ÷ Value of Investment The document explains that a ratio above 1:1 indicates that more value was created than invested, while nonprofit programs commonly fall between 2:1 and 10:1. However, SROI ratios should not be treated as universal rankings because comparisons depend on the scope, assumptions, stakeholder definitions, and adjustments used in each study. For many organisations, a practical progression is to begin with a Logic Model, develop a Theory of Change, use IRIS+ metrics, and introduce SROI when a funder specifically requires a value-for-money assessment.
How to Design Effective Impact Metrics
Creating useful metrics does not have to be complicated. The document recommends four steps. First, start with the outcome. Identify the most important change the program is designed to achieve. Second, work backwards to the activities. Determine what needs to happen to produce that outcome. Third, define clear metrics. Use both quantitative indicators and qualitative evidence. Fourth, create a simple tracking table. Connect activities, outputs, outcomes, and measurement methods in one place. One particularly important recommendation is to choose the single outcome on which the program depends and track it every week for 90 days. Closely monitoring one meaningful indicator can generate more useful learning than tracking many metrics that are reviewed only once every quarter.
Tools for Social Impact Measurement Organisations do not need a large budget to begin measuring impact. Simple tools can provide a strong starting point. Google Forms can be used for surveys, beneficiary feedback, and baseline data collection, with responses flowing into Google Sheets. Airtable provides a more structured way to manage beneficiary and program data. Monday.com can support project coordination and status reporting. As organisations grow, purpose-built platforms can help manage larger volumes of information. The document describes Relific.io as an AI-native platform built for the social sector and CSR, supporting program management, field monitoring, and impact evaluation using data and AI analytics. Other platforms mentioned include Salesforce Nonprofit Cloud, Sopact Impact Cloud, and SocialCops/Atlan. The advice is not to purchase software simply to appear sophisticated. Organisations should upgrade when their data volume has outgrown spreadsheets and when they can consistently maintain the new system.
Educate Girls: Measurement That Changed the Program The Educate Girls Development Impact Bond is presented as a strong example of continuous impact measurement in India.
Launched in 2015 in rural Rajasthan, the program focused on enrolling out-of-school girls and improving learning outcomes. Its results were independently verified by IDinsight through a randomised controlled trial. After two years, enrollment was progressing well, but learning gains were lagging. Because the program continuously measured outcomes, the team identified the issue and adapted its curriculum to be more child-centric. By the final year, the program achieved 116% of its enrollment target and 160% of its learning target. Students in participating schools recorded learning gains roughly 79% higher than their peers. The program reached more than 7,300 children across 166 schools in 140 villages, with its headline results externally verified. The key lesson is that measurement is most valuable when it informs decisions during implementation. Educate Girls did not measure simply to produce a better final report; it used evidence to improve the program while it was still running.
Common Social Impact Measurement Challenges Several problems repeatedly affect impact measurement. The first is measuring outputs instead of outcomes. Completing an activity does not guarantee that the intended result occurred. The second is fear of failure. Organisations may avoid measuring indicators that could reveal disappointing results. But honest findings can provide the information needed to redesign and strengthen a program. The third is meaningless metrics. A metric may be easy to count but have little connection to the organisation's actual mission. Every metric should answer a meaningful question about progress.
India's Regulatory Environment Social impact measurement is becoming increasingly important within India's CSR and social finance environment. Under Section 135 of the Companies Act, 2013, qualifying companies must spend at least 2% of their average net profits on eligible social activities. The Social Stock Exchange has also strengthened the role of impact reporting. Organisations seeking to raise funds through the SSE must produce an audited Annual Impact Report. According to the document, reports for fundraising entities must cover at least 67% of program expenditure and be assessed by empanelled Social Impact Assessment Organisations.
This development reflects a broader shift: credible impact measurement is increasingly connected to access to serious social capital.
The Future of Social Impact Measurement Technology is changing how impact can be measured and reported. AI can analyse large volumes of beneficiary interviews, open-ended survey responses, and field notes, making qualitative information easier to analyse at scale. Blockchain also has potential applications for transparent and tamper-resistant transaction records, creating stronger digital trails for how funds move and are used. The wider movement is from compliance-driven CSR toward continuous, impact-driven transparency. Organisations capable of demonstrating credible change may increasingly attract funders, investors, customers, and talent who care about measurable results.
A Practical 90-Day Plan For organisations that are unsure where to begin, the process can remain simple. Start by selecting one important outcome. Then choose one quantitative metric and one qualitative story to track. Create a one-page Logic Model that connects daily activities to the desired outcome. Track the chosen outcome weekly for 90 days using simple tools such as a form and spreadsheet. Finally, act on what the data reveals. If the results are disappointing, that does not automatically mean the program has failed. The finding may provide the most valuable information available for improving the intervention.
Conclusion Social impact measurement is ultimately about moving from proving activity to proving change. Organisations need to look beyond the number of workshops conducted, beneficiaries reached, or funds distributed. They need to understand whether those activities produced meaningful outcomes and lasting impact. A strong measurement system does not have to be expensive or complicated. It can begin with one outcome, one meaningful metric, a simple Logic Model, and consistent tracking. As programs grow, organisations can adopt standardised frameworks, specialised tools, AI-powered analytics, and more rigorous reporting methods. The most important shift is cultural: measurement should not be viewed merely as compliance or reporting. It should be used as a continuous learning process that helps organisations
understand what works, improve what does not, and demonstrate credible evidence of the change they are creating.