THE TEXAS COMMERCIALREAL ESTATE NEWS SOURCE | OCT/NOV 2026
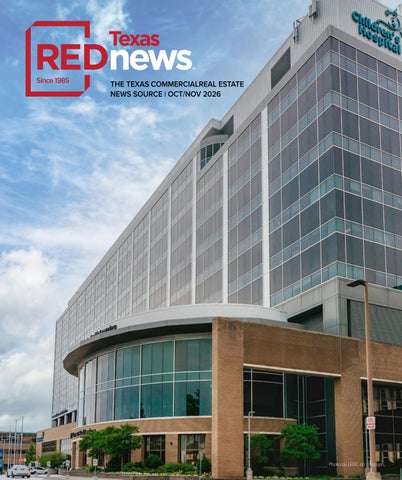
Photo by LEDC on Unsplash
3 6 0 ° APPROACH APPROACH NATIONAL A 360° ENVIRONMENTAL T O E N V I R O N M E N T A L TO ENVIRONMENTAL SERVICES SERVICES Houston, Texas Texas •• Redlands, Redlands, California California SERVICES Houston, National Environmental Environmental Services, Services, with with offices offices National in Houston, Houston, Texas Texas and and Redlands, Redlands, California, California, in is an an environmental environmental consulting consulting company, company, is established in 1995, that conducts a full established in 1995, that conducts a full range of reliable and cost-effective range of reliable and cost-effective environmental assessment and corrective environmental assessment and corrective services, with competitive pricing and services, with competitive pricing and convenient turnaround. convenient turnaround.
• Phase I Environmental Site Assessments • Remediation and Corrective Activities* (ASTM IE1527-21) • Phase Environmental Site Assessments • Remediation and Corrective Activities* (ASTM E1527-21) • Soil, Water, and Air Testing Services • Transaction Screens (ASTM E1528-22) • Soil, Water, and Air Testing Services • Transaction Screens (ASTM E1528-22) • Remediation and Corrective Activities* • Asbestos & Lead-Based Paint Inspections • Remediation and Corrective Activities* AsbestosPaint Consulting Agency) • (Licensed Asbestos &Texas Lead-Based Inspections • Indoor Air Quality/Mold Surveys (Licensed Texas Asbestos Consulting Agency) • Indoor (Licensed Mold Consulting Agency) Air Quality/Mold Surveys • RSRAs (Records Search with Risk Assessments) (Licensed Mold Consulting Agency) • RSRAs (Records Search with Risk Assessments) • Underground Ground Storage Tank Testing Services* • Phase II Subsurface Investigations* • Underground Ground Storage Tank Testing Services* • Phase II Subsurface Investigations*
National Environmental Services 5773 Woodway Dr, Suite 96, Houston, TX 77057: Phone (281) 888-5266 National Environmental Services 700 East Redlands Blvd, Suite U618, Redlands, CA 92373: Phone (951) 545-0250 5773 Woodway Dr, Suite 96, Houston, TX 77057: Phone (281) 888-5266 Toll Free: (833) 4-Phase1 700 East Redlands Blvd, Suite U618, Redlands, CA 92373: Phone (951) 545-0250 www.nationalenv.com • www.gabrielenv.com Toll Free: (833) 4-Phase1 www.nationalenv.com • www.gabrielenv.com
THE TEXAS COMMERCIAL REAL ESTATE NEWS SOURCE
PRESIDENT & CEO Jeff Johnson jeff.johnson@rejournals.com
PUBLISHER Jay Kodytek jay.kodytek@rejournals.com
CLASSIFIED DIRECTOR Susan Mickey smickey@REDnews.com
Texas Brokers: 8,150 Texas Leasing/Tenant Rep: 6,232 Texas Investors: 4,979 Texas Developers: 4,710 Outside Texas Investors, Brokers, Developers etc: 26,387
TOTAL QUALIFIED ONLINE REDnews DISTRIBUTION: 50,458 To subscribe to REDnews call (713) 661-6300 or log on to REDnews.com/subscription.
Features
Split Screen: Houston's lab market stalls while pharma manufacturing commits billions: Generation Park has collected nearly $9 billion in pharmaceutical manufacturing investment in under a year. Eli Lilly and Co. started construction this summer on a $6.5 billion active pharmaceutical ingredient campus spread across 236 acres of the northeast Houston district.
Commercial real estate remains a boon to the U.S. economy: Commercial real estate remains a major growth engine for the U.S. economy, generating hundreds of billions of dollars in economic activity and supporting millions of jobs across the country.
Tax Cliff: Impacts of HB 21 and its January deadline: Start with a single apartment property assessed at $20 million, roughly the size of most deals that used a traveling housing finance corporation to come off the tax rolls. At a 2.5% millage rate, that property has been abating about $500,000 a year in property taxes.
real estate recovery: Despite challenges, the industrial sector continues to be one of leaders in the commercial real estate property recovery, with values rising faster than those of most major property sectors even as higher borrowing costs threaten to slow the momentum.
4
8
Permit Freeze: Texas spent the past two years selling itself as the center of American AI infrastructure. On Sept. 21, Gov. Greg Abbott ordered the Texas Commission on Environmental Quality to stop issuing permits sought by data center projects statewide and his office said he will work with the Legislature next session to eliminate any financial incentives for the industry.
9
World Cup games kicked retail, restaurant sales up ... but mostly for retailers with the right strategies and location: More than 5.4 million fans attended FIFA 2025 World Cup games this summer at stadiums across the United States. For retailers, restaurants and commercial property owners, though, simply being in one of the tournament’s host markets didn't guarantee a boost in business.
14
The top industrial investment markets? LoopNet’s list is dominated by Texas cities: Investors looking to sink their dollars into industrial properties? LoopNet suggests they should focus on Texas.
17
REDnews
rejournals.com/rednews
Falling in love with physical retail
19 again? Shoppers seek freedom
from the algorithm: Are shoppers yearning for the physical store experience once again? The latest research from JLL suggests that a growing number of consumers view brick-and-mortar stores as a healthy break from online shopping.
22
Green Street: Industrial still one
24 of the leaders in commercial
Today’s shoppers? They prefer
26 quick trips and local options:
Today’s consumers might not look quite like the shoppers many retailers, developers and investors have been planning for, according to the latest research from Placer.ai. Before you deploy AI, ask if your
28 data is ready: In the rush to adopt
AI for facilities management, the initial conversations about deploying AI tools almost always focus on speed of deployment. However, that’s not a sound approach.
CORFAC members share positive
30 deal trends, impacts of AI:
CORFAC International’s survey of members earlier this year demonstrated that the commercial real estate sector as a whole and transaction activity within specific sectors are seeing growth. Negative net absorption? Yes.
32 But that doesn’t tell the full
cold storage story: The U.S. cold storage market is going through a period of adjustment. And older facilities? They are struggling to keep occupancy levels high, while newer cold storage buildings are seeing steady demand.
34 CRE Marketplace
Split Screen: Houston's lab market stalls while pharma manufacturing commits billions
G
BY BRANDI SMITH
eneration Park has collected nearly $9 billion in pharma-
ceutical manufacturing investment in under a year. Eli Lilly and Co. started construction this summer on a $6.5 billion active pharmaceutical ingredient campus spread across 236 acres of the northeast Houston district. Bristol Myers Squibb followed in August, selecting the same 4,300-acre McCord Development project for a $2.3 billion, 600,000-square-foot multi-modal campus expected to employ nearly 500. Newmark's tally of notable Houston lab leases for the second quarter ran to two deals. Together they covered 12,649 square feet.
still emergent with much of the ecosystem's growth driven by institutional growth and collaboration,” Berthelette said. “The region's maturing manufacturing landscape will only elevate Houston's status as a biotech hub.” One figure in the national report demands a second look. Houston asking rents rose nearly 175% year over year, an outlier among the 13 markets Newmark tracks. Berthelette attributed the jump to a new Texas Medical Center delivery commanding well above average rents and pulling the market average with it rather than to Pharma to page 6
That split runs through the Texas life sciences story heading into the back half of 2026. The region's traditional lab fundamentals remain soft while capital pours into production at a scale the state has never seen. “Houston is well positioned to benefit from the recent surge in advanced manufacturing investment,” said Elizabeth Berthelette, Managing Director and Head of Northeast Research and National Life Science Research at Newmark. Berthelette said the Lilly and BMS commitments are helping put Houston on the map specifically for biomanufacturing, a sector Newmark's second-quarter national report identifies as one of the most significant green shoots in the U.S. life science market. Pharmaceutical companies have committed upward of $500 billion to U.S.-based manufacturing and research infrastructure over the past year, according to the report, with more than 70% of active pharmaceutical ingredients used domestically still produced abroad. The lab side of the ledger looks different. Houston vacancy held at 26.3% in the second quarter, unchanged year over year but up 80 basis points from the first quarter, Newmark reported. Net absorption ran to negative 102,647 square feet year to date across a 4.3-million-square-foot inventory. Nothing is under construction. “In terms of traditional lab clusters, Houston is
4
OCT/NOV 2026
Elizabeth Berthelette
Your Building Should Run Smoothly. Hiffman Makes Sure it Does. CRE Consulting Property Accounting Project Services Property Management Workplace Solutions Facilities Management National Portfolio Coverage
Simplify Your Operations at Hiffman.com
OCT/NOV 2026
5
Pharma from page 4
any surge in tenant appetite. Houston's average asking rate stood at $65.31 per square foot triple net at the end of the quarter. New construction typically garners higher pricing across markets, ultimately impacting our weighted average rent calculation,” Berthelette said. Houston carries one distinction the core markets would envy. Sublease availability sat at 0.0%, the only market in Newmark's coverage with none at all. Boston reported 7.2% and the Research Triangle 8.6%. Berthelette traces that to how Houston grew. The correction reshaping the life science sector has concentrated in core markets that saw above-average run-ups in venture funding, IPOs, capital investment, company formation and development, she said. Emerging markets have ridden a less volatile cycle. Homegrown spinouts and institutional support for early-stage companies, common in Houston, Chicago and New York, have helped insulate those markets from the same swings. Deal activity in the Texas Medical Center corridor has not stopped, though it has changed shape. Cerenome Inc., formerly Plus Therapeutics, added 25,000 square feet at Hines' Levit Green in August, bringing the company to 36,500 square feet at the 53-acre district adjacent to the medical center. Hines, developing Levit Green with 2ML Real Estate Interests and Harrison Street, has leaned into turnkey suites in the 5,000-square-foot range for smaller-foot-
print users. Smaller manufacturing plays are following the majors. Sugar Land-based DeliverIt Group received $1.3 million in incentives toward a 60,000-square-foot pharmaceutical manufacturing facility behind its headquarters on Dairy Ashford Road, a roughly $11.8 million project adding 55 jobs. North Texas is running its own version of the trade. Three tenants at Dallas' Pegasus Park campus (CG Oncology, Highlander Health and LH Capital) expanded onto the office tower's 16th floor this spring. The campus, developed by J. Small Investments with Lyda Hill Philanthropies, added the 135,000-square-foot Bridge Labs facility in 2024 to give growth-stage companies somewhere to land after outgrowing BioLabs incubator space. For owners waiting on the vacancy overhang to clear, the timeline runs through markets far from Texas. Most life science markets Newmark tracks still carried vacancy above 25% in the second quarter. “Developer (and lender) appetite for new projects will likely return once a more sustained vacancy recovery has taken hold,” Berthelette said. “A sustained fundamentals recovery among the core markets will also signal a more amenable development landscape as a rising tide tends to lift all boats.”
ADVERTISE YOUR BUSINESS HERE
20,000
SUBSCRIBERS ACROSS TEXAS
Market Your Company to the 20,000 commercial real estate professionals that subscribe to REDnews across Texas. Book your space today for the next REDnews Publication!
BOOK YOUR SPACE TODAY
Contact REDnews today: 6
OCT/NOV 2026
Jeff Johnson Jay Kodytek jeff.johnson@rejournals.com jay.kodytek@rejournals.com 612-819-0385 612-940-3713
OCT/NOV 2026
7
Tax Cliff: Impacts of HB 21 and its Jan. deadline BY BRANDI SMITH
S
tart with a single apartment property assessed at $20 million,
roughly the size of most deals that used a traveling housing finance corporation to come off the tax rolls. At a 2.5% millage rate, that property has been abating about $500,000 a year in property taxes. Doug Banerjee, Senior Managing Director at Greysteel, estimates that after ground lease fees to the Housing Finance Corporation and the rent reductions on set-aside units, about $300,000 of that landed on the bottom line. Capitalize $300,000 at a 6 cap and the exemption was worth about $5 million in value. Now multiply that by 400 properties. Banerjee puts the value at risk across Texas at more than $2 billion. The deadline that puts it at risk is Jan. 1, 2027. That is when House Bill 21, signed by Gov. Greg Abbott in May 2025, strips the property tax exemption from any HFC-owned property sitting outside the jurisdiction of the city or county that created the HFC unless the local government where the property is located approves the exemption by resolution before Dec. 31.
The bill targeted what became known as “traveling HFCs.” Under Chapter 394 of the Texas Local Government Code, a housing finance corporation created by one city or county could acquire property anywhere in the state and pull it off the tax rolls, according to an analysis by the Texas Real Estate Research Center at Texas A&M University. The local government where the property sat lost the revenue while still providing services to the residents, spreading the cost across the remaining tax base. HB 21 also raised the bar on affordability. A property must now reserve at least 50% of its units for income-restricted households and at least half the value of the tax exemption must be applied to rent reduction each year with any shortfall paid to the taxing authorities, according to analysis from Baker Hostetler Partner Cynthia Bast. Properties with low-income housing tax credits are excluded from most of the new requirements, though the jurisdictional limits apply to all. How many properties are affected depends on who is counting. Tax Cliff to page 10
Doug Banerjee 8
OCT/NOV 2026
REDnews Houston
CONSTRUCTION November 5, 2026
summit
1:00 PM - Registration & Networking 1:30 PM - 4:30 PM Program Houston Racquet Club (10709 Memorial Dr, Houston, TX 77024)
3 Hours of Real Estate Continuing Education Credits have been Applied for with the Texas Real Estate Commission
speakers:
Ty Adams - KT Ventures Roger Berry - SpawGlass Nicholas Biddlecome - Read King Bill Brown - Tellepsen Brock Chisty - TRIO Electric Angela Cotie - Cotie Consulting Darlene East - Holes Incorporated Daniel Garnier - Signs By G Joshua Hanson - MSD Building Corp Paris Karageorgis - Dynamic Glass, LLC Brooke Koop - ANDRES Construction PD McIntyre - Chamberlin Roofing & Waterproofing Jessica Osuna - MEMCO Sara Prasatik - Munsch Hardt Kopf & Harr P.C. Sam Sprouse - Satterfield & Pontikes Construction Jodi Stevens - Griesenbeck Architectural Products, Inc.
Register Today
Scan QR code or Click Here for more information and to register www.rejournals.com/upcomingevent/
SPONSORS:
Sponsorship Opportunities Available Jeff Johnson Jay Kodytek jeff.johnson@rejournals.com jay.kodytek@rejournals.com 612-819-0385 OCT/NOV 2026 612-940-3713 9
Tax Cliff from page 8
“Every asset's debt situation will be different obviously, but the ones that have bridge debt on them will likely have a majority or all of the equity wiped out from the capital structure” A Yardi Matrix spreadsheet lists 335 traveling HFC properties in Texas primary markets alone, Banerjee said, and he estimates the statewide figure tops 400 once secondary markets are included. For the properties that miss the deadline, the damage depends on the capital stack. “Every asset's debt situation will be different obviously, but the ones that have bridge debt on them will likely have a majority or all of the equity wiped out from the capital structure,” Banerjee said. Bridge debt is common in this pool and so is deferred maintenance. Most of the properties were acquired in 2021 and 2022, Banerjee said, which means they rode the full rate shock that followed. “Many of the properties have been neglected by ongoing capital needs because the owners/operators were simply trying to stay afloat and make their debt payments when SOFR went from 0% to 5.25% in a matter of 18 months and stayed at that level until September 2024," Banerjee said. That amounts to about five years of skipped capital expenditures. Using a moderate $5,000 per unit across 400 properties averaging 200 units, Banerjee arrives at roughly $400 million in outstanding capex needs, a figure he considers low since many of the properties need far more than $5,000 per unit even if a few newer ones need less. This is where the economic development story lives. None of it is new construction. The capital HB 21 forces into the market goes to renovating and stabilizing existing workforce housing, most of it Class B and C product in Houston, Dallas and San Antonio submarkets. The question is who deploys it. The tidy version of this story has preservation-minded sponsors stepping in to protect affordability. Banerjee sees a different buyer. 10
OCT/NOV 2026
“The preservation play is difficult because that normally requires time for a buyer to be able to put on tax credits to convert assets into affordable properties, so the majority of the buyers we see are opportunistic ones that are seeing lenders take deals back or willing to take haircuts on their loans to not have to take over the operations,” Banerjee said. Those buyers are pricing in everything at once: the lost exemption, the carrying costs, the deferred work. “Many of these properties are requiring $20-$30K per unit through a combination of carrying costs and CapEx needs, so the trades are happening 30-60% below previous highs,” Banerjee said. A sale carries its own trigger under the new law. Existing HFC properties that secure local approval have until the earlier of Dec. 31, 2035, or the first sale or refinancing to comply with the new affordability restrictions, according to Baker Hostetler's analysis. A recapitalization that keeps the exemption alive therefore brings the 50% set-aside and rent reduction test forward immediately, which shapes what a buyer can underwrite on day one. The one variable that could still move the deadline is in a Cameron County courtroom. The Texas Workforce Housing Coalition, a group of developers who partnered with HFCs, and Post WB Apartments LLC sued the Bexar Appraisal District in September 2025 with Gibson Dunn & Crutcher as lead counsel. The plaintiffs argue that developers structured financing and business arrangements under the law as it existed and should be able to rely on it. The petition asks the court to declare HB 21 an unconstitutional impairment of contracts and an unconstitutionally retroactive law and to reinstate previously granted exemptions. As of early September, the case had not been resolved. Owners of more than 400 properties have four months to find out whether the court, a city council or a buyer decides what happens next.
Permit Freeze: Texas pulls back on data centers as audit deadlines approach
T
BY BRANDI SMITH
exas spent the past two years selling itself as the center of American AI infrastructure. On Sept. 21, Gov. Greg Abbott ordered the Texas Commission on Environmental Quality to stop issuing permits sought by data center projects statewide and his office said he will work with the Legislature next session to eliminate any financial incentives for the industry. “Simply put, Texans must come first,” Abbott said in a statement. “Data centers must pay their own way, protect our grid and water, and complete the ERCOT and TWDB audits. Until they do, TCEQ will issue no permits sought by data center projects.” The order caps a seven-week escalation. On Aug. 3, Abbott directed the Public Utility Commission of Texas and the Electric Reliability Council of Texas to audit every data center in the interconnection queue, citing more than 474 gigawatts of requests, roughly five times the grid's all-time peak demand, about 90% of it attributable to data centers. On Sept. 14, he directed the Texas Water Development Board to enforce water-use reporting. The TCEQ freeze applies regardless of whether a project sits in the ERCOT queue, which reaches developers who planned to generate their own power and bypass the grid entirely. TCEQ must report to the governor's office on compliance by Oct. 19. ERCOT expects to complete its audit in mid-December. Underneath the politics is a question the industry was already asking about its own numbers. “ERCOT's interconnection requests now total more than 470 gigawatts, and that number includes filings with no tenant, no financing, and no serious developer behind them, which inflates demand projections in a way that makes for alarming headlines but isn't consistent with reality,” said Jess Heck, Director of Texas Government Affairs at the Data Center Coalition. The association has pointed to Senate Bill 6, the 2025 large-load law that established the Batch Zero framework, as the mechanism for sorting real projects from placeholders through study requirements, fixed timelines and financial commitments. Heck said those standards move serious developers through a queue that is not clogged with projects that were never going to be built. Speaking on Sept. 16 before the TCEQ order, JLL Vice Chairman Curt Holcomb drew a line between projects that have broken ground and those still waiting on power. “Projects already under construction have most likely received the
Curt Holcomb
necessary approvals and permits, so it is unlikely recent regulatory actions will change the direction of those developments,” Holcomb said. “Projects still in the interconnection queue are different. Typically, projects would not close or begin construction until they receive a firm commitment from ERCOT and the transmission service provider on how much power will be allocated to the site.” The Sept. 21 directive reaches further than the grid pause did. Because it covers permits, amendments and renewals rather than interconnection alone, projects already vertical can encounter it and so can projects that never needed ERCOT approval to begin with. Water is the newer pressure point. A January white paper from the Houston Advanced Research Center estimated Texas data centers Permit Freeze to page 13 OCT/NOV 2026
11
REDnews Houston
INDUSTRIAL November 5, 2026
summit
8:00 AM - Registration & Networking 8:30 AM - 11:30 AM Program Houston Racquet Club (10709 Memorial Dr, Houston, TX 77024)
3 Hours of Real Estate Continuing Education Credits have been Applied for with the Texas Real Estate Commission
speakers:
Jake Allen - First Industrial Realty Trust Greg Barra, CCIM, SIOR - Boyd Commercial Nathan Buckhoff, SIOR - Oxford Partners Hachem Domloj - CIVE Heath Donica - Stream Realty Peyton Easley, SIOR, CCIM - Titan Commercial Jack Gaffney, SIOR - Finial Group David Gwin - City of Missouri City Beau Harris - Black Label Commercial Group Doc Perrier - Matthews Real Estate Investment Services™ Brad Porter - Porter Law Firm Jason Scholtz - Colliers Ash Shah - IMPEX Capital Group, LLC Alex Tebo - Bridge Logistics Properties Nick Terry, SIOR, CCIM - Rifle CRE Reed Vestal - Junction
Register Today
Scan QR code or Click Here for more information and to register www.rejournals.com/upcomingevent/
SPONSORS:
More Speakers to be announced...
Sponsorship Opportunities Available
12
Jeff Johnson jeff.johnson@rejournals.com 612-819-0385 OCT/NOV 2026
Jay Kodytek jay.kodytek@rejournals.com 612-940-3713
Permit Freeze from page 11
consumed roughly 25 billion gallons in 2025, about 0.4% of total state water use when direct cooling and the water used to generate their electricity are combined. HARC projected that share could reach 0.5% to 2.7% by 2030. The report also noted that the State Water Plan relies on historical use rather than forecasts, meaning a facility that opened in 2025 will not appear in the plan until 2032. Under the TWDB directive, a project that fails to return its
Texas is not moving alone. A Troutman Pepper Locke analysis published in May found that of the 38 states offering data center incentives, 28 were weighing legislation to end or curtail them, and that more than 100 localities nationwide had enacted construction moratoriums over the prior year. “Texas lawmakers understand that predictability drives investment,” Heck said. “Retroactive changes, on the other hand, do the opposite and can send negative signals that discourage investment.” Holcomb argues the case for the asset class has not been made well enough at the local level. “One story that is not being told enough is the economic opportunity data centers can create for local communities through tax generation,” he said. “A large-scale data center can significantly expand a community's tax base and provide funding for infrastructure and other local improvements. That impact can be a game changer for communities.” Three dates now govern the market: Oct. 19, mid-December and January, when the 90th Legislature convenes.
Jess Heck
water-use survey commits a criminal offense and becomes ineligible for TCEQ permits. “Our members are ready to comply and much of what the audit asks for is information that responsible operators already share with the local officials and utilities with whom they work side-byside to ensure responsible development,” Heck said. “Annual water reporting, paired with site-specific watershed evaluations, is reasonable and in line with industry standards.” For economic development offices, the stakes are measurable. Heck cited a PwC study putting the industry's 2024 contribution at more than $65 billion in state GDP, 103,000 direct jobs and $4.5 billion in state and local tax revenue. JLL's midyear report placed Texas at 26 gigawatts existing and under construction, ahead of Virginia.
“One story that is not being told enough is the economic opportunity data centers can create for local communities through tax generation.”
OCT/NOV 2026
13
World Cup games kicked retail, restaurant sales up ... but mostly for retailers with the right strategies and location BY DAN RAFTER, EDITOR
iStock photo, credit peterschreiber.media.
M
ore than 5.4 million fans attended FIFA 2025 World Cup games this summer at U.S. stadiums in Dallas, Kansas City, Houston and several other major cities. For retailers, restaurants and commercial property owners, though, simply being in one of the tournament’s 11 U.S. host markets didn't guarantee a boost in business during these soccer games. Location mattered. But so did what retailers and property owners did with in these locations. 14
OCT/NOV 2026
That’s one of the key takeaways from a new report from Colliers and Placer.ai that highlights retail and dining patterns during this summer's World Cup. The report, 7 World Cup Lessons for Retail, Dining & Real Estate, found that the tournament’s economic impact was highly localized, with the strongest gains concentrated around stadiums, Fan Fests and commercial districts that became part of the fan experience. According to the report from Colliers and Placer.ai, dining visWorld Cup to page 16
PUT YOUR PROPERTY IN FRONT OF COMMERCIAL REAL ESTATE DECISION-MAKERS
TEXAS
Sell faster. Generate more qualified leads. Reach the buyers who matter.
Promote your property, land, investment opportunity, or development site through a dedicated REDnews Property E-Blast delivered directly to thousands of commercial real estate professionals across Texas. From developers and investors to brokers, lenders, and owner-users, your listing reaches the people actively searching for opportunities.
Dedicated Property E-Blast Premium Listing Exposure Direct Access to Qualified CRE Buyers Statewide Reach Across Texas
Ready to market your next listing? Contact REDnews today:
E-Blast Example Jeff Johnson Jay Kodytek jeff.johnson@rejournals.com jay.kodytek@rejournals.com OCT/NOV 2026 15 612-819-0385 612-940-3713
World Cup from page 14
“The properties that performed best became part of the fan experience through the right tenant mix, gathering spaces or activations.” its near match venues increased 53.7% on a year-over-year basis during the World Cup tournament, while retail visits climbed 22%. By comparison, host markets overall, when you don't just focus on locations close to venues, saw only a modest visitation advantage over markets that didn’t host World Cup matches. “Mega-events create enormous consumer demand, but proximity alone does not guarantee that businesses will capture it,” said Anjee Solanki, national director of retail services and practice groups for the United States at Colliers, in a written statement. “The properties that performed best became part of the fan experience through the right tenant mix, gathering spaces or activations.” What does this mean? The World Cup provided the traffic. The properties that benefited most were those that gave visitors a reason to stick around after the matches ended. In little surprise, bars and pubs located near U.S. World Cup venues saw some of the biggest gains in business. Across host markets, they averaged a 9% increase in match-day visits. Sporting goods retailers performed even better, recording higher match-day visits in all 11 U.S. host metros, averaging about 14% above pre-tournament same-weekday levels. That consistency made the category the tournament’s biggest retail winner, according to the Colliers/ Placer.ai report. Other retail categories produced more mixed results. Apparel stores and superstores, for instance, didn’t experience the same across-the-board gains. That suggests that major sporting events don’t necessarily lift every retailer equally. Businesses that have a natural connection to the event, or that can create an experience around it, saw more consistent boosts in activity. Public fan activations also played a role. Fan Fests and other community events helped spread the World Cup experience beyond stadiums, giving more consumers a reason to gather in commercial 16
OCT/NOV 2026
areas. But the resulting boost to nearby businesses varied depending on where those activations were located and how they were designed. That could offer a lesson for municipalities and developers planning for future mega-events. The Colliers/Placer.ai report suggests that organizers can't just create an event in a market and expect surrounding properties to benefit automatically. The connection between the event and the commercial district has to be intentional. “Retail and dining locations close to the action during the World Cup events benefited from the increased enthusiasm and many were able to capitalize on the attention in host cities,” said Elizabeth LaFontaine, director of research at Placer.ai, in a written statement. “Traffic growth for retail categories like sporting goods was strongly correlated to the World Cup, cementing that the summer of sports captured the American shopper.” For landlords and investors, that creates another way to think about event-driven real estate. A property near a stadium or entertainment venue has an obvious locational advantage. But its tenant mix, public spaces and ability to host activations will help determine whether that advantage translates into any real increases in consumer spending. That lesson could become increasingly important as cities compete to attract major sporting events, concerts and other largescale gatherings. The properties best positioned to benefit may not necessarily be those closest to the action. They may be the ones that can become part of it. The Colliers and Placer.ai analysis also comes with an important caveat: Its visitation data measures domestic U.S. traffic and excludes international visitors. As a result, the numbers don’t capture the full impact of foreign tourists who traveled to the United States for the World Cup.
The top industrial investment markets? LoopNet’s list is dominated by Texas cities BY DAN RAFTER, EDITOR
I
Pexels photo by Juan Mendez.
nvestors looking to sink their dollars into industrial properties? LoopNet suggests they should focus on Texas.
Five Texas markets ranked among LoopNet’s latest list of the 10 best U.S. cities for industrial investing, with Midland taking the top spot and Lubbock ranking No. 2. Odessa came in fifth, Austin eighth and Fort Worth ninth. El Paso rounded out the Texas contingent at No. 10. That gives Texas half of the markets in LoopNet’s top 10, an impressive showing that highlights the continuing strength of the state’s industrial real estate market. LoopNet analyzed more than 22,000 industrial listings across 139 U.S. cities when compiling its ranking of the 10 best U.S. markets for industrial investors. The study considered five factors: rent-to-price ratios, available industrial inventory, industrial employment trends, population growth and building quality. The property and pricing data
reflects listings active in July 2026, according to LoopNet. LoopNet described Midland, Texas, as the most well-rounded industrial market in its study. The city posted a median asking rent of $17.50 a square foot annually, the highest among the top 10 markets. Manufacturing employment jumped 17.6% year over year, while Midland also ranked among the top 20 cities for available industrial listings. One of the reasons for that strength? Midland sits in the heart of the Permian Basin, tying its industrial demand closely to the region’s oil-and-gas economy. LoopNet ranked Lubbock as the second-best industrial investment market largely because of its consistency. The market had a median industrial asking price of $94.96 a square foot and a median annual asking rent of $10.50 a square foot. Industrial employIndustrial to page 18 OCT/NOV 2026
17
Industrial from page 17
ment also increased across the metro, led by manufacturing. Odessa, another Permian Basin market, came in at No. 5. LoopNet pointed to its 12.6% rent-to-price ratio, one of the strongest in the country, as one reason. Odessa also benefits from its sizable inventory of available properties. But Odessa also illustrates one of the risks investors face in chasing the highest returns. Industrial employment declined on a yearover-year basis in this market, with both manufacturing and wholesale trade employment falling. That made Odessa the only market in LoopNet’s top five with a negative overall employment picture. Austin ranked No. 8 in LoopNet’s study and posted the strongest demand profile among the 10 highest-ranked cities. The metro population here grew 13.9% over five years, while manufacturing employment climbed 17.2% year over year. Austin also boasts one of the newer industrial inventories among the top markets, with a particularly high share of Class-A properties available to investors. Investors pay for those strengths, though. Austin had the highest median asking price per square foot among the top 10 markets on LoopNet’s list, and its 5.9% rent-to-price ratio was the weakest in that group. Fort Worth, at No. 9, also benefited from the quality of its industrial inventory. The market had a share of Class-A properties more
than twice that of any other top-ranked city, along with one of the largest pools of available listings. Its metro population grew 10.6% over five years. Again, the trade-off is price. Fort Worth's rent-to-price ratio was relatively low, while industrial employment growth was only marginal on a year-over-year basis. El Paso’s median industrial asking price of $77.03 a square foot was the lowest among LoopNet’s top 10 markets, helping the market generate an 11% rent-to-price ratio. The city also benefits from its position along the U.S.-Mexico border and the resulting cross-border freight activity. El Paso’s population growth was less impressive, though, with LoopNet reporting that it increased just 1.3% during the last five years.
How did LoopNet determine which markets made its list of top industrial investment regions? LoopNet gave rent-
to-price ratios the greatest weight in its ranking, accounting for 30% of the score. Listing volume represented another 20%, as did industrial employment trends. Population growth accounted for 15%, while the share of Class-C inventory represented the remaining 15%. The study also cautions that its rent-to-price ratio doesn’t match a property's expected return. That’s because this ratio doesn't account for such challenges as vacancy, operating expenses, taxes or concessions.
Sponsors
Speakers:
REDnews Houston
CONSTRUCTION November 5, 2026
summit
1:00 PM - Registration & Networking 1:30 PM - 4:30 PM Program Houston Racquet Club (10709 Memorial Dr, Houston, TX 77024)
3 Hours of Real Estate Continuing Education Credits have been Applied for with the Texas Real Estate Commission
Register Today
18
Scan QR code or Click Here OCT/NOV for more information and2026 to register
Ty Adams - KT Ventures Roger Berry - SpawGlass Nicholas Biddlecome - Read King Bill Brown - Tellepsen Brock Chisty - TRIO Electric Angela Cotie - Cotie Consulting Darlene East - Holes Incorporated Daniel Garnier - Signs By G Joshua Hanson - MSD Building Corp Paris Karageorgis - Dynamic Glass, LLC Brooke Koop - ANDRES Construction PD McIntyre - Chamberlin Roofing & Waterproofing Jessica Osuna - MEMCO Sara Prasatik - Munsch Hardt Kopf & Harr P.C. Sam Sprouse - Satterfield & Pontikes Construction Jodi Stevens - Griesenbeck Architectural Products, Inc.
Sponsorship Opportunities Available:
Jeff Johnson jeff.johnson@rejournals.com | 612-819-0385 Jay Kodytek jay.kodytek@rejournals.com | 612-940-3713
Falling in love with physical retail again? Shoppers seek freedom from the algorithm BY DAN RAFTER, EDITOR
A
Abercrombrie & Fitch is an example of a national retailer that has revamped its stores to meet the needs of today’s customers. (iStock photo, credit tupungato.)
re shoppers yearning for the physical store experience once
again? The latest research from JLL suggests that a growing number of consumers view brick-and-mortar stores as a healthy break from online shopping. According to JLL’s new report, Resetting the Retail (Algo)Rhythm, shoppers are turning to brick-and-mortar shops as an antidote to digital exhaustion. This means that physical shops can’t just mirror online shopping. They must offer experiences that shoppers can’t get by simply clicking on an Amazon link. According to JLL’s report, 83% of consumers enjoy finding products in stores they never would have searched for digitally, while 53% of both Millennial and Gen Z consumers say that they prefer browsing physical stores without algorithmic influence. Physical retailers need to be careful, though, not to turn off their customers. According to JLL’s report, 72% of shoppers reported leaving a store early because it felt overwhelming, whether that meant that the store’s shelves were too cluttered, the noise levels too high or in-store screens were flashing too many messages. The survey found that atmosphere matters when it comes to brickand-mortar shopping. A total of 60% of shoppers surveyed said that a store’s atmosphere influences whether they would recommend it to others, even when they didn’t make a purchase. We recently spoke with Emily Albright Miller, Executive Vice President of Strategy at JLL Design, about the brokerage’s latest retail findings and what they mean for both online and brick-and-
mortar shopping. Here is some of what she had to say.
I know this is a big topic, but why are consumers returning to physical retail? Emily Albright Miller: It’s important to ground ourselves.
More than 80% of retail sales are happening in brick-and-mortar locations. The shoppers never really left physical stores. They are gravitating toward the experiences that brick-and-mortar retail can provide. They want something very different than what they can get with ecommerce and digital retail. What we found in our report was that consumers are tired of the algorithm. When retailers first started offering ecommerce solutions, there were so many options at consumers’ fingertips. The whole model of Amazon was that it offered an infinite number of choices. It eventually became overwhelming for consumers to navigate. Consumers had to spend so much time filtering, sorting and browsing through this endless list of items. That is where AI came in. You can now have AI do the sorting for you. A huge percentage of consumers start their online shopping journey with a large language model. That makes online shopping less overwhelming. But it also narrows what consumers are allowed to see online. Consumers feel like the algorithm is limiting what they can see and purchase online. That doesn’t happen when you shop in a physical store. By shopping in brick-and-mortar locations, you get the opportunity to discover new and different items. Shoppers like that. Just look at high school kids. They want to experiment. They might Shoppers to page 20
OCT/NOV 2026
19
Shoppers from page 19
want to be emo one day and preppy the next. The online algorithm won’t let you do that when you are shopping digitally.
The Millennials and Gen Xers also express some exhaustion with digital retail, but they are still reliant on this digital reality. The Millennials kind of created this digital world we are now living in. They are also a sandwich generation. They are raising kids and caring for aging parents. They are balancing a lot. They can't reject the convenience of online shopping as strongly as Gen Zers because they are so reliant on solutions that save their time.
JLL’s report also mentions digital exhaustion with social media and other online sites. How is physical shopping an antidote to that? Gen Xers want more control over their shopping experiences. We Miller: Consumers are overstimulated. We live in a world where found that they are using QR codes the most. It gives them a sense we are all overstimulated. So much is constantly flung at us. We are all seeing so much content day to day. Shopers are gravitating toward brick-and-mortar experiences partly because they allow them to be calmer in their retail journey. They provide an escape from this overstimulation.
of control.
For Boomers, there is still some novelty with this technology. Maybe we should be concerned more with our aging parents when it comes to smartphones and screens. They are so addicted to the scroll and the different technologies.
There is a balance, though, right? Most people will turn to both online and physical shopping? What about the overstimulation that shoppers can Miller: Yes, depending on your trip mission and your mindset experience in physical stores? Are some shoppers there is always going to be value to an ecommerce experience. staying away from stores that are too loud and clutShopping online is a highly convenient and efficient experience. tered? But there are times when shoppers want the benefits of physical Miller: Yes. Just look at Abercrombie & Fitch. We have seen retail, too. There is a difference by generation. Gen Z shoppers who have grown up with digital retail are the ones rejecting it the most. They tell us that they want to escape the algorithm. What’s interesting, though, is that they are still creating and sharing a lot of online content from their brick-and-mortar experiences. They are still shopping with their mobile devices. They use them at the point of purchase, and they get them out to text their friends about their purchases.
Image courtesy of JLL. 20
OCT/NOV 2026
many quarters of positive results from them. But in the early 2000s, that store was super dark and super loud. The smells were overpowering. Abercrombie & Fitch has since reinvented the store experience. There is more natural light. The audio experience is much calmer. The scent experience is more neutral than it used to be. These changes are having an impact. Abercrombie & Fitch has performed strongly in the last 14 quarters. Retail to page 29
TEXAS 2027 COMMERCIAL REAL ESTATE FORECAST & RETAIL MARKET UPDATE TEXAS COMMERCIAL REAL ESTATE & RETAIL DECISION-MAKERS
DEADLINE: DECEMBER 13, 2026
Are you looking to attract New Businesses, Expand Local Industries, and Drive Growth in your Region?
SPREAD EXAMPLE:
– THIS IS YOUR ESSENTIAL RESOURCE!
The 2027 Commercial Real Estate Forecast & Retail Market Update is your key to success! Promote your City to over 20,000 Commercial Real Estate decision makers in REDnews 2027 Commercial Real Estate Forecast & Retail Market Update. SHARE YOUR STORY! • Full Page Ad - Includes a full-page editorial across from your ad - $2,300 • Half Page Ad- Includes a half-page of editorial on top of your ad - $1,700 • Quarter Page Ad- Includes a quarter-page of editorial on top of your ad - $950
To Reserve Your Space, please contact:
Jeff Johnson
Jay Kodytek
612-819-0385 jeff.johnson@rejournals.com
612-940-3713 jay.kodytek@rejournals.com
OCT/NOV 2026
21
BOMA study: Commercial real estate remains a boon to the U.S. economy BY DAN RAFTER, EDITOR
iStock photo, credit jamesteohart.
C
ommercial real estate remains a major growth engine for the U.S. economy, generating hundreds of billions of dollars in economic activity and supporting millions of jobs across the country, according to the latest research from the Building Owners and Managers Association International. How big of a growth engine? Boma’s 2026 Market Study: The Economic Impact of U.S. Commercial Real Estate found that the operation and maintenance of office, retail and industrial properties across 79 U.S. markets generates $609.9 billion in annual economic output and supports 3.9 million jobs. The study, which BOMA conducts every three to four years, highlights the economic contribution of commercial building operations. The latest analysis covers 35.4 billion square feet of commercial real estate across 79 markets in 38 states. 22
OCT/NOV 2026
And the numbers show that the economic impact of commercial buildings extends well beyond the owners and tenants occupying them. Building operations generate $274.9 billion in annual operating expenditures, according to BOMA. Those expenditures contribute $344.4 billion to U.S. gross domestic product and generate $219.4 billion in personal earnings. For every $1 spent on building operations, the study found, $2.22 in total economic output is generated through direct, indirect and induced economic activity. That activity flows through a broad network of businesses and workers. Building managers, contractors, maintenance and repair companies, suppliers, utilities, insurers and security providers all play roles in keeping commercial properties operating.
“Commercial buildings are economic engines, supporting businesses, jobs and communities across the country,” said Kjersten Jaeb, BOMA Fellow, chair and chief elected officer of BOMA International, in a statement. “Every building relies on an extensive network of professionals, service providers and businesses to keep it running safely and efficiently.” Technology is adding another layer to that ecosystem, Jaeb said, as building owners and managers increasingly use technology to manage energy, water, security, access and overall building performance.
A changing construction landscape
BOMA's study also looks beyond building operations to examine construction activity in the office, retail and industrial sectors. One of the more notable findings involves the increasingly important role of data centers in office construction statistics. Federal construction statistics classify data centers as private office construction. As a result, the rapid expansion of data center development is having a significant effect on the nation's overall office-construction figures. In 2025, data centers accounted for approximately $41.2 billion, or nearly 46%, of more than $90 billion in private office construction nationwide. A decade earlier, data centers represented less than 5% of private office construction.
“Commercial buildings are economic engines, supporting businesses, jobs and communities across the country,”
Traditional office construction, excluding data centers, totaled about $48.4 billion in 2025. Industrial construction, meanwhile, remains at historically high levels, BOMA’s research found. Warehouse and manufacturing construction totaled approximately $274.2 billion in 2025. That represented a 7.9% decline from the previous year, but the figure was still more than twice the 2020 level and ranked as the third-highest annual total on record. Retail construction totaled approximately $47.1 billion in 2025, with activity increasing during the first three months of 2026. The life sciences real estate sector also is showing signs of settling into a more normalized environment following several years of rapid expansion.
Impact reaches beyond major markets
The economic contribution of commercial real estate isn't confined to the nation's largest cities, either. BOMA's study looks at commercial real estate activity in 79 markets of varying sizes, spread across 38 states. The organization says building operations in those markets support local jobs, businesses and wages, creating economic activity that continues year after year. “The economic impact of commercial real estate is not a one-time event,” said Mary Lue Peck, president and COO of BOMA International, in a statement. “Ongoing investments in the operation, maintenance and improvement of our buildings generate economic activity that supports businesses, jobs and wages across the country creating an impact that lasts well into the future.” The study was conducted by the Business Research Division at the Leeds School of Business at the University of Colorado Boulder on behalf of BOMA International. Researchers used 2025 square-footage estimates from CoStar and operating-expense data from the National Council of Real Estate Investment Fiduciaries. They then used the 528-sector IMPLAN input-output model and its Multi-Regional Input-Output framework to calculate the direct, indirect and induced economic impacts associated with commercial building operations. The analysis covers office, retail and industrial properties across BOMA's 79 markets. It also includes a separate analysis of life sciences properties in 17 markets where sufficient data was available. For commercial real estate owners and operators, the findings put a dollar figure on something that can be easy to overlook: The economic contribution of a building doesn't stop when construction is complete or when a tenant signs a lease.
OCT/NOV 2026
23
Green Street: Industrial still one of the leaders in commercial real estate recovery BY DAN RAFTER, EDITOR
D
espite challenges, the industrial sector continues to be one of leaders in the commercial real estate property recovery, with values rising faster than those of most major property sectors even as higher borrowing costs threaten to slow the momentum.
That’s one of the major findings from Green Street it September 2026 Commercial Property Price Index. Industrial property values rose 0.6% in August and 7% over the past 12 months, according to Green Street’s price index. The sector remains one of the strongest performers in commercial real estate,
All charts provided by Green Street. 24
OCT/NOV 2026
All charts provided by Green Street.
with values now just 8% below their 2022 peak. That compares favorably with the overall market. Green Street’s all-property index increased 0.8% in August and 5% over the past year. Overall commercial property values remain 13% below their 2022 peak, a slightly worse performance than industrial specifically. The latest numbers show that commercial real estate values are continuing to recover from the sharp declines that followed the Federal Reserve’s interest-rate increases. But that recovery could face a new headwind. “It’s been a nice run for property prices, but I expect things will cool off,” said Peter Rothemund, Co-Head of Strategic Research at Green Street, in a written statement. “The rise in Treasury yields over the past several months, and its impact on borrowing costs, is likely to cause buyers to rethink what they’re willing to pay.” That could be particularly important for investors weighing the
next phase of the industrial market. The sector has benefited from strong tenant demand and years of rent growth, but higher financing costs could make it more difficult for buyers to justify spending too much on these properties. Green Street reported that the industrial sector isn’t the only one posting gains. Retail has emerged as another bright spot in Green Street’s latest figures. Mall property values increased 2.5% in August and 14% over the past 12 months. In fact, mall values are now 6% above their 2022 peak. Strip retail has performed almost as well. Values climbed 2.1% in August and 8% over the past year. Strip retail values are essentially back to their 2022 peak, sitting just 0.4% below that level. The retail recovery is notable given the challenges the sector faced earlier in the decade. The Green Street data suggests that investors have become increasingly comfortable with high-quality retail properties and the income streams they can generate.
Green Street to page 33 OCT/NOV 2026
25
Today’s shoppers? They prefer quick trips and local options BY DAN RAFTER, EDITOR
iStock photo, credit Drazen Zigic.
T
oday’s consumers might not look quite like the shoppers many retailers, developers and investors have been planning for, according to the latest research from Placer.ai. In good news for retailers, younger consumers, particularly those in the Gen Z age group, are shopping in physical stores more frequently. And yes, retailers continue to embrace experiential retail designed to pull consumers away from their screens and into brickand-mortar locations.
Placer.ai found that the vast majority of visits to the retailers included in its Placer 100 Retail Index last less than 30 minutes. Visits of fewer than 15 minutes represent the largest dwell-time category.
But a closer look at visitation data tells a more complicated story, according to The 2026 Retail Consumer in 5 Charts: Who’s Winning in 2026? Placer.ai released this report in August, and it shows that shoppers are evolving as they embrace both the convenience of online shopping and the variety and excitement offered by physical retail.
For retailers, that puts a premium on convenience. Intuitive store layouts, easy product discovery, efficient checkout and convenient pickup options can help retailers attract customers looking for quick trips, Placer.ai said.
According to Placer.ai’s report, today’s shoppers often live close to the stores they visit. Today’s shoppers tend to spend less time in stores, too. Older consumers remain an important part of the brickand-mortar audience. And lower- and middle-income households account for a disproportionate share of physical-store traffic. At the same time, consumers are increasingly shopping at retailers that give them compelling reasons to visit, whether that means low prices, a steady influx of new products, a wide selection of tiems or an experience that shoppers can’t easily replicate online. Those are among the key findings in Placer.ai’s August report, which analyzes visitation data from the Placer 100 Retail Index to examine how consumers are interacting with physical stores, and what those patterns mean for retailers, advertisers and commercial real estate professionals. Here are the five key shopping trends in Placer.ai’s report:
1. Most retail trips are short
Today’s consumers generally aren't spending much time in stores. 26
OCT/NOV 2026
That suggests that many consumers are approaching physical retail with a specific mission: They know what they want, they want to find it quickly and they want to get on with the rest of their day.
The finding also has implications for advertisers. Consumers are increasingly researching and discovering products before they arrive at a store. That gives in-store advertising a different role: Instead of simply introducing a product, it can reinforce the physical-store experience through demonstrations, samples and product trials. For commercial real estate professionals, there are key lessons here: Parking, tenant mix and overall property design can all influence how easily consumers can complete a quick shopping trip. At the same time, properties can create optional reasons for consumers to linger, turning a short mission into a longer visit.
2. Retail remains intensely local
Retail may be increasingly omnichannel, but consumers still tend to shop close to home. Nearly 60% of retail visits analyzed by Placer.ai originate within five miles of the store. About 44% originate within just three miles. That makes location about more than visibility, accessibility or traffic counts. It means that a retail property effectively comes with a customer base attached to it.
The households surrounding a store will account for a substantial portion of its visitors. For retailers evaluating new locations, then, understanding the demographic characteristics of those nearby households can be just as important as evaluating the physical characteristics of the property. A location that looks attractive based on traffic or proximity to other businesses might not be a strong fit for every retailer. The surrounding population needs to match the consumer that a particular brand hopes to attract. The same principle applies to marketing. With such a large share of retail traffic originating nearby, localized campaigns can concentrate advertising dollars on those consumers who are most likely to visit a particular location. For landlords and developers, the lesson is clear: When looking at possible tenants, landlords and developers shouldn’t focus only on whether a retailer can afford the monthly rent, but whether its customer base fits the population surrounding the property.
3. Don't overlook older shoppers
The retail industry has devoted plenty of attention to Gen Z's embrace of physical stores. Placer.ai's data, though, suggest that retailers shouldn't let that enthusiasm obscure another important reality: Older consumers remain a core brick-and-mortar audience. Adults aged 55 and older are generally overrepresented in the captured market of the chains included in the Placer 100 Retail Index. That’s not surprising; Older shoppers already have a strong affinity for physical retail. That should influence how retailers think about their stores. The push to attract younger consumers shouldn't come at the expense of ignoring customers who are already visiting and spending money in physical locations. Store layouts, merchandising, messaging and in-store experiences should continue to serve these consumers. Retail properties designed to appeal to younger generations still need to function for older shoppers, according to Placer.ai’s report. Accessibility, easy navigation, convenient parking and seating can all influence the physical-store experience for all shoppers, but these features are especially important for older ones. A multigenerational tenant mix can also help strip center properties appeal to a broader audience.
4. The brick-and-mortar shopper has a distinct income profile
According to the Placer.ai report, households earning less than $100,000 annually are overrepresented among visitors to the Placer 100 Retail Index. Households earning more than $150,000, meanwhile, are underrepresented. Armed with this information, brands can tailor their physical-store products, messaging and promotions to better serve the consumers already walking through their doors.
work to attract more affluent shoppers who are part of their broader potential market but currently aren't visiting physical locations at the same rate. A brand's overall customer demographics may not accurately describe the people who actually visit its physical stores. Retailers and advertisers trying to drive physical visits should consider the income characteristics of their actual store visitors rather than relying exclusively on their broader customer profile. A retailer's offline visitor profile may provide a better indication of how well it will perform at a particular property than its overall brand audience. If the shoppers surrounding a shopping center resemble the retailer's existing in-store customers, the tenant may be a stronger fit. 5. Value matters—but so does experience Perhaps the most important takeaway from Placer.ai's report is that consumers aren't necessarily choosing between value and experience. Instead, they're looking for both. Value-oriented retailers appear prominently among the fastest-growing chains in the Placer 100. But retailers that combine value with discovery, browsing or in-store experiences are also posting strong gains. Placer.ai points to Five Below, Hobby Lobby, Ross and Citi Trends as examples of retailers where growth is occurring not only across their overall footprints but also at individual venues. The message for retailers is that low prices remain a powerful reason to visit a store. But price isn't the only way to win. Physical stores can give consumers something online shopping cannot: the opportunity to browse, discover unexpected products, experience merchandise firsthand and enjoy the act of shopping itself. That gives advertisers another way to position physical retail. Value-focused campaigns can emphasize deals and the excitement of discovery. Experiential retailers can promote the selection, inspiration and experiences consumers can find only in person. Retail properties that offer both value and experience, and are home to tenants that combine affordability with discovery or experiential appeal, could be especially well positioned to generate traffic among today’s evolving shoppers. A clearer picture of the 2026 shopper The Placer.ai report suggests that consumers are still visiting stores in significant numbers but are choosier about how they spend their time and which stores they consider worth visiting. That puts pressure on retailers to make shopping easy when consumers have a specific mission and compelling when they don't. It also places greater importance on the fundamentals of commercial real estate. Location matters because consumers remain highly local. Tenant mix matters because different retailers appeal to different populations. Property design matters because shoppers still care about convenience. And the ability to offer discovery and experience matters because those are among the advantages physical stores retain over e-commerce.
But the research from Placer.ai also suggests that retailers should OCT/NOV 2026
27
Before you deploy AI, ask if your data is ready BY KIMBERLY CASTLE
I
iStock photo, courtesy of your_photo.
n the rush to adopt AI for facilities management, the initial
conversations about deploying AI tools almost always focus on speed of deployment. However, that’s not a sound approach. Instead, managers should first ask whether the operational data behind the scenes can support what the tool promises to do, because, without the proper data foundation, any AI initiative will likely stall out within a year and fail to produce tangible results. Facilities organizations have no shortage of data. In fact, from maintenance logs and asset records to lease files and energy meters, most organizations generate far more data than they realize. But volume alone is not enough. AI can only draw reliable conclusions from data that is clean, connected and consistently structured across systems. For example– when asset names differ from platform to platform, and when work orders live in scattered notes, AI will simply automate disorder at scale.
Where AI initiatives typically go wrong:
The first mistake is to choose a tool and then work backward to determine whether the data the tool requires exists. Instead, before choosing any AI tool, facilities leaders need a clear picture of what data they have and where this information lives. The second mistake is deploying narrowly defined AI tools, instead of incorporating AI into the basic operating system for facilities management. AI delivers the most value when it is embedded across the full range of facilities operations, drawing from the same governed data set on which maintenance, real estate and finance teams already rely. Beginning with targeted use cases isn’t a bad way to begin, but facilities should always have an eye towards creating a larger, AI-enabled system to really see AI move the needle. The third mistake is to skip over data governance. Someone has to own data quality on an ongoing basis, and without a named owner and a defined process for keeping records current, even a well-integrated system can degrade rapidly as new equipment, renewed leases, and space changes go undocumented.
What good data governance looks like:
AI does not require perfect data across the entire enterprise, at least, not in the beginning. So long as there’s a clearly defined 28
OCT/NOV 2026
starting use case, IT just needs to provide access to the minimum data required to support it and a workflow owner with the authority to act on what AI surfaces. Let’s look at a concrete example in maintenance. During their work, experienced technicians build an instinct for which equipment is trending toward failure. However, that knowledge is unscalable, and it leaves the organization the day the technician does. In comparison, AI can track asset records, service history and maintenance activity, so long as they all live in one connected system and detect failure patterns as they emerge. AI transforms signals that would otherwise go unnoticed into warnings that enable a team to act before a breakdown occurs. Space and lease data benefit from AI adoption just as much. Badge counts and meeting room bookings tend to overstate real utilization, and the people who see the space day to day often know the true numbers but lack the data to make their case to the people controlling portfolio decisions. When utilization data sits alongside lease expiration dates and headcount projections, a facilities leader can walk into a portfolio review and show, with evidence, that a floor has run at low occupancy for two straight quarters while its lease renews within the year.
The real question before any tool selection:
Every one of these outcomes depends on the same underlying condition: a unified operational platform where asset records, maintenance history, space data, lease obligations and energy consumption all speak a common language. That foundation is what separates organizations getting real value from AI from the ones still explaining why their pilot never delivered. Before the next AI demo lands on your desk, bring a different question to leadership. Not which tool to buy, but whether the data foundation exists to make any tool worth buying. It is a harder conversation than a software pitch, and it is the one that determines the outcome. Kimberly Castle is President of Planon North America, where she leads regional strategy, operations, and customer engagement. She has more than 30 years of experience in corporate real estate and workplace technology, having held senior roles at CBRE, MetLife, JLL and Suncor.
What factors persuade customers to recommend a Retailers must be careful with how they communicate with shop- physical store to others? pers in their stores. There can be so many messages in a small Miller: The number one feature that makes a store feel good to be Retail from page 20
space. There is information on product packaging. There are QR codes. There are often screens and signs. It’s important for physical retailers to refrain from shouting so many messages to customers all at once. Scent is very important as is sound. Retailers can’t let the in-store experience become too overwhelming.
Paris Baguette, a fast-casual bakery chain, is a good example of how to do it right. It is a high-growth quick-service-retail company. They keep their pastries in cases. Consumers select their own pastries. When they open the cases, they experience the smells from these products. But the consumers are controlling the experience. It’s not until you open the case with the strawberry doughnut that you experience the scent from it. You don’t smell everything at once. The consumers are empowered to experience the pastries as they choose. La La Land Café is another example. These coffee shops focus on the aesthetic experience. There is a focus on providing the right lighting and color washing to provide a content-worthy experience to consumers. It’s a focused and calming experience. Providing this is important: 60% of the shoppers we surveyed said that a store’s ambience influences their decision to recommend it to others, even if they don’t buy anything.
in is a focus on touching and feeling the products. Consumers don’t want a screen in their way. They want to feel the products. That’s the whole reason why they got off the couch to visit a brick-andmortar location. Consumers also want enough space and to browse at their own pace. They don’t want to feel pressure from employees hurrying them along or pressuring them to make a purchase. But they do want knowledgeable staff to be there when they need them. They want it to be on their own terms.
Do you think this embracing of physical retail is a long-term trend? Miller: I do. The numbers are only strengthening as we get
younger through the generations. Retailers spent years thinking about how to create an omnichannel experience, where their online and physical presences work together. That is still important. But consumers are now giving retailers permission to let brickand-mortar do what it does best. Retailers still need an omnichannel approach. But they can also amplify the strengths of physical retail. That’s the point.
Speakers: REDnews Houston
INDUSTRIAL November 5, 2026
summit
8:00 AM - Registration & Networking 8:30 AM - 11:30 AM Program Houston Racquet Club (10709 Memorial Dr, Houston, TX 77024)
3 Hours of Real Estate Continuing Education Credits have been Applied for with the Texas Real Estate Commission
Register Today
Scan QR code or Click Here for more information and to register
Jake Allen - First Industrial Realty Trust Greg Barra, CCIM, SIOR - Boyd Commercial Nathan Buckhoff, SIOR - Oxford Partners Hachem Domloj - CIVE Heath Donica - Stream Realty Peyton Easley, SIOR, CCIM - Titan Commercial Jack Gaffney, SIOR - Finial Group David Gwin - City of Missouri City Beau Harris - Black Label Commercial Group Doc Perrier - Matthews Real Estate Investment Services™ Brad Porter - Porter Law Firm Jason Scholtz - Colliers Ash Shah - IMPEX Capital Group, LLC Alex Tebo - Bridge Logistics Properties Nick Terry, SIOR, CCIM - Rifle CRE Reed Vestal - Junction
Sponsors
More Speakers to be announced... Sponsorship Opportunities Available:
Jeff Johnson jeff.johnson@rejournals.com | 612-819-0385 Jay Kodytek OCT/NOV 2026jay.kodytek@rejournals.com | 612-940-3713 29
CORFAC members share positive deal trends, impacts of AI BY JOE SANTAULARIA
CORFAC International’s survey of members earlier this year demonstrated that the commercial real estate sector as a whole and transaction activity within specific sectors are seeing growth. More than half of surveyed members experienced increased transaction activity. Because of this trend, respondents from across the global network are expressing optimism about the market’s performance and the prospects for their businesses this year.
The survey also revealed growing diversification of activity. Land transactions, particularly tied to multifamily development, are gaining traction. One respondent reported having “over $200 million under contract in land deals driven by multifamily development to combat the affordable housing crisis,” signaling a shift toward development-driven opportunities in growing markets.
Continued Strength in Industrial
Though office remains a smaller share of expected growth, the subsector is not dormant. Respondents highlighted a continued shift toward smaller, more efficient spaces, creating transaction activity. As one member explained, companies maintaining hybrid schedules are “looking to downsize and leasing smaller spaces with more buildouts.”
Industrial- and logistics-related sectors dominate transaction activity across the network so far this year. Manufacturing, noted by more than 70% of respondents, is the leading subsector driving business activity, with warehouse/distribution following close behind it. Office continues to drive select markets, and investment sales are showing a network-wide uptick as well. Meanwhile, retail transaction activity has slowed for most respondents. Members expect industrial will continue to fuel business across the network for the remainder of the year. One member noted, “Advanced manufacturing users continue to drive industrial demand.”
30
OCT/NOV 2026
Office and Retail Are Still Evolving
Retail also shows pockets of strength, particularly tied to development and experiential uses. One respondent reported recently completing a “25-acre land assembly for a grocery-anchored retail development,” reflecting how necessity-based retail continues to fuel activity.
The Good News: Transaction Activity Increases
How AI is Shaping CORFAC Member Operations
noted performance remains “highly dependent on the sector,” just over 20% said transaction activity declined in the first quarter.
though AI is having a positive impact on operations, some respondents also cited it as a disruptor. The question of how to incorporate AI effectively into daily workflow remains a key concern.
Compared to the last fall’s survey results, transaction activity is growing across the network. More than 50% of respondents reported increased transaction activity and just over a quarter of members said activity has remained stable since. While others
Deal highlights reinforce this trend. Members reported significant transactions ranging from a $24 million industrial sale to multiple office leases exceeding 20,000 square feet. Another highlight reported is a 165,000-square-foot corporate headquarters project. These examples underscore continued deal flow across asset types and geographies within the network. Top sources of new business among CORFAC firms so far this year include client expansions, business relocations into the market and referrals from local service providers. Collaboration and in-network referrals between CORFAC firms also continue to drive business.
AI and new data technology are playing a growing role in enhancing operational efficiencies. AI and data availability were among the top positive influences on brokerage operations, along with attracting top talent and connections made through CORFAC. Al-
Throughout the rest of the year, member success will hinge on navigating the rapidly changing market. Brokers must look to capitalize on strong sectors while adapting to evolving client needs, economic realities, and technological change. CORFAC members and their clients can stay on the forefront even when encountering challenges by leveraging the network’s collective expertise and robust referral network. Joe Santaularia, executive vice president at Dallas-based Bradford Commercial Real Estate Services/CORFAC International, is the current president of CORFAC International.
The Bad News: Inflation and Interest Rates
Despite improving sentiment about the commercial real estate market overall, respondents reported inflation and interest rates as the most significant negative influences on transaction activity. Other factors, such as high costs for labor and construction materials, lack of available space and difficulty obtaining financing, are plaguing some markets.
OCT/NOV 2026
31
Negative net absorption? Yes. But that doesn’t tell the full cold storage story BY DAN RAFTER, EDITOR
T
iStock photo, credit Unaihuiziphotography.
he U.S. cold storage market is going through a period of ad-
justment. And older facilities? They are struggling to keep occupancy levels high, while newer cold storage buildings are seeing steady demand.
That is one of the big takeaways from Newmark’s first-half 2026 U.S. Cold Storage Market Overview, which found that this key sector recorded negative net absorption during the first half of the year, the first time that has happened during a first half since 2007. About 41 million cubic feet of new cold storage space was delivered during the period, while net absorption fell by 56 million cubic feet. Thanks to this imbalance, vacancy climbed to an average of 7.7% in the U.S. cold storage market during the first six months of the year, according to Newmark. But that negative absorption? It doesn’t provide an accurate picture of the strength of the U.S. cold storage industry. Newmark found that tenants are increasingly seeking space in modern cold storage facilities. According to the company’s report, cold storage properties delivered since 2020 have captured nearly all recent demand, while older facilities continue to lose occupancy. Legacy properties have posted negative absorption since 2022, a trend that points to growing functional-obsolescence risks for aging facilities. For owners of older cold storage properties, the current environment is a challenging one. Just look at the numbers: As of the second quarter, legacy facilities carried an 8.2% vacancy rate, compared with just 3.4% for properties delivered from 2006 through 2019. Newer facilities delivered since 2020 had the highest vacancy rate in the first half of the year, at 10.9%. But much of that reflects the lease-up of recently completed space rather than the same kind of structural decline facing older buildings. Legacy facilities accounted for 68% of all vacant cubic feet, compared with 24% for post-2020 properties and 8% for the 2006-2019 cohort, Newmark reported. Population growth continues to fuel food distribution patterns 32
OCT/NOV 2026
across the country. Newmark is predicting that the Dallas-Fort Worth market could require another 2.8 million square feet of cold storage space by 2035 based on projected population growth. Houston could need 1.3 million square feet, while Tampa-St. Petersburg-Clearwater could require 1.1 million square feet and Atlanta about 1 million square feet. The pharmaceutical side of the business is another major source of demand. Newmark noted that products requiring pharmaceutical cold storage have grown from 26% of pharmaceutical sales in 2017 to roughly 35%. Logistics companies including DHL, C.H. Robinson, FedEx and UPS are responding by investing billions of dollars in specialized cold-chain capacity. Food distribution is changing, too. U.S. e-grocery sales rose 21.5% on a year-over-year basis in July, while in-store sales declined 2.6%. Because delivery and ship-to-home orders are more coldchain intensive than pickup orders, retailers and logistics providers are expanding temperature-controlled capacity. But building that capacity isn't cheap. Newmark estimates that cold storage construction costs between $130 and $350 a square foot, compared with roughly $85 to $150 a square foot for conventional dry warehouses. Those costs, combined with higher capital costs and softer near-term demand, mean that new projects are likely to be dominated by build-to-suit, owner-user and pre-leased developments. That dynamic is already reshaping the development pipeline. The average cold storage lease signed during the past five and a half years has been roughly 125,000 square feet, while properties under construction average nearly 300,000 square feet. The mismatch is contributing to longer lease-up periods. For investors and occupiers, then, the message from Newmark’s first-half report is becoming clearer: Cold storage remains a durable real estate sector, but not all cold storage is created equal. Modern facilities with automation, higher clear heights and sophisticated temperature-control systems are attracting demand from tenants. Older properties face a bigger challenge: Can their owners upgrade, reposition or replace them before they become obsolete?
Green Street from page 25
Healthcare real estate is also showing strong momentum. Values rose 3.1% in August and 7% over the past year, although they remain 8% below their 2022 peak. Green Street’s healthcare category includes medical office, senior housing operating properties, senior housing net-leased properties, skilled nursing and life science assets. Data centers, meanwhile, continue to benefit from the growing importance of digital infrastructure. Values increased 1.1% in August and 6% over the past 12 months. The sector remains 6% below its 2022 peak. Office and apartments continue to be the notable laggards. Office values increased 1.5% in August and 5% over the past year. Yet the sector remains 33% below its 2022 peak, by far the largest decline among the major property types tracked by Green Street. The numbers reflect the continuing challenges facing office owners and investors, including elevated vacancy, changing workplace patterns and the cost of repositioning older buildings.
Apartments are also struggling to regain their former values. Green Street’s apartment index fell 3.6% in August and declined 4% over the past year. Apartment values remain 22% below their 2022 peak. Green Street’s Commercial Property Price Index highlights the prices at which commercial properties are currently being negotiated and contracted. The index emphasizes high-quality, institutional properties and is based primarily on Green Street’s estimates of price appreciation for property portfolios owned by REITs in its U.S. coverage universe. For now, the broader trend remains positive. But with Treasury yields climbing and borrowing costs moving higher, the next phase of the commercial real estate recovery could be more challenging. As Rothemund’s warning makes clear, the market may be approaching a point where investors become less willing to stretch on price, even for the property types that have performed best.
OCT/NOV 2026
33
CRE MARKETPLACE
ARCHITECTS/DESIGN-BUILD FIRMS
KDS de stijl interiors, LLC 2006 E Cesar Chavez St. Austin, TX 78702 P: 512.457.1332 Website: kdsaustin.com Key Contacts: Jill Laverentz, Owner, jill@kdsaustin.com; Clark Kampfe, Principal, clark@kdsaustin.com Services Provided: Programming & Client Process Analysis – Due Diligence & Building Analysis – Schematic Design – Test Fit & Pricing Notes – Project Scheduling Goals – Consultant Team Formation – Cost Analysis & Value Engineering – Design Development – Construction Documentation – Racking, Commodity, & Equipment Coordination – Permit Processing – Project Management – Construction Administration – Project Budgeting & Cost Tracking – As-Built Documents Company Profile: KDS is a full-service commercial design firm with 30+ years of experience including 25,000,000+ SF of Industrial/Flex and 3,000,000+ SF of Office Projects. We are committed to responsiveness and to providing well designed and implemented solutions. Our extensive knowledge base and adept management of critical milestones creates consistently successful projects. Notable/Recent Projects: American Canning – Austin, TX – 101,000 SF – Manufacturing & Distribution FlightSafety International – TX & OK – 186,000 SF Combined – Manufacturing GT Distributors – Pflugerville, TX – 58,000 SF – Retail, Office, Fabrication, Storage & Distribution LGE DESIGN BUILD 280 E. Levee Street Dallas, TX 75207 P: 469.498.0998 Website: lgedesignbuild.com Key Contact: Ray Catlin, Regional Vice President, rcatlin@lgedesignbuild.com Service Provided: LGE Design Build provides comprehensive design and construction services, including architecture, engineering, and interior design. LGE specializes in commercial, industrial, retail, healthcare, and tenant improvement projects. Utilizing a client-centric, design-build model, LGE ensures streamlined processes, reduced costs, and sustainable building practices for customized, high-quality results. Company Profile: LGE, with dual headquarters in Phoenix and Dallas, provides full-service architecture, design, engineering, budget control, permits, and construction. Renowned for integrity and craftsmanship, LGE has completed over 1,200 projects across industries like industrial, office, hospitality, medical, and more, delivering award-winning designs. Notable/Recent Projects: LGE Dallas Headquarters, Mesquite 635, Fort West Commerce Center, Houston Point 290, Cypress Creek Distribution Center, McKinney Trade Center II, Sunridge Industrial Park, Park West Phase III, Bottled Blonde / Backyard Fort Worth.
BROKERAGE FIRMS
CMI BROKERAGE 820 Gessner, Suite 1525 Houston, TX 77024 P: 713.961.4666 Website: cmirealestate.com Key Contacts: Trent Vacek, tvacek@cmirealestate.com; James Sinclair, jsinclair@cmirealestate.com Services Provided: Central Management, Inc. is a full-service commercial real estate firm providing Brokerage Services; Property, Facility, Construction and Asset Management Services; Landlord and Tenant Representation; Land Sales; Receivership and Real Estate Recovery. Services are available for Industrial, Land, Multifamily, MOB, Office and Retail. Licensed in Oklahoma and Texas. Company Profile: Central Management, Inc. (CMI) was founded by Houston real estate professional Vic Vacek in 1978. Our team understands the intricacies of the markets that offer investors an edge both from a leasing and an asset management perspective. Certified AMO® 1984, IREM, CPM, CCIM, NAR, HAR, NALP, ICSC, and TREC. Notable Transactions/Clients: Armada Big Springs Ptnrs, Barbour Invts., Baytown ISD, Core Real Estate, Hoffpauir Estate, JLC Properties, KBR, Prudential, Rawson Blum & Leon, Subway, Texas Hearing Institute, Triple Crown Invts., US Oncology, Vigavi Realty, Walgreens.
cmi brokerage
ROOFING COMPANIES
HIGHUP ROOFING 6620 Isabelle Dr. Austin, TX 78752 P: 512.566.9989 Website: highuproofingllc.com Key Contact: Nasir Hussain, Owner, highuproofing94@gmail.com Services Provided: Flat Roof Coating, Roof Repair, Roof Installation, Roof Maintenance, Torch Down Roofing, Commercial Roofing, Residential Roofing.
34
OCT/NOV 2026
CONSTRUCTION COMPANIES/GENERAL CONTRACTORS ALSTON CONSTRUCTION COMPANY HOU: 1300 W. Sam Houston Pkwy S Suite 225, Houston, TX 77042 DAL: 10440 North Central Expressway Suite 720, Dallas, TX 75231 Website: alstonco.com Key Contact: HOU: Nick Dwyer, Director of Business Development, ndwyer@alstonco.com DAL: Brittany Schneider, Director of Business Development, bschneider@alstonco.com Services Provided: Alston offers a diverse background of design-build experience, general contracting and construction management of industrial, commercial, healthcare, retail, and municipal projects. Company Profile: Alston Construction’s success begins and ends with our approach to planning, scheduling, and choosing the right team. We have been adhering to an open and collaborative approach since our founding more than 35 years ago. Notable/Recent Projects: Innovation Ridge Logistics Park, a 1.1 million SF 3 building industrial business park in Forney; 610 Business District, a 388,795 SF industrial park located in Houston; 1.2 million SF logistics facility located in Conroe. SUMMIT DESIGN + BUILD, LLC 98 San Jacinto Blvd, 4th Floor Austin, TX 78701 P: 512.872.6698 Website: summitdb.com Key Contacts: Adam Miller, President, amiller@summitdb.com; Doug Hayes, Project Executive, dhayes@summitdb.com; Amber Autumn, Business Development, aautumn@summitdb.com Services Provided: Summit Design + Build, LLC is a provider of full service general contracting, construction management and design/ build construction services for the commercial, industrial, multifamily residential, office/tenant interiors, hospitality and institutional markets. Company Profile: Located in downtown Austin and with offices in Tampa, FL, Chicago, IL and North Carolina, Summit Design + Build has been involved in the design and construction of over 400 buildings and spaces totaling more than 10 million square feet over the firm’s 18 year history. Notable/Recently Completed Projects: Montage – 2323 S. Lamar (Multifamily), Congress Lofts at St. Elmo (Multifamily), UpCampus Student Housing Tallahassee (Multifamily), WeWork (Office TI), Eli’s Cheesecake (Industrial), Lockheed Martin (Industrial), Stadium Lofts North Carolina (Multifamily).
HEALTHCARE MOB
PUREFYT COMMUNITY CARE 14205 N MoPac Expy, Suite 570 PMB #565290 Austin, TX 78728 P: 512.775.3704 Website: purefytcc.com Key Contact: Ge'O-Vanna Smith, Owner, mobileivtherapyaustin@gmail.com Services Provided: Mobile Medical Services; emergency medical services; medical service company; emergency medical services; family health medical services; behavioral health services; behavioral mental health; behavioral healthcare services; behavior health services; behavior health service; advanced behavioral health services; mobile iv therapy; mobile iv therapy near me; mobile iv therapy austin; community medical services.
For advertising opportunities in this section, please contact Susan Mickey at smickey@rejournals.com or 773.575.9030