Firstapproachestotheexplorationandstudyofmicrometeorites inChile:Understandingtheflowofextraterrestrial material throughthegeologicalrecord,Letelier,J.,etal.
Yordanka Apostolovski and SPT-SMG collaboration yordanka.apostolovski@gmail.com
We present the search and study of Lyα emission toward the dense, and massive the protocluster SPT2349-56 at z=4 301, using the Multi-Unit Spectroscopic Explorer (MUSE) on the Very Large Telescope (VLT). We identify seven Lyα emitting galaxies in this protocluster environment We measure the individual properties of all Lyα emitting galaxies based on their Lyα line profiles, the CO and [CII] line observations and optical/near-IR imaging We additionally detect an extended Lyα emission towards the east of the protocluster core.
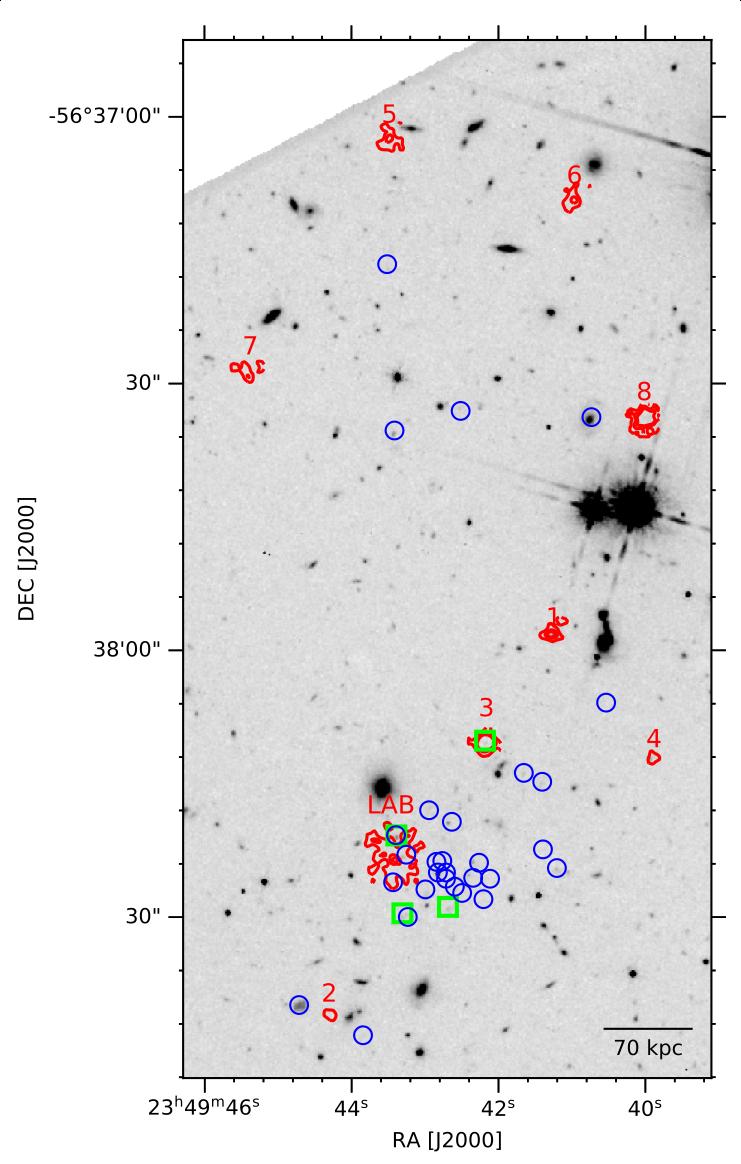
Through a blind line search we find 8 Lyα emitters (LAE) outside the effective radius of 90 kpc. Additionally, with a narrow band selection, at ∼70 kpc “Lyα blob” (LAB) was discovered east of the center of the protocluster All LAEs are redshifted relative to SPT2349-56.
Fig. 1 Left: Lyα emission towards the SPT2349-56 protocluster system The HST F160W image is shown in the background in greyscale, with red contours representing a rendered Lyα image, obtained as the average of each individual line map from the detected LAEs and the LAB, in steps of 2, 5 and 7σ The blue circles highlight the location of the ALMA [CII] and CO(4-3) line detections in the field (Hill et al 2020; Miller et al 2018) Green squares shows LBGs detected in Rotermund 2020 Right: Continuum subtracted spectra of Lyα emission line success identified with MUSE around SPT2359-56 Red dotted line shows the center of the protocluster (λ= 6444 2 Å)
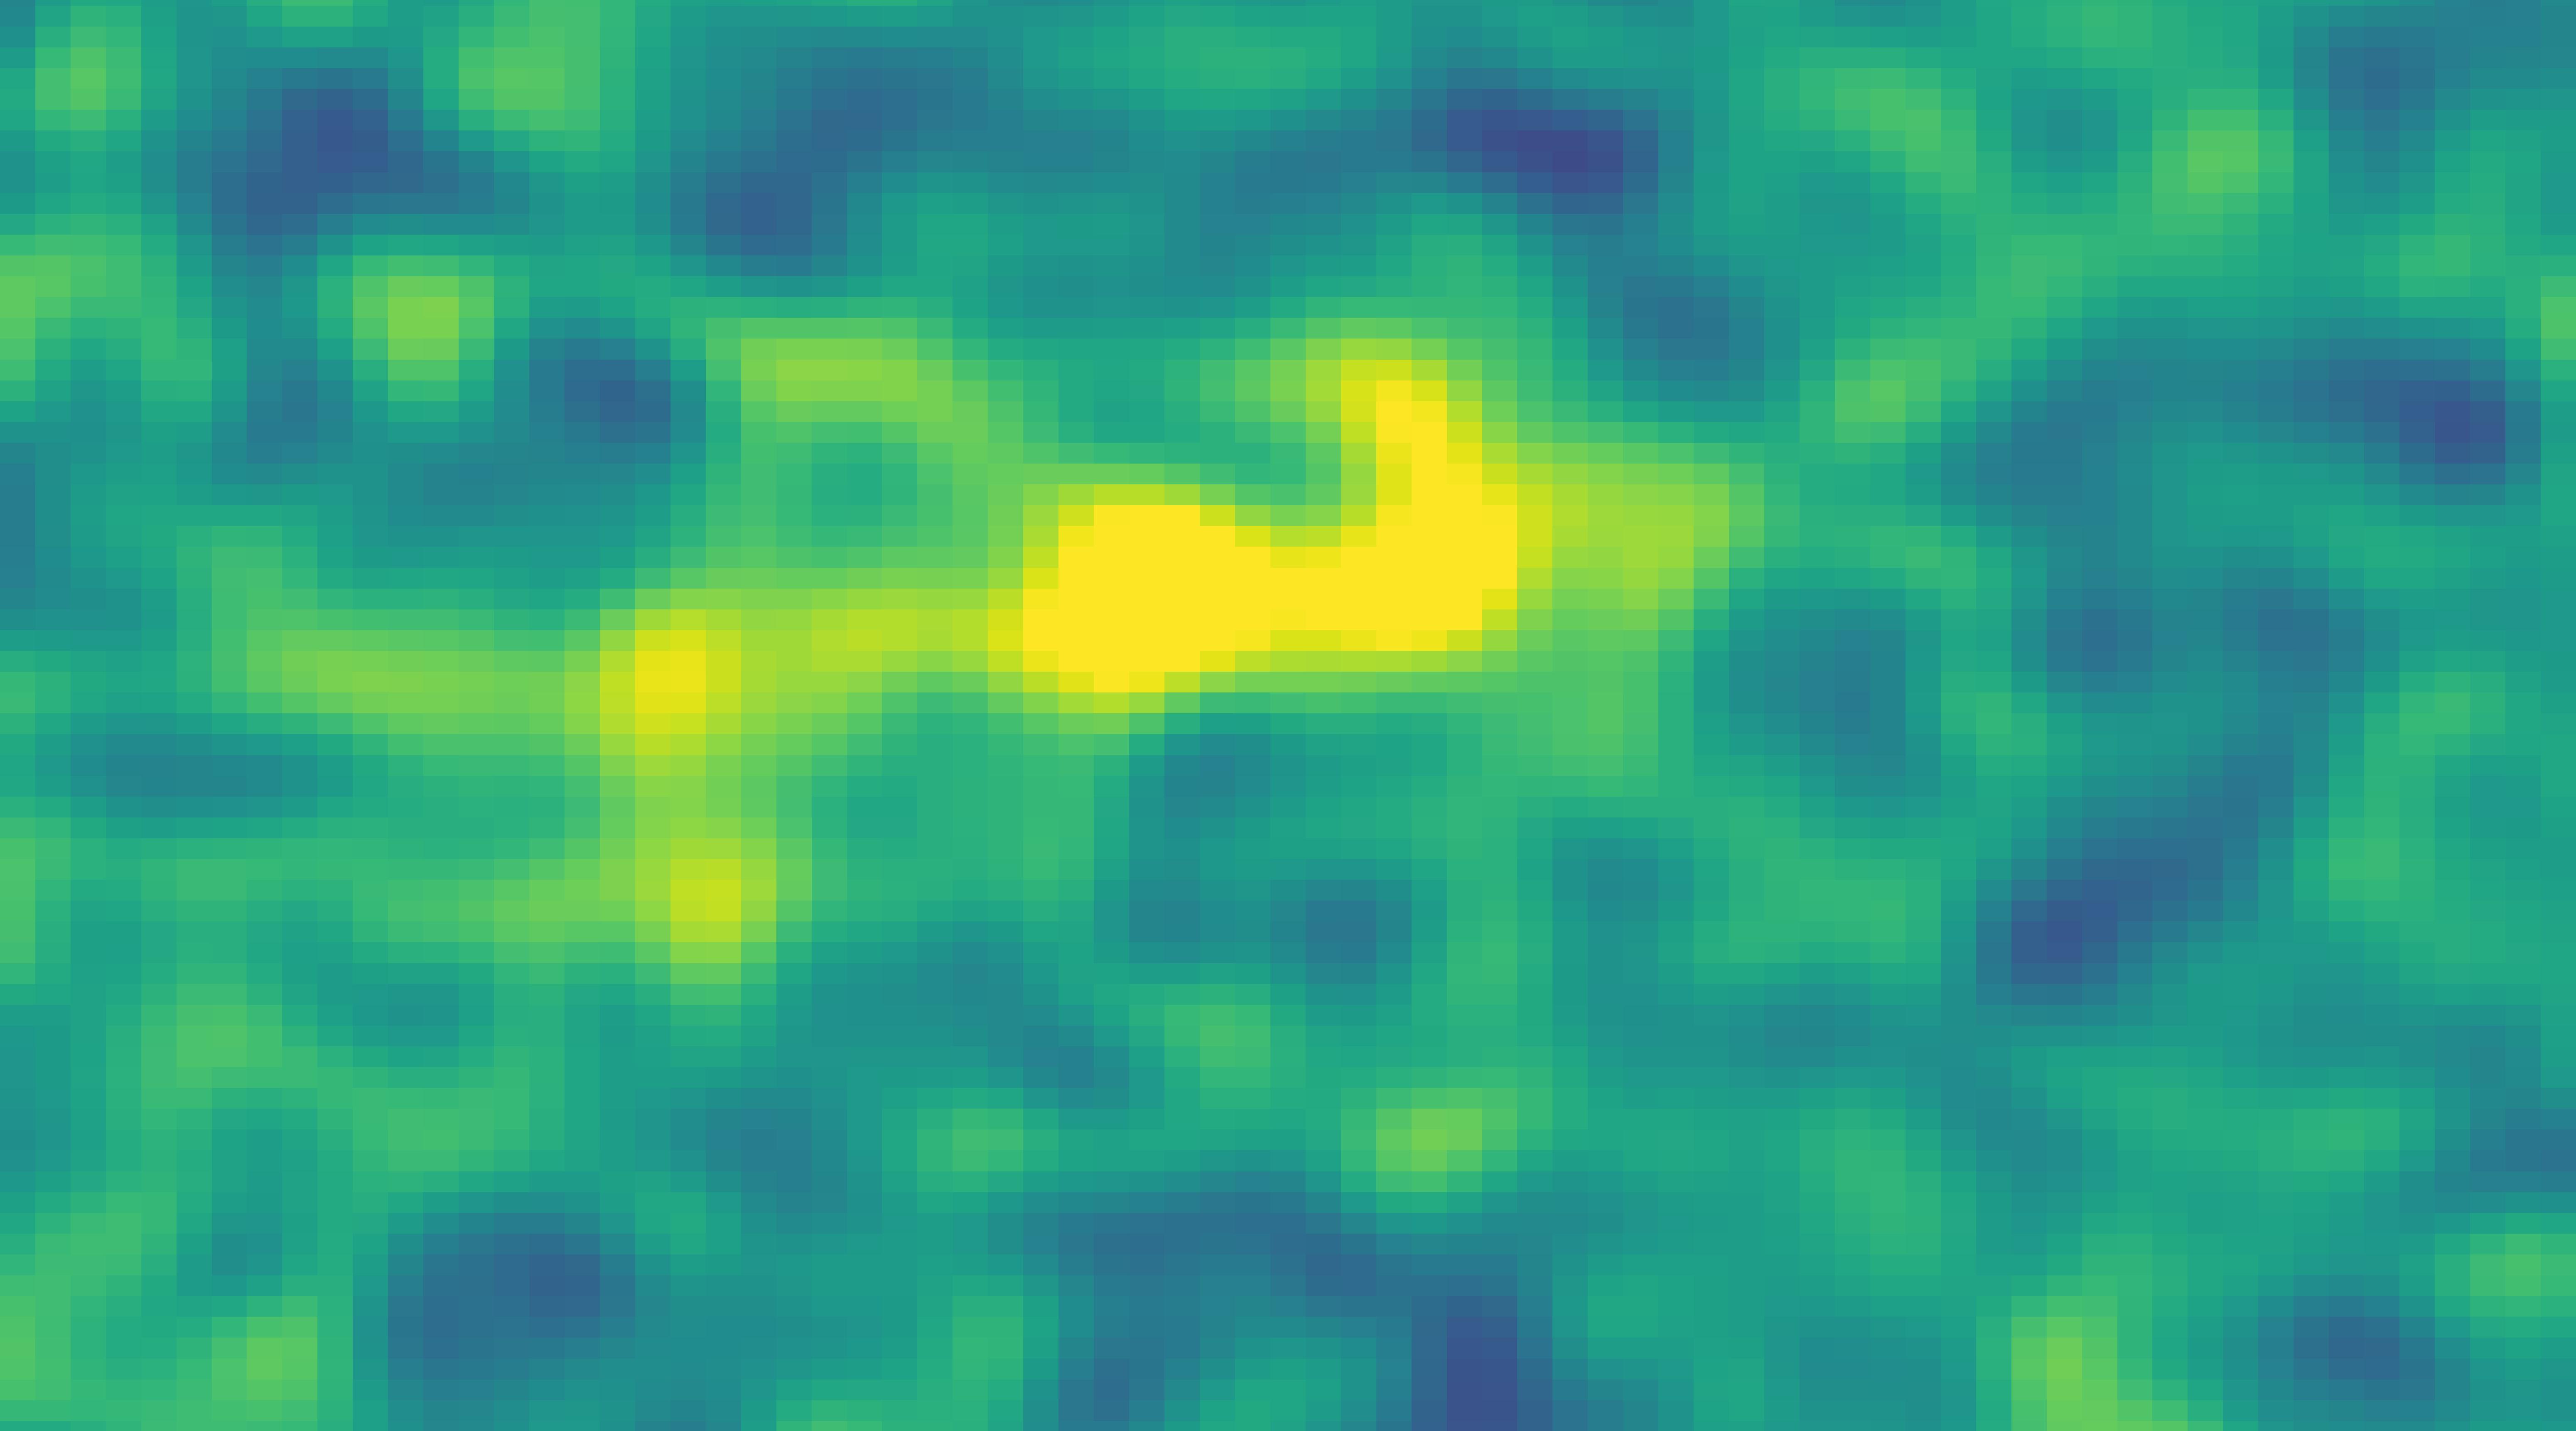
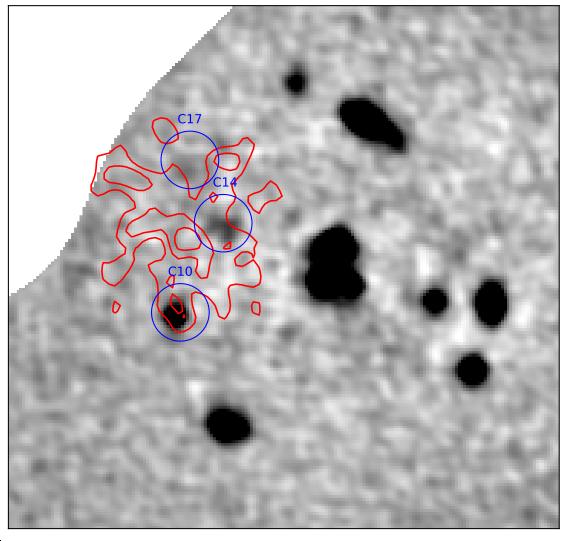
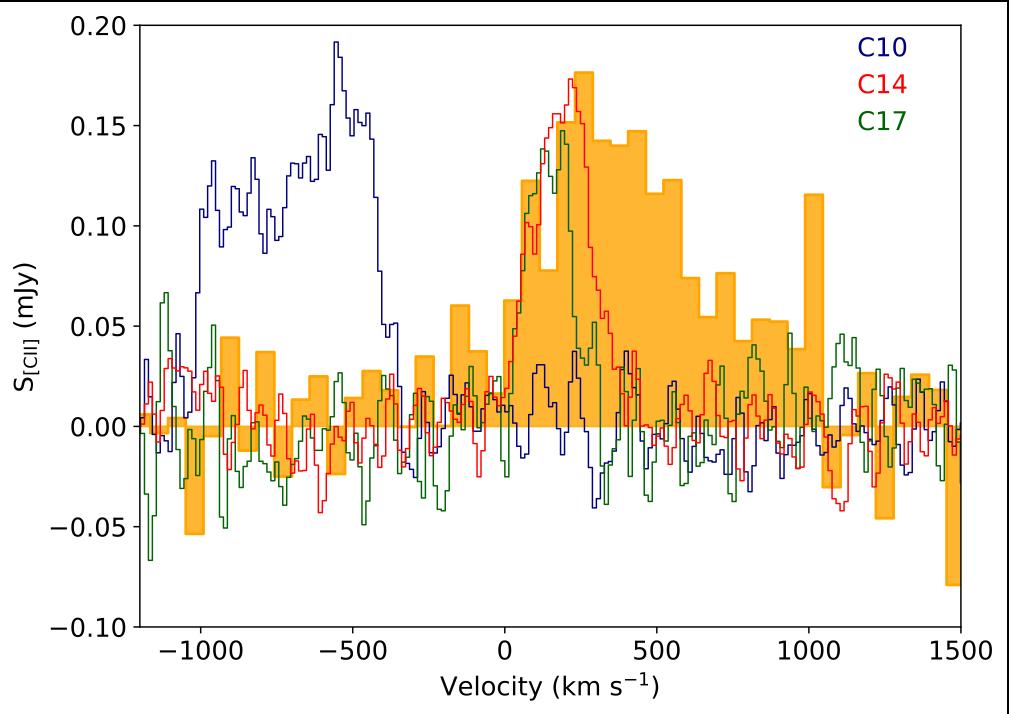
Fig. 2: Upper left: PV diagram towards the Lyα Blob, extracted from MUSE cube at 0 degrees of inclination towards the east. Blue, red and green “X”s show the observed [CII] emissions (C10, C14 and C17) from Hill et al., 2020. Upper Right: [CII] obtained with ALMA Red contours shows the LAB in steps of 2, 4 and 6σ Blue circles shows C10, C14 and C17 Botom: Observed [CII] line profiles obtained with ALMA (C10, C14 and C17) (see, Hill et al., 2020) overlapped spatially with the Lyα Blob obtained with MUSE, scaled in orange The velocity scale refers to z= 4 3 for all emission lines
The Lyα blob is located at∼56 kpc to the east of the protocluster core The bulk of the LAB emission is also redshifted with respect to the core of the protocluster, in agreement with a red-skewed asymmetric profile Two of the spatially overlapping DSFGs, C14 and C17, are found to also coincide in the velocity axis, when comparing their [CII] emission lines with that of the Lyα emission from the LAB, suggesting a velocity and spatial connection. Such nature could be explained by the high star formation activity seen in starbursting DSFGs protocluster members, where Lyα photons get scattered from the core. In this case, the photons find a region to escape in the east This result is in agreement with model shows in Cen & Zheng (2013) The bulk of the protocluster emission comes from the DSFGs. The shortage of LAEs and LBGs inside the structure shows that this PC is heavily obscured by dust
The dust patch silhouetted against NGC 3269
L. K. Haikala (1), R. Salinas (2), T. Richtler (3), M. Gómez (4), G. F. Gahm (5), and K. Mattila (6)
1 Instituto de Astronomía y Ciencias Planetarias de Atacama: 2 Gemini Observatory; 3 Departamento de Astronomía, Universidad de Concepción; 4 Departamento de Ciencias Físicas, Universidad Andres Bello; 5, AlbaNova University Centre, Stockholm, Sweden; 6, Department of Physics, University of Helsinki, Finland
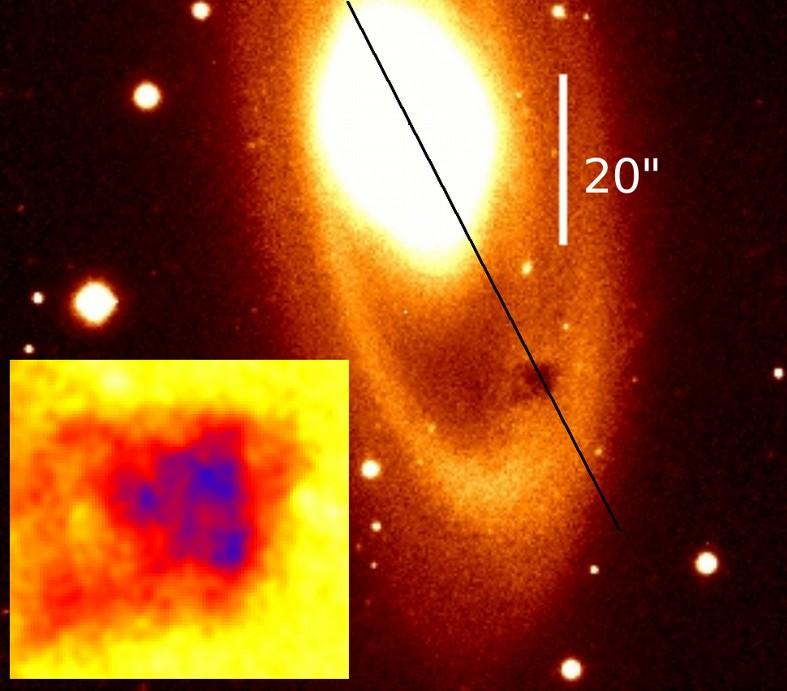
[1],[2] noted a 4” dust patch (hereafter referred as the patch) seen silhouetted against the SO galaxy NGC 3269 located in the Antlia Cluster (Fig.1). The distance of the patch is not known and it could be a tiny Galactic cloudlet or an extragalactic giant molecular cloud complex. ALMA and APEX spectroscopy was used to measure the velocity of the patch and resolve the distance uncertainty. Gemini GMOS long-slit spectroscopy was used to measure the NGC 3269 disk radial velocity curve.
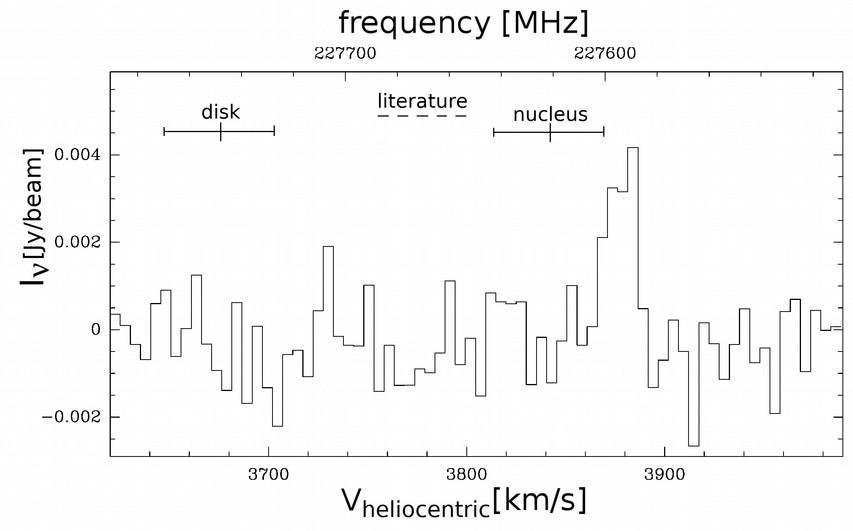
No line was detected in the APEX spectra and the patch was re-observed with ALMA. The ALMA images were smoothed to a 2.2” by 2.12” beam to improve the noise level. A weak 16.0±2.3 km/s broad 3.8±0.5 mJy (19±2.5 mK in TMB scale) line was detected in the direction of the patch at a heliocentric velocity of 3878 km/s (Fig. 2).
Fig. 1: Detail of the Magellan telescope IMACS Sloan r-band image of NGC 3269. The line indicates the orientation of the GMOS long-slit through the nucleus and the patch. The inset shows a smoothed contrast enhanced Magellan Clay MagIC B band image of the patch.
Fig. 2: Twice Hanning smoothed ALMA 12CO (2-1) spectrum in a 2” beam towards the patch. The heliocentric radial velocities of the NGC3269 disk in the direction of the patch, the NGC 3269 nucleus as measured from the GMOS spectrum and the velocity range of the NGC 3269 literature values are shown.
The article is available at http://arxiv.org/abs/2011.06988
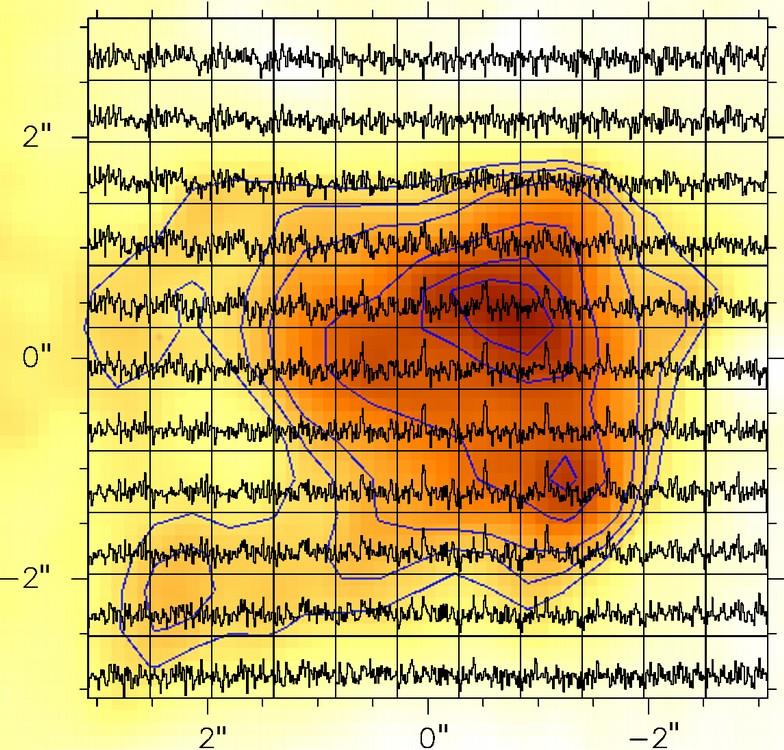
Fig. 3: Smoothed Magellan telescope IMACS r-band image of the patch. The contours at arbitrary levels delineate the drop in the patch optical surface brightness. Overlaid are twice-Hanning smoothed ALMA CO (2-1) spectra in a 2” Gaussian beam in the direction of the patch.
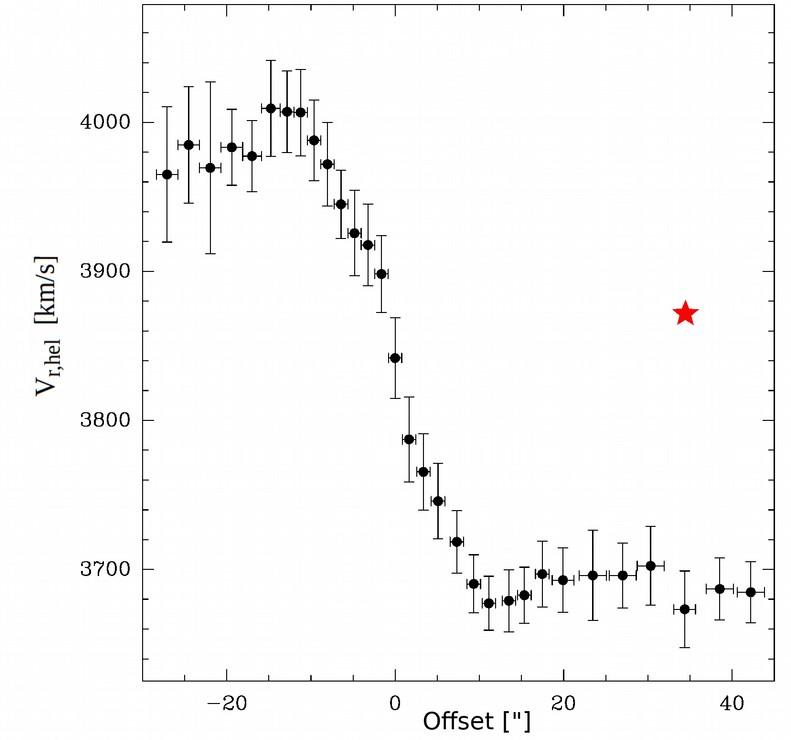
Fig. 4: The NGC 3269 heliocentric radial velocities as measured from the GMOS longslit spectrum. The x-axis is the distance in arc seconds along the slit from the galaxy nucleus. The patch is at offset 34”. The CO velocity of the patch is shown with a red star.
The estimated maximum B band attenuation AB from the GMOS spectrum of the patch is 0.8±0.05 magnitudes and the dust mass estimated from this is 2.6 × 10 ∼2.6 × 10 4 (d/50.7 Mpc)2 Msun where d is the true distance to NGC 3269. The mass of the patch as estimated from the CO (2–1) line is 1.4 × 10⁶ (d/50.7 Mpc)2 Msun . The molecular mass to dust mass ratio is thus 55. At the NGC 3269 Hubble distance of 50.7 Mpc the 4” linear size of the patch corresponds to 1 kpc. It is thus a giant molecular cloud complex ∼2.6 × 10 .
Dust in early-type galaxies is frequent, but an isolated large dust patch in a galaxy without young stellar population is very rare, if not unique in the literature. NGC 3269 is a transition object between a grand design spiral and an SO, so isolated dust is suggestive of being related to the quenching of star formation. In that way, one could understand the dust in NGC 3269 as a debris of the former gas/dust component of its disk. A viable mechanism of removing gas from galaxies is ram-pressure stripping by a passage through a hot ambient medium. The obvious candidate for this process is the extended hot halo of NGC 3268, whose projected distance is only 60 kpc. This would however require that NGC 3269 is in the foreground of NGC 3268. The NGC 3269 Hubble distance however puts it far in the background. Robust distances are needed to solve this problem
References: [1] Dirsch, B., Richtler, T., & Bassino, L. P. 2003, A&A, 408, 929; [2] Dirsch, B., Richtler, T., & Gómez, M. 2005, AJ, 130, 1141
Stellar Population of the Early-type Host galaxies of Type Ia Supernova
Yijung Kang1,2,*, Young-Wook Lee2, Young-Lo Kim3 , Chul Chung2, and Chang H. Ree4
1Gemini Observatory/NSFs NOIRLab, Casilla 603, La Serena, Chile; 2 Dept. of Astronomy & CGER, Yonsei University, Seoul, South Korea 3Université de Lyon, Université de Claude Bernard Lyon 1, CNRS/IN2P3, IP2I Lyon, France 4Korea
Astronomy and Space Science Institute, Daejeon, South Korea
*E-mail: yijung.kang@noirlab.edu
Motivation
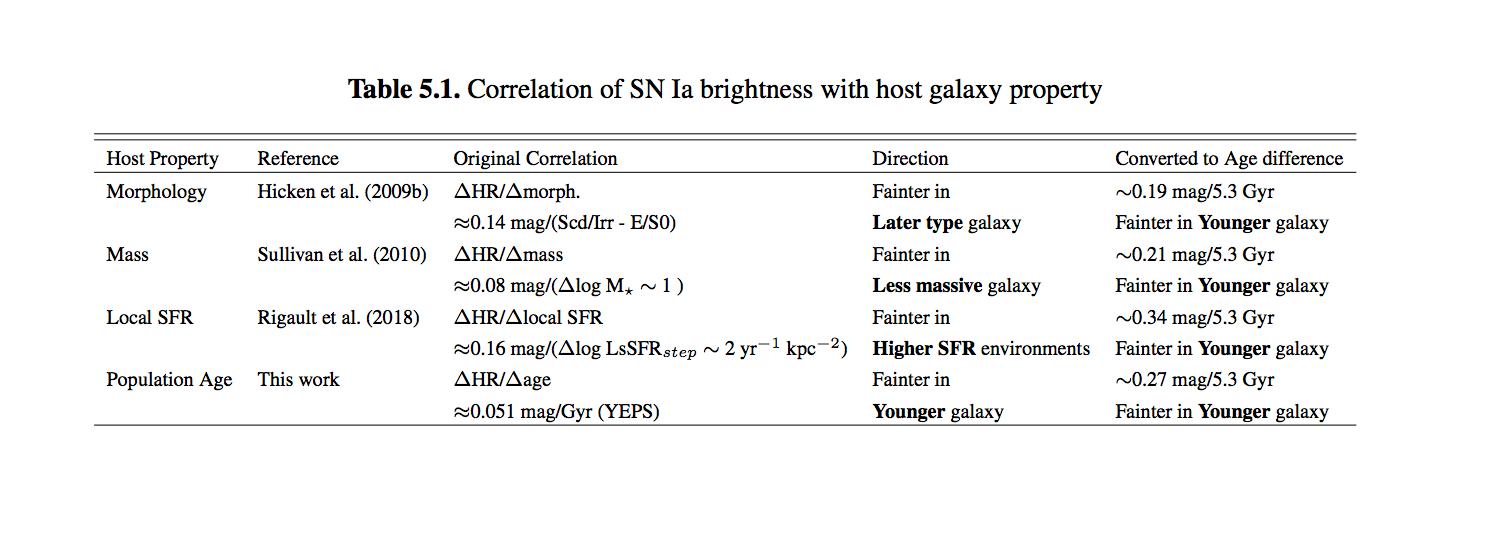
§ Type Ia supernova (SN Ia) cosmology provides the most direct evidence for the presence of dark energy, based on the assumption that the lookback time evolution of SN luminosity would be negligible.
§ Recent studies showed, however, the standardized brightness of SN Ia is correlated with the properties of host galaxies (morphology, mass, and star formation rate).
§ In order to investigate the origin of this dependency more, we have achieved a spectroscopic survey for early-type host galaxies for obtaining more reliable stellar population age and metallicity. Removal of Weak Emission Lines & Lick/IDS index Measurement Long-slit spectroscopy Age & [M/H]
Observations & Data Analyses
For more details, see also Kang, Y., Lee, Y.-W., Kim, Y.-L., et al. 2020, ApJ, 889, 8.
Correlation of stellar population age with SN Ia brightness
§ The regression fits & posterior distributions were derived from MCMC analysis.
§ See also Figure 12 & 13 of Kang et al. (2020).
Correlation of SN Brightness with Host Properties
Prediction of Possible Luminosity evolution of SN Ia
§ This result shows that the luminosity evolution could mimic a significant fraction of the Hubble residual used in the discovery and inference of the dark energy (see also Figure 16 of Kang et al. 2020).
Influence of interactions on properties of central galaxies and satellites in SDSS
Valeria Mesa
(1)
, Sol Alonso (2), Georgina Coldwell (2) D.G. Lambas (3) & Jose
Luis Nilo Castellón (1)
1: Departamento de Astronomía, Universidad de La Serena, Chile
2: Departamento de Geofísica y Astronomía, CONICET, FCEFyN, UNSJ, Argentina
3: Instituto de Astronomía Teórica y Experimental, CONICET-UNC, Argentina
In this work, a sample of galaxy systems is presented, consisting of a central object and two satellites,obtained from the Sloan Digital Sky Survey (SDSS-DR14). The sample was obtained by adopting criteria of projected distance (rp<150h−1kpc) and radial velocity difference (∆V<500 km s−1) restricting objects of at least 1.5 magnitudes weaker than their central galaxy. In addition, an isolation criterion was used to avoid belonging to larger structures,considering that within a radius of 500h−1kpc and ∆V<1000 km s−1 there is no other bright galaxy.The interaction between the members of each system was also classified through visual inspection. We have considered samples of satellites and central galaxies separately, and each of these samples is compared with suitable control samples to analyze the results. The objective of this study consists in the analysis of the different scenarios in which these systems are found and their influence on the properties of the galaxies that compose them.
The Sample
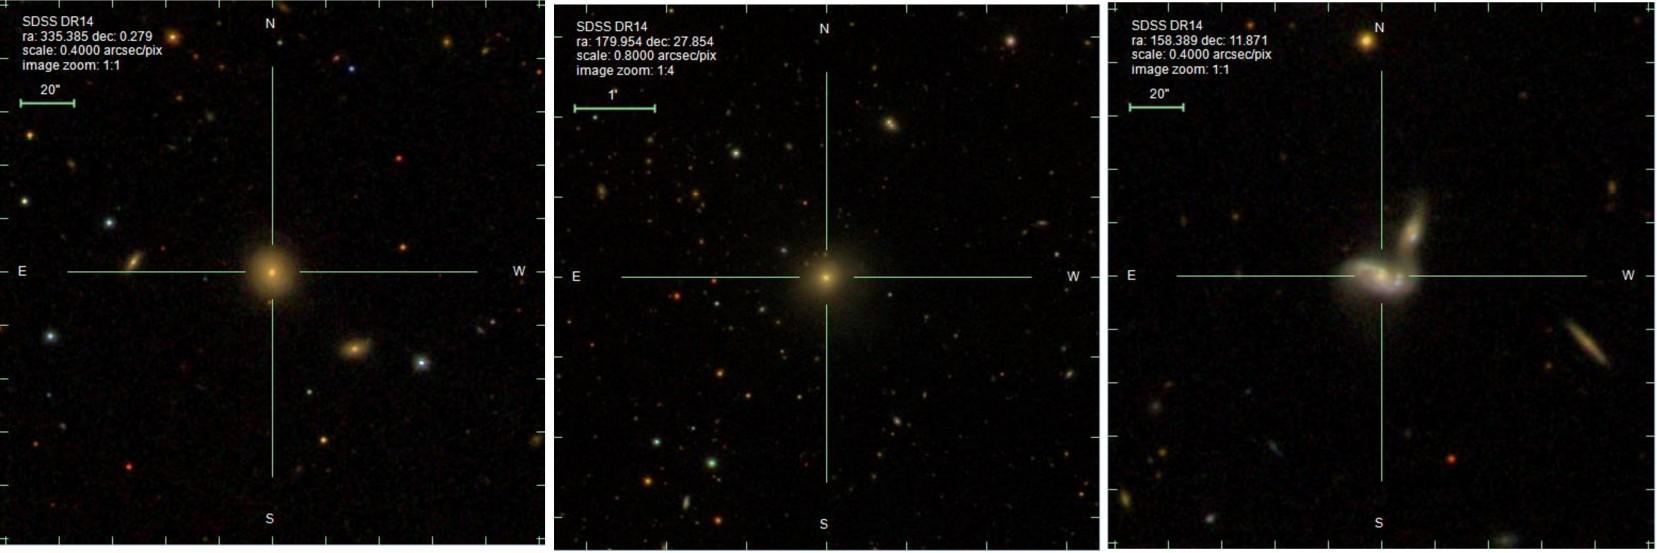
Our sample was created based on a combination of photometric and dynamical criteria, from data of Sloan Digital Sky Survey (Abolfathi et al., 2018, SDSS-DR14) Galaxies brighter than Mr=-20.5 mag. were selected as central galaxies and objects that lies inside rp<150h−1kpc and ∆V<500 km s−1, restricted to a difference of 1.5 magnitudes fainter regarding to the central galaxy, were classified as satellites of the main object.
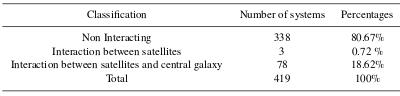
At this stage, we only selected those systems with two satellites. For instance, an adequate isolation criteria was taken into account considering that within a radius of 500h−1kpc and ∆V<1000 km s−1 there should not be a brighter galaxy than one magnitude fainter than the central galaxy. The systems were classified according to three categories: (i) the main object with two satellites without apparent interactions (left panel), (ii) mutual interaction between the satellites (middle panel),or (iii) between the main object and some of its satellites (right panel).
Analysis of properties of central galaxies and satellites
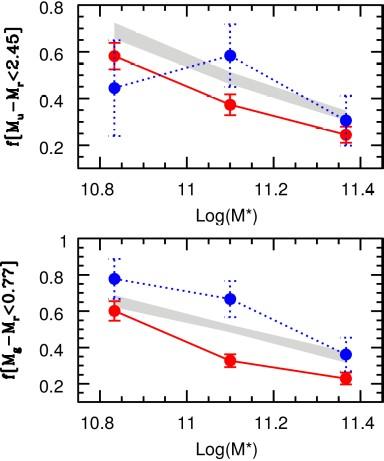
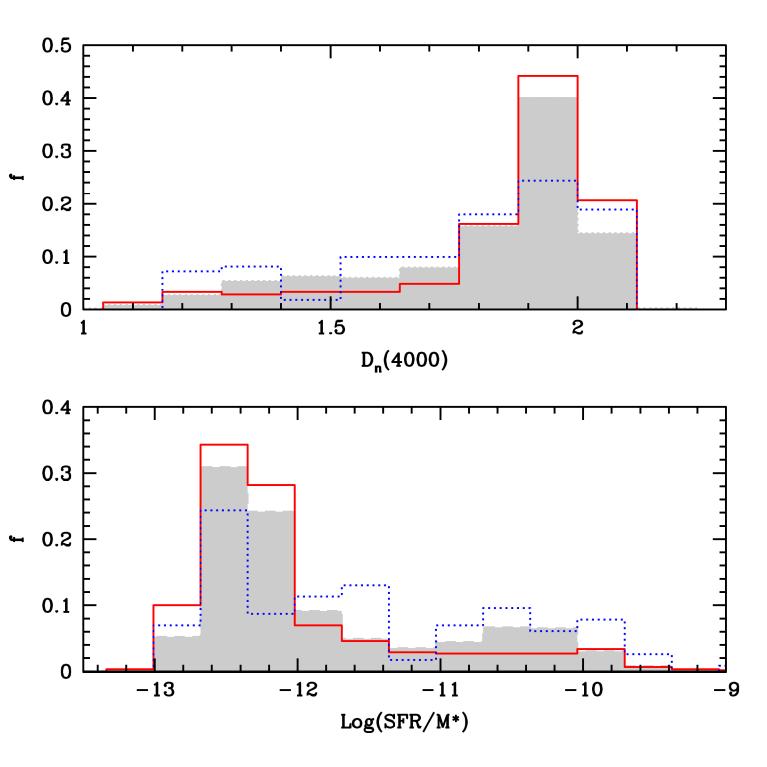
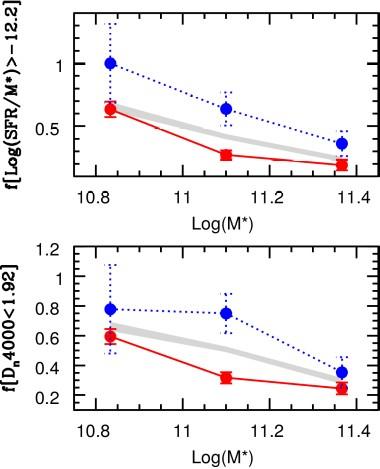
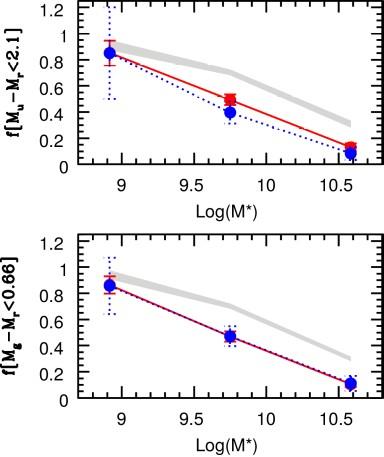
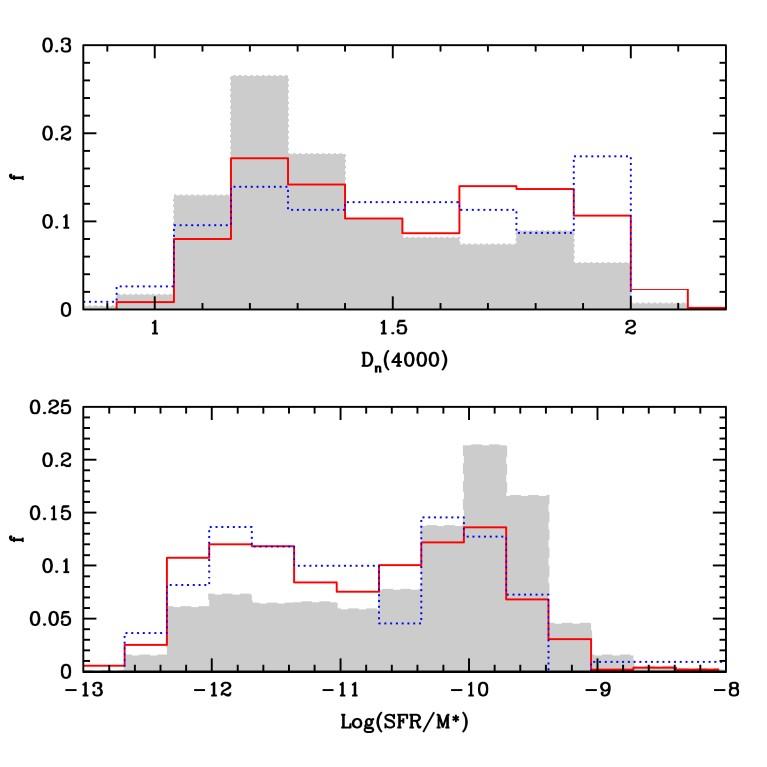
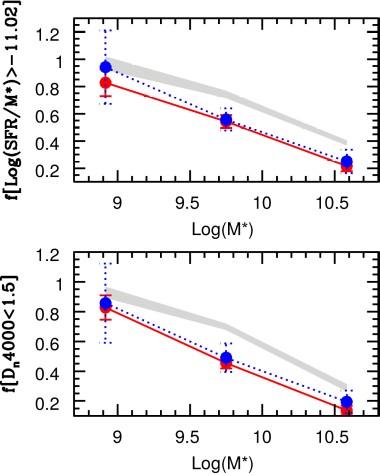
We study the normalized distributions of Log(SFR/M*) and Dn(4000). Also we computed the fraction of young and blue galaxies with stellar formation vs Log(M*) for galaxies in interaction (blue) and without interactions (red) of our sample,compared with a control sample (grey).
Central galaxies
Satellites
Conclusions
● After the visual classification, it was found that around 80% of the systems do not show evident interactions, and that the remaining 20% does, and this mutual interaction may be between satellites or any of them with their central galaxy.
● An analysis of the star formation and stellar populations of central galaxies showed that the systems that present interactions differ from the rest, with signs of recent stellar formation and bluer younger populations. Systems without interactions behave similarly to the control sample. All these trends are decreasing as the galaxy’s mass increases, the greater the mass, the difference is not observed.
● The counterpart referred to satellite galaxies shows that these galaxies have a bimodal behaviour, with a part with red old stellar populations and poor star formation, and on the other hand an important fraction of young and formative objects is observed. These values correlate directly with the mass of each object, even the least massive ones that show these signs. This behaviour is independent of the type of interaction. The control sample is always showing younger populations, blue colours and greater stellar formation than the objects that are in the systems under study.
● This analysis shows that interactions between central galaxies and satellites have an aging effect in satellites, as observed compared with the control sample. This fact would suggest that they act as a gas donors to the central galaxy, in wich the signs of star formation are observed when interactions are present.
The ionized gas kinematics of local
analogues of reionization galaxies
*Dania Muñoz Vergara1, Ricardo Amorín1, Matías Rodríguez1, Verónica Firpo2, Vital Fernández1. 1Universidad de La Serena 2Gemini Observatory
* dania.munoz@userena.cl
Abstract: Blue compact dwarf galaxies showing unusually strong optical and UV emission lines constitute our best local analogues of primeval galaxies driving reionization in the early Universe. Thorough studies of their ionization properties, chemical abundances and complex gas kinematics as a function of their star formation histories and ionizing photon escape can be conducted in a level of detail impossible to achieve at high redshifts. This poster presents the first results of a larger project, aimed at studying the gas kinematics of compact star-forming dwarf galaxies, dubbed “Green Peas” at z~0.3. Using long-slit high-dispersion spectra we study the ionized gas kinematics of a strong Lyman-α emitter showing 5% Lyman Continuum (LyC) leakage from HST/COS observations.
Observations
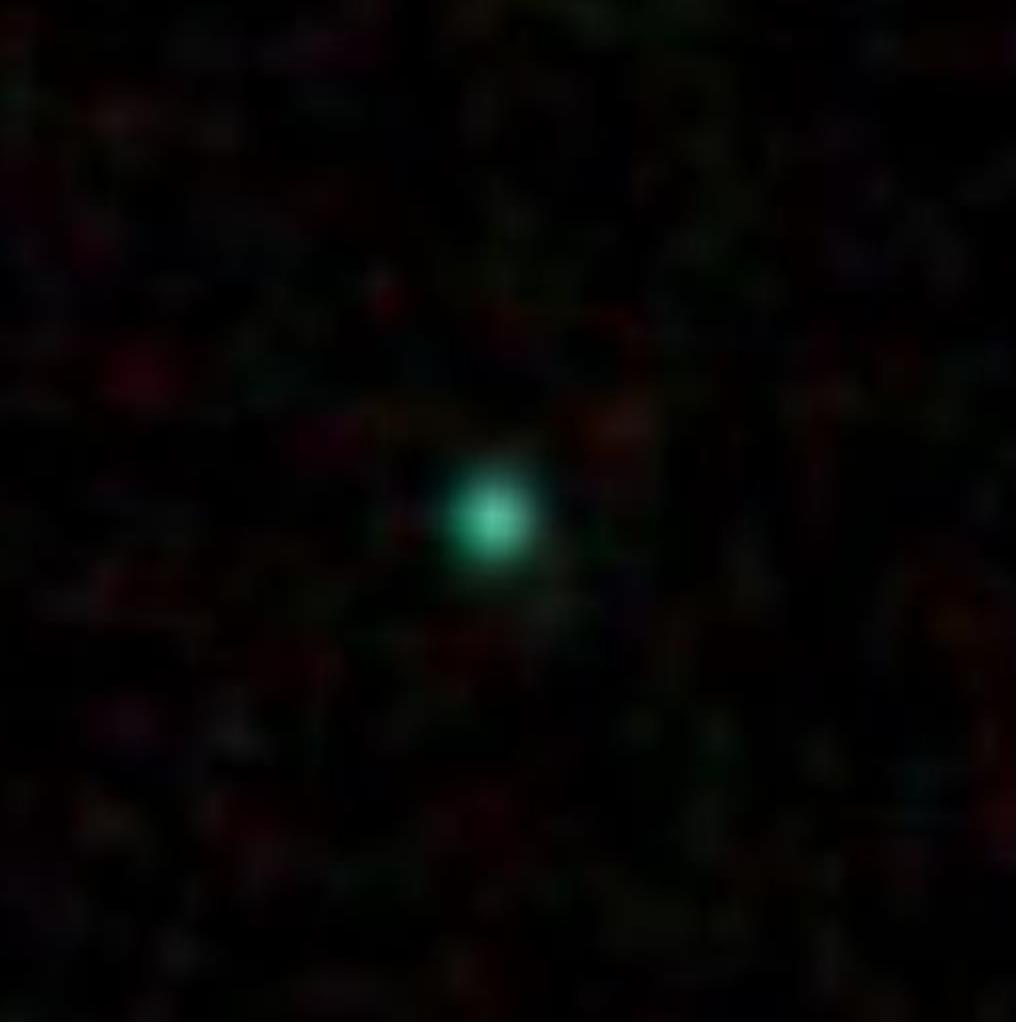
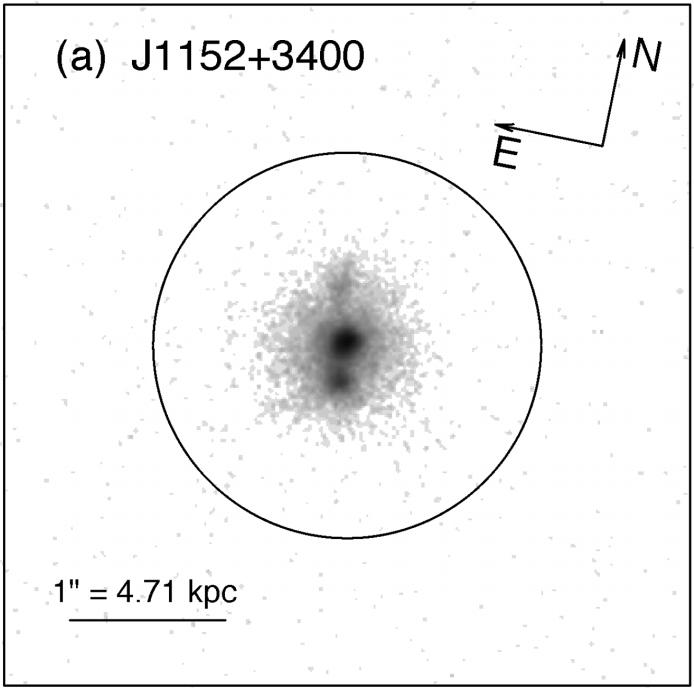
● Our initial sample consists of one green pea galaxy confirmed as a LyC leaker J1152+3400 (Fig.1), from Izotov et al. (2016).
● High-resolution (R~9000), long-slit spectra obtained with ISIS at the 4m William Herschel Telescope (WHT) at the Roque de los Muchachos Observatory, La Palma (P.I. R. Amorín).
Data Analysis
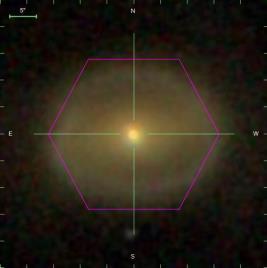
Figure 1: SDSS DR9 color cutout (left) and high resolution HST-COS NUV (2000 Å) acquisition image (right) of J1152+3400 adapted from Isotov+(2016)
● Multi-component Gaussian modeling of all optical emission-lines.
● LMFIT (Newville et al. 2014) based code developed by Muthukrishna et al.(in prep).
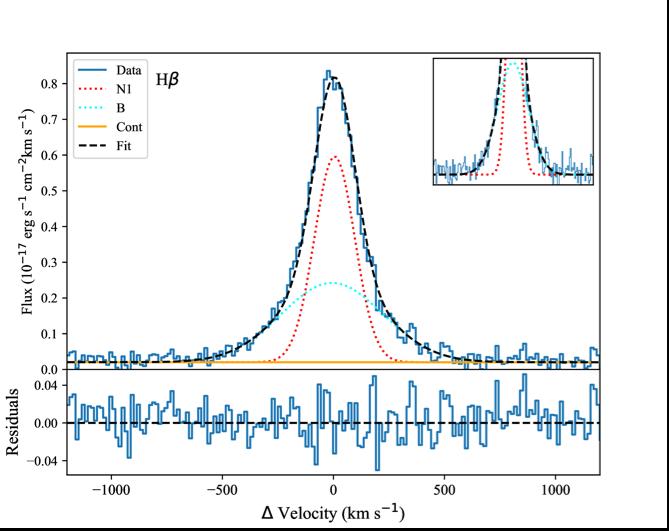
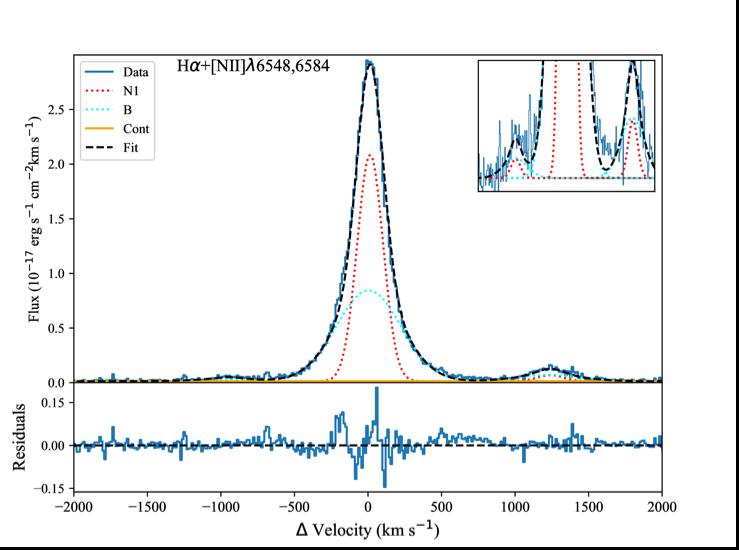
● Figure 2 shows examples of best-fit models with an inset showing details of the broad and narrow components in the fainter line wings.
Results
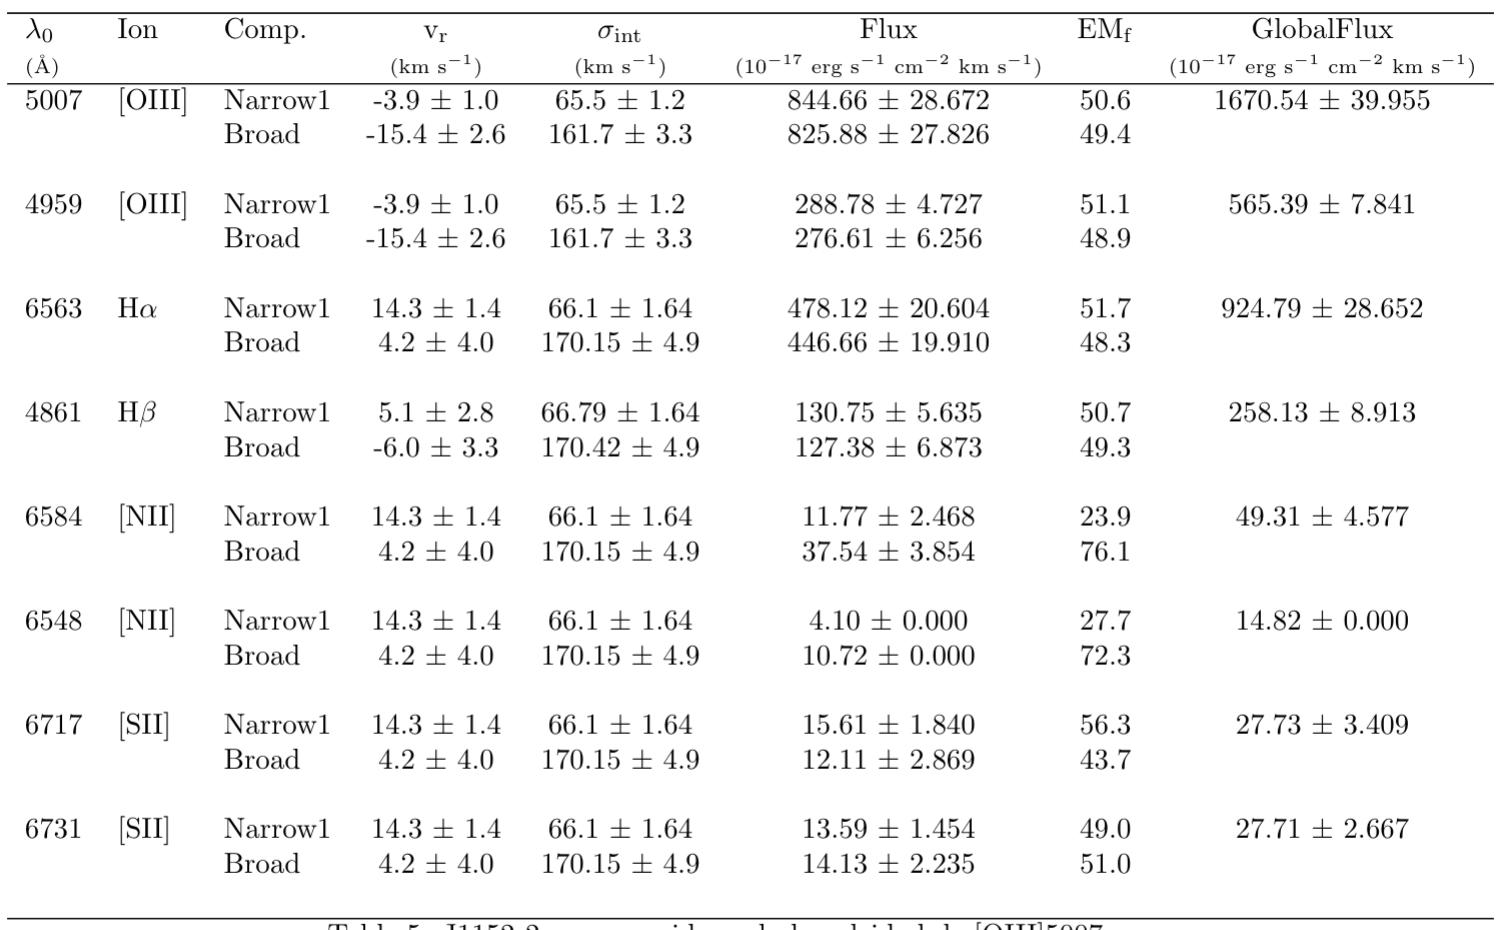
1. All emission-lines can only be modeled using at least two components with mean intrinsic velocity dispersion ~65.95 km/s and ~168.04 km/s and radial velocities near the systemic.
3. Consistent with simulations (e.g. Ma et al. 2016), outflows are suggested to clean channels in the HI halo for LyC leakage.
Ongoing Work
Figure 2 : Multicomponent Gaussian fitted to Hβ (top) and H α +[Nii] λ 6717,6731Å (bottom) of J1152+3400.
Table 1: Wavelength, emission-line, component, radial velocity, intrinsic velocity dispersion, flux and emission measure in % of each component
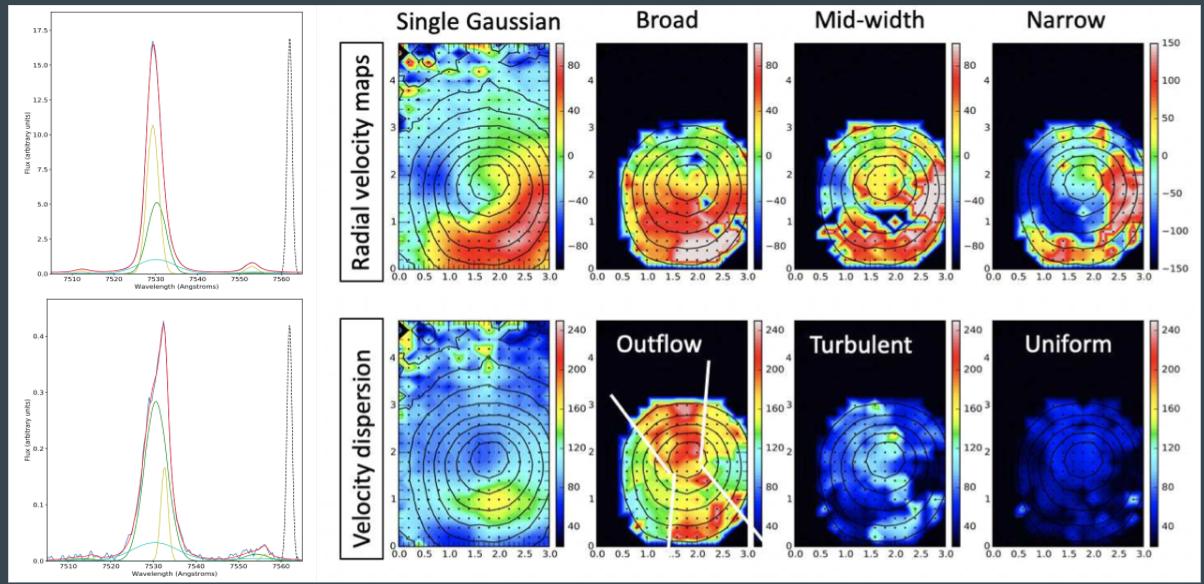
Figure 3: Gemini/GMOS data cubes for the green pea J0838 at z~0.15 by Bosch et al.(2019). Three component Hα model provides identification of turbulence and outflows. Additional data will allow us to extend these results to a larger sample of galaxies and trace the turbulence and outflows with spatial resolution.
References: Amorín, R., Rodríguez, M., Muñoz-Vergara, D., et al. in prep · Amorin, R., Vílchez, J. M., Hägele, G. F., et al. 2012, ApJ, 749, 185 · Bosch, G., Hägele, G. F., Amorín, R., et al. 2019, MNRAS, 489, 1787 · Izotov, Y., Schaerer, D., Thuan, T. X., et al. 2016, MNRAS, 461, 3683 · Ma X., Hopkins, P. F., Kasen, D. , et al. 2016, MNRAS 459, 3614· Newville M.., Stensitzki, T., Allen, D. B., et al. 2014, Zenodo
Acknowledgements: D.M. acknowledges support from the National Agency for Research and Development (ANID)/Scholarship Program/ DOCTORADO NACIONAL/ 2019-21191543 . R.A. acknowledges support from FONDECYT Regular 1202007
Dwarf Population inside the Fornax Cluster Virial radius with the Next Generation Fornax Survey (NGFS)
Yasna Ordenes-Briceño, Paul Eigenthaler, Thomas H. Puzia, Matthew Taylor +NGFS collaborators
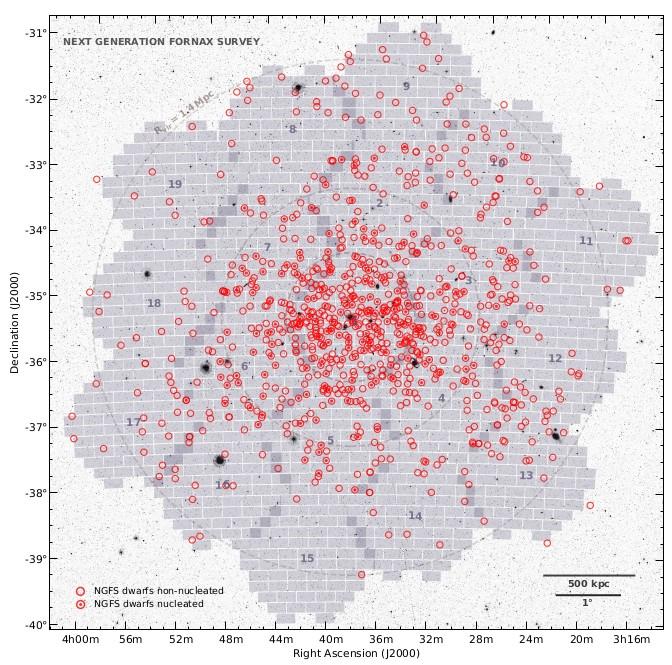
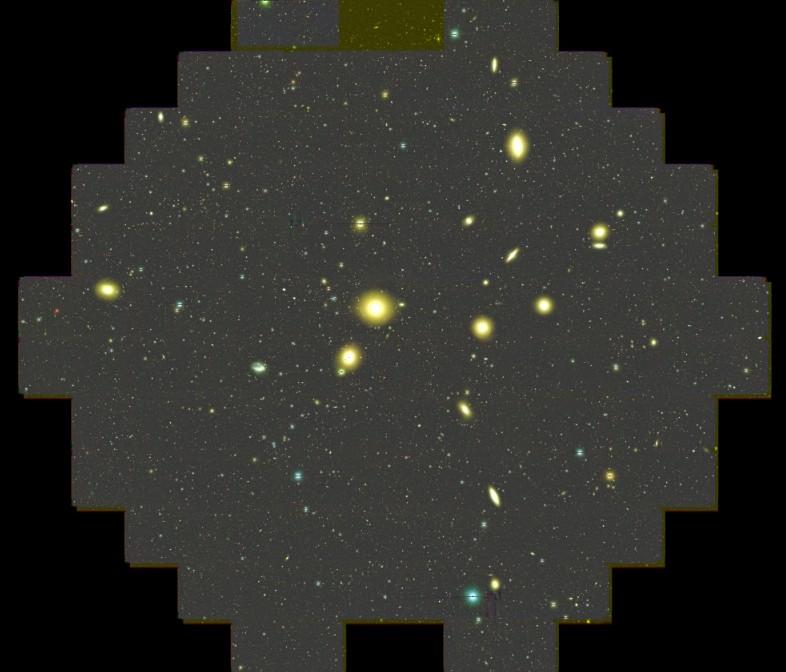
We present the discovery of more than 200 dwarfs in the Fornax cluster at radius r_vir /2 < r < r_vir (0.7-1.4 Mpc) using data from the NGFS with deep coadded u’, g’, and i’ images obtained with Blanco/DECam.
Large numbers of faint, low surface brightness dwarf galaxies are rapidly being discovered in different environments throughout the local universe thanks to the rise of large detector arrays in present-day observatories such as the Dark Energy Camera (DECam) that enables to survey large areas of the sky down to ultra low surface brightness levels, providing the exciting opportunity to search for undiscovered faint dwarf galaxies in massive clusters,galaxy groups,and in the field.
We have made use of two methods to detect low surface brightness dwarf galaxy candidates in Fornax, visual inspection and automated detection. For the detection by visual inspection, we construct RGB image stacks using the combined depth of the u’g’ i’-bands observations for each tile. To avoid any personal detection biases, we (P.E., T.H.P., Y.O.B., M.T., R.R) individually investigated the RGB images independently, yielding to five separate dwarf galaxy candidate catalogs for each tile. A galaxy is a candidate if three people detect the dwarf. We have also used our own automated detection algorithm. A final number of 229 dwarfs have been selected as candidates.
Together with previous NGFS and other catalogs in the inner region of Fornax (Eigenthaler et al.2018, Ordenes-Briceño et al.2018) the total number of dwarfs is 860.
Illustration of the spatial distribution of the Fornax dwarf galaxies in a greyscale underlying image from SDSS. The footprint of the NGFS survey inside r_vir is indicated by the grey shaded DECam tiles with tile 1 for the central region, tiles 2-7 for the inner ring region and tiles 8-19 for the outer ring region, labeled with their respective numbers. The position of non-nucleated dwarfs (dE) are shown by red open circles while the nucleated dwarfs (dEN) are marked by red circles with a central dot. Gray-dashed circles show NGC 1399-centric distances of r_vir/4, r_vir/2 and r_vir (0.35, 0.70 and 1.4 Mpc,respectively).
Only in the central region of Fornax (350kpc) there are 384 dwarf galaxies, i.e. 44% of the total Fornax dwarf population (r < r_vir).
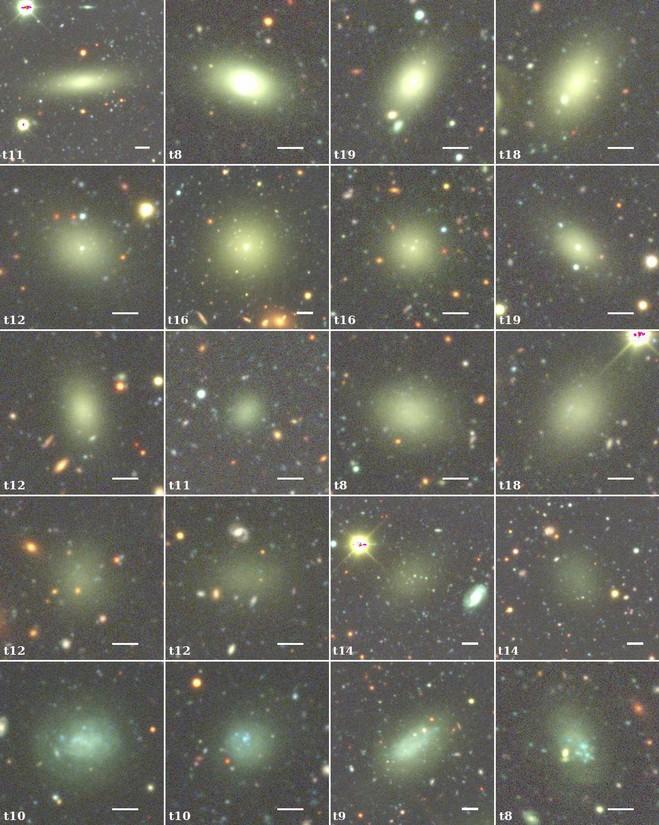
RGB stamp images for a sample of NGFS dwarfs with r>r_vir/2 (>700kpc) showing the diversity of dwarf morphological type in the Fornax cluster. Examples of dwarf ellipticals, dwarf spheroidals with and without a nuclear star cluster (NSCs), ultra faint dwarfs and dwarf irregulars/in-transition are shown from top to bottom panels. The DECam tile where the dwarf is located and a scale length of 1 kpc are shown in the bottom part. The dwarf irregular/in-transition are located only in the Northern part of the cluster (tile 8,9,10).
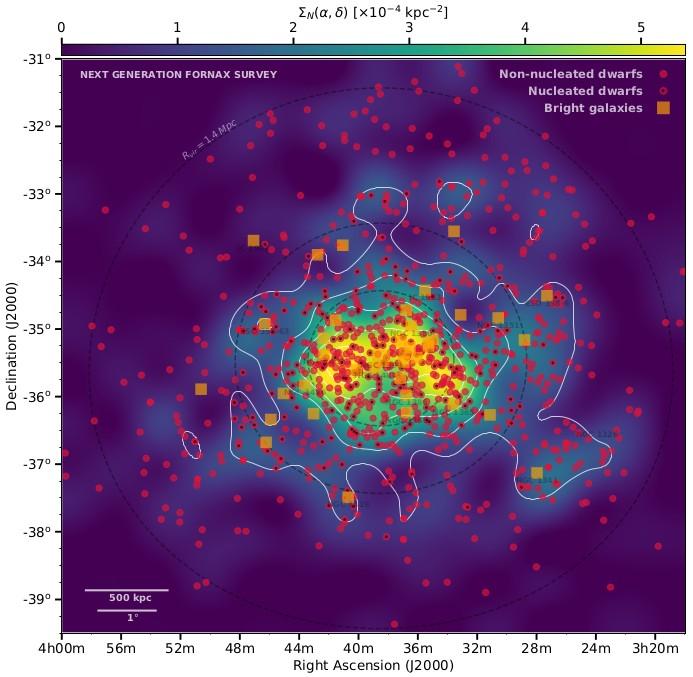
The projected dwarf galaxy surface number density profile N(, ) for the dwarf galaxy candidates in the NGFS
survey region with the color shading computed along a 15×15 bins grid and shown as the result of 2D histogram smoothed with Lanczos interpolation. The N(, ) was
also estimated by a nonparametric kernel density estimate (KDE) using a Gaussian kernel, the results are shown with curves of iso-density contours by white-scaled thin solid lines.
Non-nucleated dwarf galaxies are overplotted with red circles and nucleated dwarf galaxies are shown in red circles with a central black dot. For the outer region of Fornax (> 700 kpc), dwarfs with an NSC are still not confirmed (surface brightness fitting is needed),thus all are plotted as dE. Bright galaxies in Fornax with M_i ≤-19 mag are shown in orange squares. Black dashed circles indicate NGC 1399-centric radii of r vir/4, r_vir/2 and r_vir that correspond to 0.35, 0.70 and 1.4 Mpc at the distance of Fornax.
The largest overdensity is located in the inner 350 kpc of the cluster. However, there are other clustering of dwarfs in the outer regions, most of them to the Western side of the cluster. A clear overdensity of galaxies is seen in the surroundings of NGC 1341 in the SouthWest direction of Fornax. Eigenthaler et al.2018,ApJ,855,142 ;Ordenes-Briceño et al.2018,ApJ,859,52.
More details about the surface brightness profiles, spatial distribution and clustering of the Fornax dwarf population will be publish soon in Ordenes-Briceño et al.in prep.
Understanding the role of morphology and environment on the dynamical evolution of isolated galaxy triplets
Understanding the role of morphology and environment on the dynamical evolution of isolated galaxy triplets
P. Vásquez-Bustos1, M.Argudo-Fernandez1, D. Grajales-Medina2,3, S. Duarte Puertas4, and S. Verley5
P. Vásquez-Bustos1, M.Argudo-Fernandez1, D. Grajales-Medina2,3, S. Duarte Puertas4, and S. Verley5
Abstract Parameters
Galaxy triplets, systems composed of three physically bound galaxies, constitute the simplest group of galaxies,however the basic scenario of their formation and evolution is still unknown. Unlike close pairs or rich groups of galaxies, triplets have generally not received much attention. Until now, a triplet was naturally supposed to form through a pair of nearby galaxies that capture a remote third galaxy. However, recent studies have shown that galaxy triplets usually have similar properties and could be considered as dynamic systems that have evolved within the same dark matter halo. To better understand the formation and evolution of these systems, in this project we are developing a statistical study of the morphology, color, and dynamic properties of galaxies in 315 isolated triplets (SIT1), and how the properties relate to their local and large-scale environments.
1 Intituto de Fisica,Pontificia Universidad Catolica de Valparaiso, Chile
2 Valencia International University, Spain
2 Facultad de Ingeniería, Departamento de Ciencias Básicas, Universidad Ean, Colombia
3 Instituto de Astrofísica de Andalucía (IAA-CSIC), Spain
4 Departamento de Física Teórica y del Cosmos Universidad de Granada, Spain
5 Instituto Universitario Carlos I de Física Teórica y Computacional, Universidad de Granada, Spain
Dependence on the Environment
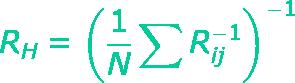
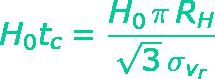
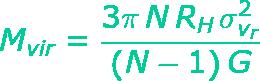
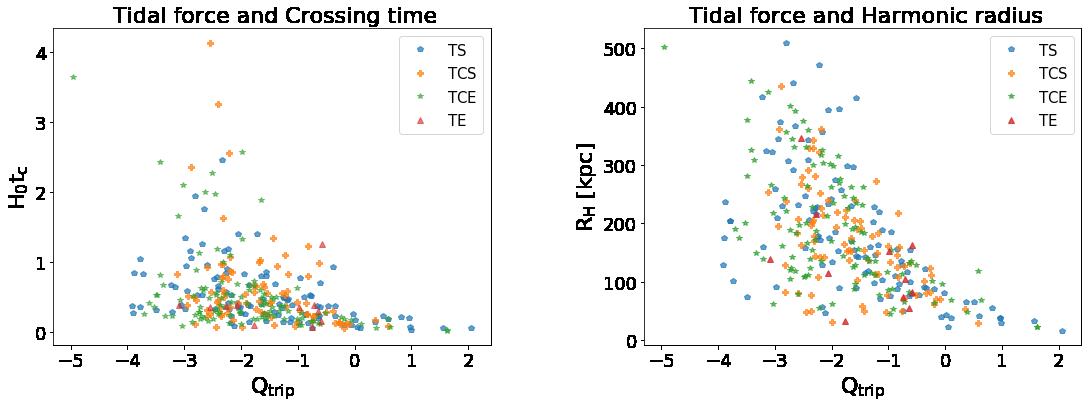
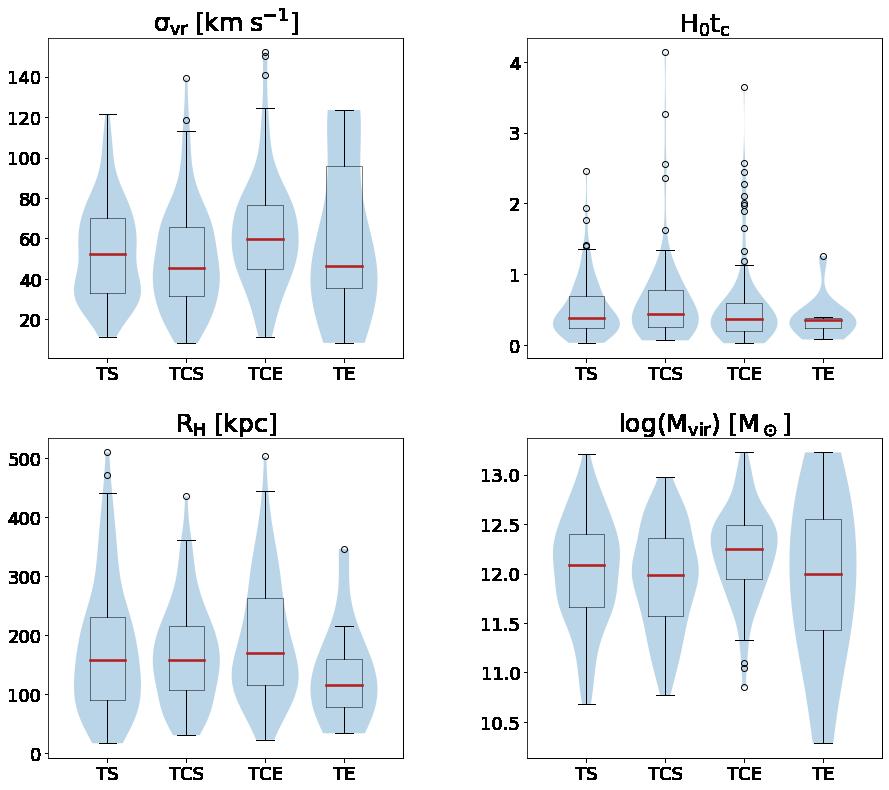
Isolated triplets with higher values of RH and H 0 t c usually have lower Qtrip, so the tidal strength by triplet galaxies is not very strong. On the other hand the triplets with stronger Qtrip show lower values of RH and H 0 t c, where their configuration is a consequence of ongoing merging, rather than due to a long-term evolution. However note that not all triplets with low RH and H 0 t c, have a high Qtrip. There are therefore several possible configurations for isolated triplets among the ones with lower RH and H 0 t c, i. e., the most compact and evolved triplets (composed by earlytype galaxies) but also mergers of late-type galaxies.
Acknowledgements
We acknowledge financial support by the DI-PUCV research projects 039.292/2019 and 039.481/2020, and FONDECYT project Nro. 11200107. References
1.- Argudo-Fernández et al. 2015 A&A,578A,110
2.- Lintott et al., 2008, MNRAS, 389,1179
3.- Lintott et al.2011,410,166
4.- Willett et al. 2013, MNRAS, 435,2835
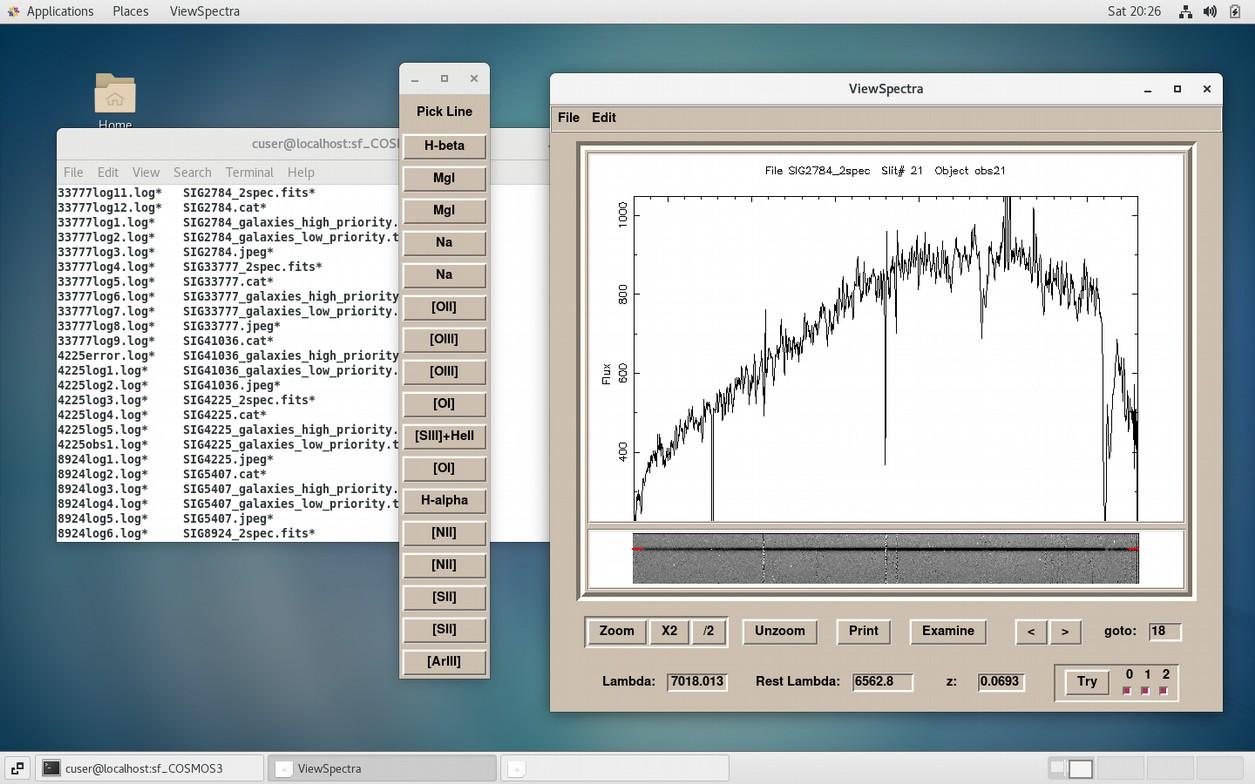
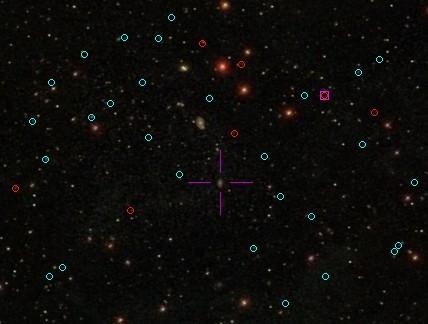
The distribution of satellites (faint companions) around isolated primary galaxies provides important information about galaxy formation, as well as a critical test of the CDM model on small scales. We have started a campaign to look for faint satellites (within the isolation definition volume, Fig. 3) around a representative sample of SIG galaxies.To obtain a first estimation of the number of faint satellites around SIG galaxies, we searched for neighbours in the SDSS with r-band model magnitudes in the range 17.7 ≤ mr ≤ 22 without spectroscopy but with a photometric redshift zp ± ∆zp similar to the spectroscopic redshift z of the SIG galaxy, i. e. zp − ∆zp ≤ z ≤ zp + ∆zp. We estimated that the number of possible companions ranges from just a few (4 to 7) to around 20. In order to confirm these neighbours as physically bound satellites, we need spectroscopic confirmation (Fig. 2).We present our findings for 5 SIG galaxies (selected according to their large-scale environment,see Fig. 1) using multi-slit spectroscopy.
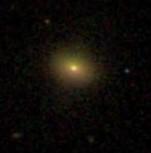
Figure 1: SDSS colourimage ofthe 5SIG galaxiesconsidered in this study.
The observations were made with the IMACS instrument in the Magellan Baade telescope at Las Campanas Observatory, in Chile, and were reduced using the COSMOS3,4 reduction pipeline.
We present the analysis of the observations that are helping us to confirm if these faint galaxies are physically bound satellites or if, on the contrary, the SIG represents the most nurture free sample of isolated galaxies in the local universe.
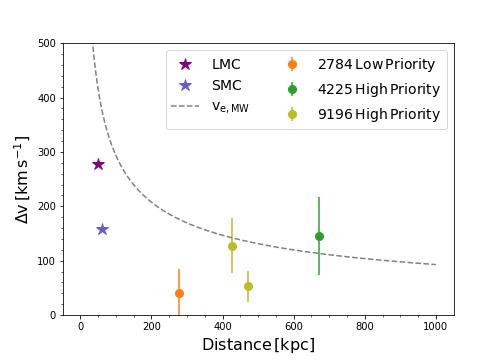
Our findings are represented in the following figure (note the comparison with the LMC and SMC and a Milky Way similar mass galaxy escape velocity curve):
Figure 2: Observed spectra for one of the detected satellites from the ViewSpectra tool provided in the COSMOS3,4 pipeline.
Acknowledgments:
We acknowledge financial support by the DI-PUCV projects 039.292/2019 and 039.481/2020. We also acknowledge CNTAC programs CN2016B-97 and CN2017B-95.
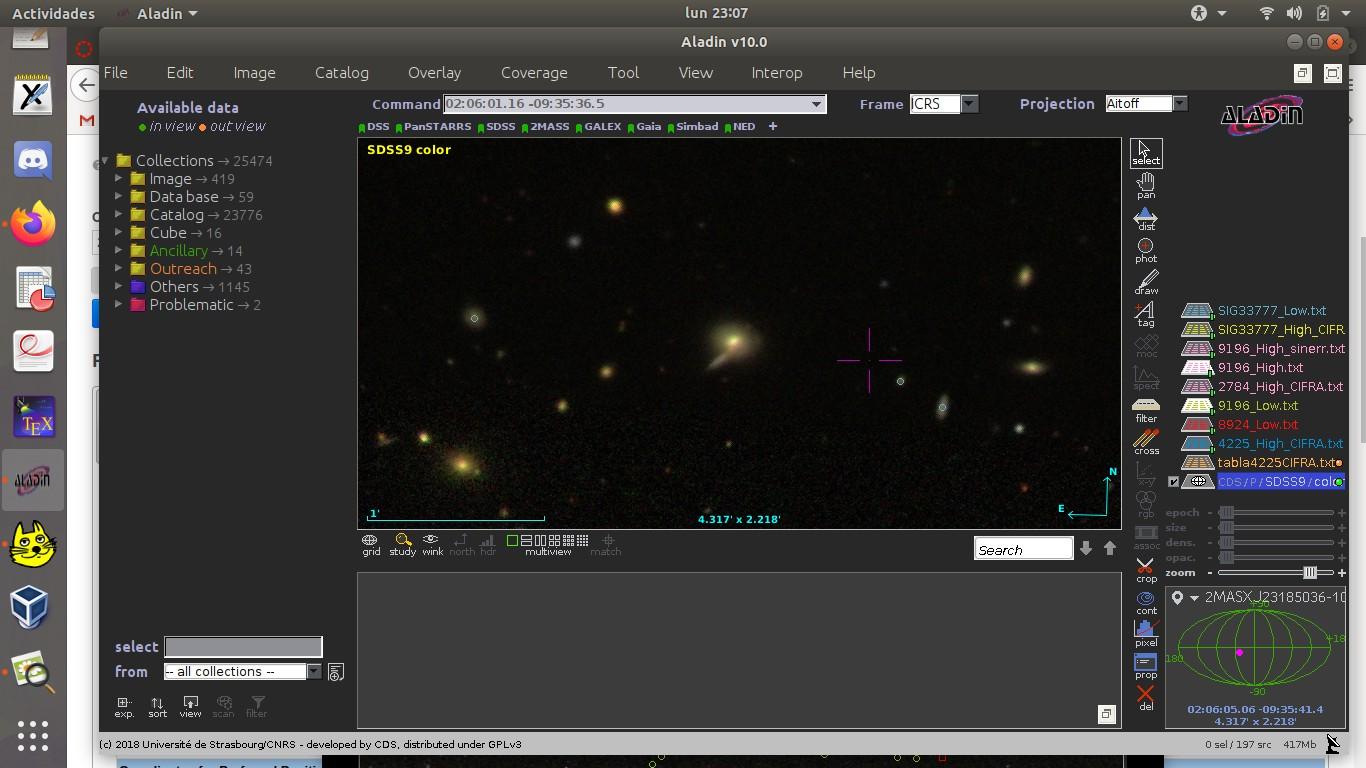
Figure 3: Finding chart for one SIG galaxy (at the center). High and low priority neighbours are marked with blue and red circles, and the confirmed satellite with a pink square.
References:
1. Argudo-Fernández et al. 2015
2.Ahn et al.2014
3.Dressleret al.2011
4.Oemler et al.2017,ascl:1705.001
Probing the inner haloes in the Aquarius
Simulations
Alain Andrade(1), Patricia Tissera(2), Andrea Mejías(1)
(1)Universidad Andres Bello, Santiago, Chile
(2)Pontificia Universidad Católica de Chile, Santiago, Chile
We present preliminary results on the analysis of stellar populations of the stellar haloes within the inner 40 kpc region of the Milky-Way mass galaxies selected from the Aquarius Project (Scannapieco et al. 2008). Our aim is to deepen our understanding on the origin of the inner region of the stellar halo of our Galaxy, motivated by Tissera et al. (2018) and Carollo et al. (2019).
The age profiles as well as the contributions from in-situ (i.e.,formed in separated satellites and later on accreted) and ex-situ stars (i.e. stars formed in the progenitor galaxies) are explored and analysed in relation to the assembly history of the inner haloes. At z=0 stars in halo within 40 kpc are followed back in time in the order to identify their birth location. Results are used to interpret recent observations of the age distribution in the inner region of the Milky-Way.
In this poster, we present preliminary finding of a study of the stellar halo of Aq-C5 from the Aquarius Project.
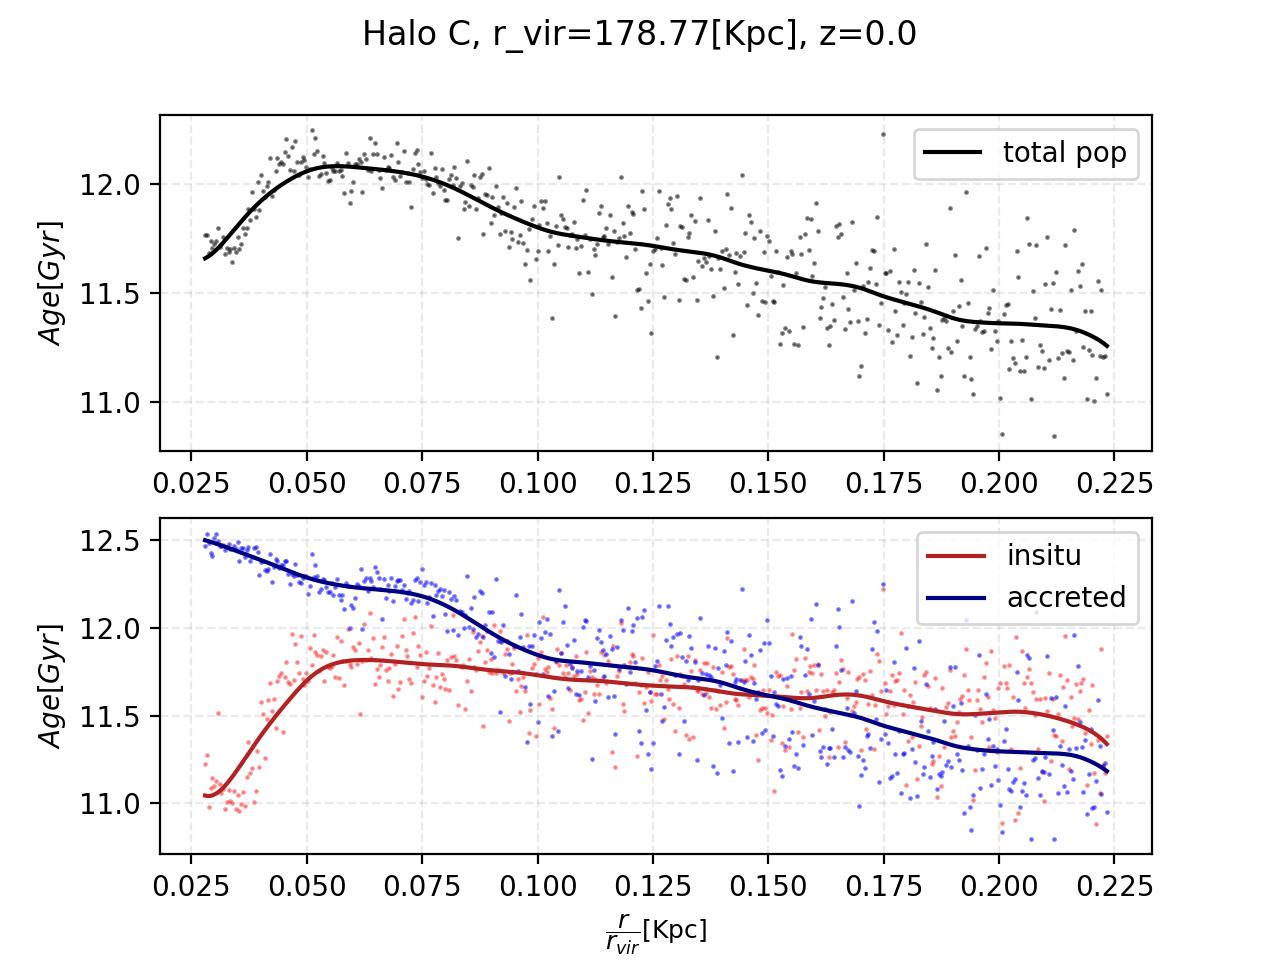
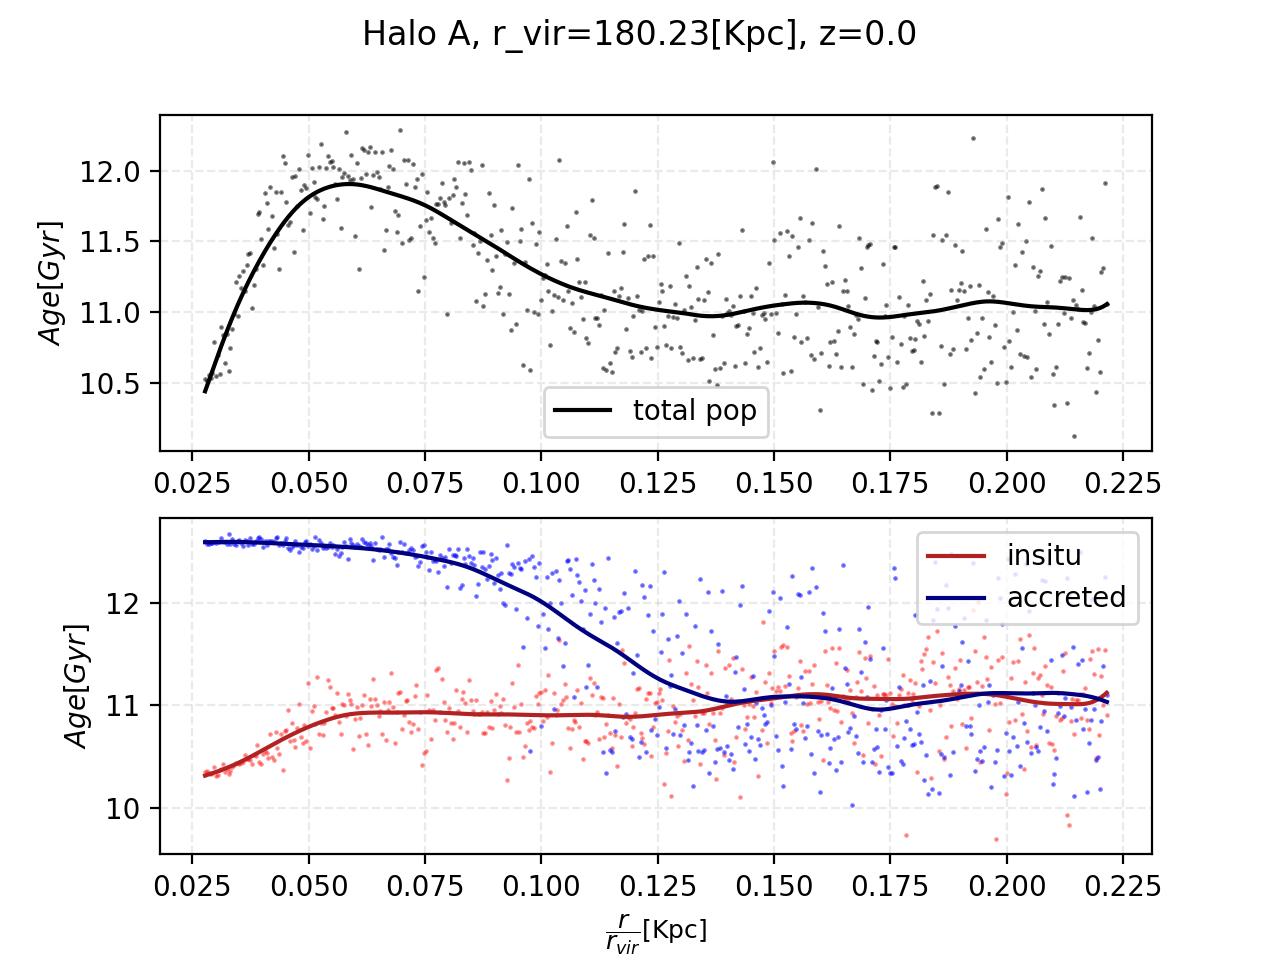
In Figure 1 we present the age profile in the radial range in the inner region of two haloes: Aq-C5 (right panel) and Aq-A.5 (left panel) as examples (see Carollo et al 2018). The upper figures show age profiles (black lines) in a radial region of 5-40 kpc. The lower panels show the age profiles for accreted or ex-situ (blue lines) and in-situ (red lines) stellar populations. The oldest stars are found to be ex-situ stars.
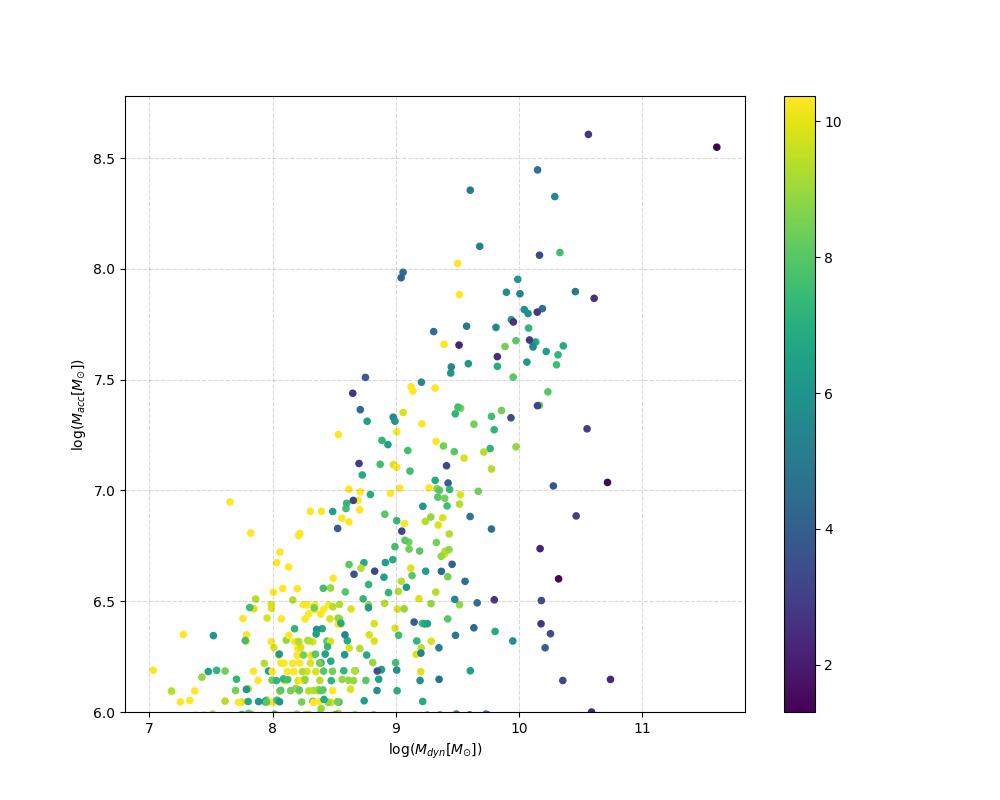
In particular, we explore the mass distribution of the satellites that contributed to the formation of stellar halo of Aq-C5 (this halo is the one that better resembles the Milky Way properties as shown in Tissera et al. 2018). The stellar halo is decomposed in an inner (most bounded particles) and outer (less bounded particles) components by using the binding energy.
We estimated the stellar mass contributed to the inner and outer haloes by the accreted satellite and its disruption look-back time, which is defined as the time at which the satellite is not longer identified as a separate system from the central galaxy.
∼ 1010 M⊙
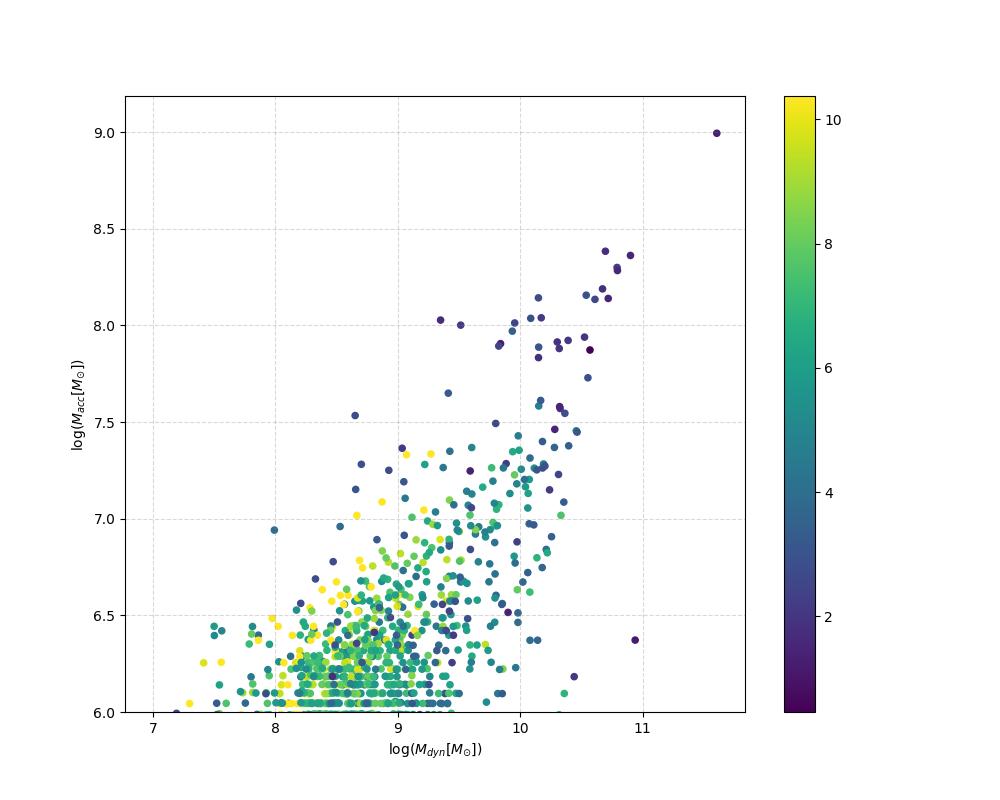
In Figure 2 we present the accreted stellar mass as a function of the dynamic mass (gas + stellar + DM masses) of each satellite that contribute to the inner (left panel) and outer (right panel) halos. Colors show the disruption look-back time. In both figures, we can see what the satellites that were accreted at high redshift tend to have dynamical masses smaller than , whereas more massive accreted satellites ( ) were disrupted later on. The inner halo have larger contributions of smaller satellites at very early stages. These stars are old and contributed to shape the age profiles showed in Figure 1 (left panels). It is also clear that some of the larger satellites have contributed to both inner and outer haloes.
M > 109 M⊙
90 %
< 109 M⊙
Conclusions: Our first results suggest that the stars in inner region come from smaller satellites and few massive ones with . The latter contributed with more than of the inner halo in agreement with previous results. In a future work we will focus on the origin of oldest population in central region.
References:
• Carollo, D., Tissera, P. B.& Beers, T., et al., 2018, ApJL 859.
• Carollo, D., Chiba, M., & Ishigaki, M., et al., 2019., ApJL 887.
• Scannapieco, C., Tissera, P. B, White, S. & Springel, V., 2006. MNRAS 389, 1137.
• Tissera, P., Machado, R. & Carollo, D., et al., 2018, MNRAS 437, 1656.
Outer halo Inner halo
CONSTRAINING THE FORMATION HISTORY OF THE MILKY WAY
Here we introduce an ongoing collaboration project aiming to provide statistical constraints on the formation history of the Milky Way stellar halo. We couple the semi-analytic model of galaxy formation SAG with the CATERPILLAR simulations, and apply different techniques to explore the space of free parameters considered in the modeling to statistically restrict both the models and the halo formation histories comparing tospecific datasets.
THE CATERPILLAR SIMULATIONS
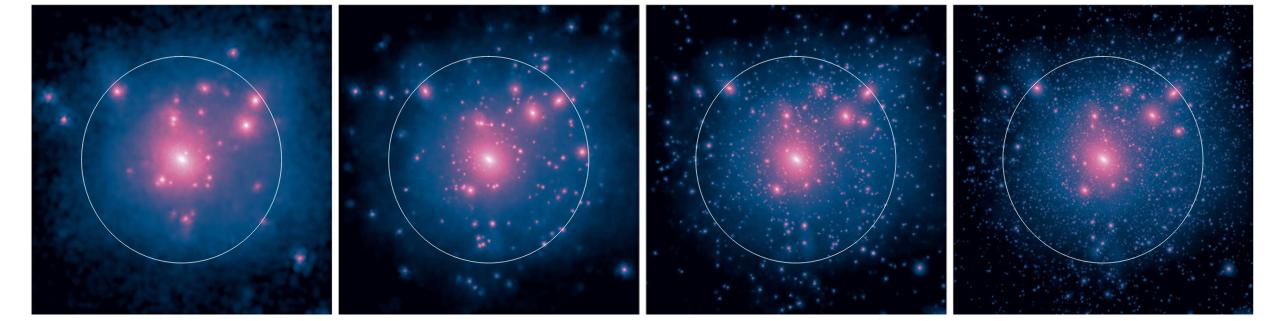
The Caterpillar Project is a large suit of dark matter only cosmological (re)simulations of more than 35 Milky Way-sized galaxies. Each halo is replicated with several mass resolution levels, reaching a mass of ~10M ⁴ ⊙ per particle and 50 Myr of temporal resolution. Thereby, this is one of the largest and highest resolution simulation suites of its kind.
www.caterpillarproject.org
Example of simulated halo:projected dark matter density at z=0. Increasing resolution levelsfromleft(mp=1.5x10M ⁸ ⊙)toright(mp=3x10M ⁴ ⊙). Credits: Griffen et al. (2016)
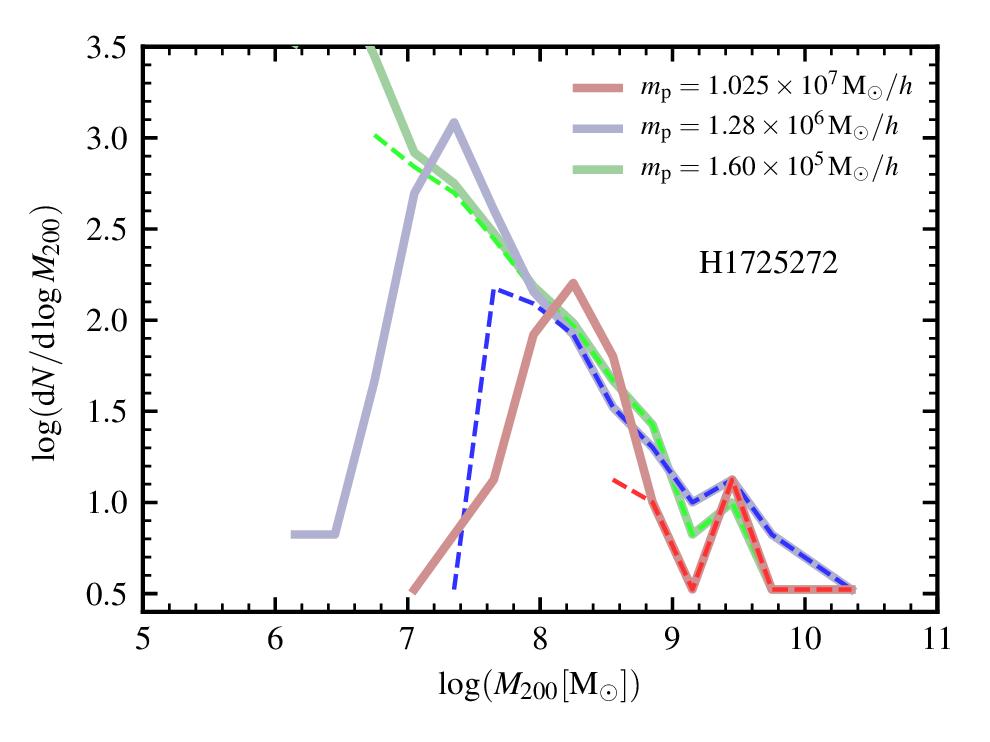
The four available different levels of resolution on each halo creates a powerful sample to study the effect of the simulation resolution on the physical models with an unprecedented level of detail: completeness in the low-mass limit, free parameters response to the resolution, limitations of the considered physical models, technical limitations, among others.
Video here!
THE SEMI-ANALYTIC MODEL
SAG is a semi-analytic model of galaxy formation and evolution which uses the properties of dark matter halos and their corresponding merger trees to calculate the baryonic content of the halos, i.e. the galaxy properties.
The model considers a set of physical processes, including: hot gas cooling; star formation; galaxy mergers; disc instabilities; chemical enrichment; feedback from AGNs and growing of central BHs; tidal and ram pressure stripping; and a new redshift-dependent model of SN feedback based on relations from the FIRE hydrodynamic simulations (see Cora et al. 2018 for a detailed model description).
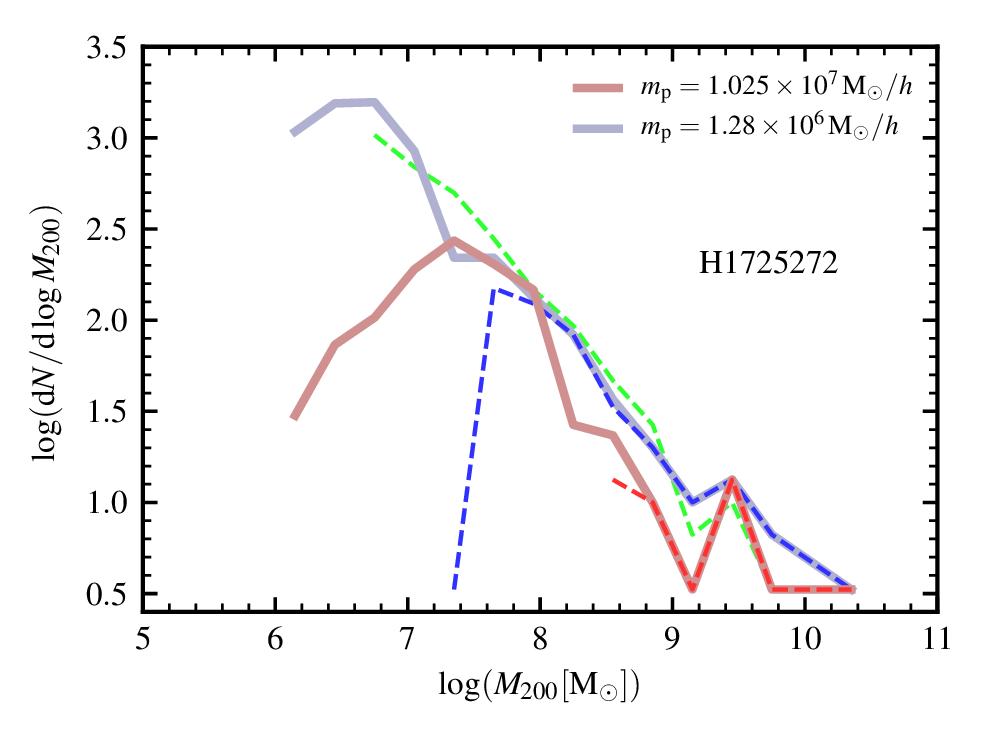
Example of mass functions of satellites obtained with SAG when applied to different resolutions of the halo H1725272. Predicted number counts differ with timescale of tidal stripping oftheorphan galaxiesmodeling: instantaneous stripping (right) versusdelayedstripping(left).
WORK IN PROGRESS
A particle tagging method is being developed for using the information of the stellar populations formed with SAG, in combination with the N-body particles as tracers of the stellar content of the spheroidal components of the galaxies.
We also consider the usage of statistical model emulators to approximate the outputs of computational expensive model calculations, and their corresponding uncertainties, so that can be readily incorporated into Monte Carlo tools.
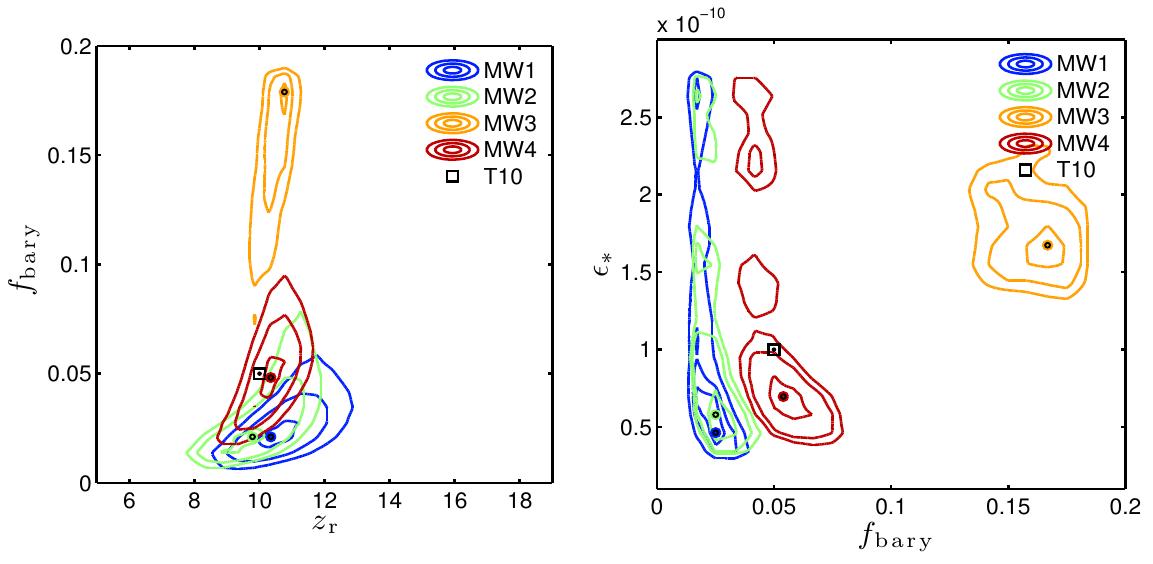
Example of exploration of the input parameter space of a galaxy formation model through sensitivity analysis, by using model emulators. Four different Caterpillar halos were analyzed to restrict their formation history, in comparison with properties of theMilkyWay.
Credits: Gómez et al (2014).
Finally, we aim to generate detailed mock stellar catalogues to test our method and tools, and make them publicly available to the astronomical community.
A Tale of Two Transition Disks:
ALMA Longbaseline Observations of ISO-Oph 2 Reveal Two Closely Packed Nonaxisymmetric Rings and a ∼2 au Cavity
Camilo González-Ruilova
Paper reference: González-Ruilova, C., Cieza, L. A., et al. 2020, ApJL, 902, L33, doi: 10.3847/2041-8213/abbcce
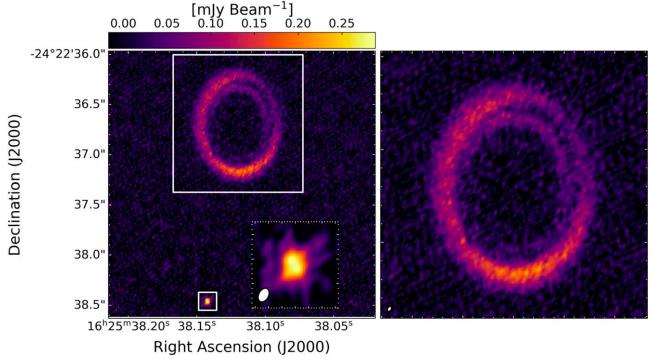
Abstract: ISO-Oph 2 is a wide-separation (240 au) binary system where the primary star harbors a massive (Mdust 40 M⊕) ringlike disk with a dust cavity 50 au in radius and the secondary hosts a much lighter (Mdust 0.8 M⊕) disk. As part of the high-resolution follow-up of the “Ophiuchus Disk Survey Employing ALMA” (ODISEA, Cieza et al. 2019) project, we present 1.3 mm continuum and 12CO molecular line observations of the system at 0.02” (3 au) resolution. We resolve the disk around the primary into two nonaxisymmetric rings and find that the disk around the secondary is only ∼7 au across and also has a dust cavity (r ∼ 2.2 au). Based on the infrared flux ratio of the system and the M0 spectral type of the primary, we estimate the mass of the companion to be close to the brown-dwarf limit. Hence, we conclude that the ISO-Oph 2 system contains the largest and smallest cavities, the smallest measured disk size, and the resolved cavity around the lowest-mass object (Mstar∼ 0.08 M⊕) in Ophiuchus. From the 12CO data, we find a bridge of gas connecting both disks. While the morphology of the rings around the primary might be due to an unseen disturber within the cavity, we speculate that the bridge might indicate an alternative scenario in which the secondary has recently flown by the primary star causing the azimuthal asymmetries in its disk. The ISO-Oph 2 system is therefore a remarkable laboratory to study disk evolution, planet formation, and companion–disk interactions.
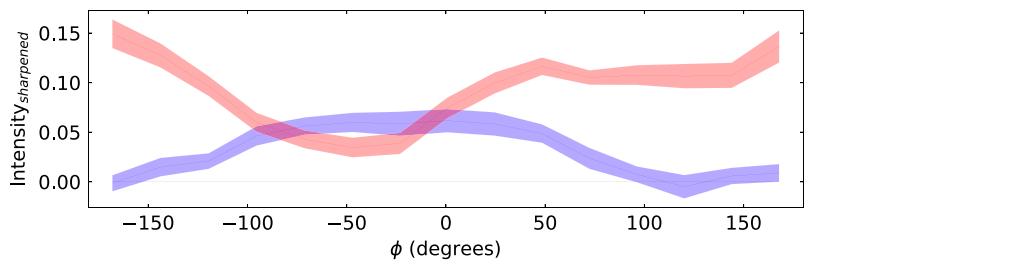
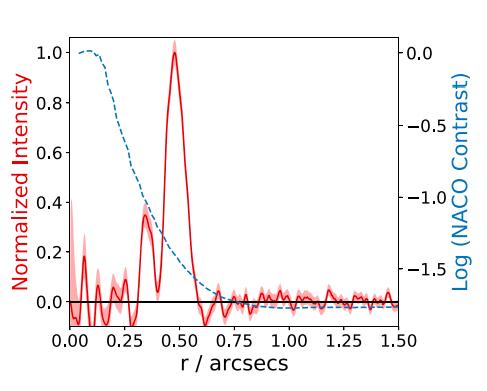
Primary disk: The top panel shows the continuum image for the system with a zoom for both sources. There exists evidence of two apparent rings around the big cavity, Therefore, an unsharp masking process was carried out, to try to highlight the morphology of the possible rings, deprojecting the image obtained to finally make azimuthal (bottom left) and radial (bottom right) intensity profiles, where it can clearly see the existence of two rings and a gap that divides them at a radius of ∼ 3.5”, with a very particular asymmetry, where the maximum intensity in one corresponds to the minimum in the other and viceversa.
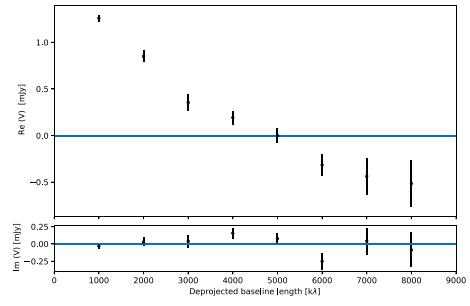
Secondary disk: Using the CASA software (McMullin et al. 2007), not only self-calibration and imaging were done, the primary disk was also subtracted from the observations, leaving only the secondary disk. Later these new visibilities were plotted, to find the baseline where the real part was made null and thus apply the analogous procedure proposed in Lay et al (1997), Obtaining that this secondary disk has a cavity of radius ∼ 2.2 au, being the smallest cavity observed in this molecular cloud.
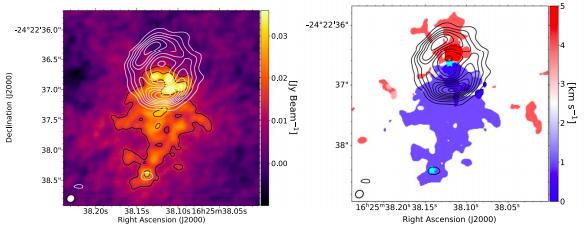
Gas: The figure below shows the moment maps corresponding to a combination of the aforementioned observations and ALMA cycle 4 observations with an angular resolution of 0.2 “. Using the CASA TCLEAN tool. The moment 0 map (left panel), corresponds to the velocities of the blue shifted part in the visibilities, with white contours of the continuum in the observations of poorer resolution (Cieza et al. 2019) and black contours the signal of the image itself (both contours correspond to intensities > 3*rms in their respective images). At moment 1 map, the same contours of the continuum are shown and the position of each star is shown in sky-blue color using the coordinates from the GAIA's DR2.The existence of a gas bridge that joins the two sources can be clearly seen, in addition to the existence of a signal and Keplerian rotation within the cavity of the primary.
Discussion: The strange morphology of the primary disc for dust could have several explanations, but the presence of the gas bridge observed in 12CO could be evidence of the interaction between both sources as a possible flyby (Cuello et al. 2020), which added to the presence of planets (Perez et al. 2020) could concisely explain the asymmetries of the two rings, which are also very close to each other. We propose hydrodynamic simulations that can recreate similar structures for this case as future work.
References:
- Cieza, L. A., Ruz-Rodrguez, D., Hales, A., et al. 2019, MNRAS, 482, 698, doi: 10.1093/mnras/sty2653
- Cuello, N., Louvet, F., Mentiplay, D., et al. 2020, MNRAS, 491, 504, doi: 10.1093/mnras/stz2938
- McMullin, J. P., Waters, B., Schiebel, D., Young, W., & Golap, K. 2007, in Astronomical Society of the Pacific Conference Series, Vol. 376, Astronomical Data Analysis Software and Systems XVI, ed. R. A. Shaw, F. Hill, & D. J. Bell, 127
- Perez, S., Casassus, S., Hales, A., et al. 2020a, ApJL, 889, L24, doi: 10.3847/2041-8213/ab6b2b
o-H D : a powerful chemical clock of starforming regions
Morin Órdenes Giovanni Sabatini Andrea Giannetti Stefano Bovino
(1) Departamento de Astronomía, Facultad Ciencias Físicas y Matemáticas, Universidad de Concepción, Av. Esteban Iturra s/n Barrio Universitario,Casilla 160, Concepcion, Chile; (2) INAF - Istituto di Radioastronomia - Italian node of the ALMA Regional Centre (It-ARC),Via Gobetti 101,I-40129 Bologna, Italy (3) DiFA,Università degli Studi di Bologna,Via Gobetti 93/2, I-40129 Bologna, Italy; (*) Contact:moordenes@udec.cl
Introduction
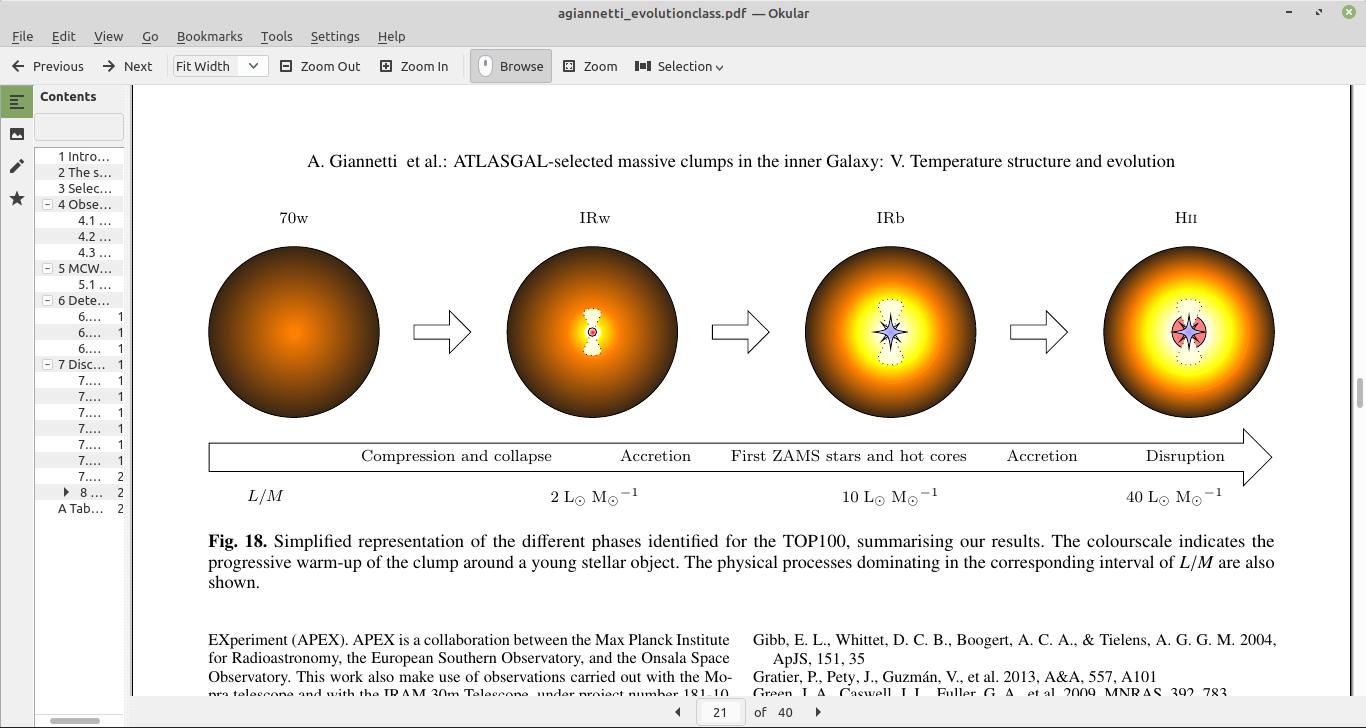
High-mass star-formation process is still an enigma since the regions where it all takes place are distant and highly obscured by the interstellar dust. Chemistry plays an important role helping to characterize this process, since chemical species are sensitive to physical processes during the evolution of the star formation process (see Fig. 1).
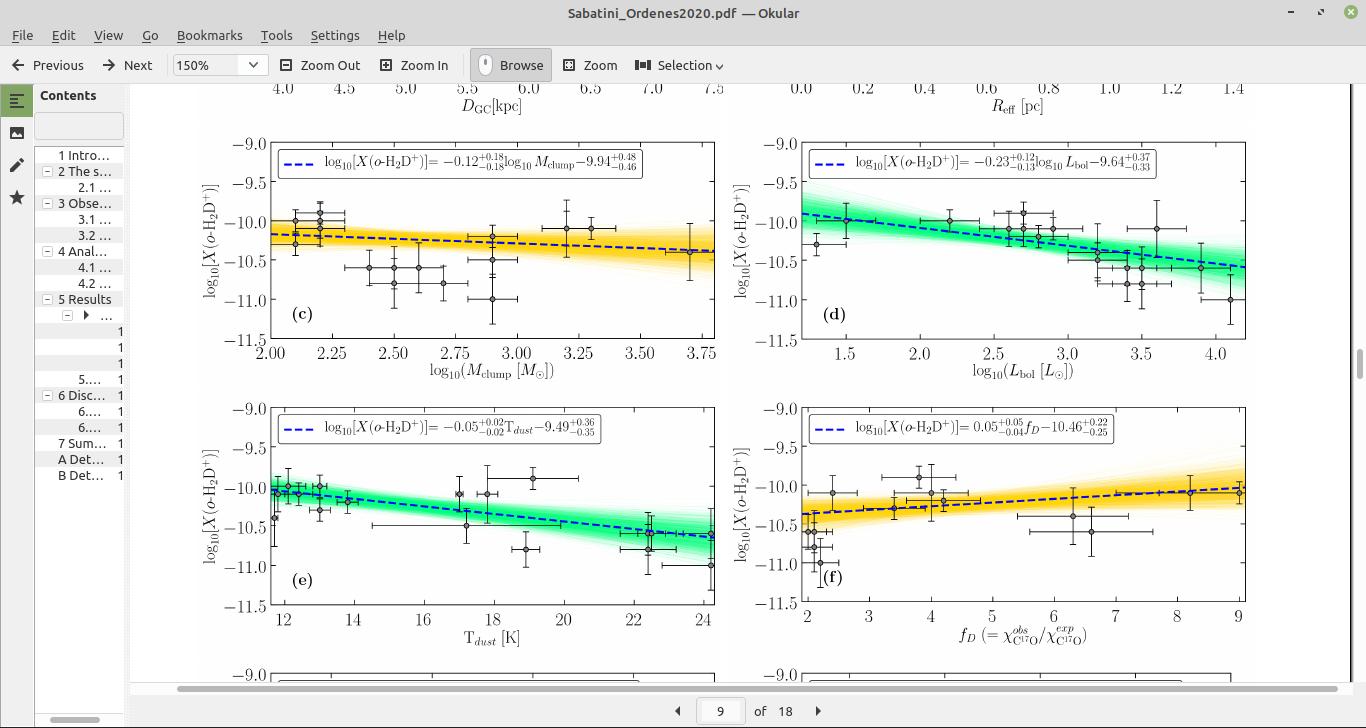
In a previous work, Giannetti et al., 2019 studied three different clumps harboured in the Infrared Molecular Cloud G351.77-0.51 and found the decreasing abundance of o-H2D with the evolutionary stage of the clumps. The clumps 1
Fig. 1: Representations of the different phases used to classify the sources studied, taken 2
Analysis
We analysed 114 sources of the independent clumps (see Fig.4).
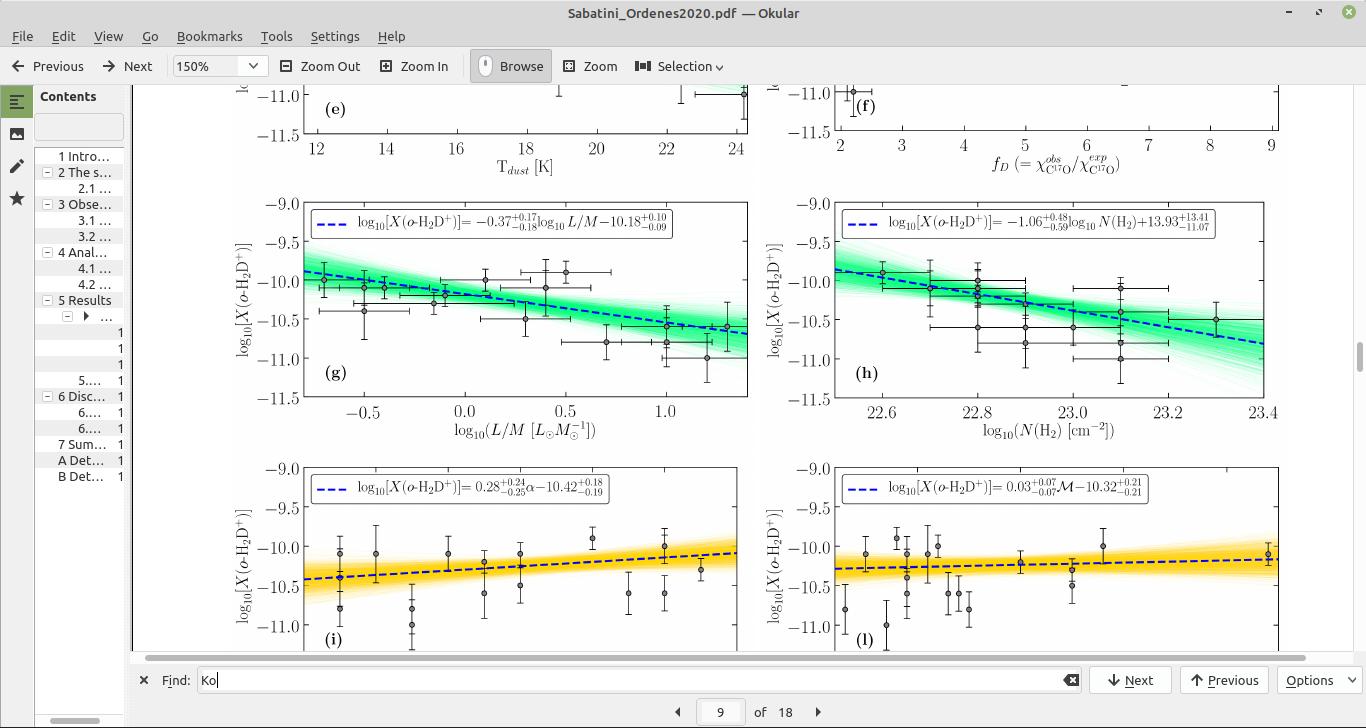
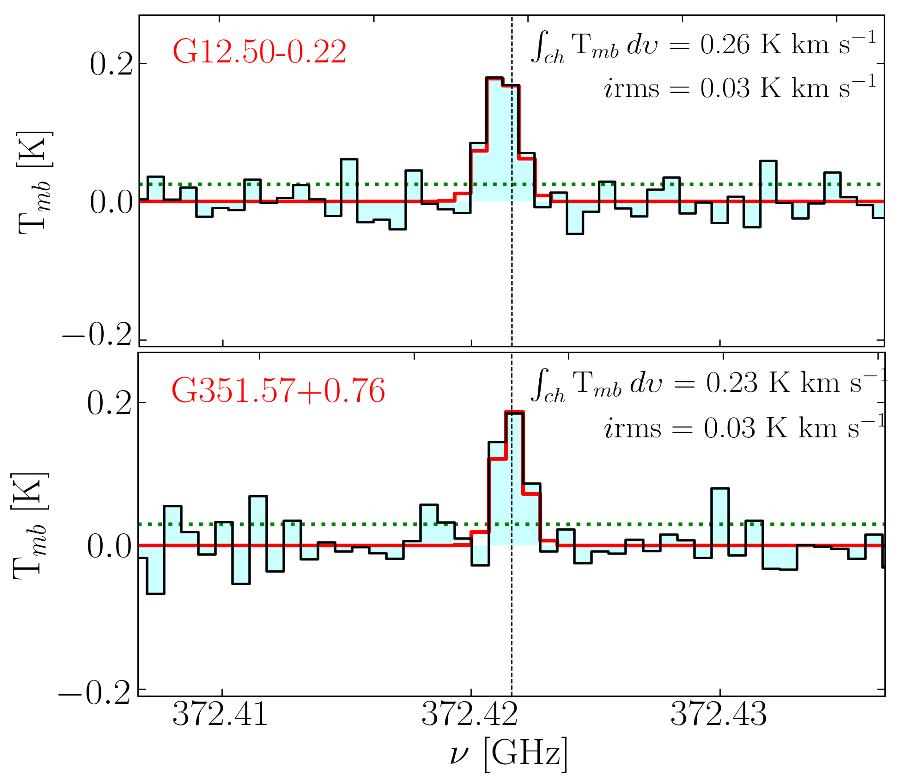
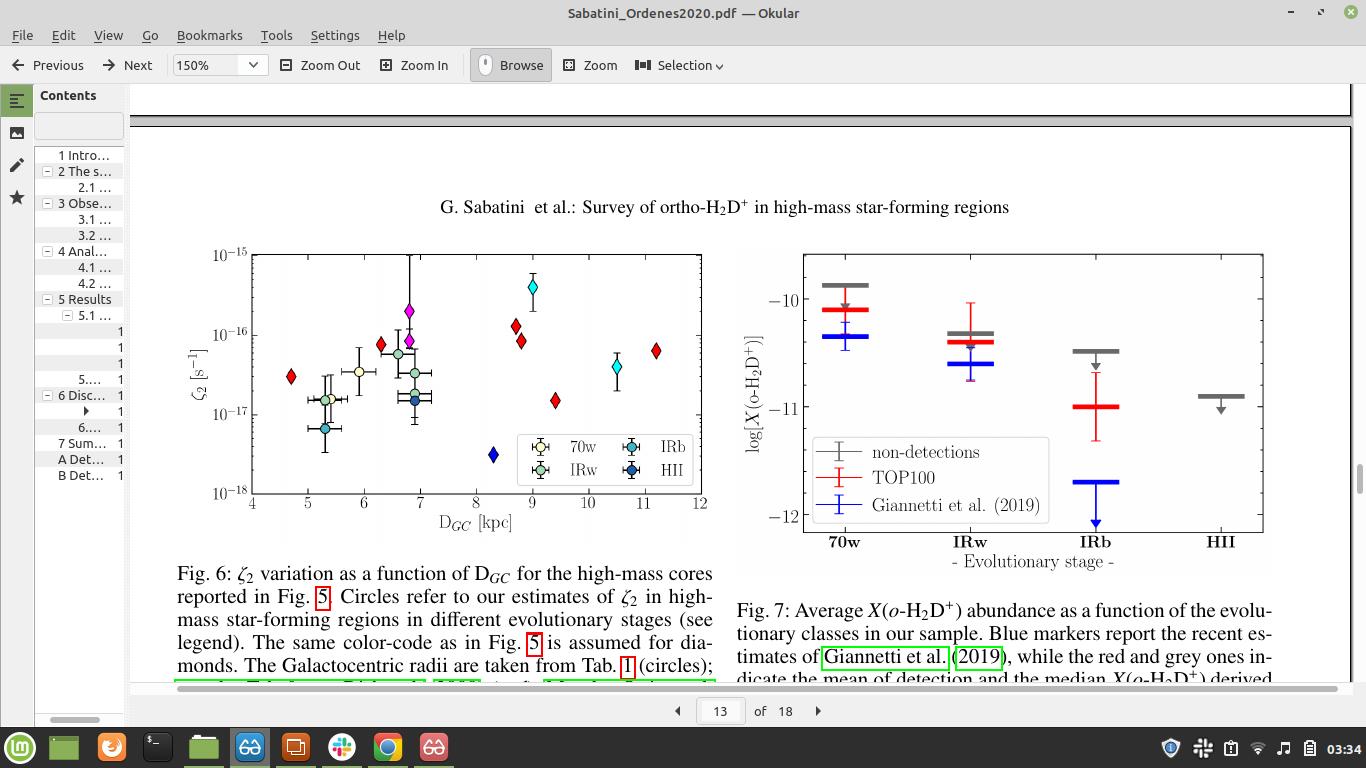
Fig. 4: Observed o-H2D abundance variation as a function of the evolutionary stage of massive clumps.The classification is reported in Fig. 1.The plot is taken from Sabatini et al., 2020
The
VISCACHA surveydeep and resolved photometry of star clusters in the Magellanic Clouds
B. Dias (IAI-UTA, Chile) and the VISCACHA team
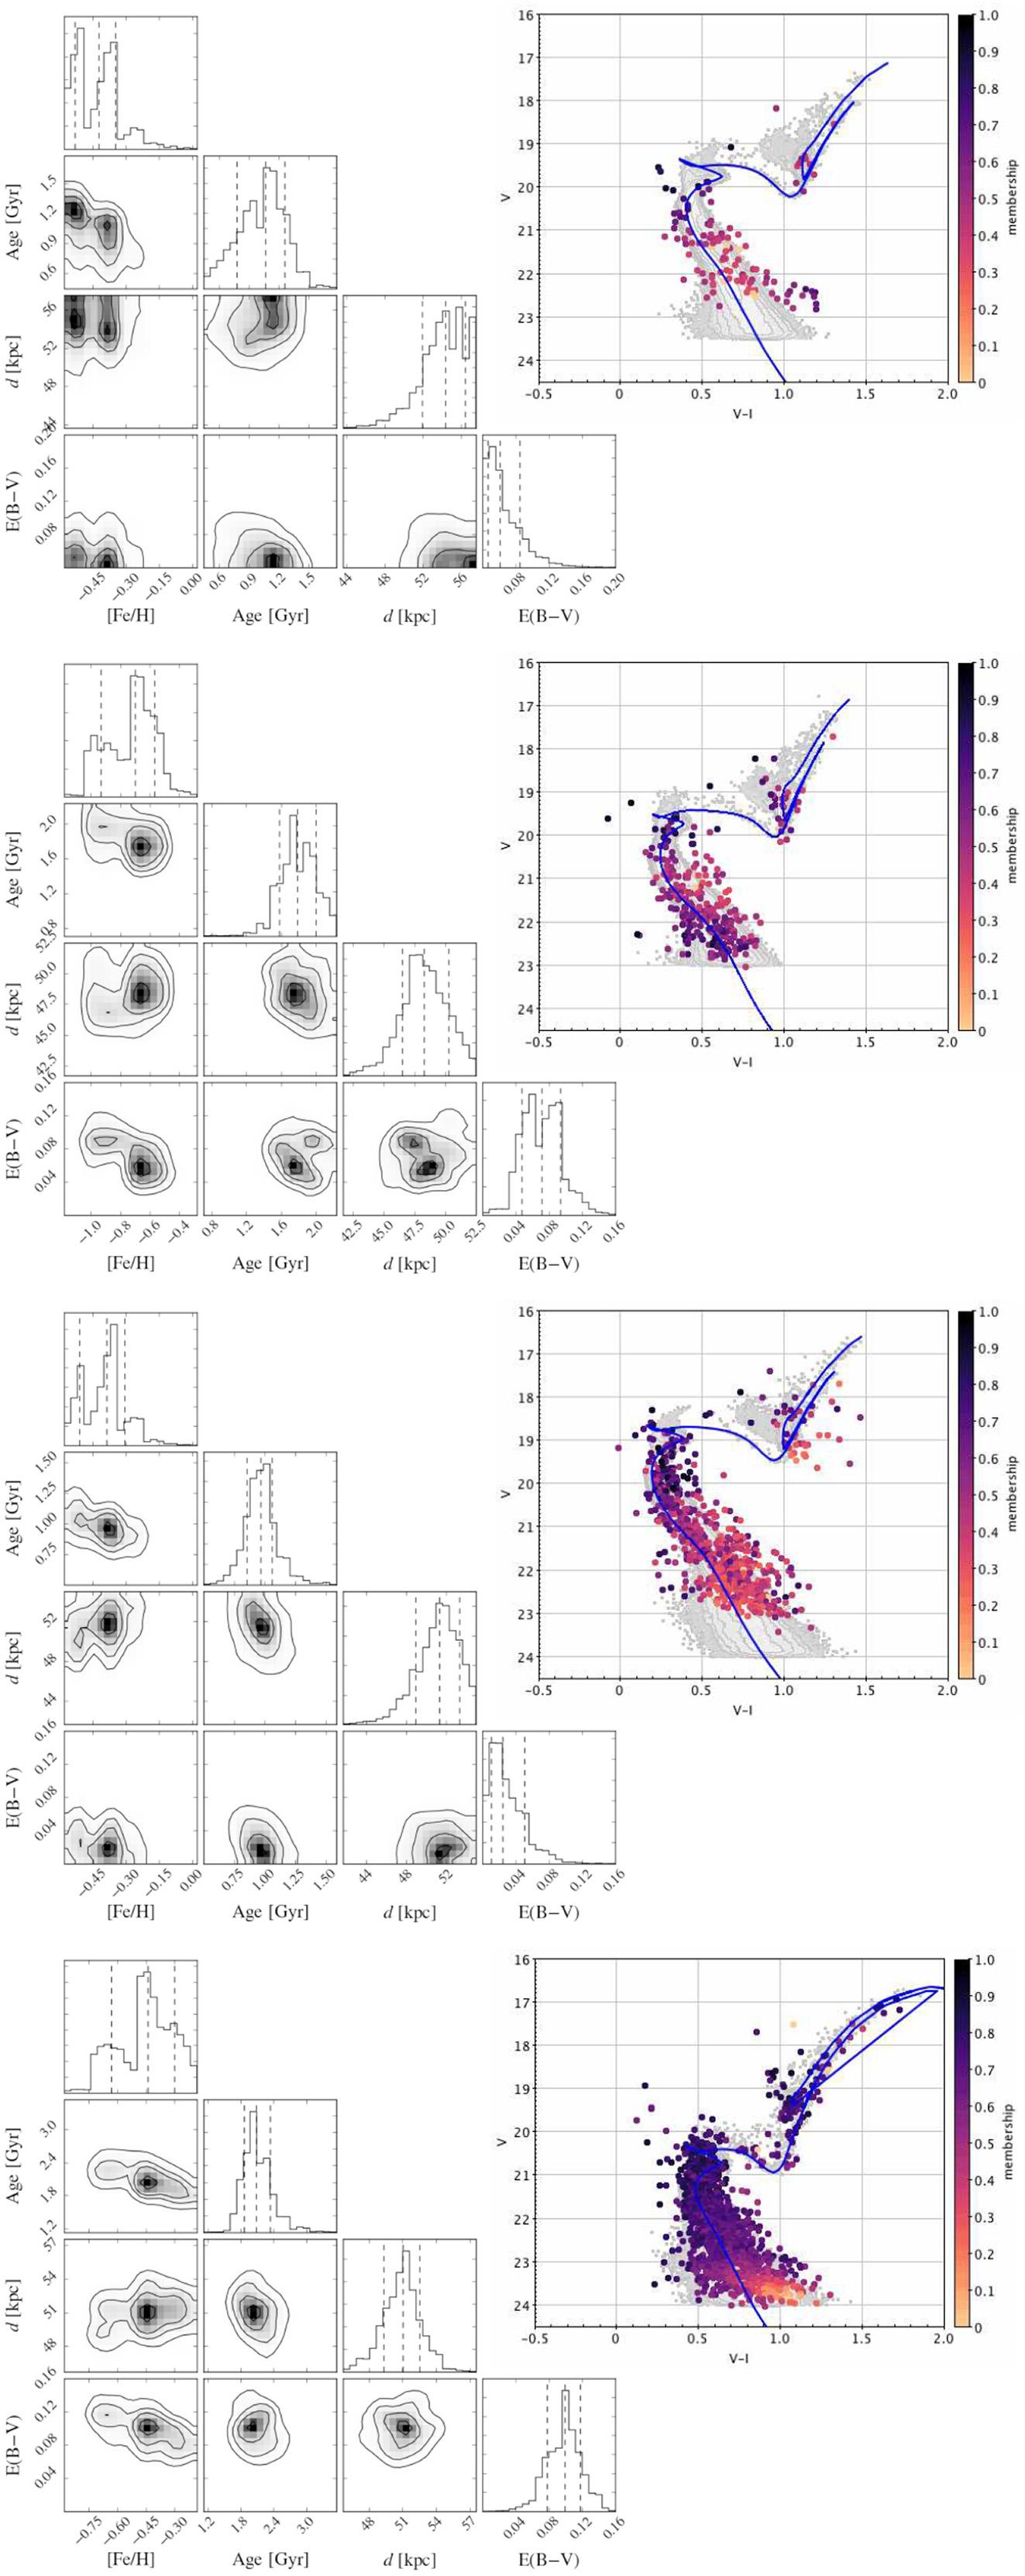
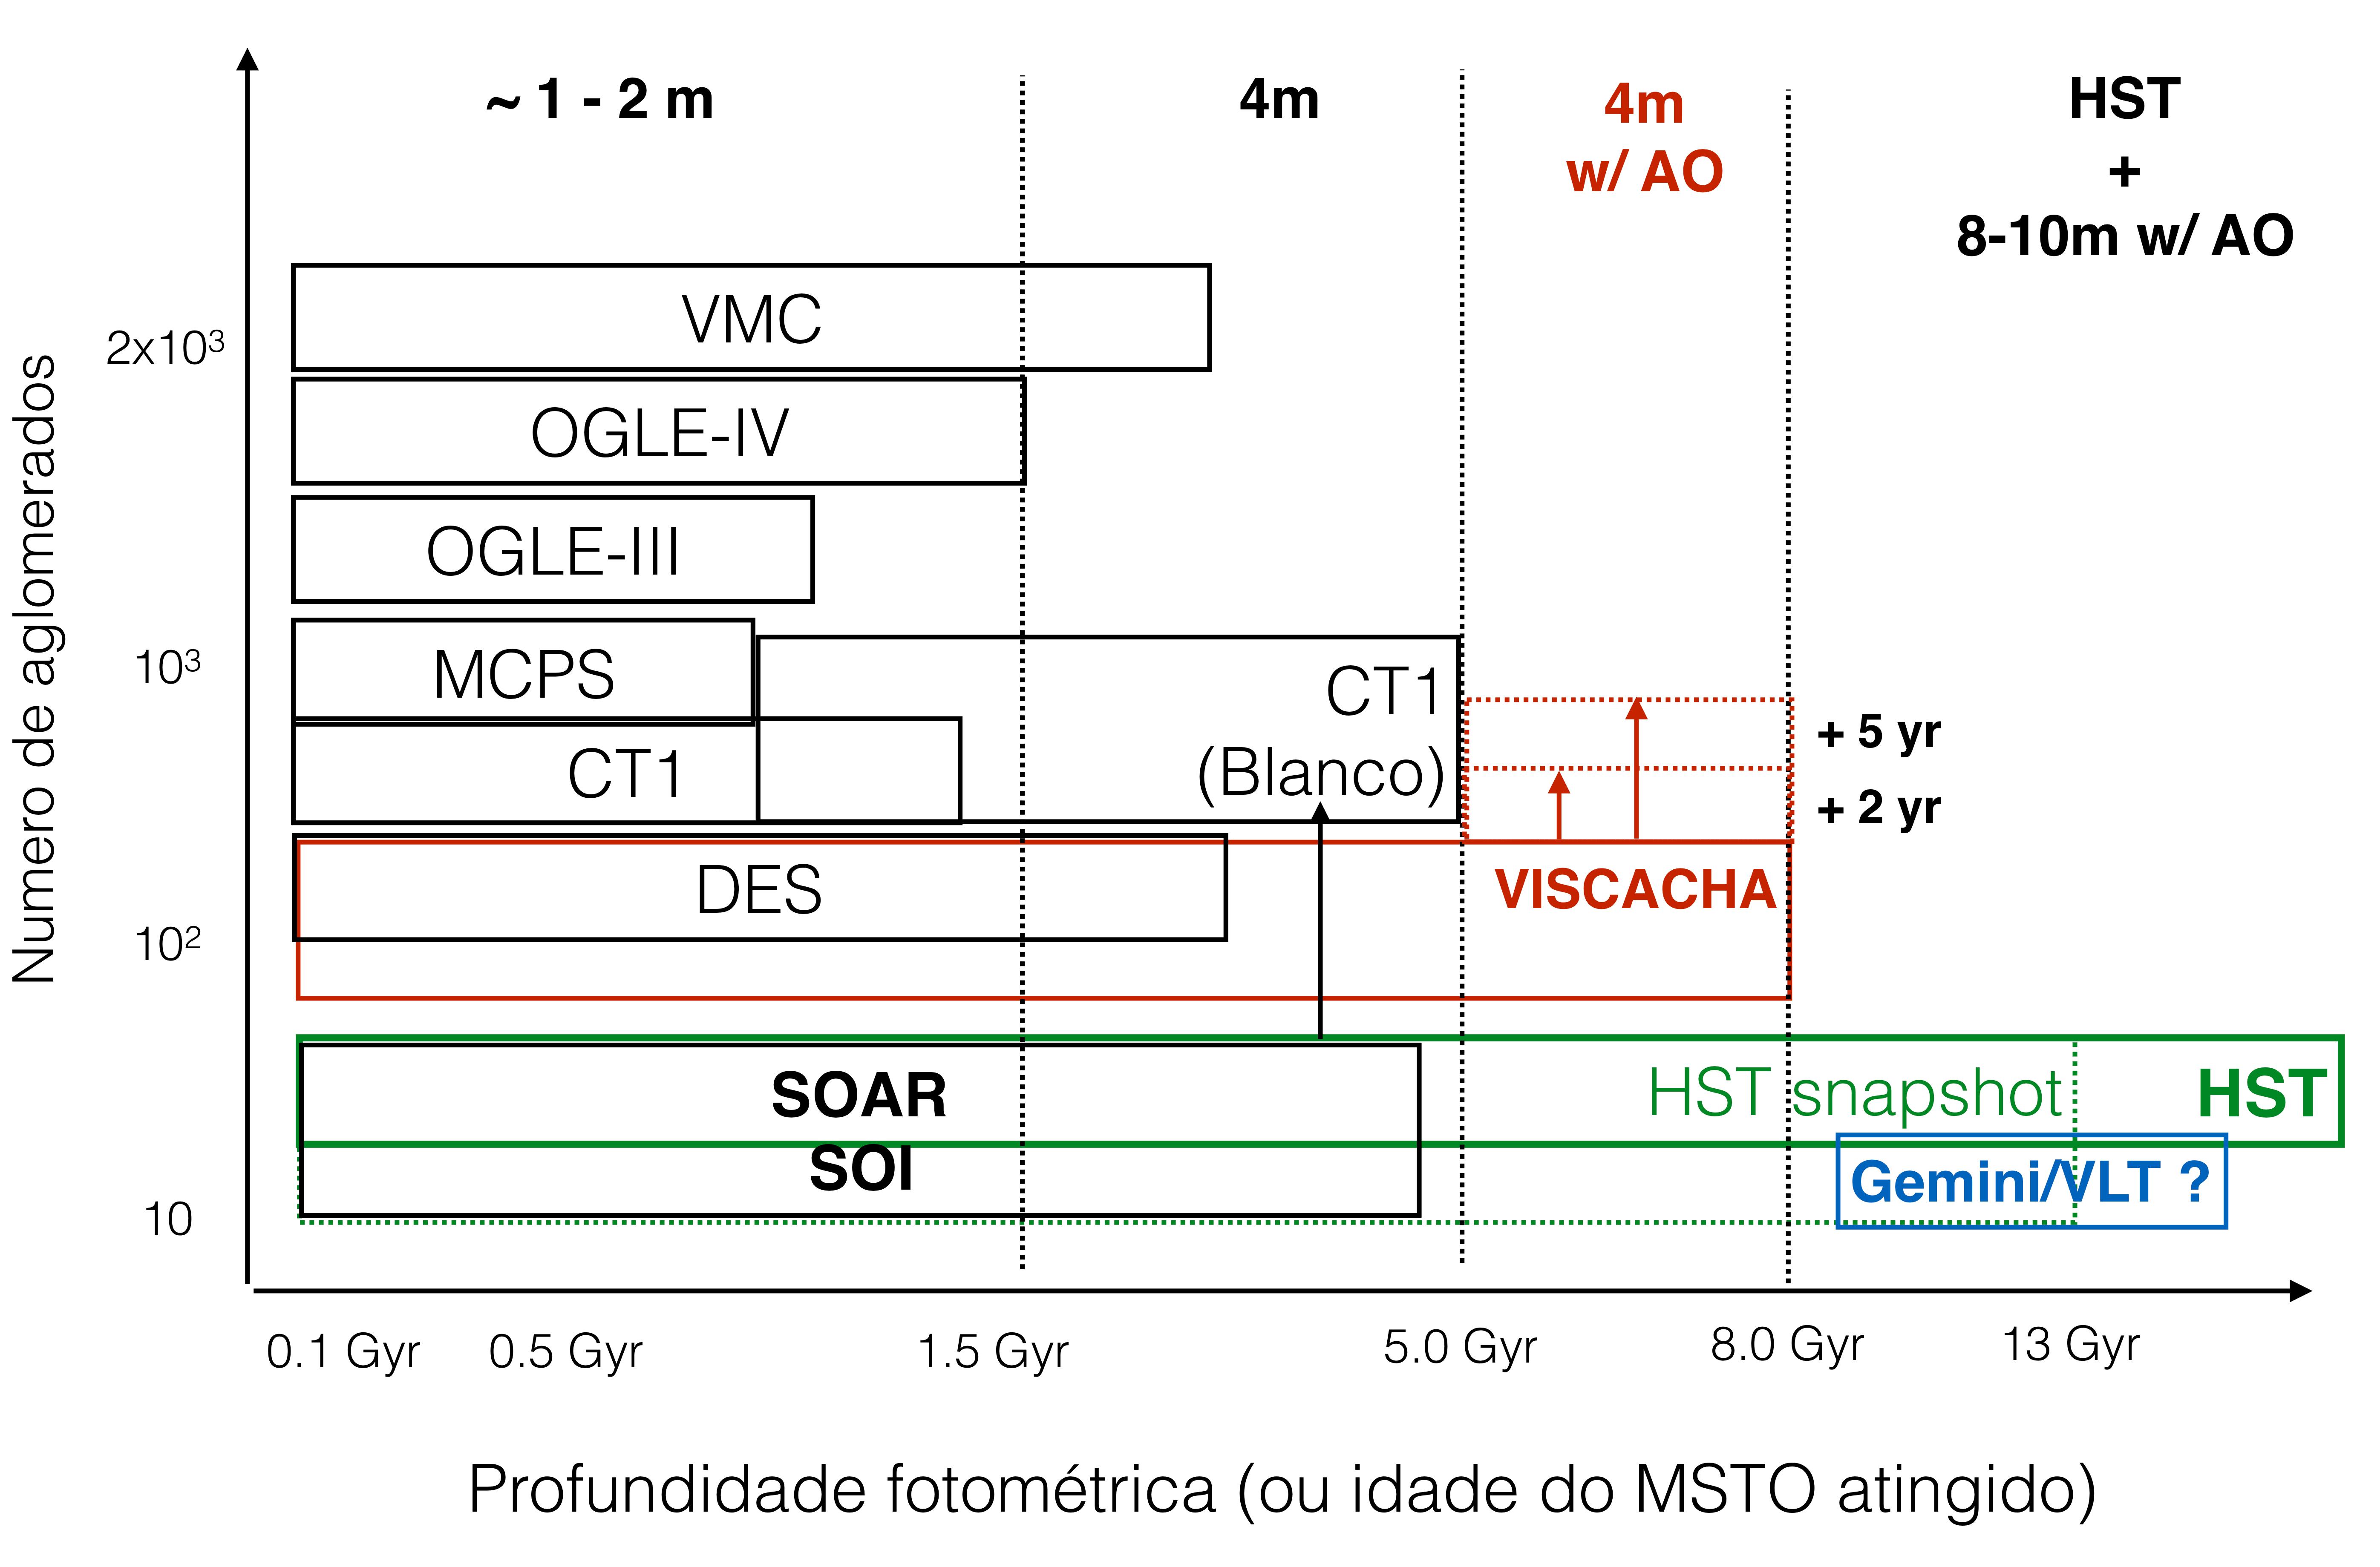
The VISCACHA ( photometry of star Clusters in and Coxi HuguA ongoing project based on deep and spatially resolved photometric observations of Magellanic Cloud star clusters, collected using the SOuthern Astrophysical Research (SOAR) telescope together with the SOAR Adaptive Module Imager. So far we have used >300h of telescope time to observe ~150 star clusters, mostly with low mass (M < 10^4 M
Topics covered by the VISCACHA survey
Among the topics that the VISCACHA data shall allow to address and play an important role, we list:
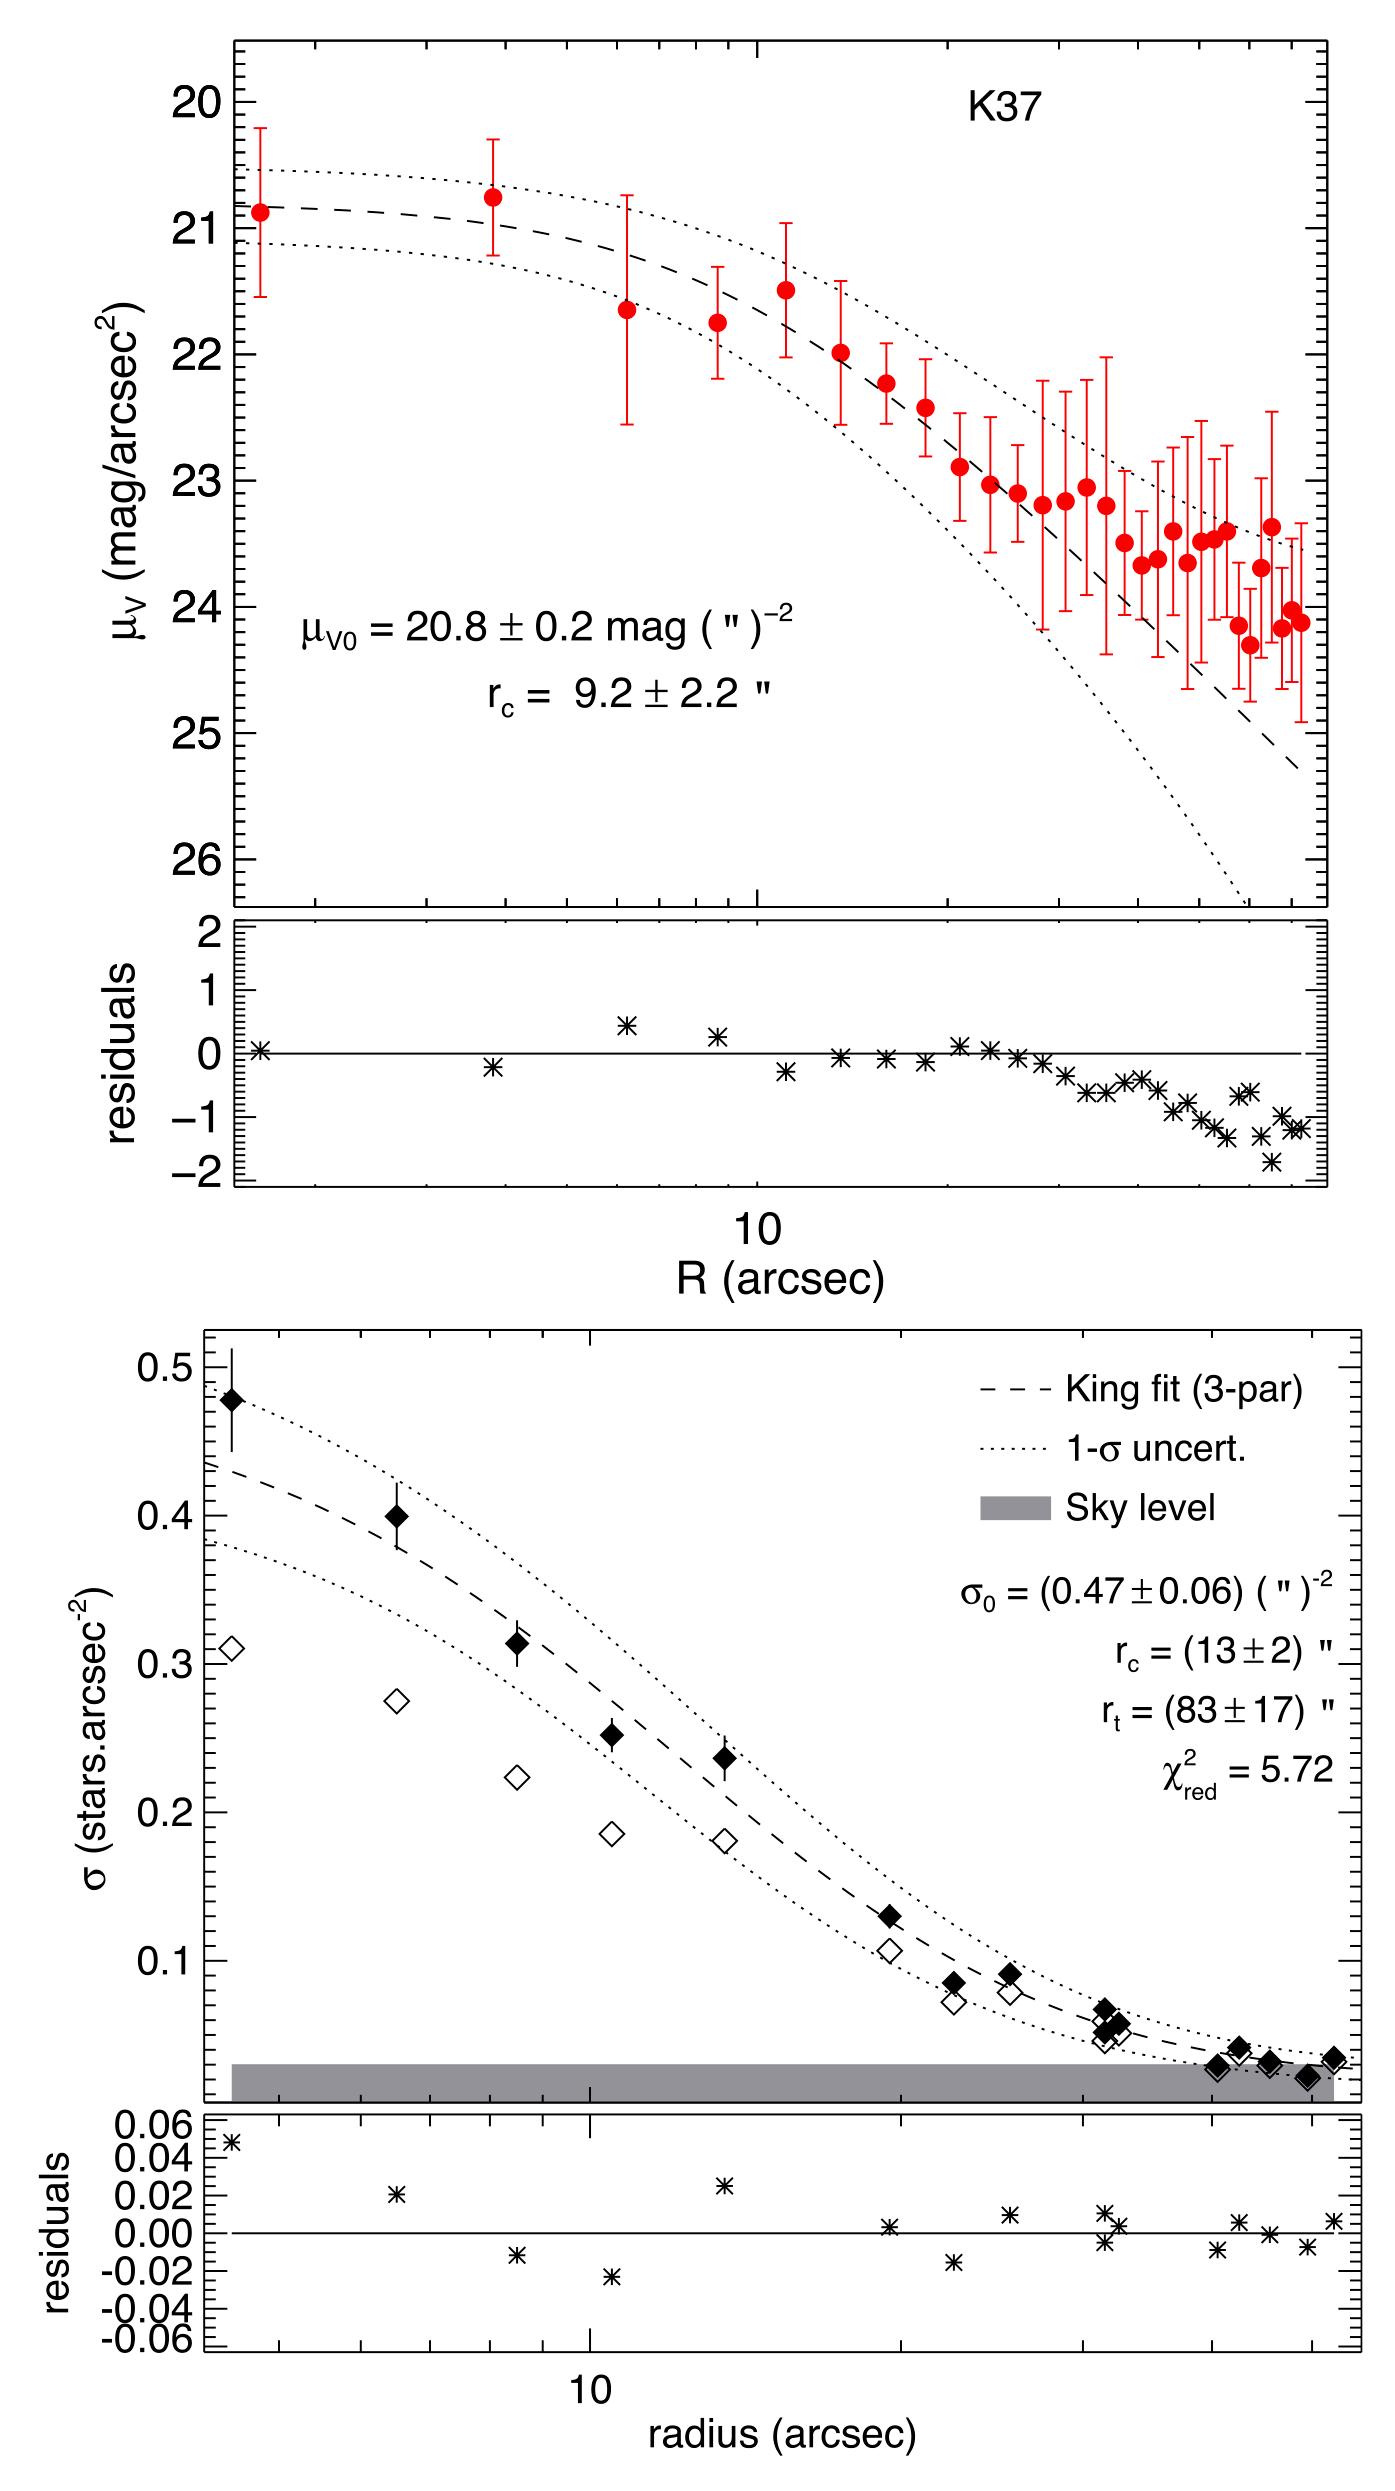
(i) position dependence structural parameters of clusters, (ii) age– metallicity relations of star clusters and radial gradients, (iii) 3D structure of the Magellanic System in contrast with results from variable stars, (iv) star cluster formation history, (v) dissolution of star clusters, (vi) initial mass function for high- and low-mass clusters, (vii) extended main-sequence turn-offs in intermediate-age clusters, (viii) combination with kinematical information to calculate orbits.
Thisappendixcompilesthefiguresresultingfromthestellar luminosityandMFderivationsofthestudiedclusters,asdescribed inSection5.3.Figs C1 and C2 showtheLFsandthepower-lawfits (equation11)overtheresultingclusterMFsforthepresentsample. TotalmassesandMFslopesareindicated.
Maximum age (limit magnitud, main sequence turnoff) # of clusters
Searching for close binary central stars of planetary nebulae
M. Oyarce1, M. Vuckovic1, A. Aller2
1 Instituto de Física y Astronomía,Universidad deValparaíso,Chile 2 Departamento de Astrofísica,Centro de Astrobiología,Spain
Introduction
Among the 3000 planetary nebulae (PNe) known in the Milky Way1, 80% show complex and asymmetrical morphologies. Understanding these morphologies is one of the most important issues in the PNe community and binary interactions have become the main proposed mechanism in the recent years. However, this hypothesis still does not have a strong observational evidence since just about 20%2 binary central stars have been detected so far. In this work we aim at confirming and characterizing new binary system candidates in the hearts of PNe by means of photometric observations, in order to increase the number of identified binary central stars and improve our knowledge of the formation of PNe3 and binary stellar evolution.
We have carefully inspected the existing photometric surveys (Catalina, SuperWasp, OMC, ASAS, etc) which provide light curves of a large number of objects in a long timespan. Apart from some already known binary central stars, we have also found many central stars of PNe (CSPNe) that show variability, probably due to the irradiation effect (i.e., the reflection of the light by the cooler companion star). However, the archival photometry is not conclusive and new and more precise data are needed in order to confirm this variability. Also, we have selected PNe with complex morphological features (such as rings, jets or bipolarity) that may be tracers of binary central stars (CSs).
General Data and Observations
We obtained time-resolved photometry of 17 selected CSPNe using DANISH telescope (La Silla Observatory) with the idea of detecting periodic brightness variations that indicate the presence of close binary central stars. We used Johnson-Cousin I filter as it is broad enough to allow short exposure times and at the same time avoids the strong nebular emission lines observed in PNe.
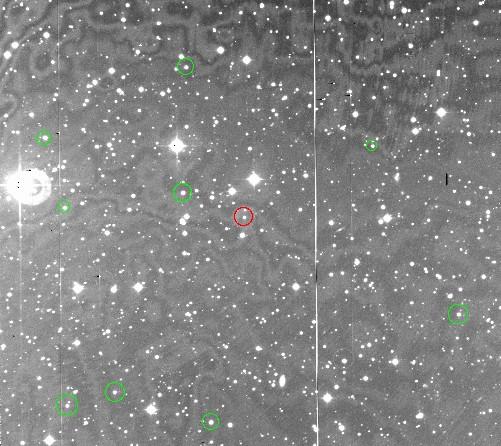
Here we present the preliminary analysis of the data obtained of PN Abell15, which is a ring-shaped PN4 localized in the constellation Canis Major with a magnitud of 11.52. The details on the observations are summarized in the following table:
Differential Photometry
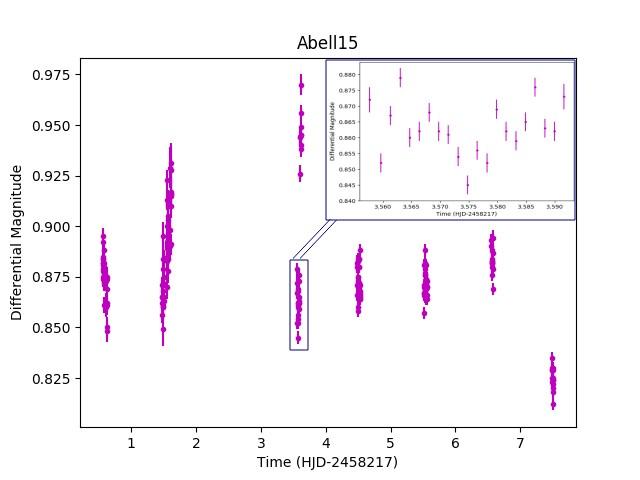
The reduction of the photometric data was done using IRAF and the standard bias and flatfield correction.The differential photometry was obtain with LEMON5, a differential photometry software that allows adjusting the aperture to each image according to its fwhm. We have selected 9 comparison stars based on there similar brightness. The light curves obtained in this way are shown in the figure below:
Fig. 1. Field of view of Abell15 (13,47x13,47 arcmin). The red circle marks our target (Abell15) and the green circles show the comparison stars used for differential photometry
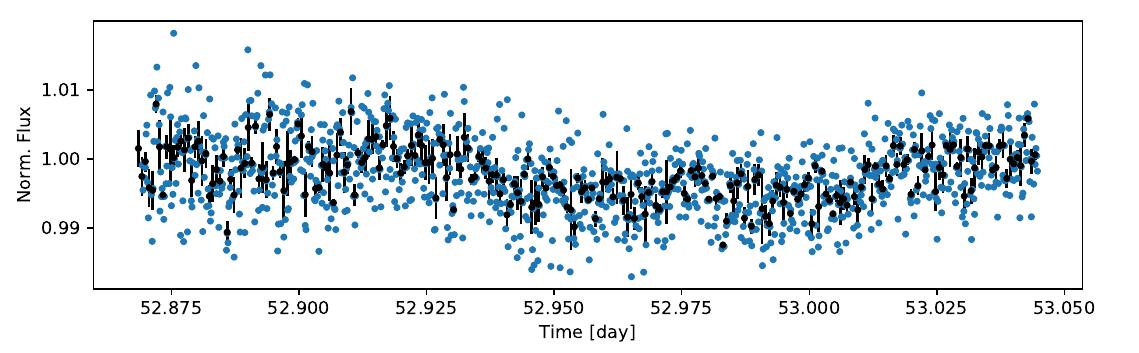
Fig. 2. Differential light curve of the complete data set of Abell15. In the insert one typical time-series is shown.
As we can see in Fig. 2, the data for some nights show an offset in the magnitude (night 09/04 and 11/04). This can be attributed to the bad weather conditions, as there was a presence of clouds and this considerably increased the fwhm. For the same reason there are no data for the night 10/04.
Conclusion
We have search for the possible variability in the light curves of Abell15 using the software Period046. The fourier transform (FT) of the complete data set did not show any significant peak above the noise in the periodogram. Excluding the light curves that have been taken in worst weather conditions and therefore deviate considerably from the average light curves lowered the noise in the FT, however no significant variability emerged in the periodogram. Therefore, with the current data set we were not able to confirm the binarity of the CS. Abell15 was also observed with TESS space mission7 and recent results obtained by Aller et al. 2020 confirm that the light curve does not show variability above 8 mmag at the 95% confidence level mmag confidencelevel 4 .
References
1 Frew & Parker, 2010, PASA, 27, 129
2 Miszalski et al., 2009, A&A, 496, 813
3 Kwok et al., 1978, ApJ, 219, 125
4 Aller A., Lillo-Box J., Jones D., Miranda L. F., Barcelo Forteza S., 2020, A&A, 635, A128
5 Broeg C., Fernandez M., Neuhauser R., 2005, Astronomische Nachrichten, 326, 134
6 Lenz P., Breger M. 2005, CoAst, 146, 53
7 Ricker, G. R., et al. 2015, Journal of Astronomical Telescopes, Instruments and Systems, 1, 014003
First approaches to the exploration and study of micrometeorites in Chile: Understanding the
flow of extraterrestrial material through the geological record
J.P Letelier1, M. Valenzuela2
1 Carrera de geología, universidad andrés bello, santiago, chile
2 Departamento de ciencias geológicas, universidad católica del norte, antofagasta, chile
1. Introduction & Metodology
Micrometeorites correspond to extraterrestrial dust particles that have been captured by Earth surviving their entry by the atmosphere and are believed to represent samples of asteroids and comets1. In Chile, we can find places like the Atacama Desert, which is a unique reservoir for the preservation of extraterrestrial material, both meteorites and micrometeorites2. However, it is not the only place where these fragments can be found. 42 collections were considered, which were obtained from the data collected3,4 and in addition to other collections in the world.5,6,7,8,9,10,11
2. Results
Deep sea sediments, desert, beach sands & lakes
Fig. 2 Distribution of the environments where micrometeorites have been found.
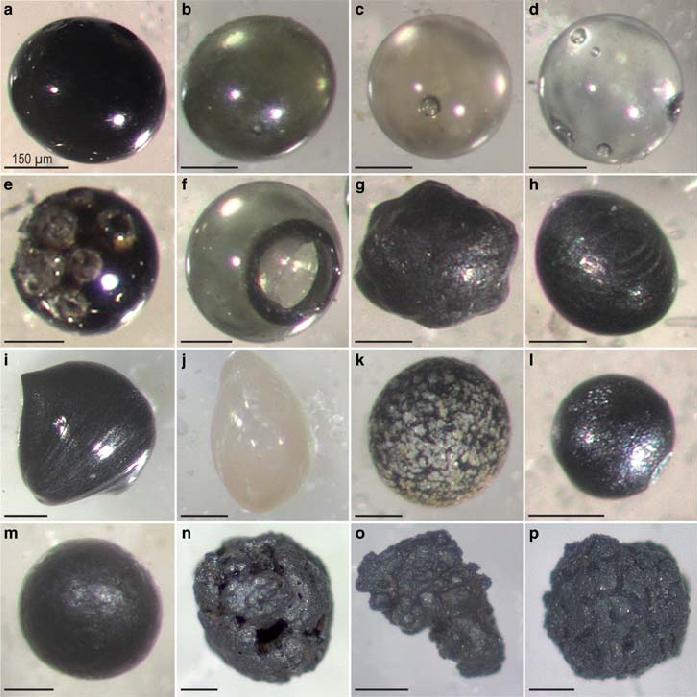
Fig. 1 Stereomicroscopic images of various classes of micrometeorites. (a–f) Glass cosmic spherules showing the most common range of colours and variable vesicularity. (g) Cryptocrystalline cosmic spherule (S-type) with characteristic turtle-back (polyhedral-like) morphology. (h–i) Barred olivine cosmic spherules (S-type) showing characteristic striations. (j) CAT cosmic spherule (S-type) with its characteristic milky white colour. (k) Porphyritic cosmic spherule (S-type). (l) I-type cosmic spherule with its characteristic metallic lustre. (m) G-type cosmic spherule. (n) Partially melted micrometeorite with characteristic scoriaceous structure. (o–p) Unmelted micrometeorites with characteristic angular to sub-angular shapes. Scale bars ¼ 150 mm.12
Fig. 3 Types of rocks sampled where micrometeorites have been found.
Limestones Halite
Chert Claystones
Fig. 4 Localities where micrometeorites have been obtained from: (a) deep-sea sediments, desert, beach sands & lakes environment, (b) sedimentary rocks and (c) polar ice sediments.
Ho ocene-Pleistocene not indicated
Pleistocene Holocene-Pleistocene(?)
Holocene Holocene-Pleistocene(?)
Pleistocene(?) Pleistocene
Holocene-P iocene not indicated
Fig. 5 Geological periods that characterize the samples obtained in: (a) deep-sea sediments, desert, beach sands & lakes environment, (b) sedimentary rocks and (c) polar ice sediments.
Fig. 6 Types of micrometeorites that characterize the samples obtained from: (a) deep-sea sediments, desert, beach sands & lakes environment, (b) sedimentary rocks and (c) polar ice sediments.
3. Discussions & Conclutions
- The main places for the search for micrometeorites in Chile correspond to the Antarctica (72%) and the Pacific Ocean (42%). Both places could be accessible through government initiatives (INACH and/or ANID).
- There is an important gap in unexplored geological time, however when considering the reservoirs (e.g. sedimentary rocks) where micrometeorites have been most found, we can draw a first line in view of future explorations in unconventional places.
- The analysis of the world statistics of micrometeorite collections suggests that in Chile there would be an exploration potential to find these fragments.
4. References
1: Genge et al., 2008 Meteoritics & Planetary Science 43, 497–515.; 2: Valenzuela et al., 2015b. Resumen expandido para el XIV Congreso Geológico Chileno, La Serena, Chile.;3: Taylor & Lever, 2001. In: Peucker-Ehrenbrink and Schmitz B. (eds) Accretion of extraterrestrial matter throughout Earth’s history, pp. 129–142.; 4: Suttle & Genge, 2017c Earth and Planetary Science Letters 476, 132-142; 5: Fioretti et al., 1998. Meteoritics & Planetary Science, vol. 33, p. A48.; 6: Nakamura et al ., 1999. Antarctic Meteorite Research 12, 183-198; 7: Badjukov and Raitala, 2003. Meteoritics & Planetary Science, 38: 329-340; 8: Duprat et al., 2007. Advances in Space Research 39, 605-611; 9: Rochette et al., 2008. Proceedings of the National Academy of Sciences 105, 18206-18211; 10: Akulov et al., 2014. Doklady Earth Science 454: 193-198 ; 11: Goderis et al., 2020. Geochimica et Cosmochimica Acta, 270, 112-143. 12: Folco & Cordier, 2015. European Mineralogical Union Notes in Mineralogy, vol 15, p. 253-297
(a)
(b) (c)
(a)
(b)
(c)
(a)
(b)
(c)
Potential areas to find presolar grains: fine-grained material in CO3 chondrites
Pinto, Gabriel A.1,2; Marrocchi,Yves2; Olivares, Felipe1, and Martínez, Rodrigo3
1INCT, Universidad de Atacama, Copayapu 485, Copiapó, Chile
2CRPG, CNRS, Université de Lorraine, UMR 7358,Vandoeuvre-lès-Nancy, 54501, France
3Museo del Meteorito, San Pedro de Atacama, Chile
Background
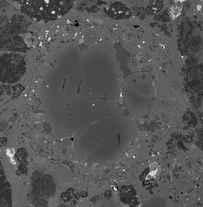
Chondrules aresolidifieddropletsinsidechondriteswhichformedintheearlysolarsystem [1]. These chondrules are surrounded by a fine-grained rims (FGRs) composed of porous assemblages of Fe-Ni metal beads,amorphous silicates and nanophases [2,3].The latter are dust particles (the so called presolar grains, PSG) that composed the solar nebula and survived the homogenization events during solar system formation [4]. These PSG are enriched in FGRs surrounding chondrules in CO carbonaceous chondrite (Fig. 1). In order to determine the abundance of PSG and their astrophysical source, we present a preliminary studybasedonscanningelectronmicroscopeobservationsandX-raysmapsof30FGRsinsix COchondritesfoundintheAtacamaDesert.
Fig 1. Abundance of PSG in FGRs of three carbonaceous chondrites: CO [5,6]; CR [7]; and CM [8].The abundance of grains (relative to each FGR) show that CO has 5 times more PSG than CR and ~20 times more than CM
Coarse-grained
Ch_5b
Fig 2. (a) Backscatter electron image of type II chondrule (Ch_5b) with a multilayer rims composed of (I) porous (11.26 vol%) coarsegrained material (>10 µm) in direct contact with the chondrule and (ii) compact, low porosity (1.8 vol%), fine-grained phases (<5 µm).(b)zoomindetail andmap(c)areshown zoomofchemicalcomposition.Ol=olivine
Results
FGRs were described around 25 FeO-poor type I, 4 FeO-rich type II and one Al-rich chondrule.Someobservationare:
No significant difference of FGRs among the different types of chondrules.
13 FGRs studied in detail show amorphous silicates with variable amountsofMgandFe(Fig.2c).
2/3 of FGRs are characterized by present calcium sulfate (i.e.,anhydrite, [2, 3]), likely resulting from fluid circulation within the asteroidal parent-body or alteration process in theAtacamaDesert.
Minor phases are Ca-phosphates, chromite, Ca-rich pyroxene, Fe-Ni alloys,sulphides and an Al-rich phases that might correspond to phyllosilicates(<2µm).
FinalRemark
These results are in good agreement with previous descriptions in the CO carbonaceous chondrite. In the near future, we will determine the abundance of PSG in FGRs surrounding the different types of chondrules as well as their astrophysical source.
Reference
[1] Russell, S. S., Connolly Jr, H. C., & Krot, A. N. (2018). Cambridge University Press. [2] Zanetta, P. M. (2019). Doctoral dissertation, Lille 1. [3] Brearley, A. J. (1993). GCA, 57(7), 1521-1550. [4] Zinner, E. 2014, mcp, 1, 181213. [5] Bose, M., Floss, C., Stadermann, F. J., Stroud, R. M., & Speck, A. K. (2012). GCA, 93, 77-101. [6] Haenecour, P., Floss, C., Zega, T. J., Croat, T. K., Wang, A., Jolliff, B. L., & Carpenter, P. (2018), GCA, 221, 379405. [7] Leitner, J., Vollmer, C., Floss, C., Zipfel, J., & Hoppe, P. (2016). EPS Letters, 434, 117-128. [8] Leitner, J., Metzler, K., Vollmer, C., Floss, C., Haenecour, P., Kodolányi, J., ... & Hoppe, P. (2020). MaPS, 55(6), 1176-1206.
The frequency of Planets in Young Clusters from the NGTS Survey
Douglas Rodrigues
Supervisor: James Jenkins
Departamento deAstronomía, Universidad de Chile
Background
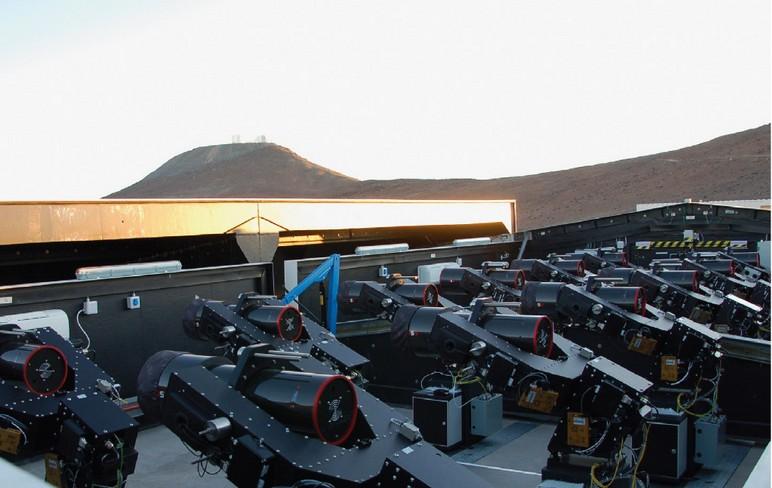
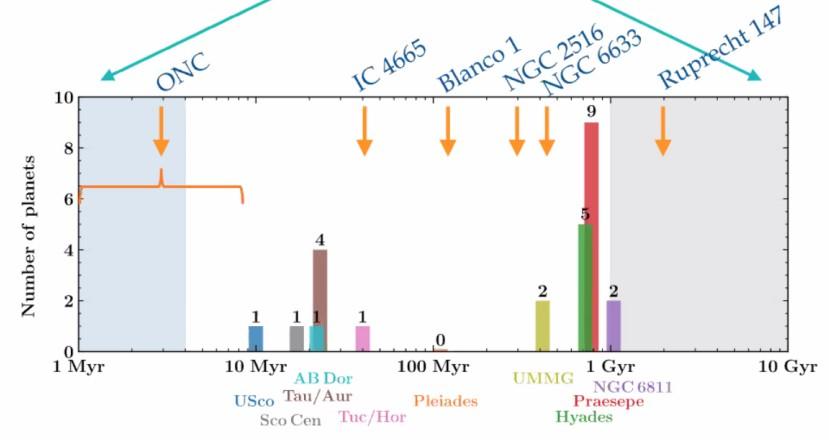
The Next Generation Transit Survey1 (NGTS) is composed of twelve robotic 20cm telescopes designed to search for transiting planets. It has detected dozens of planets (NGTS-4b2, 10b3, etc.) besides aiding with follow-up observations from surveys such as TESS; leading to discoveries such as the ultra-hot neptune planet LTT9779b4. The NGTS team carries out several projects alongside, one of which is the cluster program that searches for extra-solar planets in young clusters. This work will provide an estimate of the
Fig 1 - The twelve NGTS telescopes at ESO’s Paranal observatory located in Chile.
planet distribution in young clusters leading to constraints in the subject of planet formation and evolution. Here we focus on the Blanco 1 cluster5 which is located in the Sculptor constellation sitting nearly 260 pc away with stars age within 100-150 Million years old.
Methodology
Light curves
References
Two or more dips observed
Eyeballing
Light curve Modeling Constraining P > Pmin
Planet parameters estimation
Single dip observed Request more Data?
1- Bayliss, D. et al.: NGTS — Uncovering New Worlds with Ultra-Precise Photometry.
2- West, R. G. el al.: NGTS-4b: A sub-Neptune transiting in the desert
3- McCormac, J. el al.: NGTS-10b: The shortest period hot Jupiter yet discovered
4- Jenkins, J. et al: An ultrahot Neptune in the Neptune desert
5- Blanco, V. M. et al.: A New Galactic Star Cluster in Sculptor
Results
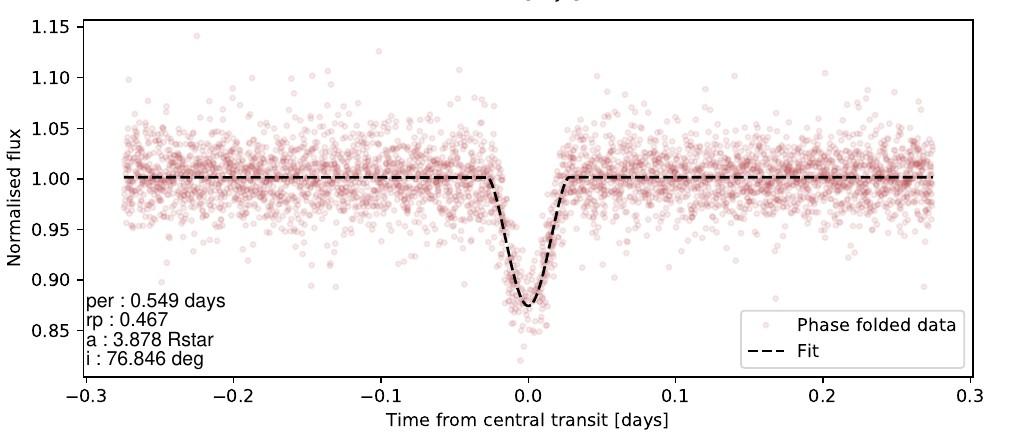
An eclipsing binary with approximately half a day period in Blanco 1. Dotted line is the best-fit model from batman package.
A mono transit event missed by our search algorithm but discovered by eyeballing. Blue points show the 13s cadence data and black points the 5min data. By eyeballing the lightcurves we discovered 8 possible mono transit candidates such as this. Thereafter, we characterize their properties through modeling, and assess if they are worthy of further follow-up observations.
Cluster age from NGTS as a function of discovered planets. Only 8 planets have been detected for clusters with ages below 100Myrs.
Transit
Hydrodynamical accretion models to explore SMBH formation in Population III clusters
Paulo Solar, Dominik Schleicher
E-mail : pasolar@udec.cl
Abstract
109[ M ⨀]
Departamento de astronomía, Universidad de Concepción, Concepción, Chile
Supermassive black holes (SMBHs) have an enigmatic origin and more than 100 SMBHs with masses around of at very high redshift Z>6 were discovery in the last years (Bañados, 2018 ; Schleicher, 2018). The formation of the first SMBHs is still an open question in cosmology and one of the pathways to explain their formation in the early universe is the creation of seeds of SMBHs through collisions and mergers of stars in massive clusters with a high stellar density. In this work we explore aspects of SMBH seed creation and formation through collisions according to the model proposed by (Boekholt, 2018), using hydrodynamic simulations to improve the realism of the implementations and the coupling of the different physics ingredients.
Method
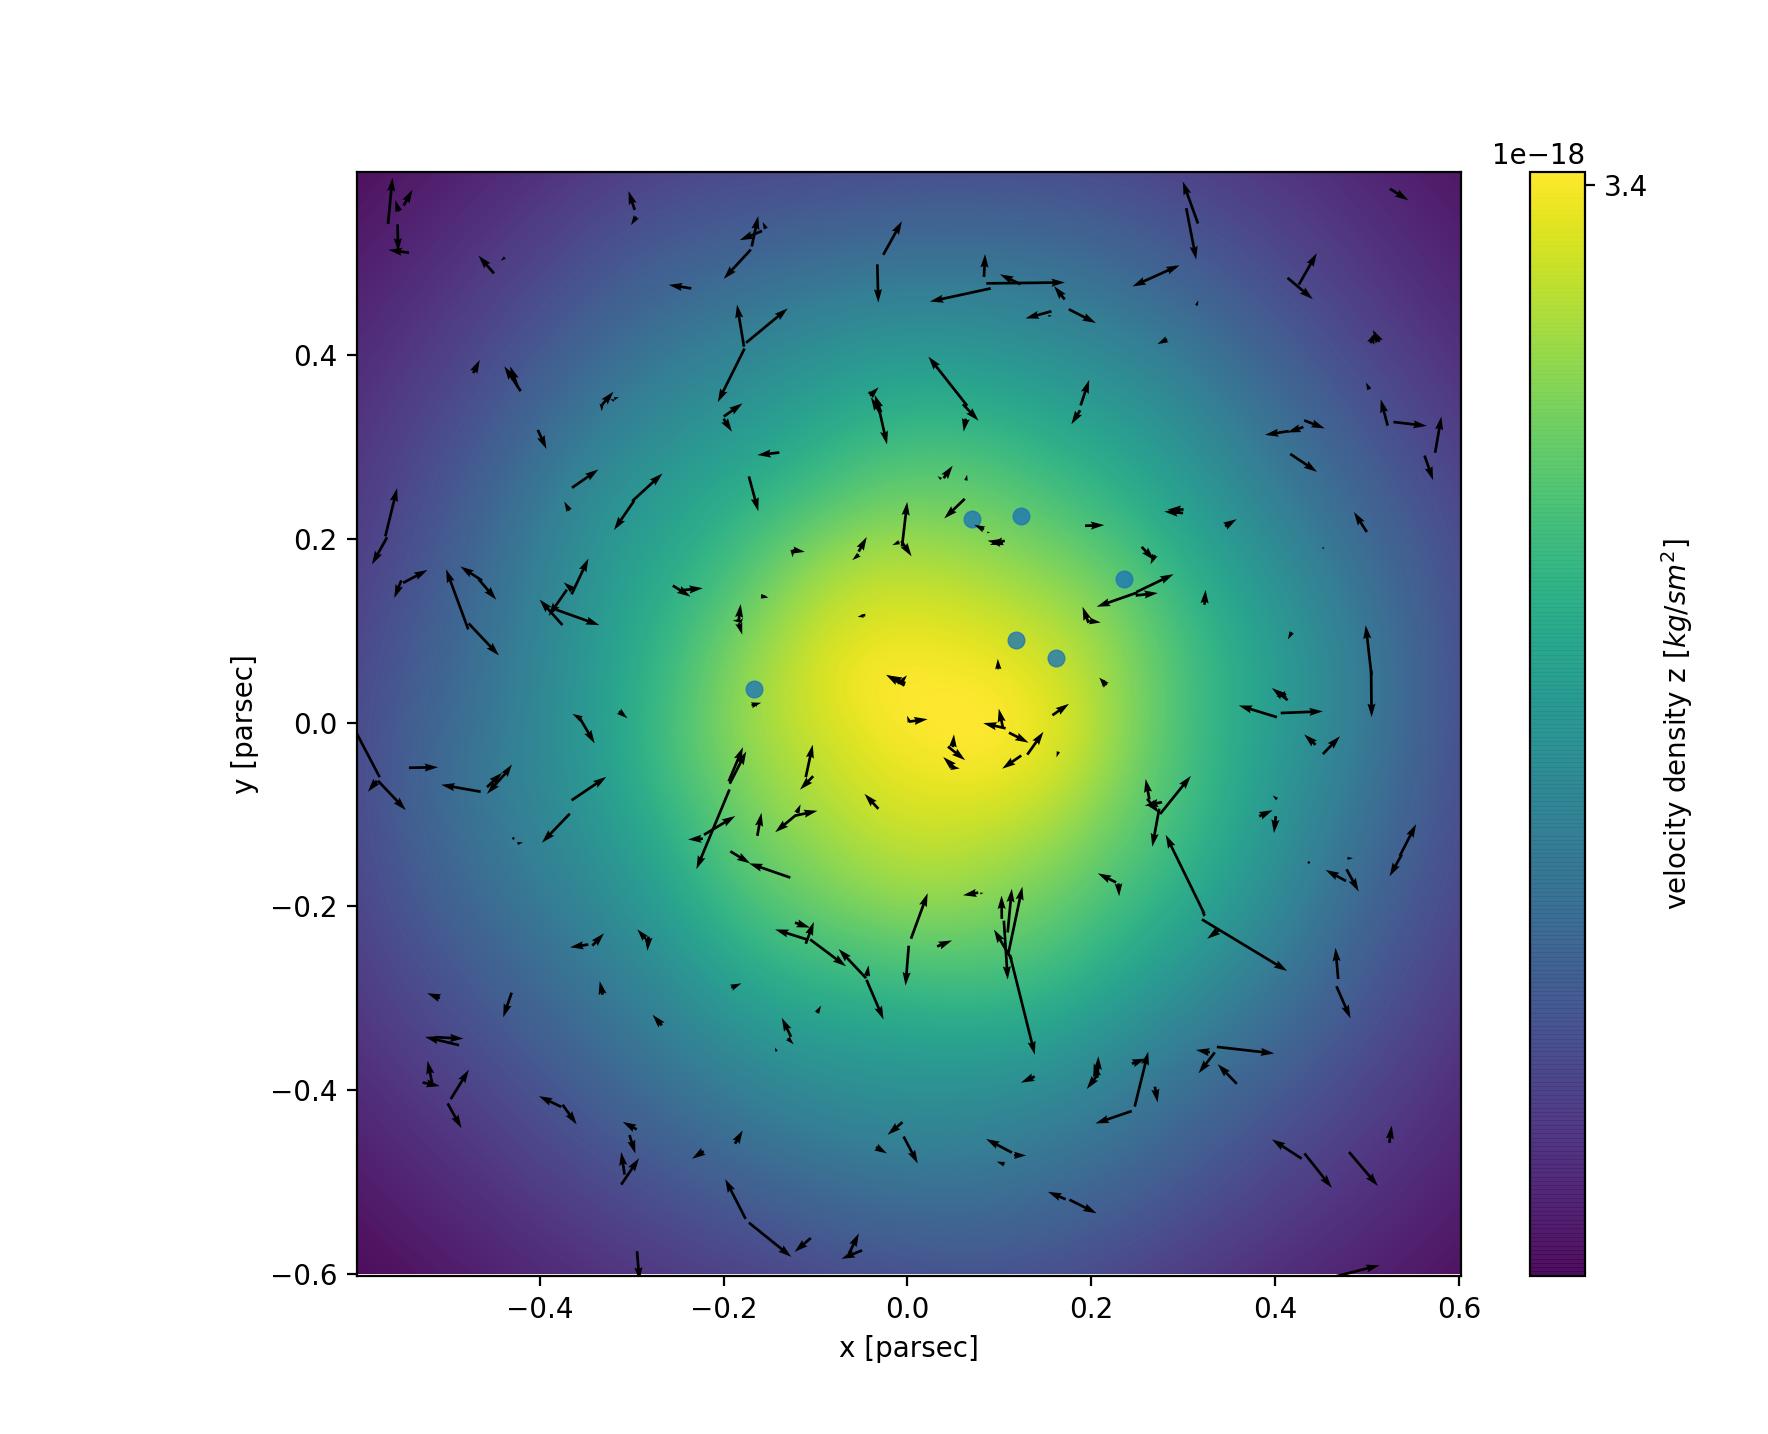
The simulations were generated with the Astrophysical Multipurpose software Environment (AMUSE), modeling the accretion of a massive object (modeled with a sink particle) within a primordial gas cloud. We model the spherical gas cloud with a Plummer distribution with a mass of and of [pc]. We combine the Smoothed Particle Hydrodynamics (SPH) code Gadget2 (Springel et al. 2001; Springel, 2000) with the tree code gravity BHTree (Barnes & Hut 1986) to solve the self-gravitation of the gas and the gravity of the sink particles. The sink particles have different sets of masses and interaction-zones. In this work the accretion models were based on (Hubber, 2013), where a spherical symmetric radial accretion and a disc accretion were implemented, as well as additional criteria for the creation of new sink particles.
10 5[M⊙] R v ir 1.0
Figure 1: Density projection of a collapsing primordial gas cloud with sink particles in the center with a masses ofMs = 1.0[M⊙]
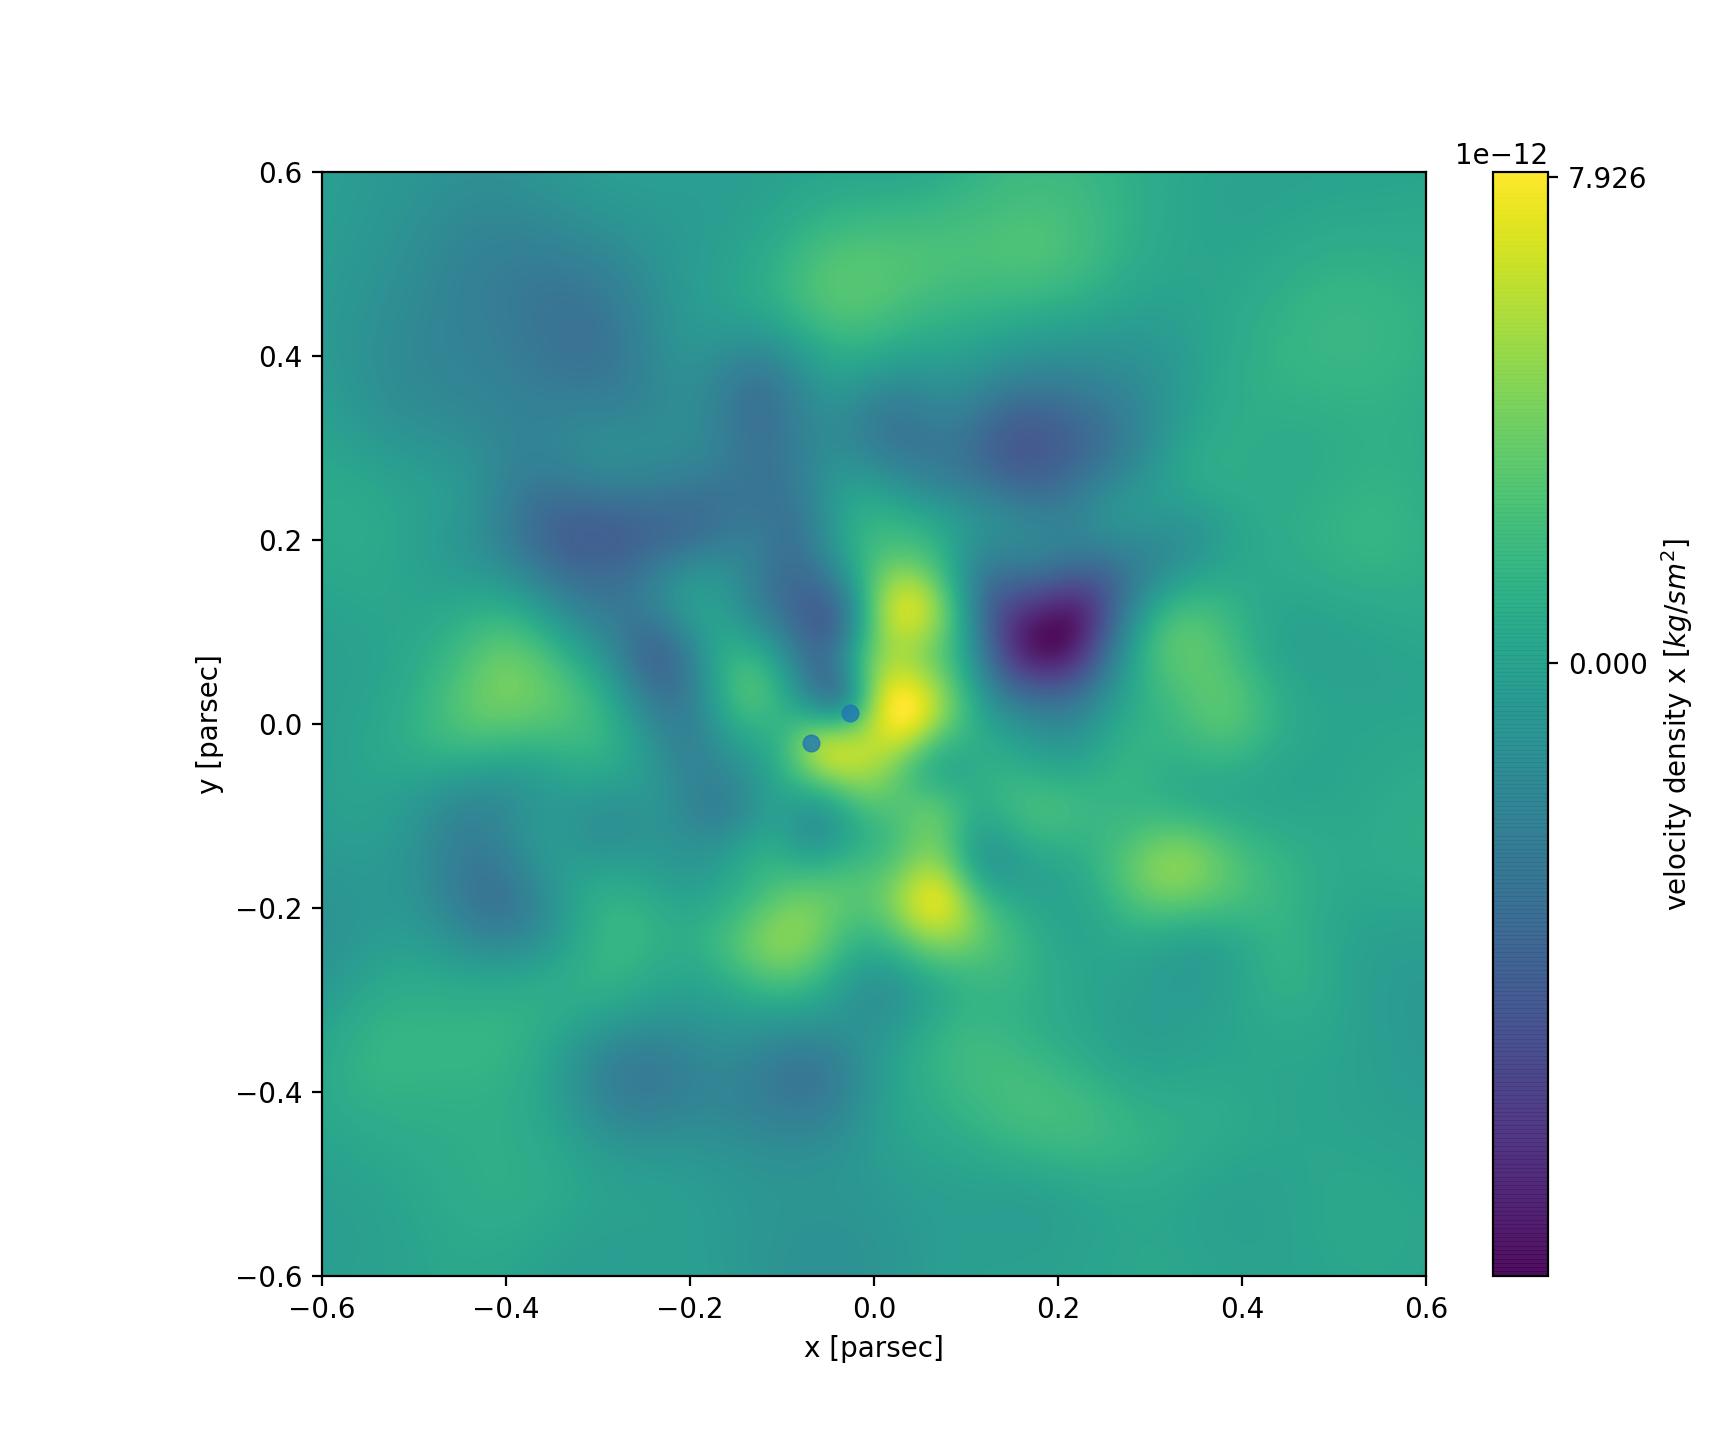
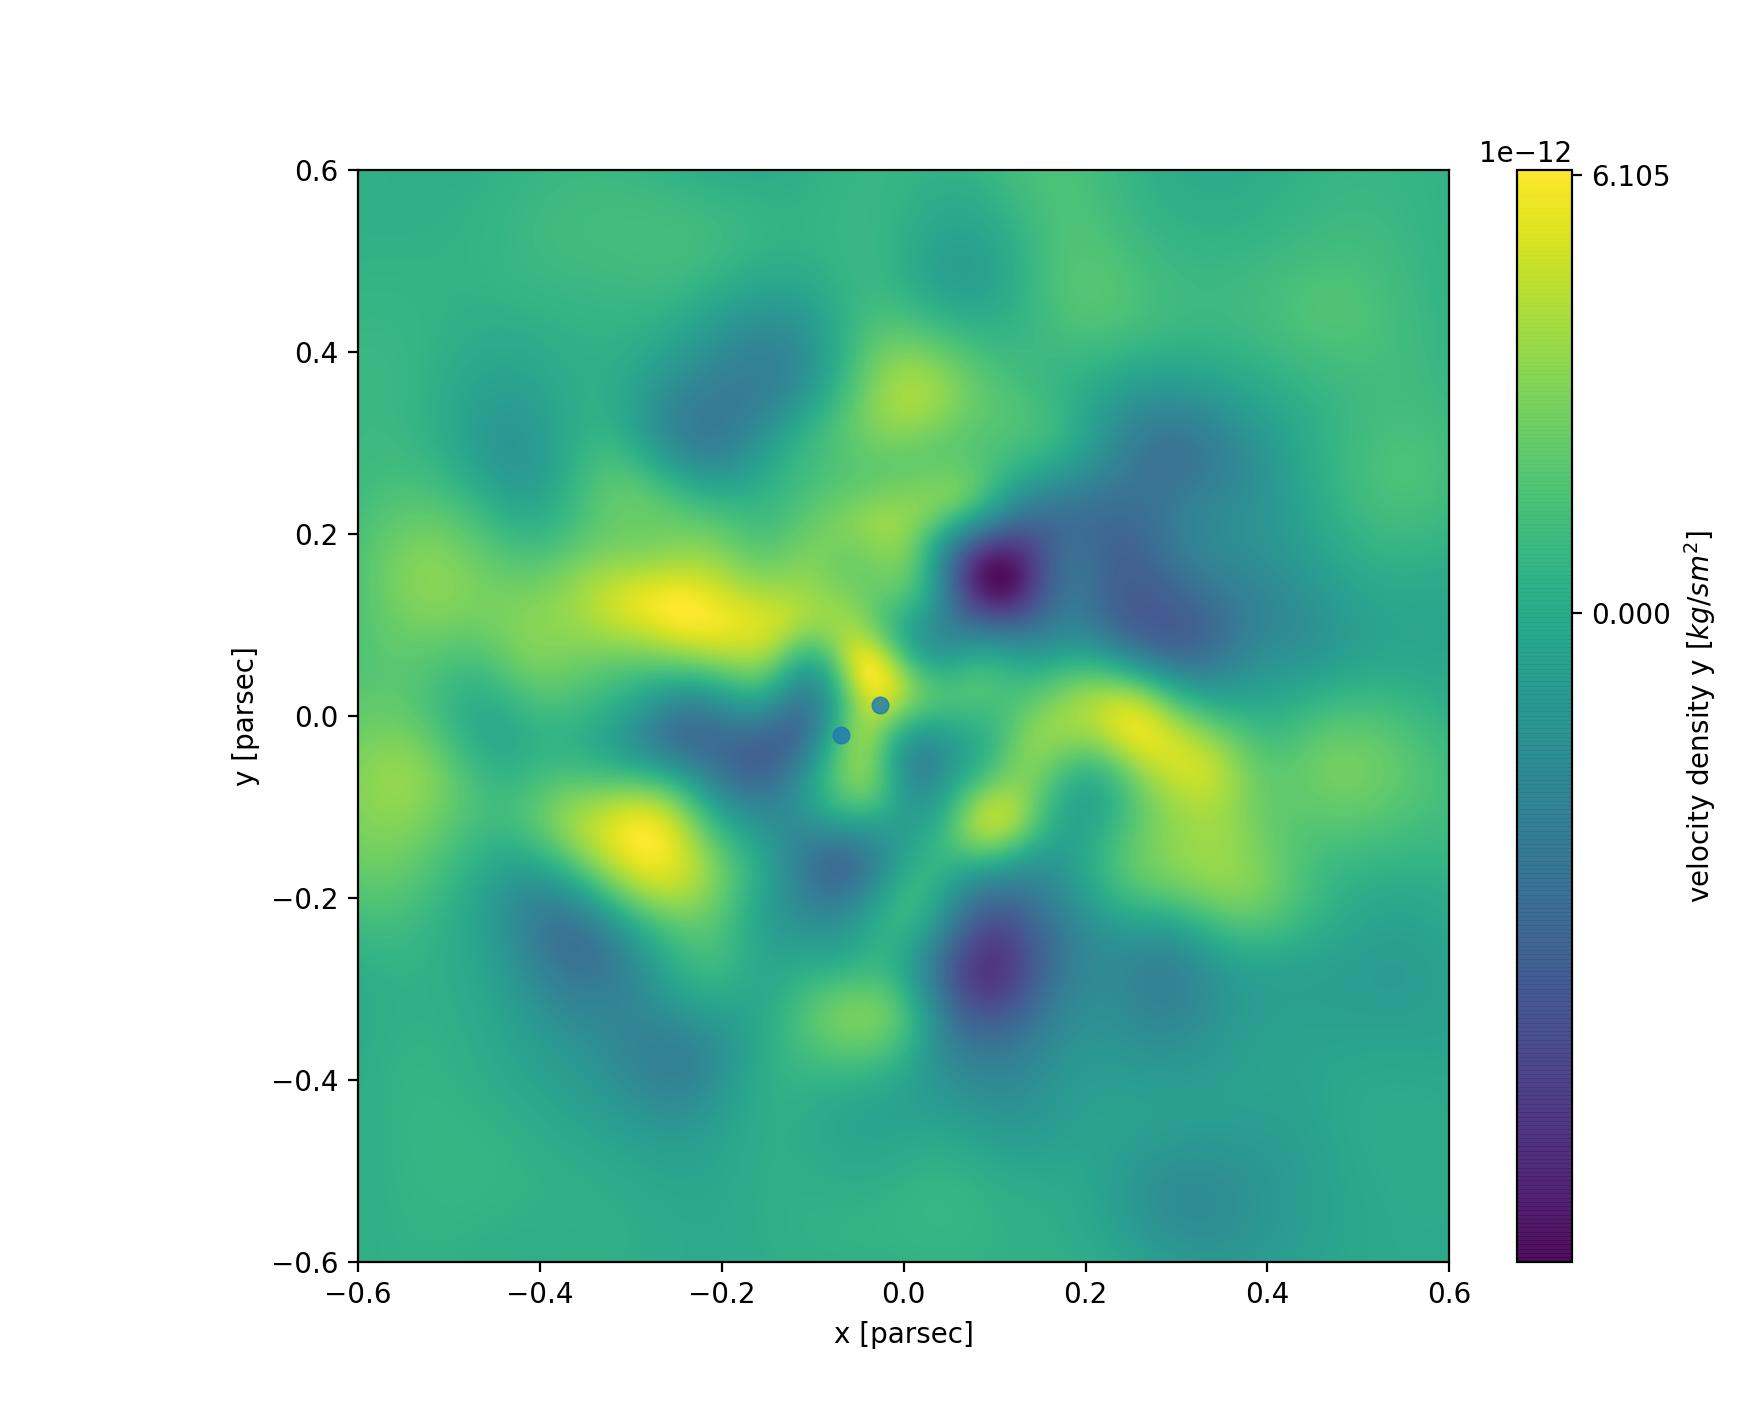
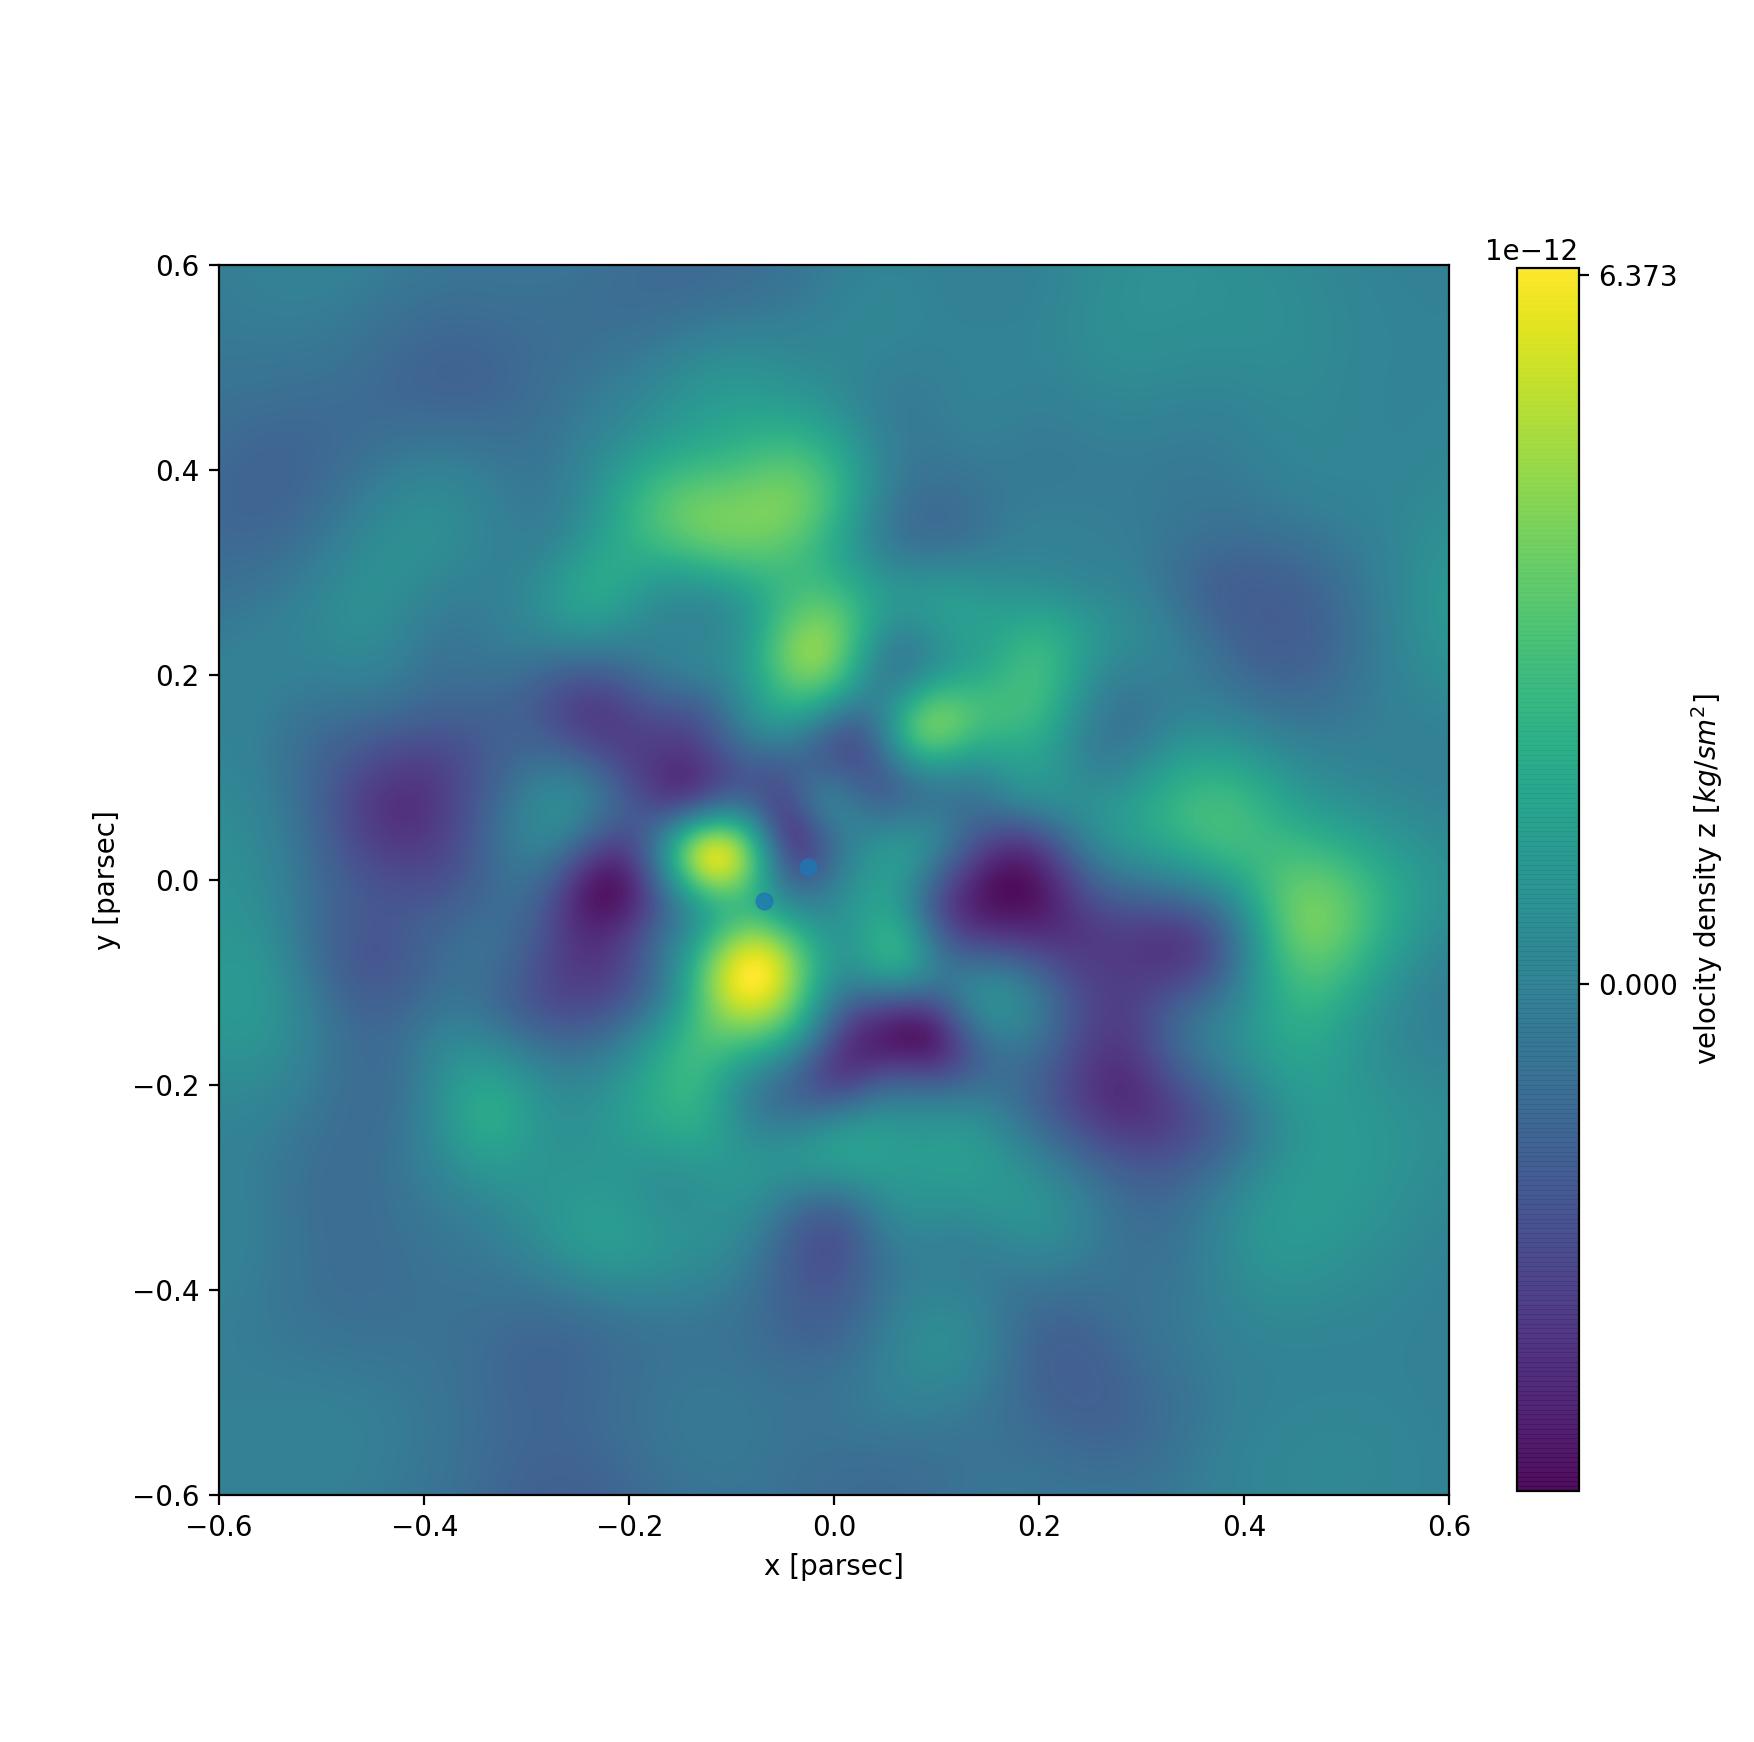
Figure 2: Projection of velocity field density by the components X, Y, Z.
Accretion mode criteria:
Preliminary Results
Based on the preliminary results, accretion provides a viable mechanism to explain the formation of the first massive seeds of black holes through the mechanism of accretion-induced collisions in the dense protostellar systems of Pop. III.
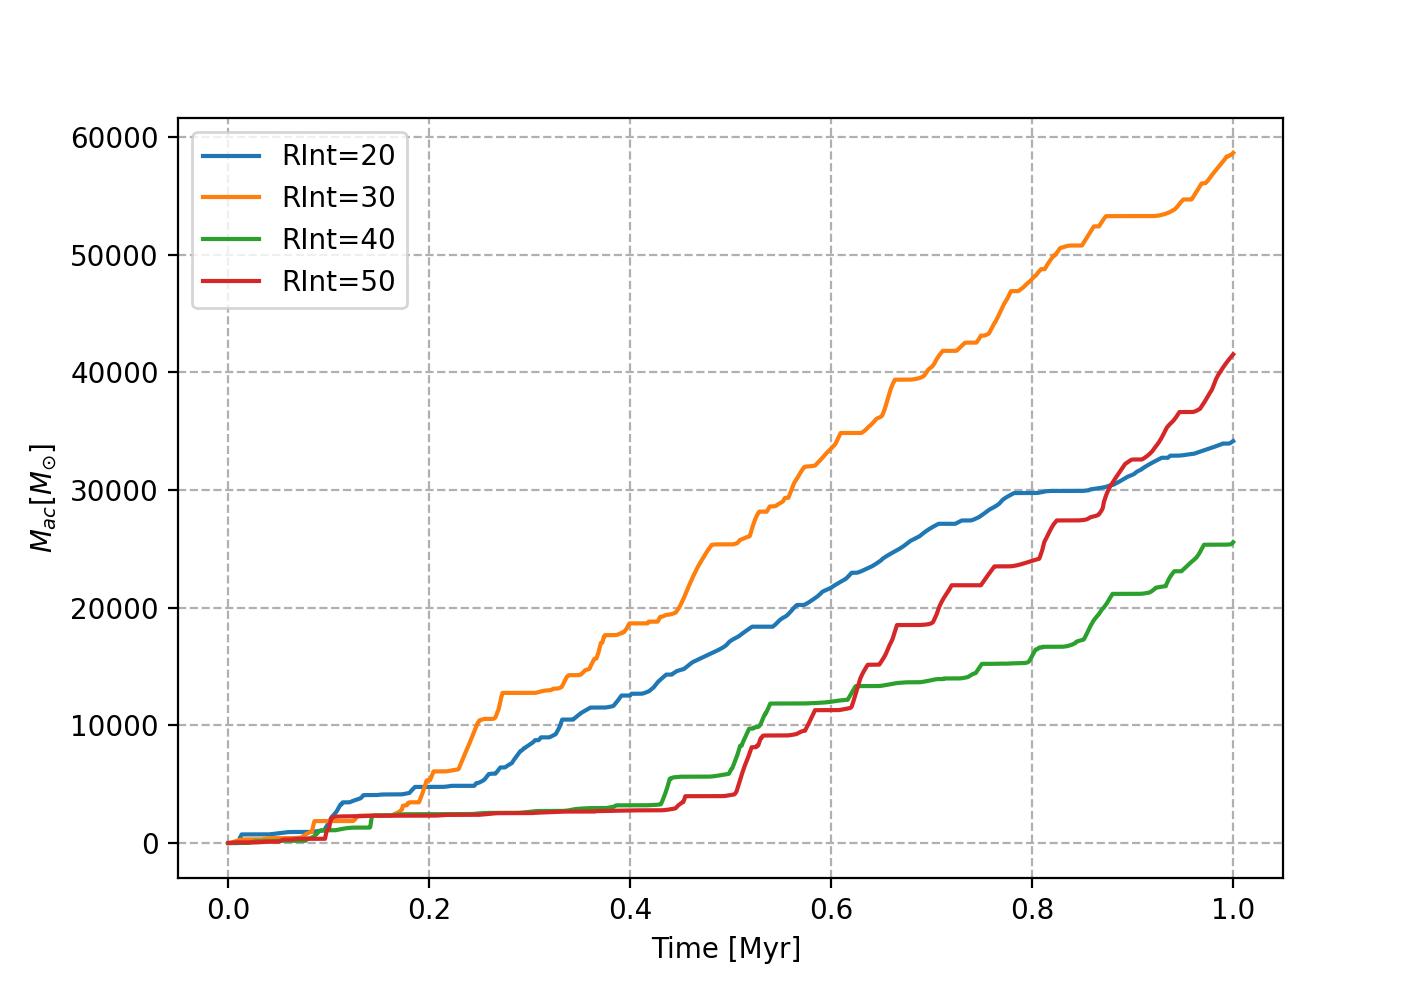
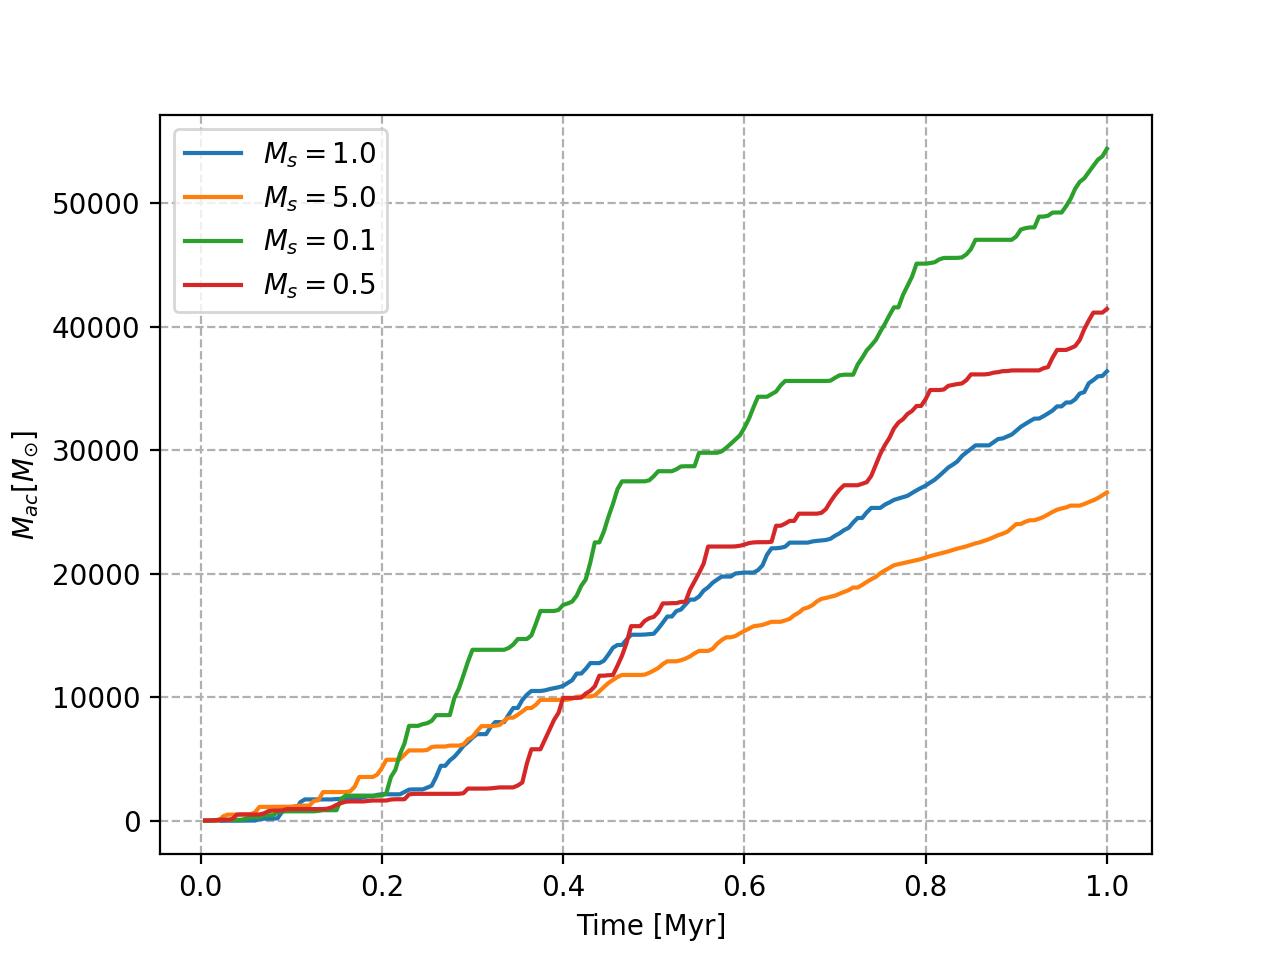
In figure 3 we can see that the amount of mass accreted by the central object is in accordance with what is expected, as well as in figure 4 we observe it for different values of the mass of the central object. We are going to apply modeling including collisions and resulting mergers of sink particles (Reinoso, 2018), extend the study to different initial conditions of the gas cloud, add an analysis of the mass loss by (Alister Seguel,2020). In addition, we intend to increase the resolutions of the simulations to have a better physical interpretation.
Figure 3: Accreted mass by a central object whit different interaction radii, such that the initial amount of SPH particles is N = 20, 30, 40, 50 in a gas cloud of mass and Mga s = 10 5[ M⊙ ]
Figura 4: Accreted mass by a central object with different masses 0.1, 0.5, 1, 5 and a constant interaction radii in a gas cloud of mas and Ms = Mga s = 10 5[ M⊙ ] Rv ir = 1.0[ p c ]
E. Camacho1, F. Bauer1, P. Sánchez-Sáez1,2
1 Millennium Institute of Astrophysics (MAS), Nuncio Monseñor Sótero Sanz 100, Providencia, Santiago, Chile
2 Pontificia Universidad Católica de Chile, Casilla 306, Santiago 22, Chile
Motivation
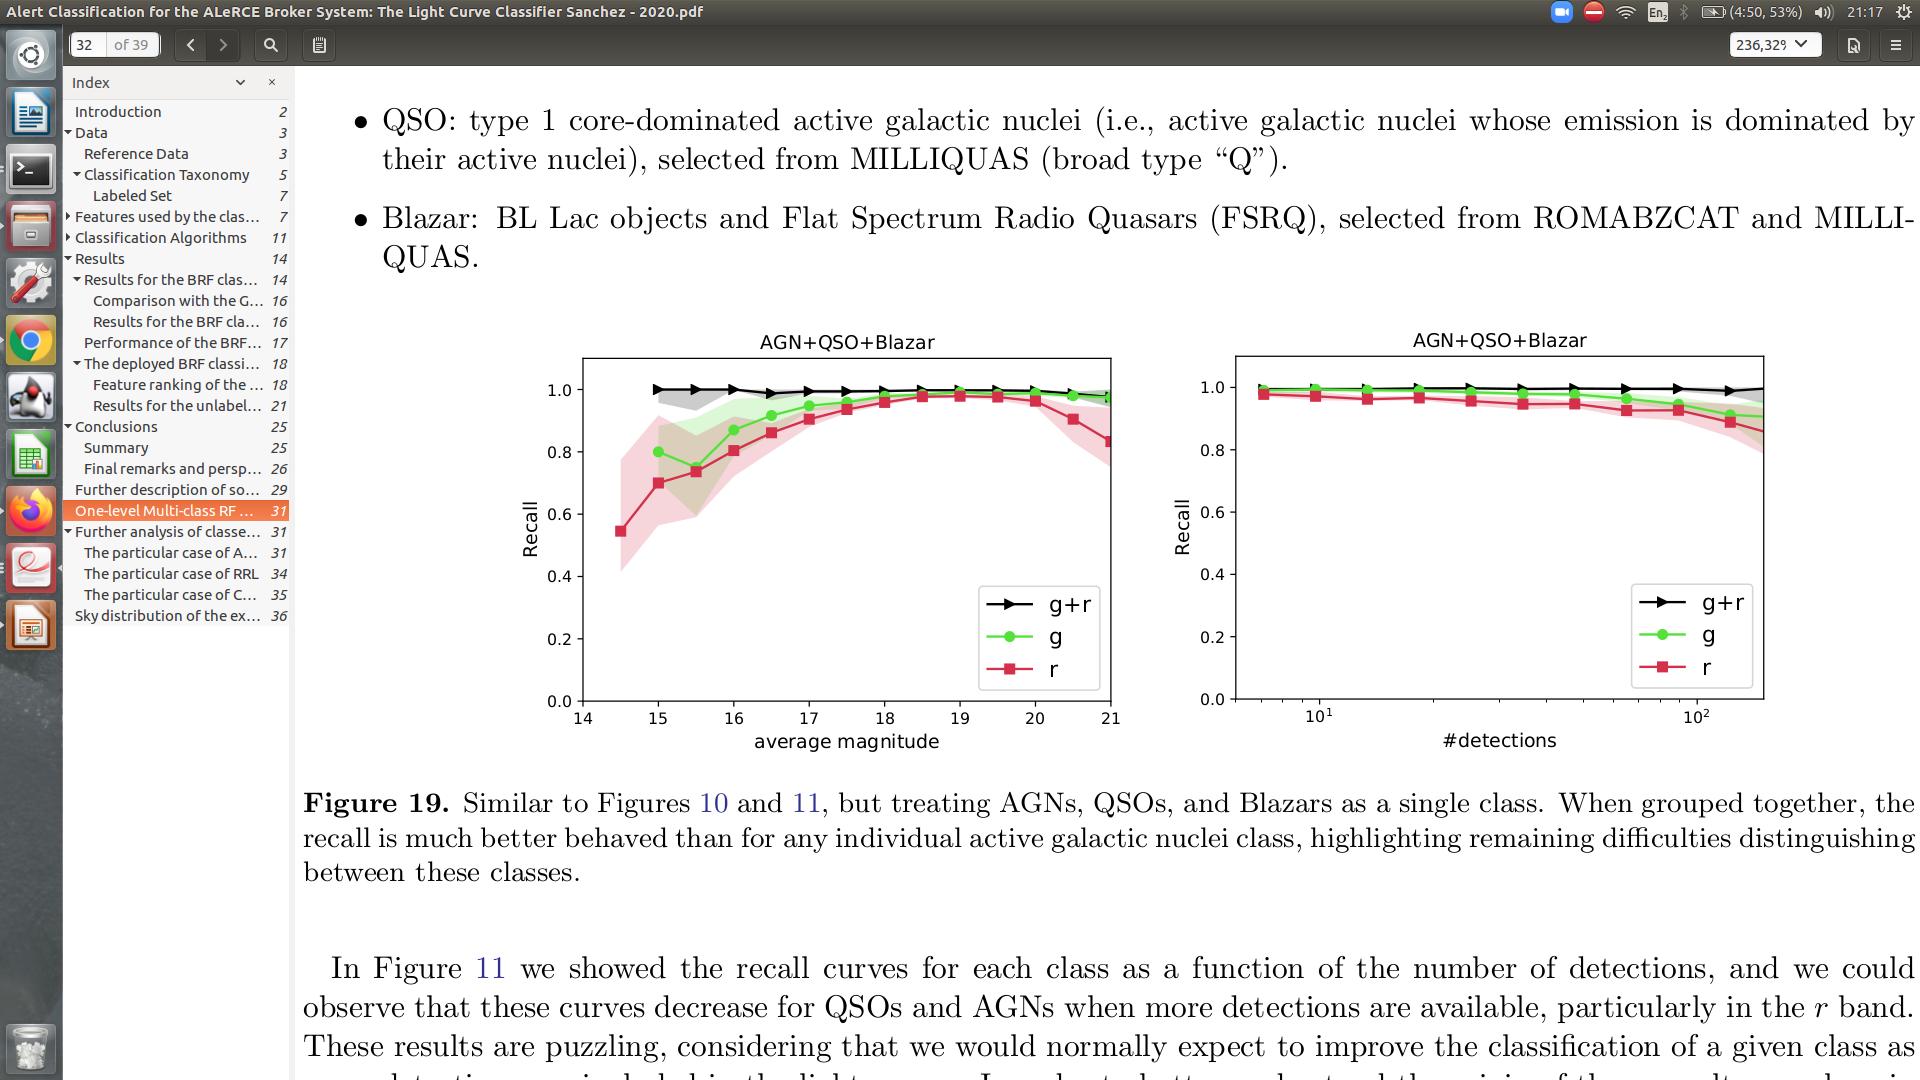
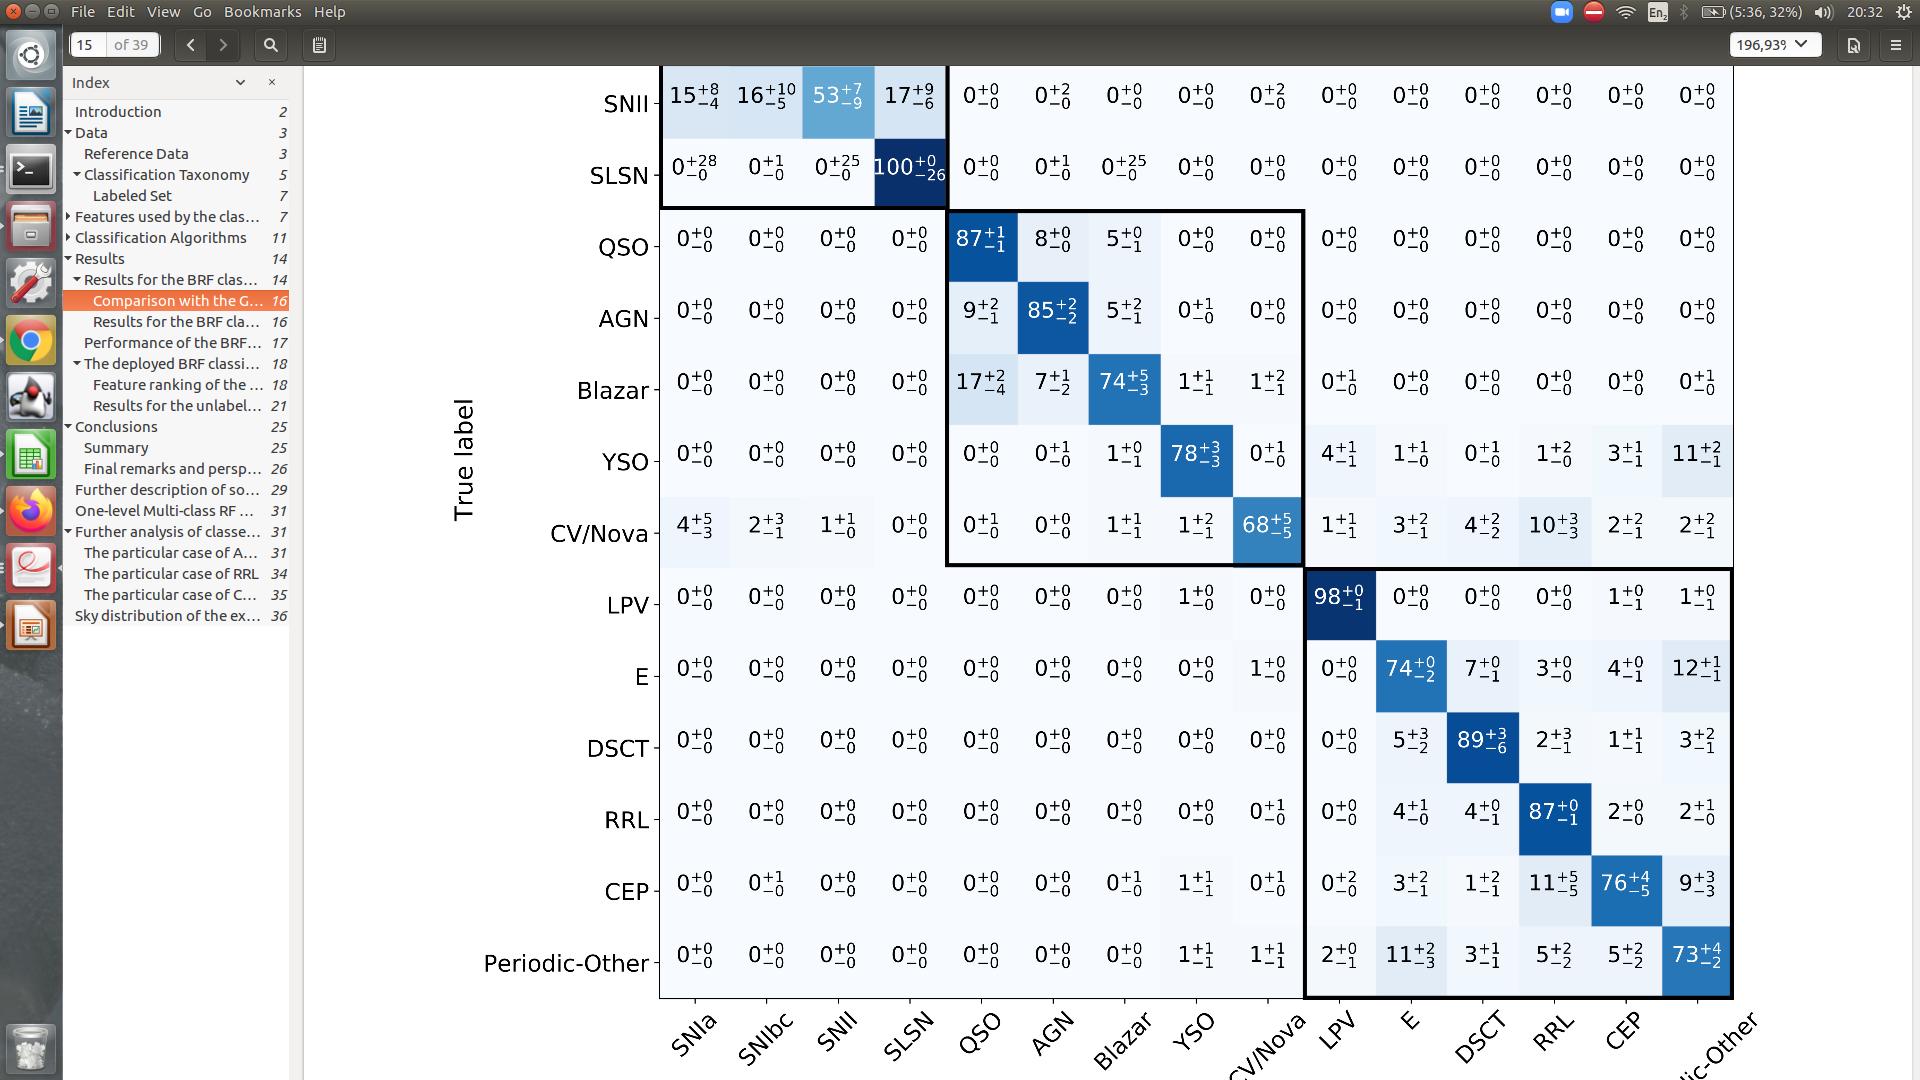
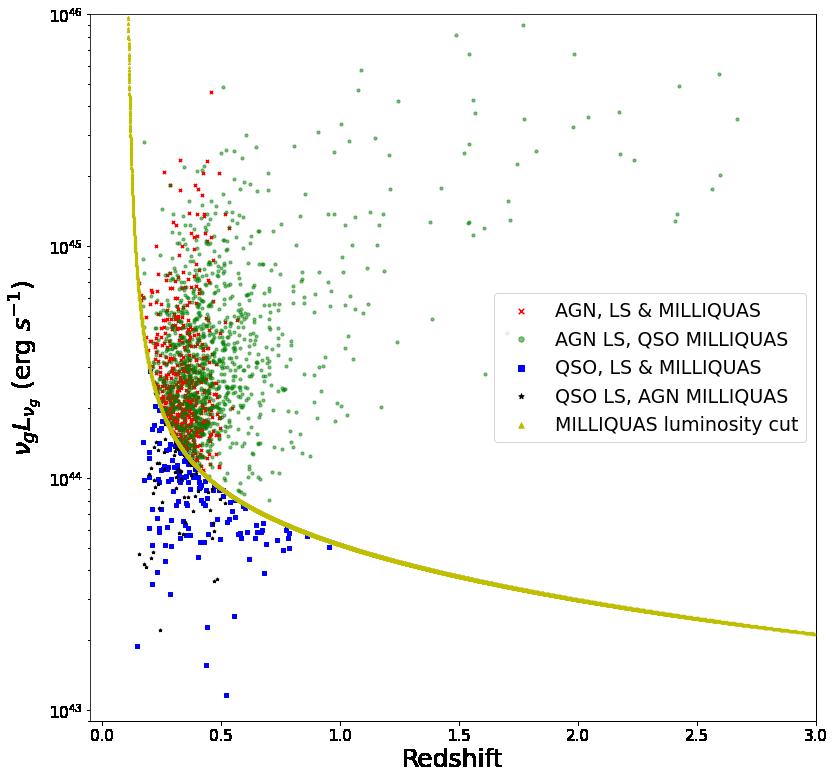
The LC classifier has a good performance selecting active galactic nuclei as a single class, but some issues still remain regarding the separation of AGNs, QSOs, and Blazars.
Fig 1. a) Recall vs average magnitude and number of detections in g, r, and g+r bands for AGNs+QSOs+Blazars.1 b) LC classifier confusion matrix for AGN and QSO a) b)
Identifying the problem
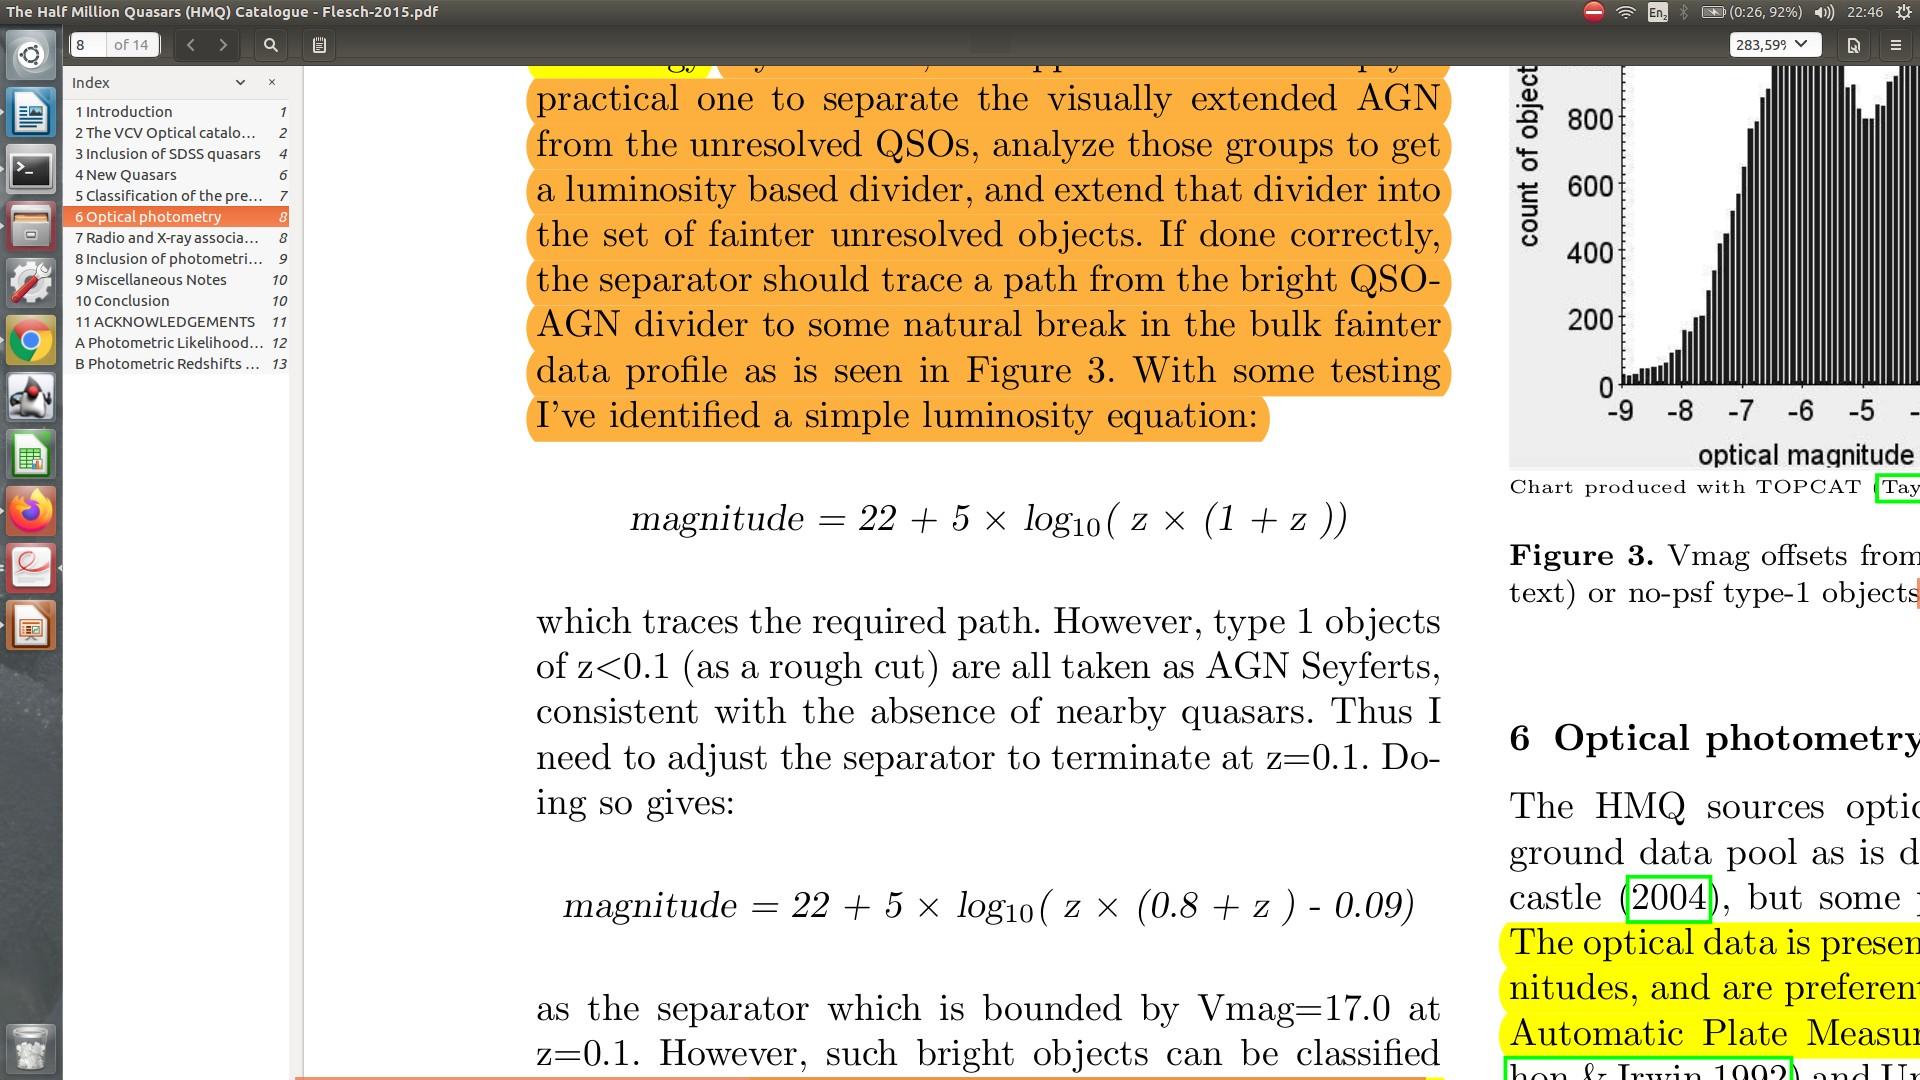
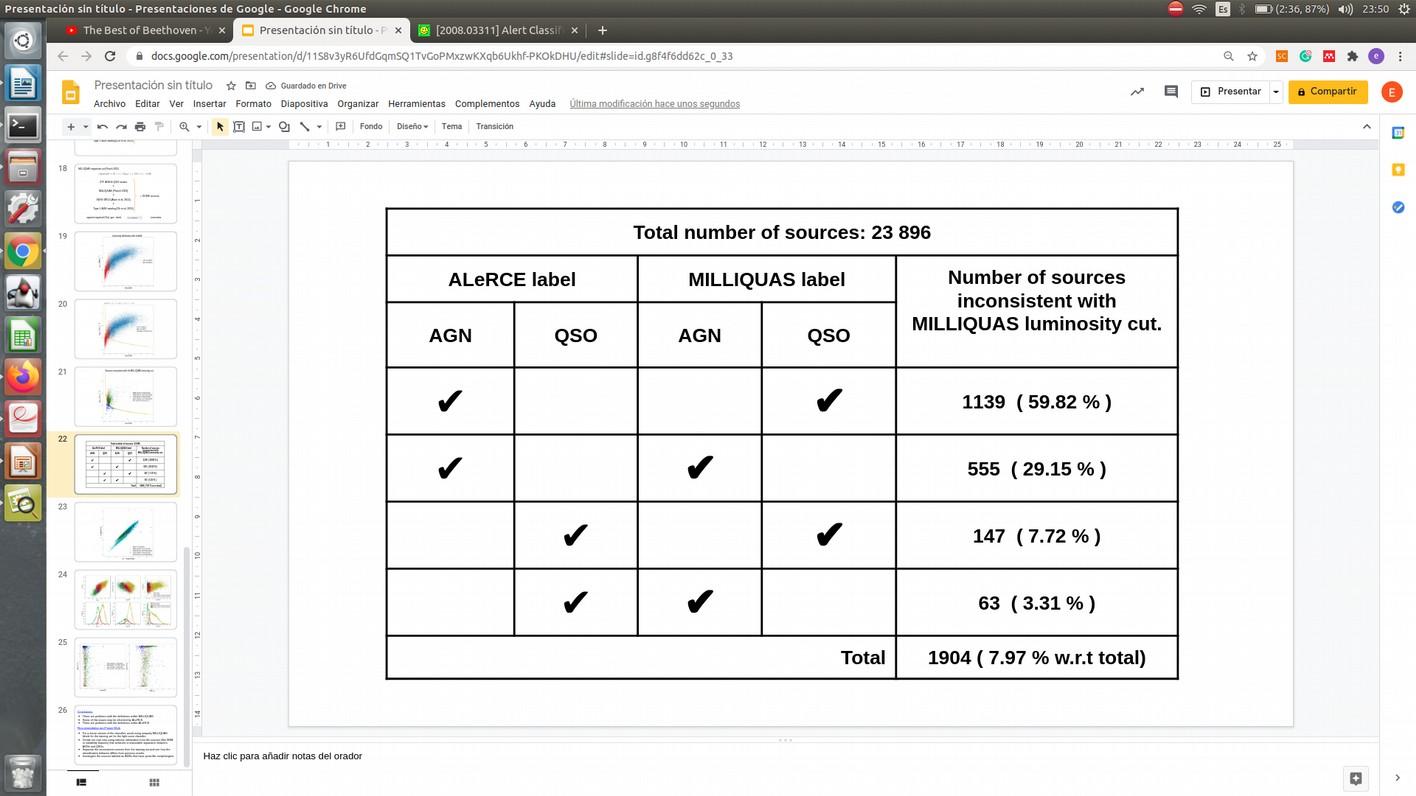
Fig 2. Milliquas luminosity cut and misclassified sources.
Results and analysis
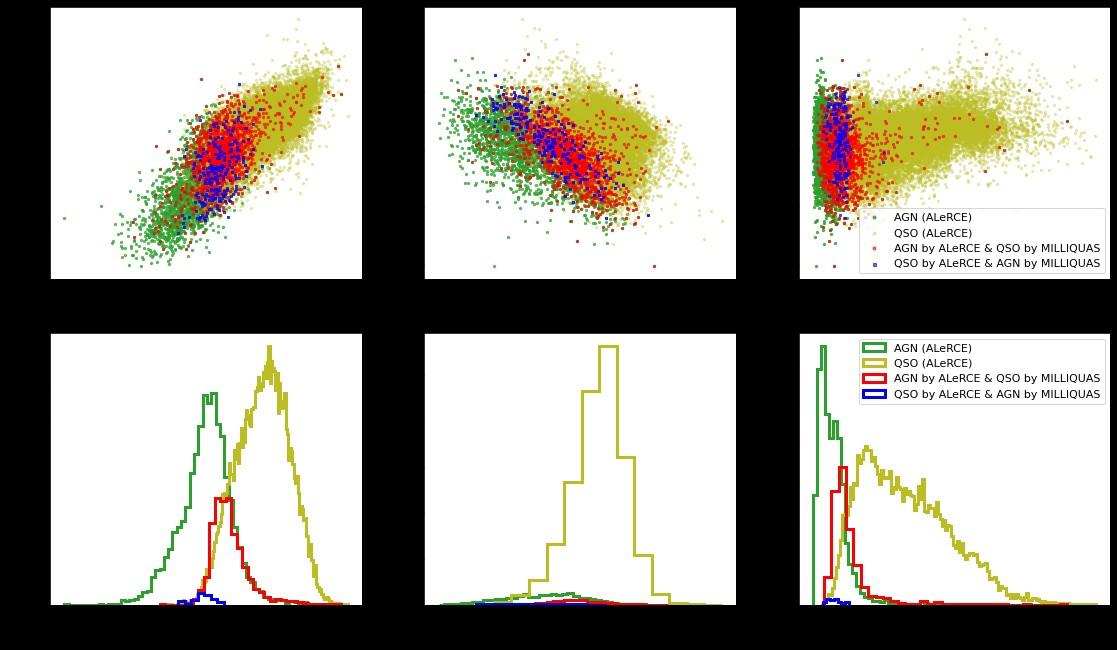
Fig 3. Distribution of spectral properties for AGNs and QSOs from the labeled set and for misclassified sources
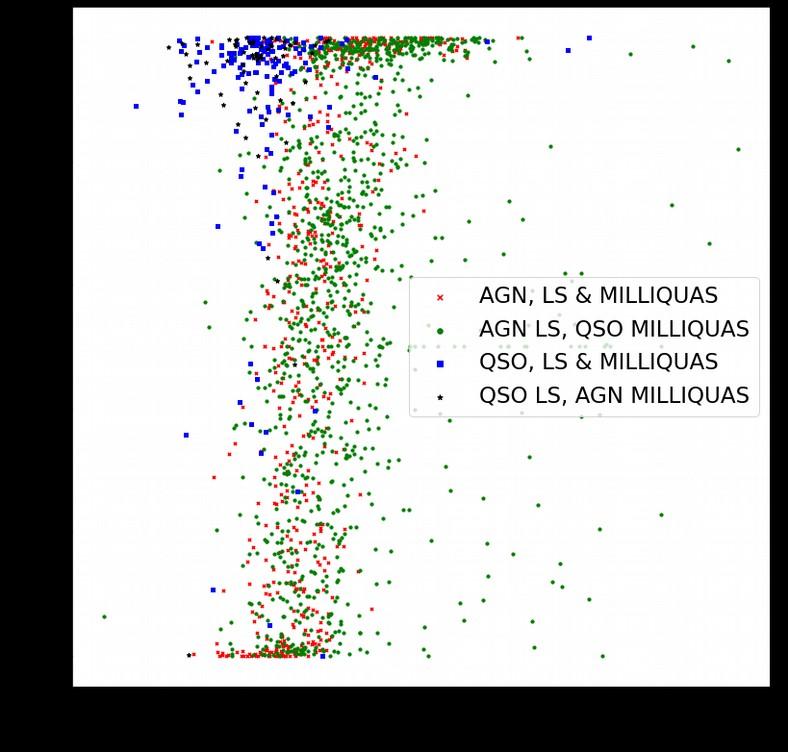
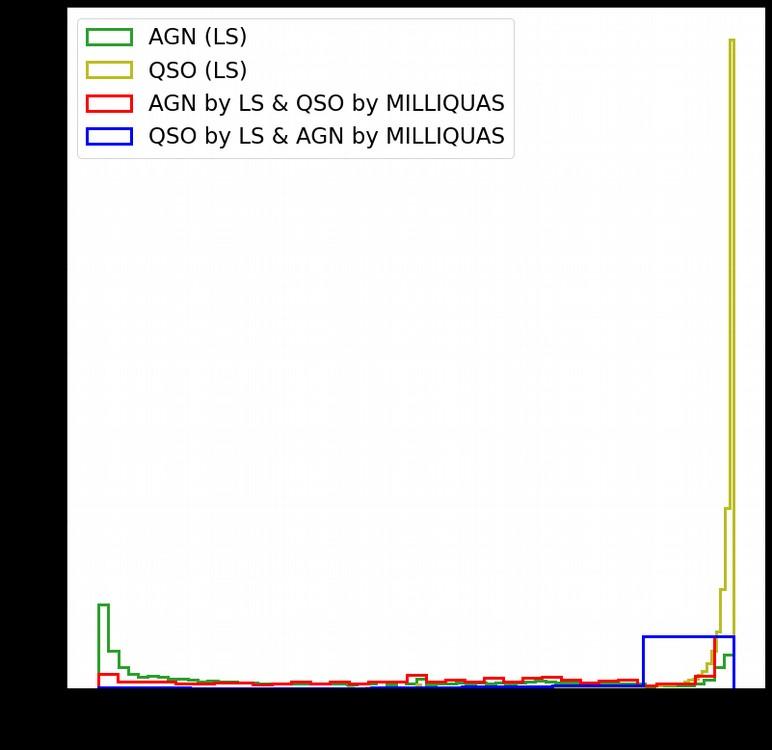
Fig 4. Morphology score vs bolometric luminosity. b) normalized frequency vs morphology score. Both figures for AGNs and QSOs from the labeled set and for misclassified sources
Conclusions
Decrease in the recall vs the number of detections for QSOs and AGNs, and confusion in the LC classifier, is due to the discrepancy in the QSO/AGN classification from different catalogs, which is produced by the difficulty of making strict cuts to separate AGNs and QSOs.
1 arXiv:2008.03311 Sánchez-Sáez et al. (2020)
A 22 GHz Pseudo-correlation Water Vapor Radiometer
L. Peña,
R. Reeves, R. Rodríguez, R. Leiton, K. Cortés. Universidad de Concepción, Chile
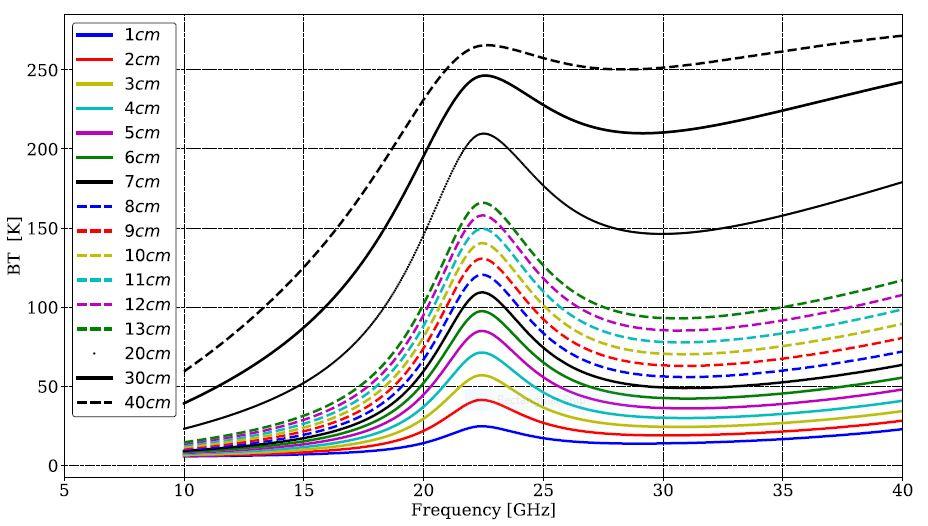
Monitoring WP content is critical to understand its impact on the atmospheric refractive index during astronomical observations. Line profiles can be recovered from spectral measurements obtained by MWRs, which are instruments that measure the electromagnetic power radiating from a gas in the microwaves. Power is linearly proportional to its physical temperature. Then, a MWR can provide a measure of the gas temperature through the Rayleigh-Jeans approximation by measuring the radiated power, and due to the exponential decrease in atmospheric pressure with altitude, at low altitude the line shape is enlarged by pressure.
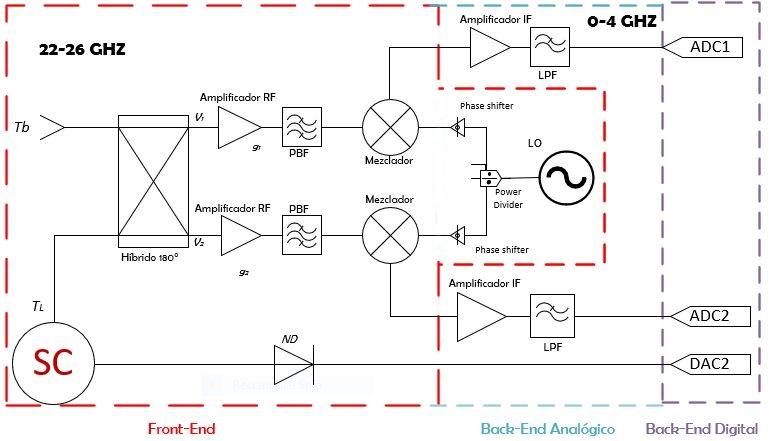
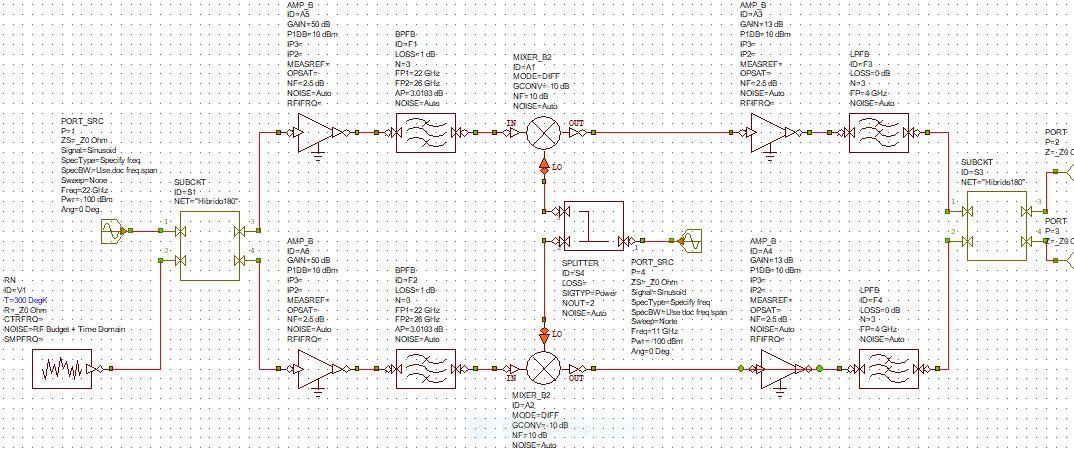
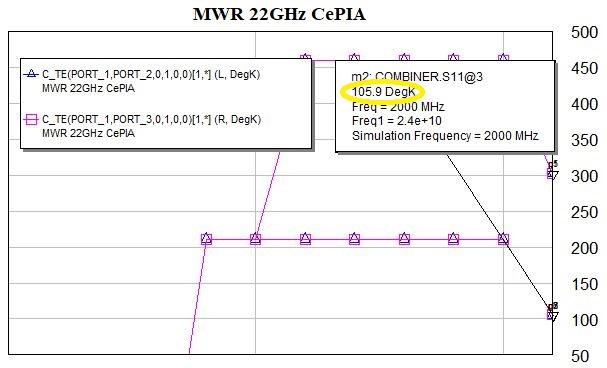
PWV profiles recovered from MWRs at 22 GHz have probed to be an efficient solution for continuous atmospheric observations.Our proposed instrument is a pseudocorrelation analog / digital MWR, having a heterodyne receiver that allows a finer tuning of the WV line and an improvement in receiver noise temperature (Trec) –simulations show Trec=105.9 K –. A selfcalibration system will allow to monitor the WV content in real time. Future steps: component acquisition, mechanical and digital development, and data acquisition including measuring campaigns at Cerro Ventarrones, Regiónde Antofagasta.
Fig. 4: Simulated response of the chain of components of the system with AWR software.
Fig. 3: Simulation with AWR software of the radiometer architecture at 22 GHz.
Optical to NIR magnitude measurements of the Starlink LEO Darksat satellite and effectiveness of the darkening treatment
J. Tregloan-Reed, A. Otarola, E. Unda-Sanzana, B Haeussler, F. Gaete, J. P. Colque, J. Anais, V. Molina, R. González, E. Ortiz, S. Mieske, S. Brillant, and J.P. Anderson
Introduction
In May 2019, Starlink, a subsidiary of SpaceX, launched their first batch of 60 low Earth orbit (LEO) communication satellites. Due to the extremely bright apparent magnitude of these satellites, caused by their very low orbits following launch and their clustering in “trains”, this launch and subsequent launches have caused major concern among both the amateur and professional astronomical communities (see IAU press release, 2019/06/03 and IAU press release, 2020/02/12).
At 02:19 UTC on January 7 2020, Starlink launched its third batch of LEO communication satellites and one of them, STARLINK-1130 (nicknamed “Darksat”) was given an experimental darkening treatment on one side to reduce its reflective brightness (SpaceX press kit, January 2020). this was in response to discussions between Starlink and the astronomical community.
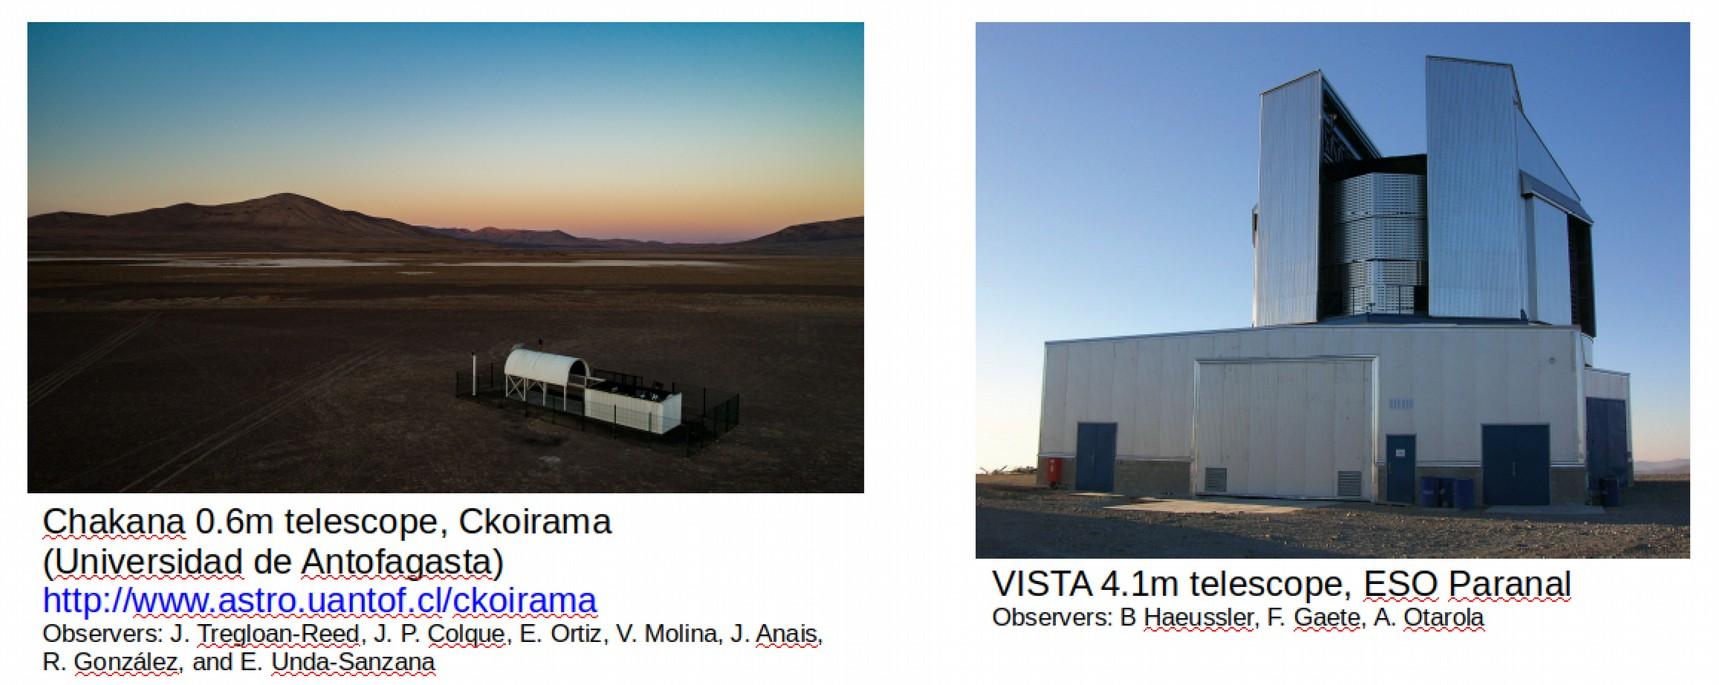
We present ground-based optical to NIR observations of the Darksat LEO communication satellite, along with an additional non-darkened Starlink LEO communication, STARLINK-1113, using the Chakana 0.6m telescope, Ckoirama and the ESO VISTA 4.1m telescope.
Observations
Darksat & STARLINK-1113 were observed by the Chakana & VISTA telescopes
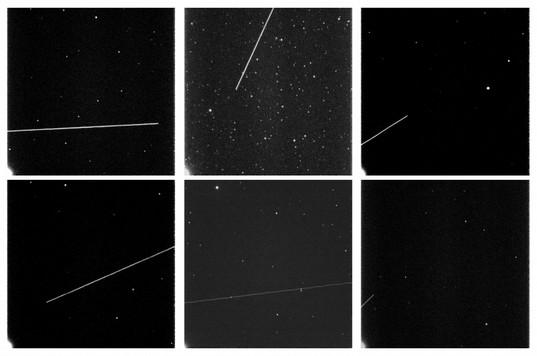
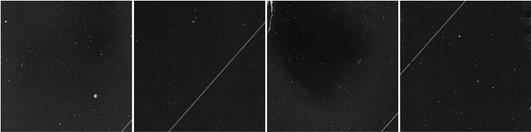
The Chakana observations used FLI ProLine 16801 camera on the Chakana telescope at the Universidad de Antofagasta Ckoirama observatory The detector has a 32.4 x 32.4 arcmin FOV. The observations were conducted on three nights using Sloan g’, Sloan r’, and Sloan I’ filters (Tregloan-Reed et al. 2020a, 2020b).
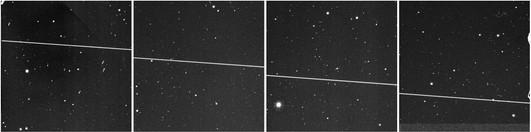
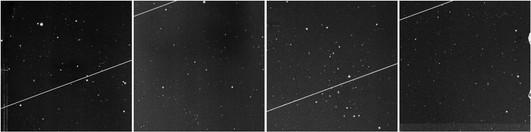
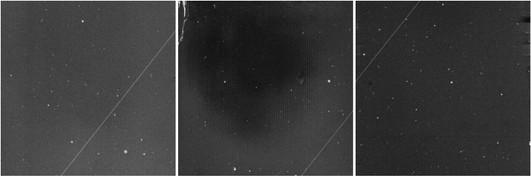
The VISTA observations were conducted on two nights in the J and Ks NIR. The satellite trails crossed 3 to 4 of the 16 detectors (Tregloan-Reed et al. 2020b).
Sloan g’ (left), r’ (middle), and I’ (right) observations of STARLINK-1113 (top) and Darksat (bottom).
NIR J-band observations of STARLINK-1113 (top) and Darksat (bottom).
NIR Ks-band observations of STARLINK-1113 (top) and Darksat (bottom).
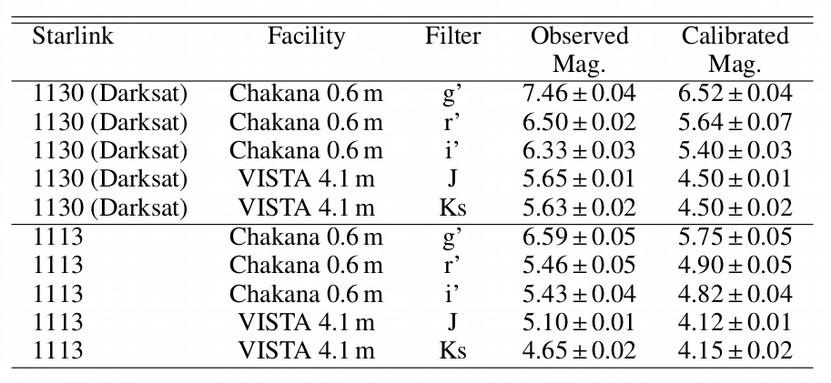
The images underwent standard calibration processes and the integrated flux for the satellite trail and selected comparison stars from each image was calculated. This allowed the observed magnitudes of the LEOsats in each passband to be determined and are presented in the Table below.
Results
The observed reflective brightness of an LEO satellite is dependent on the satellite range to the observer (r), the solar incidence angle (θ) and observer angle (φ) of the satellite. Therefore, to allow a direct comparison of the reflective brightness between Darksat and STARLINK-1113, the observed magnitudes presented in the Table below need to be corrected for θ and φ, whilst normalised to a standard range. When observed at local zenith (airmass = 1) r is equal to the orbital height (Horb). We therefore normalise the magnitude of the satellites to the nominal Horb, 550 km by scaling the magnitudes by −5 log(r/550).
Most of the observed reflective light from a complex body like a Starlink satellite is diffused. This effect can be approximated by using a Bidirectional Reflectance Distribution Function (BRDF). As the observations presented in this work are from a single point along the satellite trajectory path, we estimate the BRDF by using a parametrised BRDF model from Minnaert (1941), which gives a first order approximation from the ratio of the solar phase attenuation between Darksat and STARLINK-1113.
Results of the observations for (Darksat) and STARLINK-1113.
Conclusions
● Darksat is dimmer than Starlink-1113 for all observed wavelengths.
● Darksat and Starlink-1113 both get brighter towards longer (redder) wavelengths.
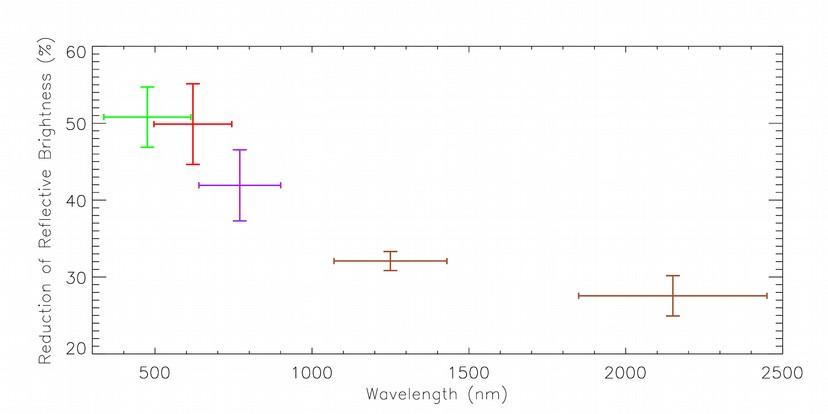
● The effectiveness of the Darksat darkening treatment reduces with increasing wavelength.
Reduction of reflective brightness between Darksat and STARLINK-1113: Sloan g’ (green), Sloan r’ (red), Sloan i’ (purple), J (brown), and Ks (brown). The horizontal error bars represent the FWHM of the passband filters, while the vertical error bars represent the uncertainty in the reduction.
References: Minnaert, M. 1941, ApJ, 93, 403 Tregloan-Reed, J., et al. 2020a, A&A, 637, L1 Tregloan-Reed, J., et al. 2020b, arXiv:2011.01820
Gender balance in the CNTAC allocated proposals
María Fernanda Durán1,2, Patricio Rojo1
1Universidad de Chile, 2SOCHIAS
The CNTAC (Chilean Telescope Allocation Committee) is in charge of the time allocation process for the Chilean share of observing time in about 20 telescopes located in Chile. Here we present the results of an analysis aimed at detecting possible gender biases in the allocation process.
In recent years the astronomical community has been implementing different strategies to counter implicit biases. ESO, STScI, and ESA are some of the institutions that have done statistical studies of their time allocations (e.g. Patat, 2016, Neill Reid, 2014). Overall, it has been found that proposals with female Principal Investigators (PIs) were consistently less likely to be assigned time than those with male PIs. These results motivated changes in the evaluation processes, with an overall shift in favor of blind evaluations to prevent any kind of implicit biases.
cntac@das.uchile.cl
The CNTAC oversees the allocation of the Chilean share of observing time at several facilities. For the evaluation process, proposals are separated by topic into two panels and all of them are presented and discussed by the reviewers. Author’s names and affiliations are known to all reviewers.
At the end of both panels, grades are normalized to produce a final ranked list of proposals per telescope.
To conduct the following analysis, gender was determined by the first names of the PIs, since this is information is not collected at the time of submission.
das.uchile.cl/cntac
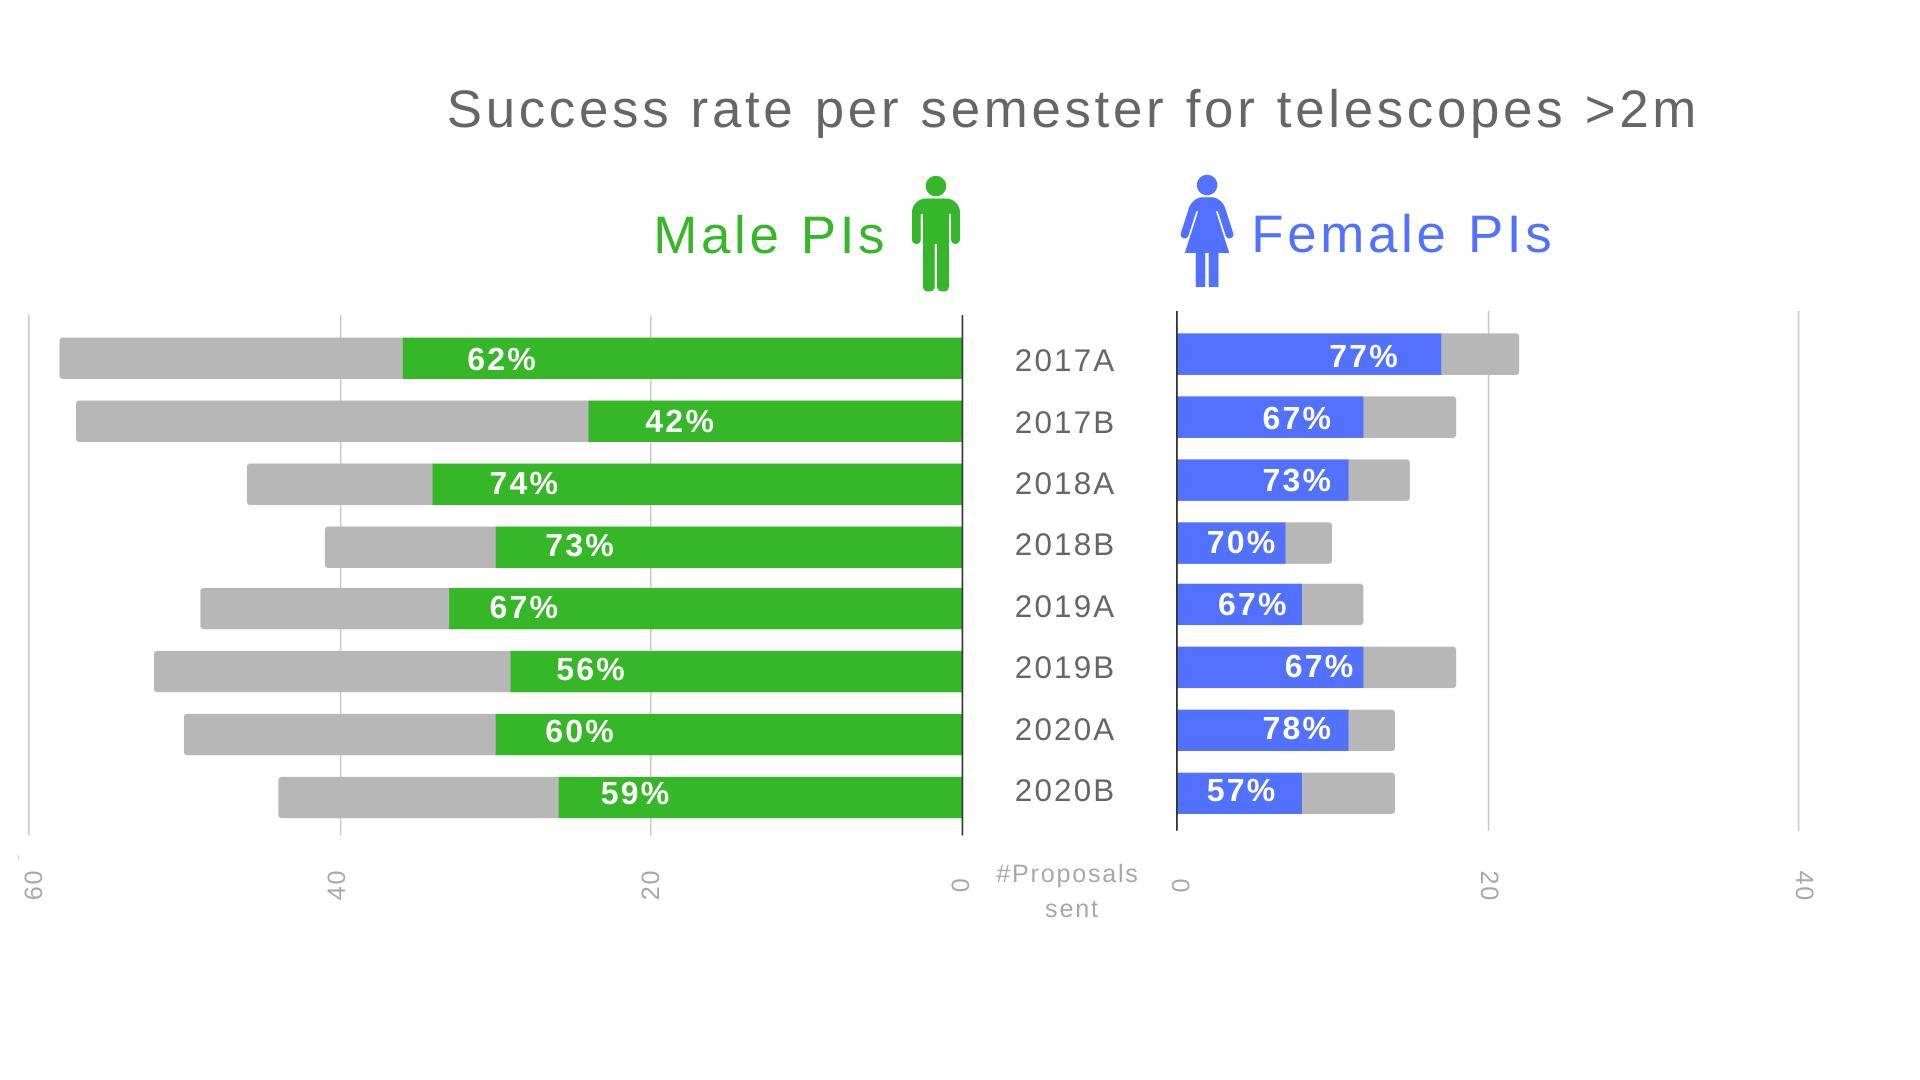
The following figure presents the amount of proposals sent by female (right, gray) and male (left, gray) PIs, per semester since the 2017A cycle. In blue is the number of female lead proposals that received observing time and in green the number of successful male lead proposals. Percentages shown indicate the fraction of
successful proposals for each gender. Here, we only include regular call proposals sent for telescopes bigger than 2m (namely Blanco, SOAR, Baade, Clay and Dupont). These telescopes are more competitive, receiving consistently more proposals and thus providing more reliable statistics.
Success rate per semester for telescopes >2m
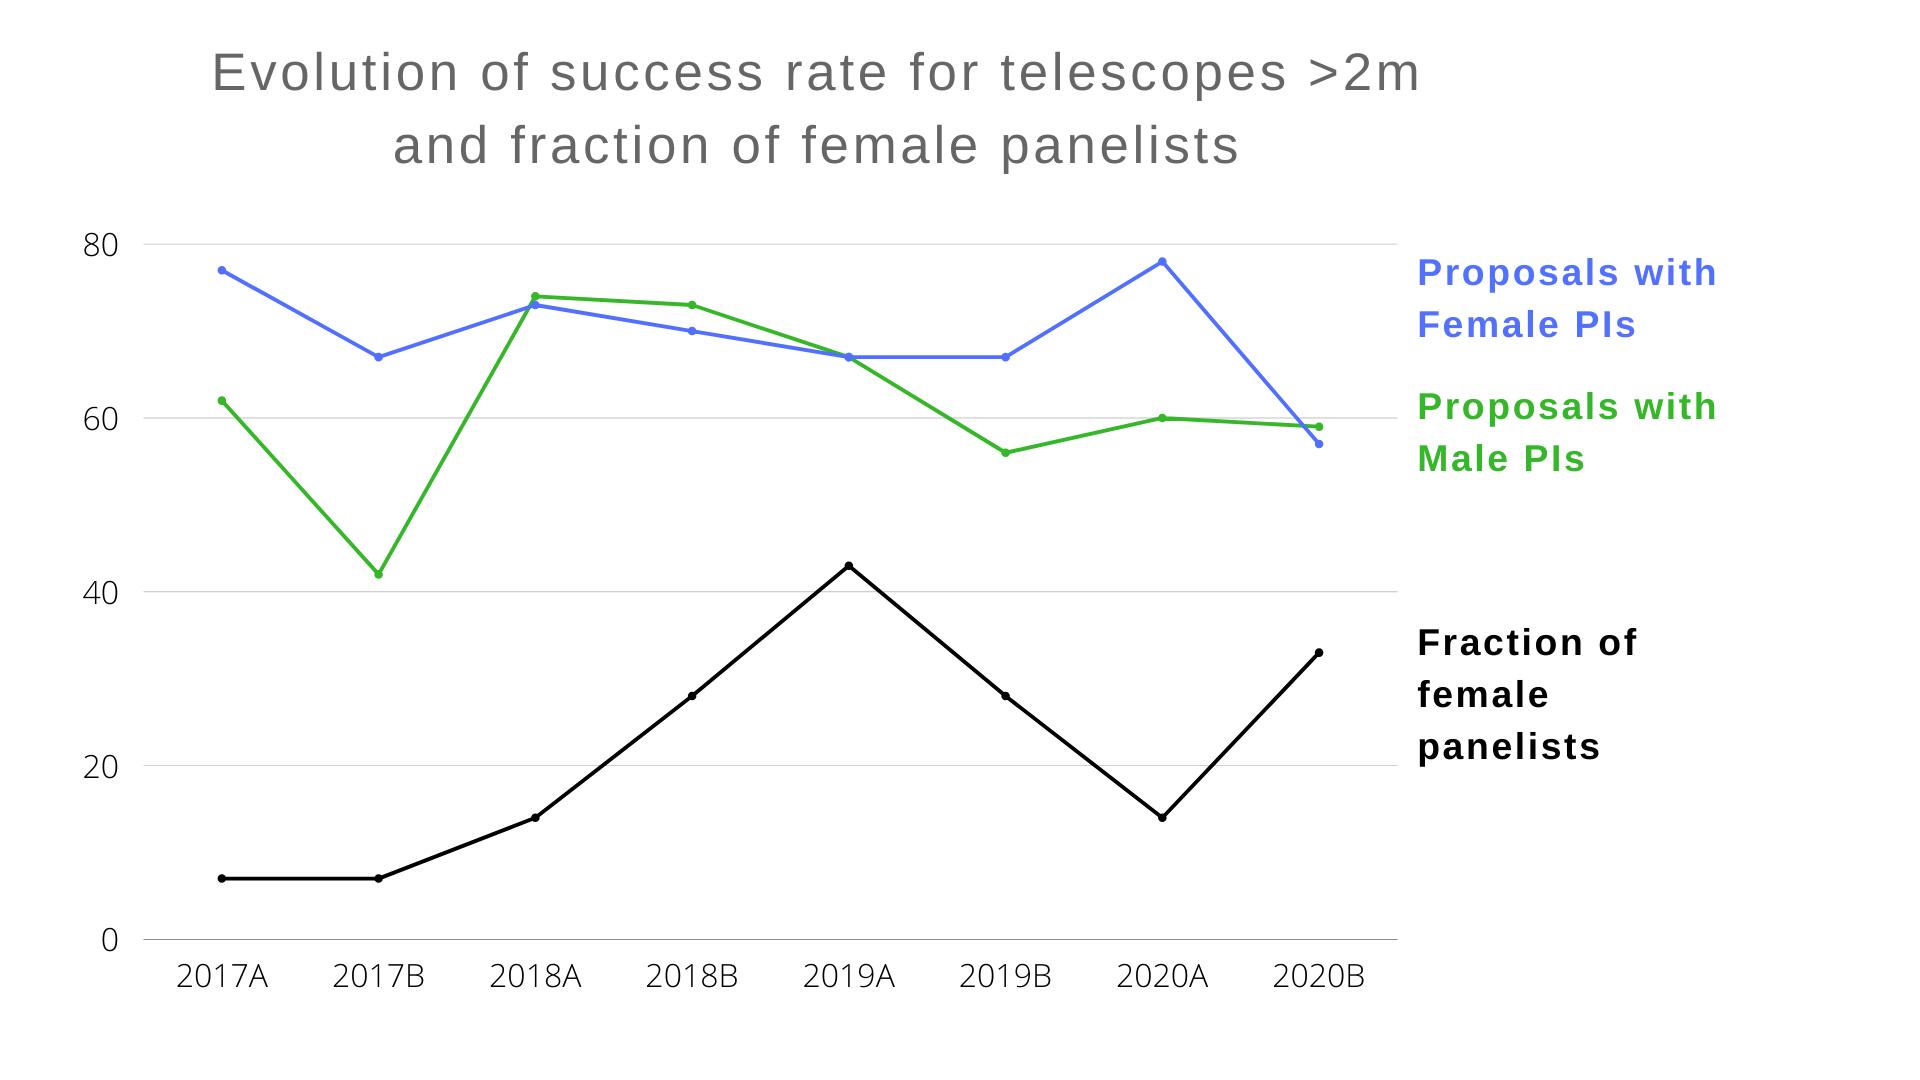
In the figure on the right, the evolution of the success rate for proposals with female (blue) and male (green) PIs are shown along with the fraction of female reviewers (black). The success rate per gender does not seem to depend on the amount of women present in the panels.
As the presented data above show, we find no evidence for systematic gender biases in the allocation process. A more comprehensive statistical study will be conducted in 2021, where other factors such as seniority will be analyzed. Even when these findings are encouraging, the CNTAC, with input from its Advisory Committee will continue to evaluate and improve upon the allocation process to detect and mitigate the effects that implicit biases might have.