
6 minute read
INDUSTRIAL space race


Advertisement


Texas Market Overview


By Daniel Oney
In recent years, demand for industrial real estate—a commercial subsector largely consisting of distribution and manufacturing firms—has been higher than demand for any other commercial asset. Annual net absorption statewide has been positive for over a decade. Dramatic job growth has driven this demand, leading to a surge in new construction. Demand across the country has been extraordinary, but Texas’ industrial markets have been especially dynamic.


At the close of 2022, the U.S. totaled over 27.7 billion square feet of industrial real estate. Texas’ 25 Metropolitan Statistical Areas (MSAs) accounted for 9.2 percent of that. Texas’ share of total U.S. nonfarm payroll jobs was similar at 9 percent. This implies industrial real estate has the same proportional job impact in Texas as it does in the U.S. Even so, industrial markets in the Lone Star State have trended higher than those in the U.S. as a whole.


Texas Playing Larger Role in National Industrial Market
When looking at supply and demand for industrial space, Texas markets played a larger role than expected given their current share of total U.S. inventory.

Texas’ supply has grown faster than the nation’s. In 2022, industrial deliveries in Texas were 3.7 percent of the state’s inventory compared with the 2.1 percent delivery rate nationally. Sixteen percent of deliveries nationwide were in Texas’ 25 MSAs. A comparable amount of space was under construction in Texas.

Demand in Texas has also exceeded that of the U.S. As a percent of inventory, net absorption through 2022 was 3.5 percent. By comparison, absorption was barely positive nationally at 0.1 percent of inventory. Another way of contrasting this demand is that Texas’ net absorption was 17.2 percent of all U.S. space taken up by tenants. This strong performance was driven by healthy fundamentals, especially job growth.
Industrial markets depend heavily on employment in certain sectors of the economy, such as manufacturing, warehousing, and wholesale trade. Of the 14 million nonfarm payroll jobs in Texas, almost 2.3 million (16 percent) are in these three sectors, according to mid2022 employment data from JobsEQ. These jobs substantially drive industrial space use. Growth or decline in these sectors largely determines the industrial space needed.


Where the nation saw a healthy 5.5 percent growth in industrial-using jobs, Texas experienced nearly double that growth at 10.4 percent (see table). Austin growth was at almost 18 percent, followed by Dallas and San Antonio at around 15 percent. Houston had more than 6 percent growth, higher than the 4.8 percent average increase across the 21 smaller MSAs.
Texas job growth in industrial-using sectors was higher than overall job growth. This was also true for all major metro areas (except Austin) and in the smaller metro areas combined. This helps explain the strong performance of the state’s industrial markets.
Source: CoStar Group Inc., www.costar.com


Rental rates in Texas are comparable to or lower than those for the U.S. overall. Full-service gross asking rents in Texas’ four largest industrial markets ranged from $8.45 in Houston to $13.70 in Austin. Meanwhile, Atlanta, Chicago, and California’s Inland Empire—all major U.S. industrial markets—posted rents of $8.27, $8.83, and $13.44, respectively. Of the 25 largest U.S. industrial markets, the lowest rent was in Cleveland at $6.05. The highest was in Los Angeles at $18.47.
At the end of 2022, Texas’ 5 percent metropolitan industrial vacancy rate was higher than the 3.8 percent U.S. average. The state’s higher construction and delivery rates account for part of this difference. Still, 5 percent is a healthy rate and reflects tight markets.
Closer Look at Texas MSA
Texas’ 25 MSAs were home to over 2.5 billion square feet of industrial space by the end of 2022. This amounted to almost 85 square feet for each Texan.
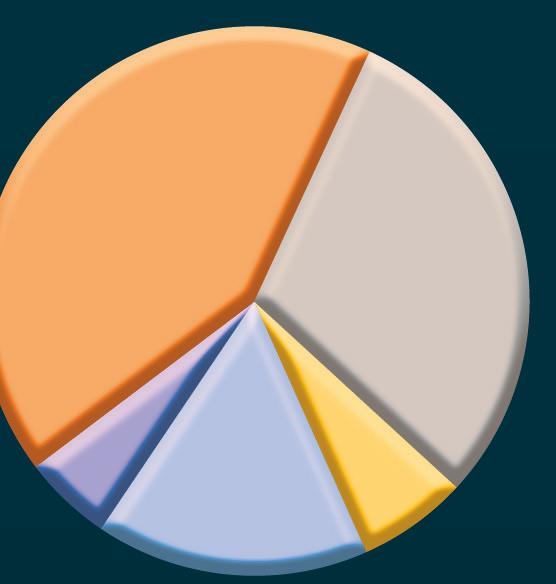
Most of this space is concentrated in the two largest MSAs (Figure 1). DallasFort Worth hosted 42 percent of total industrial inventory, while Houston accounted for 30 percent. San Antonio and Austin combine for almost 12 percent. The remaining 21 smaller MSAs make up a sizeable share with over 16 percent (or more than one-sixth of the total). These shares have been relatively stable in recent years, though development across metro areas is diverging.
Inventory growth differs by MSA (Figure 2). In the last 12 months, Austin led with 12 percent growth, followed by San Antonio at about half that rate. In 2022, Dallas-Fort Worth and Houston added over 3 percent to their existing massive inventories. The smaller metro areas grew much less at 1.6 percent. This is partly explained by their slower growth in industrial-using sectors.
Looking back five years, Austin again led other regions in inventory growth, adding 28 percent. Houston, San Antonio, and Dallas-Fort Worth had similar five-year changes in the mid to upper teens. The smaller metros grew at a combined rate of 7 percent since 2017.
A few notable changes emerged over the last 15 years (Figure 3). Through mid-2014, the major metropolitan areas and the combined smaller metros moved roughly along the same trend. In about 2014, however, the four large metros began pulling ahead of the smaller ones. Since the pandemic, another trend change has been in the making. Austin and San Antonio had notable 1Q2022 inventory bumps, after which Austin shifted to a new growth rate that’s higher than the other three large metros. Austin’s inventory has grown over 50 percent since 2007. Houston, San Antonio, and Dallas-Fort Worth had increases in the 40 percent range. The 21 smaller metro areas have added less than 20 percent to their inventories since 2007.
As mentioned earlier, job growth meant higher demand for industrial space. Demand has been so high that even with massive deliveries of space, rents have increased in recent years across the state. These higher rents induced developers to supply more space.
The smaller MSAs have seen the fastest 12-month change at almost 24 percent (Figure 4). The Dallas-Fort Worth market posted 16 percent gains, followed by Houston and San Antonio in the 11 to 12 percent range. Austin rents have pulled back in recent quarters and are currently up just 0.2 percent over the year. Five-year rent growth has been solid across markets. Dallas-Fort Worth had 64 percent growth, and the smaller MSAs posted 52 percent increases. Of the remaining big-four MSAs, San Antonio had the highest five-year rate since 2017 at almost 42 percent, while Houston and Austin had 27 and 21 percent increases, respectively.
Looking across all MSAs, end-of-year rents ranged from under $4 per square foot in Texarkana to over $15 in Midland. Most major markets in the Texas Triangle have posted rents of around $8 (Figure 5). Several smaller markets had relatively high rents, even by national standards. Odessa, Laredo, and College Station-Bryan all had rents over $10.
Long-term rent trends vary by market. For at least 15 years, Austin has had the highest rents of the large MSAs (Figure 6), followed by Houston (at least since 2011). San Antonio has usually had the third highest rents, with Dallas-Fort Worth posting the lowest among the big-four markets. The smaller MSAs combined generally had lower rents. They have also shown more volatility and bigger seasonal changes. Austin’s rent premium has increased more than other markets since the end of 2015. Most other markets appear to have converged on each other since 2020.
Even with solid rent growth, vacancy rates have remained healthy (Figure 7). Killeen-Temple had the lowest rate at 1 percent. The highest was in Odessa. The larger markets ranged from about 3.5 to 5.5 percent.
Looking at the 15-year trend in vacancies (Figure 8), vacancies rose notably after the 2008-09 financial crisis, especially in Austin and Dallas-Fort Worth, where they reached nearly 12 percent. Afterward, vacancies fell and Texas markets moved more in tandem, holding in a 4 to 8 percent range. This persisted until a slight increase during the pandemic.
Starting in 2020, vacancies fell further except in Austin. Austin’s rate began increasing at the beginning of 2022.
All major markets and the combined 21 smaller MSAs ended 2022 within the 3 to 6 percent range.


Faring Well by Comparison
Overall, Texas’ industrial markets have fared well compared with the rest of the country.
Long-term job growth has justified high rents and kept vacancy rates low, allowing a virtuous cycle where markets are well balanced and new supply meets business needs.
The state’s industrial markets should remain on a healthy course in 2023 even in the face of economic headwinds nationally and in the wider world.
Dr. Oney (doney@tamu.edu) is director of research with the Texas Real Estate Research Center at Texas A&M University.
About This Study
This article summarizes key trends in industrial inventory, rent, and vacancy across the state’s 25 Metropolitan Statistical Areas (MSAs). It compares Texas’ market performance with national trends. Real estate statistics reported are based on Texas Real Estate Research Center analysis of CoStar data through the end of fourth quarter 2022 (4Q2022). This analysis is a baseline.
Industrial markets generally align with MSA boundaries, so references to cities throughout this article refer to the entire MSAs.
For example, Austin means the Austin-Round Rock-Georgetown MSA, Dallas (or Dallas-Fort Worth) means the DallasFort Worth-Arlington MSA, Houston means the Houston-The Woodlands-Sugar Land MSA, and San Antonio means the San Antonio-New Braunfels MSA.
The 21 smaller MSAs include combined information for the Abilene, Amarillo, Beaumont-Port Arthur, BrownsvilleHarlingen, College Station-Bryan, Corpus Christi, El Paso, Killeen-Temple, Laredo, Longview, Lubbock, McAllen-EdinburgMission, Midland, Odessa, San Angelo, Sherman-Denison, Texarkana, Tyler, Victoria, Waco, and Wichita Falls MSAs.


