

Adopted: March 23, 2026
Westfield, Indiana
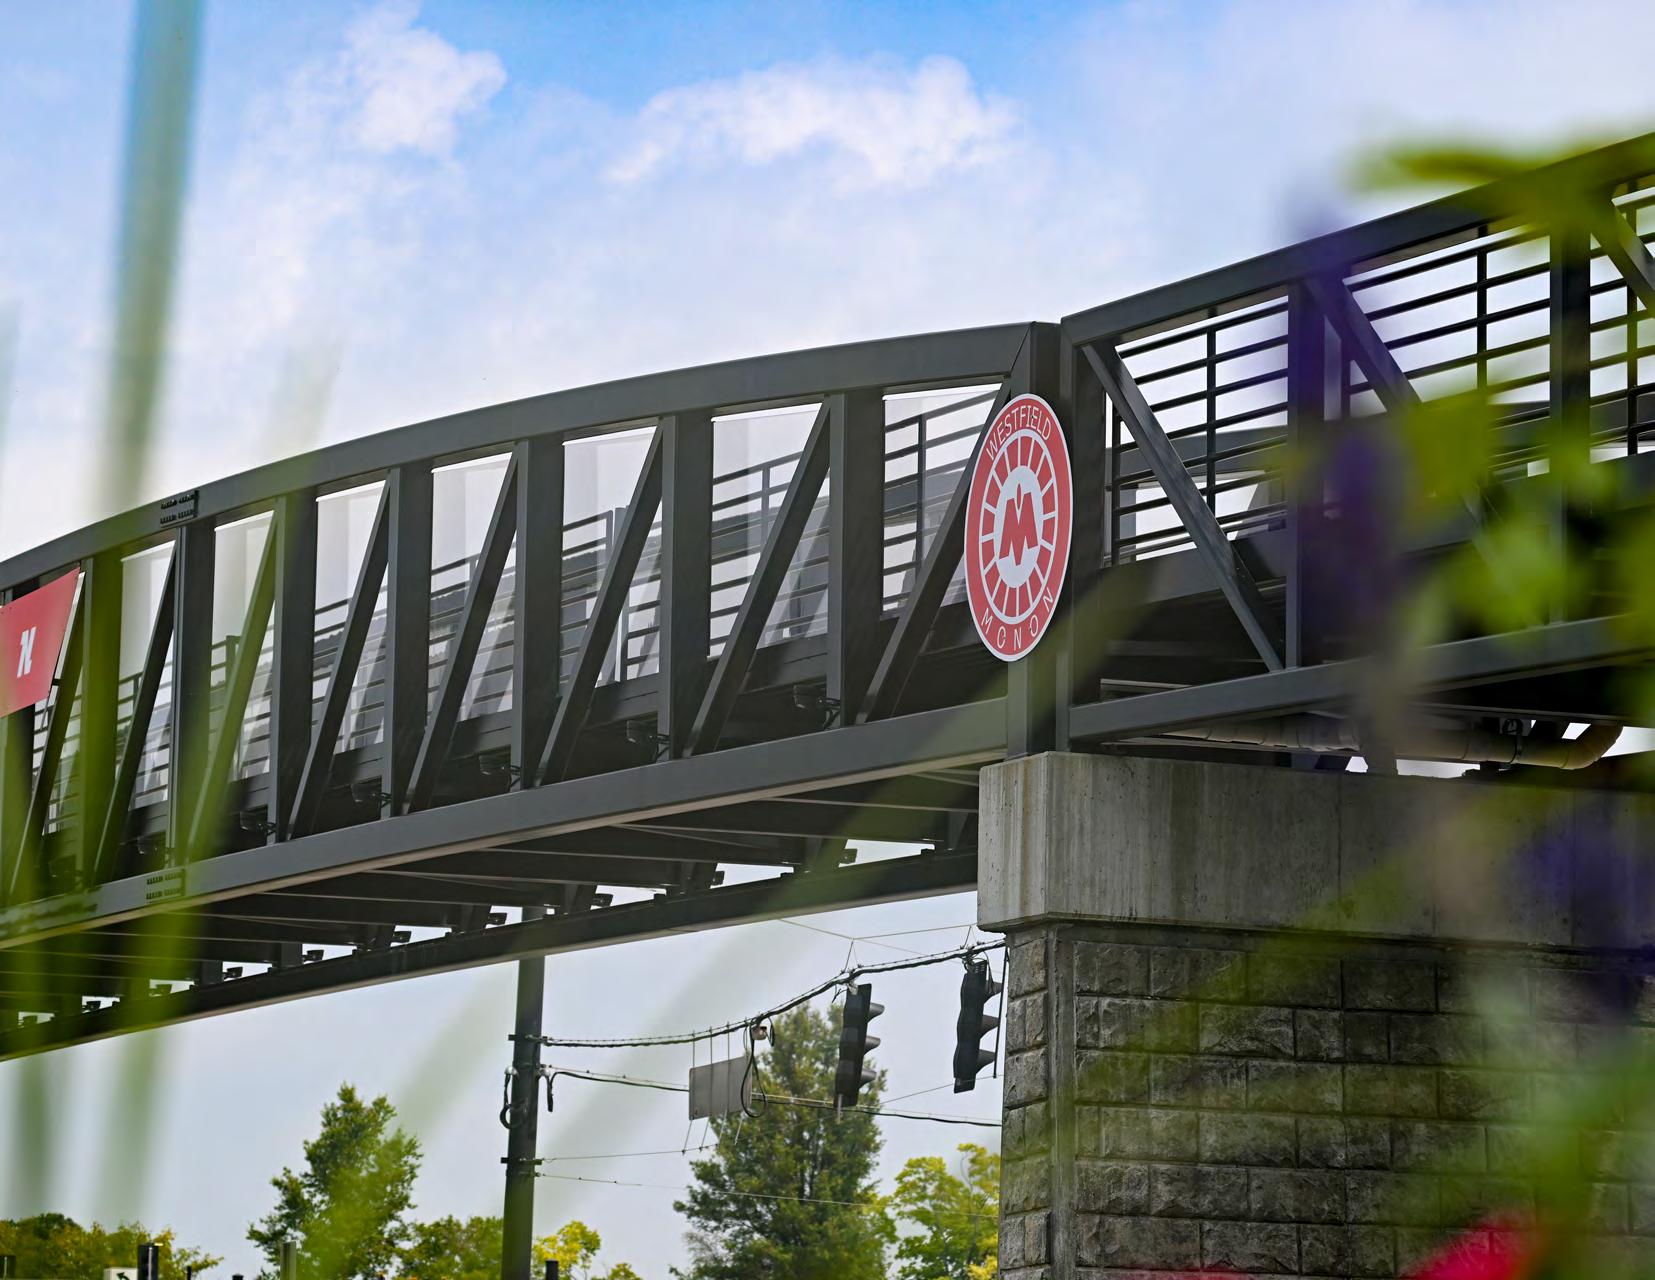
Figure 0.1: 191st Street Pedestrian Bridge
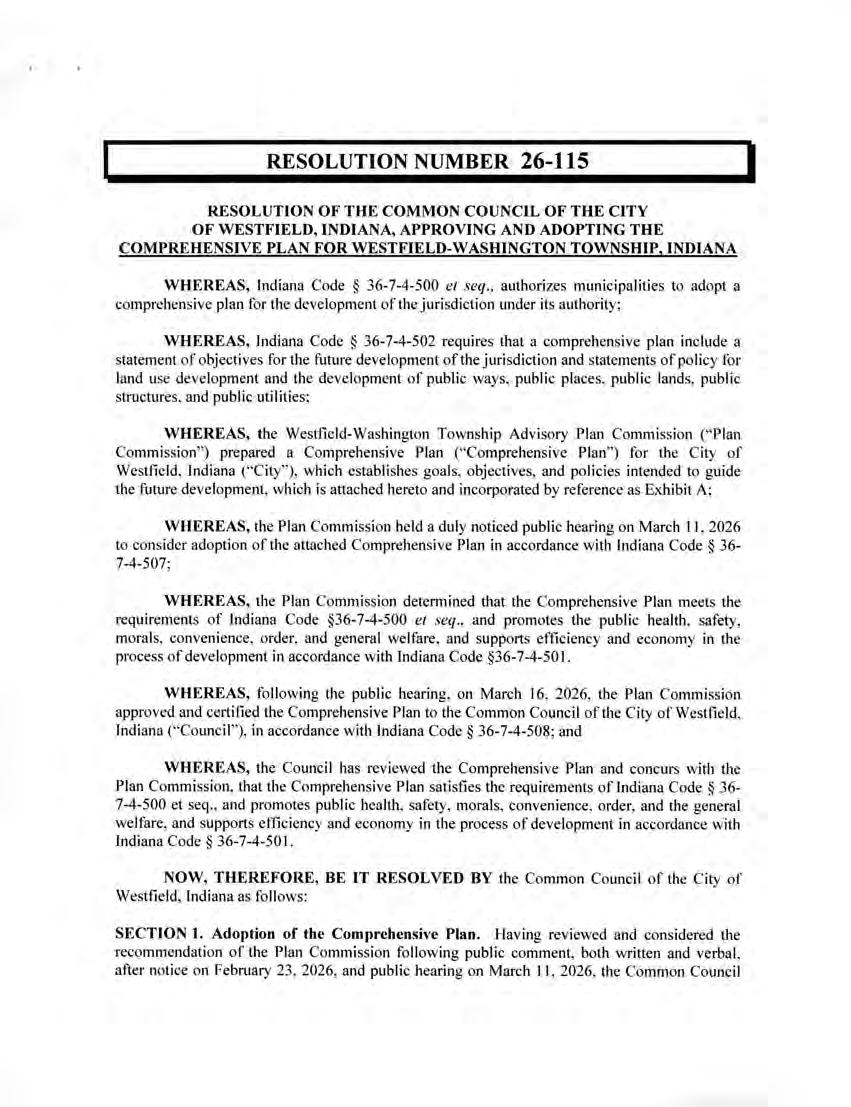
City Council Comprehensive Plan Adoption Resolution
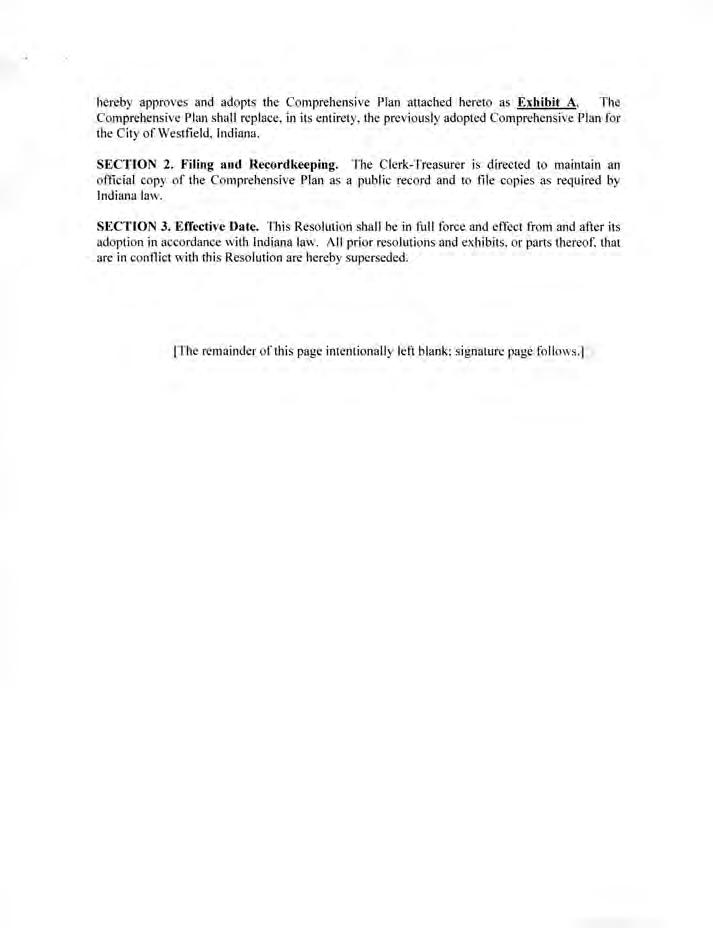
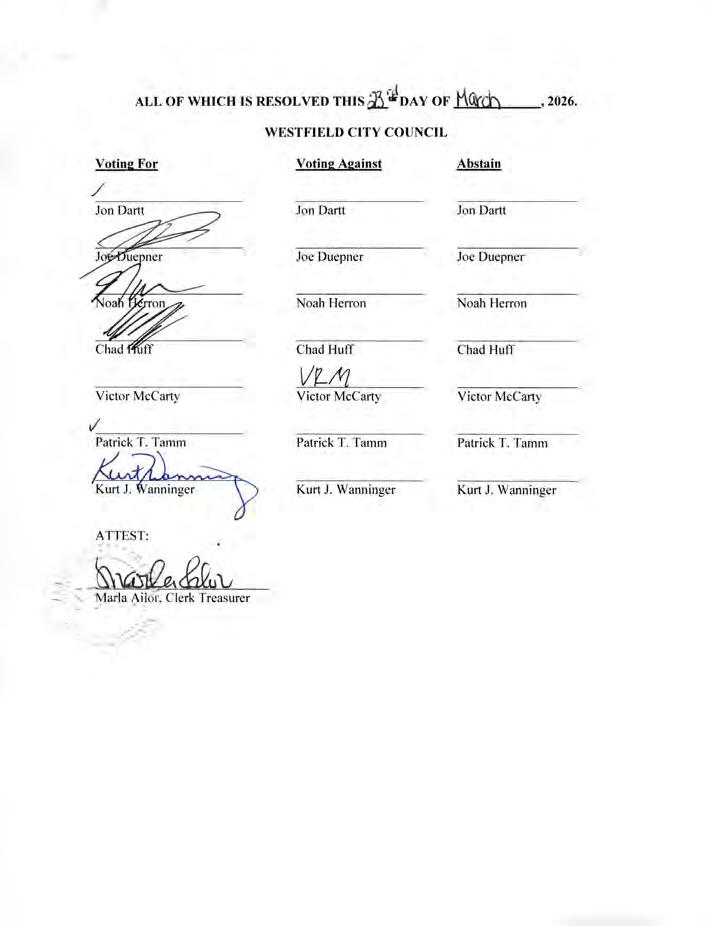
City Council Comprehensive Plan Adoption Resolution, Continued


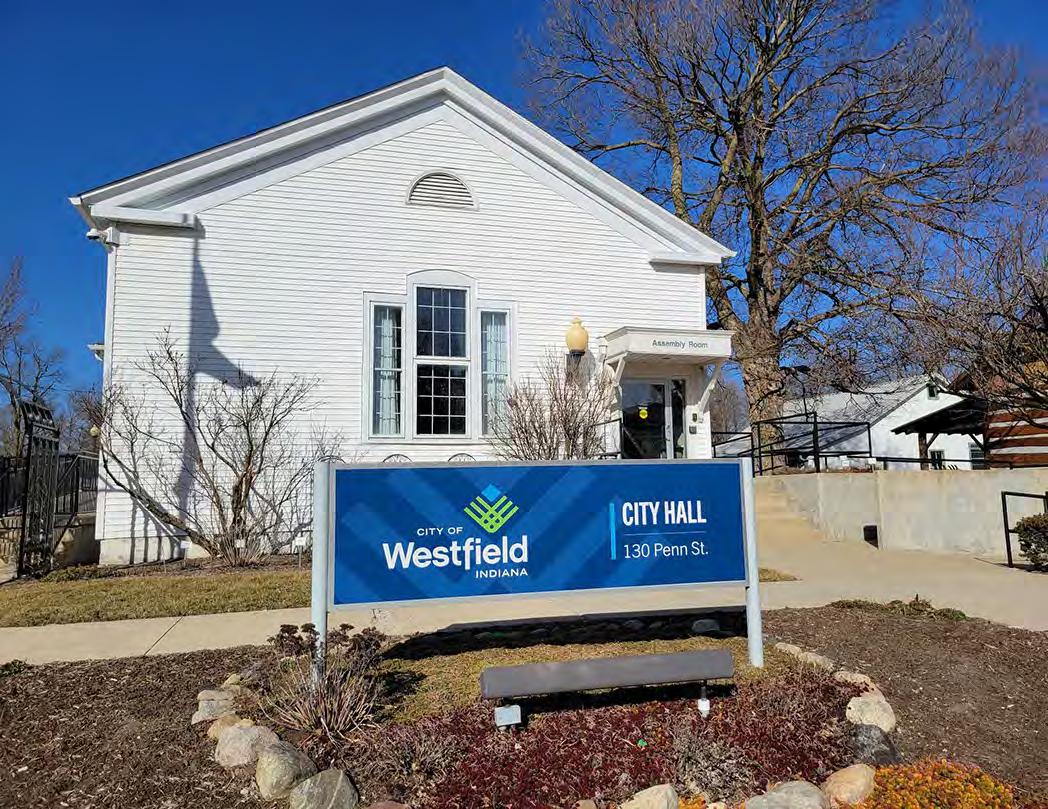
Figure 0.2: City Hall

Adopted: March 23, 2026
Westfield, Indiana
City Council Comprehensive Plan Adoption Resolution
City Council Comprehensive Plan Adoption Resolution, Continued
If a single word encapsulates the spirit of Westfield, it is “progress.” Since our community’s founding in 1834 by Quakers protesting the abhorrent institution of slavery, the people of Westfield have been on the cutting edge of history, challenging the status quo and pressing forward to new heights.
In the nearly 200 years since the foundations of our community were laid, Westfield has grown from a small community, and a vital stop on the Underground Railroad for those seeking freedom, to a bustling city and worldrenowned sports hub. And, based on our history, I have absolutely no doubt our momentum will continue at blistering pace.
That’s why we’ve created this comprehensive plan, Advancing Westfield: Looking to the Horizon, to ensure the momentum doesn’t get in front of us. As a city, we’ve taken the stance that our growth needs to be smart and intentional, yet flexible enough to adapt and evolve and move forward in a way that best serves the community, current residents, future residents, and visitors alike. This plan is not meant to be a final blueprint, but rather a guidepost for the growth we know will come.
We are proud to have partnered with Rundell Ernstberger Associates (REA), an award-winning urban design, planning, and landscape architecture firm with over 45 years of experience in creating innovative and impactful solutions for communities nationwide. This plan includes extensive feedback from the community so we can identify opportunities, address emerging challenges, and steward our community well.
Thank you for your trust, Westfield. Let’s continue advancing together.
In solidarity,
Mayor Scott Willis
It is with gratitude that we acknowledge the many individuals, institutions, and organizations from the City of Westfield who helped develop this plan.
City Council
Jon Dartt, City Council District 1
Victor McCarty, City Council District 2
Joe Duepner, City Council District 3
Patrick Tamm, City Council District 4; Council President
Noah Herron, City Council District 5
Chad Huff, City Council At Large
Kurt Wanninger, City Council At Large
Advisory Plan Commission
Mike Neal, President
Billy Bunkowfst, Vice President
Stephanie Carlson, Member
Robert Horkay, Member
Mark Keen, Member
Omar Khan, Member
Victor McCarty, Member
Ryan Mooney, Member
Kurt Wanninger, Member
Chris Woodard, (former Member of Plan Commission)
Administrative Staff
Scott Willis, Mayor
Danielle Carey Tolan, Executive Chief of Staff
John Nail, Executive Chief of Operations
Jenell Fairman, Executive Chief of Economic and Community Development
City Staff
Kevin Todd, AICP, Director of Community Development
Caleb Ernest, AICP, Long-Range Planning Manager
Daine Crabtree, Current Planning Manager
Lauren Gillingham-Teague, AICP, Senior Planner
Weston Rogers, Senior Planner
Clarissa Carrigan, Associate Planner
Shelby Alexander, Associate Planner
Ryan Collingwood, Senior Associate Planner
Chuck Haberman, Director of Economic Development
Rachel Baker, Redevelopment Manager
Lauren Wahl, Redevelopment Strategist
David Brock, Project Manager/Office Administrator
Claire Gelinas, Economic Development Strategist
Michael Pearce, PE, Director of Engineering
Wes Rood, Stormwater Coordinator
Chris McConnell, Director of Parks and Recreation
Molly O’Connor, Westfield Markets Manager
Kayla Arnold, Director of Communications
Kelley Kemper, Director of Financial Planning and Reporting
John Rogers, Director of Enterprise Development
Matthew Deck, Director of Community Engagement
Kelley Wells, Community Engagement Manager
Steering Committee
Courtney Albright, Westfield Chamber of Commerce
Ryan Baker, Cushman & Wakefield
Mike Deck, Berkshire Hathaway Home Services
Jon Dobosiewicz, Nelson & Frankenberger
Jill Doyle, Invest Hamilton County
Chuck Lehman, Lehman Partners
Remo Mazzetta, C Garcia Associates
Victor McCarty, City Council District 2
Karen Radcliff, Hamilton County Tourism
Patrick Tamm, City Council District 4
Brian Tomamichel, Redevelopment
Commissioner (previously represented Westfield-Washington Schools)
Curt Whitesell, WKRP Indy Real Estate
John Atha, Westfield Washington Township Schools
This document includes a number of hyperlinks for the reader’s convenience when using Adobe’s Portable Document Format (PDF) to view the plan. These links are provided for navigation and cross reference ease. Website links are also provided to external sources. Links to webpages or online sources may become inactive over time as websites continuously change.
Located at the bottom of most right-hand pages in the plan, navigation tabs are provided to quickly jump to other chapters and important maps throughout the plan. Each chapter tab uses a number or acronym to identify itself. A dark blue box indicates the chapter in which the reader is currently located. Click any icon in navigation bar to jump to the beginning of the selected chapter. Clicking either of the map tabs will take the reader directly to the page on which the map is located.










Westfield’s 2026 comprehensive plan, “Looking to the Horizon,” provides a modern framework for managing the city’s continued growth and development. Building on the previous comprehensive plan from 2007, this updated plan responds to significant community change over the last two decades and incorporates extensive input from residents, stakeholders, elected officials, and city staff. As a policy guide, the plan integrates land use, transportation, utilities, economic development, and quality of life considerations into a cohesive document that will shape Westfield’s physical development and influence public investment in the years to come.
Under Indiana Code (IC), the requirements for a comprehensive plan are established in the IC 36-74-500 series. This statute establishes that comprehensive plans are adopted by a resolution and are intended to promote public health, safety, morals, convenience, order, or general welfare and for the sake of efficiency and economy in the development process.
The statute establishes the required contents of a comprehensive plan:
1. A statement of objectives for the future development of the jurisdiction
2. A statement of policy for the land use development of the jurisdiction
3. A statement of policy for the development of public ways, public places, public lands, public structures, and public utilities
A comprehensive plan may also include additional elements and “any other factors that are a part of the physical, economic, or social situation within the jurisdiction.”
Public input was solicited continuously throughout the seven phases of the planning process. There were numerous opportunities for resident and stakeholder engagement, including a dedicated comprehensive plan website, online surveys, focus groups, virtual and in-person open houses, presentations at regularly-scheduled city council meetings, displays at seasonal farmer’s markets that allowed Westfield residents to informally engage with the consultant team, and community planning week - a focused, multi-day gathering of planners and stakeholders to solicit input, draft recommendations, and devise and resolve other key comprehensive plan milestones. The planning process was guided by a project steering committee and engagement also included workshops for city staff and elected and appointed officials.
This comprehensive plan’s planning area is Westfield-Washington Township, a 56 square mile area along the western edge of Hamilton County that includes the incorporated city of Westfield as well as unincorporated sections of the township. Since 1977, the city has had planning and zoning jurisdiction over the entire township. While there is no expectation that the city of Westfield will grow to include all Westfield-Washington Township within the lifespan of this comprehensive plan (the next 20 years) the defined planning area allows the city to better prepare property owners, developers, and utility providers for future growth occurring locally and regionally.
The plan’s central theme, “Looking to the Horizon,” emphasizes forward-thinking decision-making to ensure Westfield’s progress remains deliberate, balanced, and aligned with community values. The plan establishes a vision statement that articulates the city’s desired future and focuses priorities, resource allocation, and assessment criteria.
The vision serves as the comprehensive plan’s foundation for measurable goals and objectives to evaluate whether proposed projects or policies support the community’s long-term ambitions. Value statements complement this vision by conveying core principles and shared beliefs, helping to maintain consistency and integrity as conditions and leadership in Westfield change over time. The collective principles and beliefs deemed most important among Westfield’s residents pertain to community relationships, health and well-being, economic vitality, recreational opportunities, inclusive growth, attainable housing, and multi-modal connectivity.
Westfield is a welcoming, connected, and resilient community that appreciates its past while purposefully directing its future. Innovative growth, defined neighborhoods, dynamic public spaces, flourishing businesses, and a strong economy support residents of all ages and backgrounds. Using strategic planning and investment, Westfield remains a leader in livability, with excellent schools, walkable districts, preserved green spaces, and a deep sense of civic pride.

Community thrives with strong social connections among residents, schools, businesses, local institutions, and government.

Residents are at the heart of everything we do, ensuring safety, quality of education, access to health care, and support of every stage of life.

Local, national, and global businesses, entrepreneurs, and other industries are growing, fueling a strong and diverse economy.

Thoughtful planning guides intentional growth, preserves community identity, and enhances quality of life.

Attainable housing and services are available at a variety of price points to support a high quality of life for residents of all ages, abilities, and interests.


Recreation and entertainment amenities and programming are integral to health, wellness, and social interaction of the community.

Trails, sidewalks, and transit connect people to daily necessities and activities.
Everyone is welcome.
Five themes are the organizational framework for Westfield’s comprehensive plan goals and objectives. The themes are areas of focus within the document that were largely developed through public input collected during the planning process with guidance from the steering committee and city staff. The themes should be viewed as interconnected and complementary to one another.
Position Westfield as a dynamic and resilient economic hub by fostering a diversified business base, cultivating innovation and entrepreneurship, strengthening workforce talent, and leveraging strategic investments in infrastructure, quality of place, and partnerships — ensuring the city’s sustained competitiveness, prosperity, and leadership within the regional economy.
People recognize the quality of place in Westfield and make it a choice community. It is a community where the local history is ingrained through public art and initiatives. The natural features of the community are valued assets on their own and contribute to recreation opportunities and programming. Recreation for people of all ages is a focus of the Westfield community.
Westfield will be a model community that provides diverse and accessible housing opportunities for residents across all income levels, life stages, and household compositions. As Westfield’s housing opportunities change, the city will maintain its distinctive character and quality of life through innovative planning, strategic partnerships, and equitable development practices that support long-term economic vitality and environmental stewardship.
Westfield’s transportation strategy focuses on the modernization of the street network, ensuring the safe and efficient flow of traffic for all modes, reducing car dependency and supporting higher density housing types through improved pedestrian and bicycle infrastructure, enhanced transit service, and mixed-use development patterns that integrate with housing, employment, retail, and service opportunities.
Ensure utility infrastructure accommodates growth through proactive coordination with utility owners and developers, protection and maintenance of existing assets, and prioritization of green infrastructure.
In this comprehensive plan, planning for Westfield’s future physical development shifts focus from conventional landuse maps to a “placetype” approach. This approach considers the character of the planning area’s existing conditions, natural landscape, built environment, function and purpose, integration of the transportation and utility networks, and proximity and regional connections. Placetypes allow for the introduction of desirable new development and redevelopment forms that may not typically be considered through traditional land use planning. It inspires a more durable, attractive, and resource-efficient place-based strategy for the city’s future growth.
There are 19 placetypes and one special development featured in “Looking to the Horizon’s” Future Development Map. Each placetype defines primary and secondary land uses. In many cases, these uses are encouraged to be intermixed, but the secondary uses should be developed in limited capacity and not exceed the primary land uses within each placetype. Beyond uses, the placetypes descriptions contain recommendations regarding building form (height, placement, and character), site design (landscape, amenities, access, and parking), and transportation (vehicular, bicycle, pedestrian, and transit). Finally, each placetype includes a set of precedent images demonstrating the intent of the placetype.
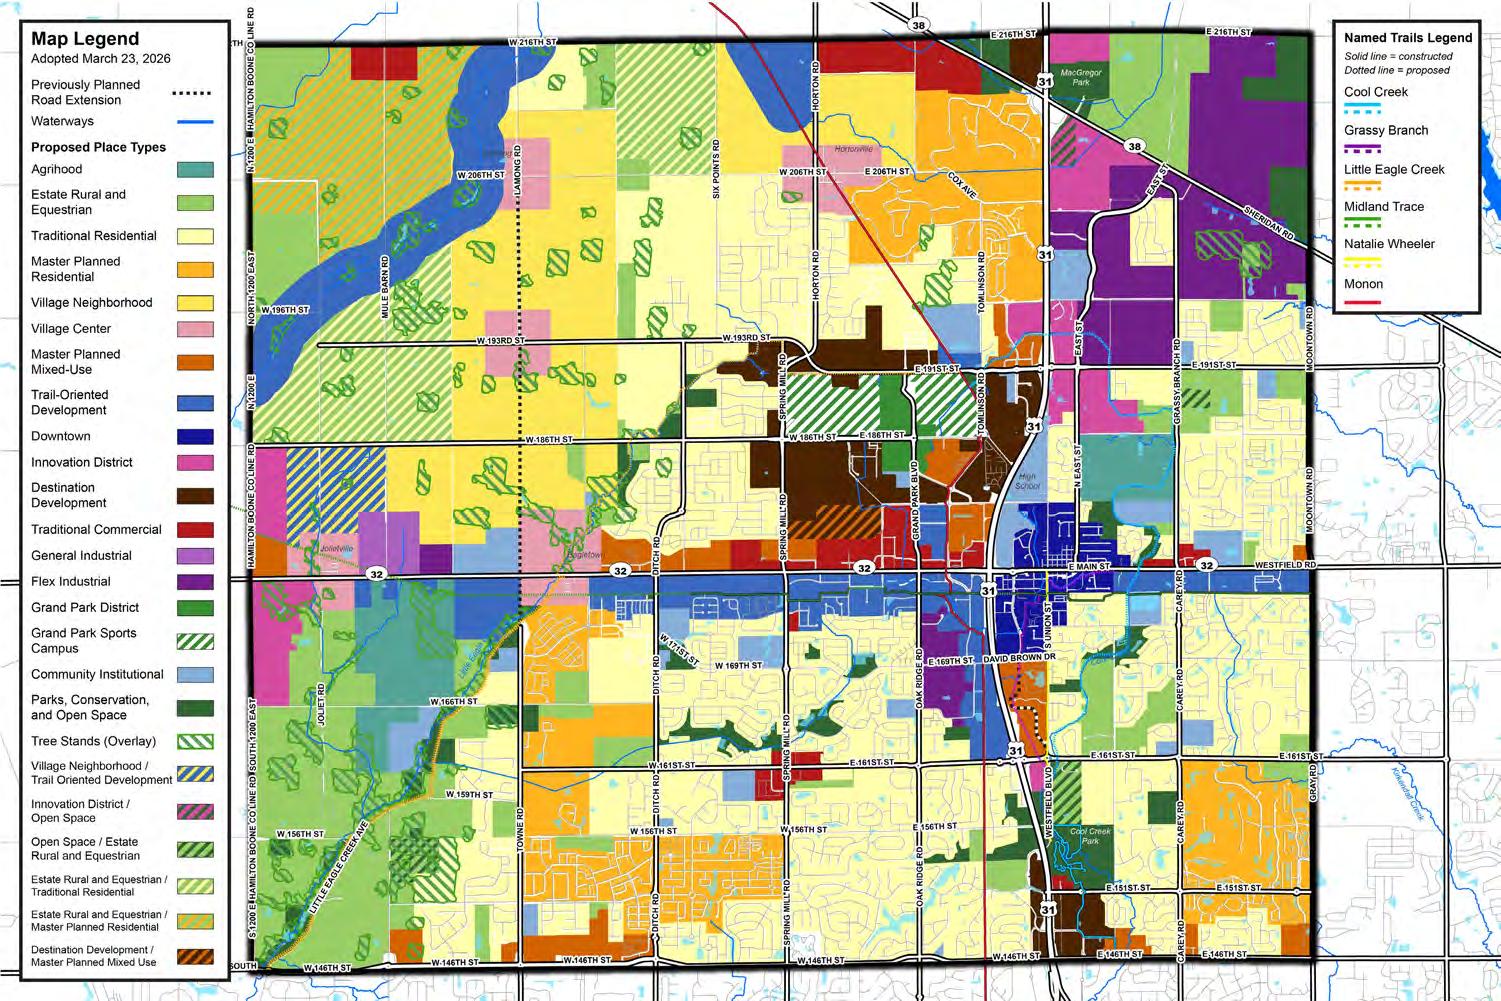
The Future Development Map identifies where placetypes should be physically located within the planning area boundaries as the community continues to develop and redevelop. The map does not dictate when development should occur; rather, it describes how development should look, feel, and function if/when it does happen.
Westfield’s network of physical and economic connections is pivotal to the city’s development and function. This network encompasses infrastructure and resources crucial for mobility, attracting investment, and community welfare. Additionally, the local economy connects the residents of Westfield to the regional suburban Indianapolis market. Local and regional accessibility makes Westfield an appealing place to live, work, and do business.
The city’s transportation network is the connective tissue that links the plan’s components explored in this document. The city’s commitment to policy decisions that support the plan’s vision, values, and recommendations is critical to its future economic success. As such, the comprehensive plan calls for maintaining and modernizing the street network to ensure reliability for all users. Key actions involve “right-sizing” roadways based on user intensity and expanding east-west and north-south connections. The recommendations emphasize slowing traffic speeds through design, establishing clear design standards for street lighting, landscaping, increasing visibility at intersections, and fulfilling a safe, comfortable, and complete bicycle and pedestrian trail system.
Public land for parks, schools, utilities, and transportation infrastructure is a consideration throughout the plan to provide for adequate parks and open space, quality public education, and well-serviced businesses and neighborhoods. Private utility companies that serve Westfield were key stakeholders in development of the plan alongside city staff.
The planning process does not end with adoption. The comprehensive Plan carries on through implementation. This occurs through a variety of tools, including amendments to the city’s Unified Development Ordinance (UDO)and Capital Improvement Plan (CIP), and coordination with other key documents such as economic studies and subarea plans. While the comprehensive plan serves as a guiding policy document, it is not a regulatory instrument and does not change zoning, alter property rights, or impose development requirements. Instead, it offers high-level directions to inform land use decisions, public investments, and development proposals across the community. Ongoing monitoring and periodic updates of this plan, its recommendations, and its overall relevance are built into the implementation process, including an annual status review. The lifespan of a comprehensive plan is approximately 20 years. In between these major updates the city should assess if the comprehensive plan is continuing to meet the community’s needs and is responsive to changing conditions and emerging opportunities.
“Looking to the Horizon” is the city’s manual for coordinated planning and priorities across departments, boards, commissions, and community partners. Its integration with zoning tools, subarea plans, and infrastructure investments make it a central reference point for decision-makers, developers, and residents. By clearly articulating Westfield’s vision and values, the plan provides a unified roadmap for purposeful, inclusive, and sustainable growth— ensuring that the city remains a thriving, wellconnected, and future-ready community for generations to come.
Beginning in 2024 and concluding in early 2026, Westfield’s comprehensive plan planning process was conducted over 18 months and seven phases: 1) Baseline Assessment, 2) Capacity Building, 3) Vision & Values, 4) Draft Plan, 5) Final Plan, 6) Adoption, and 7) Final Deliverables. It is within these seven phases that the consulting team, under the oversight of the City of Westfield’s planning staff and guidance from the plan steering committee, developed the critical work products that form the framework and content of this document.
“Looking to the Horizon” is organized into seven chapters, complemented by this executive summary and supportive appendix. Each topic and final conclusions explored throughout this document’s chapters reflect months-long research, thoughtful discussions, and decisions reached during the planning process.
Explains the purpose, process, and structure of the plan.
Summarizes the community engagement process, articulate the comprehensive plan’s vision and value statements, and introduces the plan’s major themes.
Products of the plan’s vision and value statements. Five planning themes emerged to serve as the organizing elements for plan goals and objectives. This chapter describes each theme’s function and role, desired outcomes, the “how-to’s,” responsibilities, and evaluation criteria.
The core of the comprehensive plan; this chapter will likely be the most referenced section of this document. Placetypes guide future development in Westfield. This chapter includes descriptions for each of the 19 individual placetypes, a corresponding map, and the applicable principles and standards.
Outlines a strategic approach to maintaining and modernizing Westfield’s street network to support current transportation needs while accommodating future growth. This approach emphasizes safety for all modes of transportation and introduces key policies aimed at optimizing roadways, establishing design standards, and facilitating multimodal connections across the city.
The final chapter of “Looking to the Horizon.” This chapter outlines measures for achieving the recommendations, such as zoning decisions, project prioritization, and progress tracking. The implementation matrix graphically presents each action step, specifying timing, priority, difficulty, lead agency, key partners, and links to other critical plan sections. The plan’s 20-year duration allows adequate time to achieve its goals, objectives, and desired land use patterns.
Includes supporting research and findings that are used as the foundation for the assumptions, recommendations, and other decisions made throughout the comprehensive plan planning process. Materials in the Appendix include a summary of Westfield’s existing conditions, the community input process, and frequently used planning terms and definitions.
About the policy and recommendations that are the most important pieces of the comprehensive planning process. This chapter explores Westfield’s evolution from a small town to a thriving, influential city in the Indianapolis Metropolitan Statistical Area. Continued growth depends on maintaining the relationships, resources, and cooperation necessary to sustain Westfield’s economic success and attract desirable new investment.






This chapter is the foundational chapter of the plan and explains the purpose, process, and structure of the plan.


A comprehensive plan is a policy document prepared as a foundational tool for managing growth in a community in a way that respects the interaction between land use, transportation, utilities, and economic development from both a physical development and policy perspective. Westfield last developed a comprehensive plan in 2007. It has been amended over the years with major development and policy changes. However, due to rapid growth and development, a modernization of the comprehensive plan is needed to guide the community forward. This is why this plan has been developed with considerable input from stakeholders, elected and appointed officials, staff, and the public.
“Looking to the Horizon” is the theme of the comprehensive plan. The concept recognizes that consistent forward thinking is needed for the city to strategically plan for its continued growth and development so that it continues to meet the needs and opportunities of its residents and businesses. Looking to the Horizon, is a long-range, future land use vision that guides how and where the city grows over the coming decades and describes how to achieve that vision. The plan is rooted with a vision statement and a series of values that serve as the foundation for the plan’s goals, objectives, and action steps.
Implementation of the plan is achieved through various tools and resources. One of these tools is through zoning. Zoning changes can be initiated by property owners or by the city. Additionally, the city’s Unified Development Ordinance (UDO) will require changes to implement this plan. This plan will also inform other plans, such as the thoroughfare plan, economic impact study and subarea plans in the community. Implementation will also occur through the city’s Capital Improvements Plan (CIP), which allocates funding for public projects including parks, streets, trails, and stormwater. The implementation plan in Chapter 6 will provide guidance to various departments, agencies, and partners for how to move the plan forward.
The comprehensive plan is not a regulatory document; therefore, it does not constitute zoning nor change zoning. Neither this plan nor the maps contained in this plan establish zoning district boundaries or regulations. A comprehensive plan does not guarantee that a development will be permitted based solely on the map or design characteristics identified in the placetypes. Land use decisions on individual properties should consider not only the future placetype map, but also other factors such as other city policies, the context of the surrounding area, and other individual site considerations that weren’t evaluated as part of this high-level policy document.
The comprehensive plan is adopted and amended by the city council by resolution, setting the vision and policy for development in the community, but not establishing enforceable law. Nothing in the plan changes what is currently permitted on any parcel of land or restricts property rights. It does not set a timeline on conversion of uses if and/or when future land uses are envisioned to be different than the existing and current land use or development pattern.
Under Indiana Code (IC), the requirements for a comprehensive plan are established in the IC 36-7-4-500 series. This statute establishes that comprehensive plans are adopted by a resolution and are intended to promote the public health, safety, morals, convenience, order, or general welfare and for the sake of efficiency and economy in the development process.
The statute also establishes the required contents of a comprehensive plan:
1. A statement of objectives for the future development of the jurisdiction
2. A statement of policy for the land use development of the jurisdiction
3. A statement of policy for the development of public ways, public places, public lands, public structures, and public utilities
A comprehensive plan may also include additional elements, some of which are listed in the series, but concludes with “any other factors that are a part of the physical, economic, or social situation within the jurisdiction.”
The 500 series of statutes also establishes the adoption process. The means the plan must be available for public comment at least 10 days before the public hearing. The meeting must be noticed, and a public hearing must be held with the plan commission. The plan commission may consider recommending adoption of the plan by certifying it to the legislative body after the public hearing. The legislative body can approve the plan as is or send it back to the plan commission requesting changes to the plan. After the plan is adopted, it must be filed with the county recorder’s office.
The comprehensive plan is a tool for the whole community to use. While the Community Development and Economic Development staff will use it in their daily work, it will also inform the Departments of Public Works, Parks and Recreation, and the city administration. It will be used by the advisory plan commission and city council to determine how development proposals contribute to the vision set forth in the plan. Developers, investors, and site selectors will use it to shape their development proposals and interest in investment in Westfield.
The UDO contains both zoning and subdivision standards. These are powerful implementation tools to support implementation of the comprehensive plan. The UDO should be updated following the comprehensive plan to amend standards that are not consistent with the policy direction set by the plan and add new standards that better support the implementation of the vision and policy direction of the plan.
This plan provides overarching context and guidance for subarea plans. A subarea plan is a place-specific, detailed plan that refines the comprehensive plan policies into detailed, tailored land use and urban design concepts, street/streetscape frameworks, multimodal circulation, housing and economic strategies, infrastructure and public realm projects and detailed implementation steps. While Looking to the Horizon will provide sufficient guidance for most of the city and township, there may be areas where a more granular analysis is needed. Previously adopted plans like the Grand Park District Plan, the downtown plan, and the arts plan were used to prepare recommendations in the placetype map and policy. Refinements were made based on changing conditions based on community feedback, developer driven projects, elected and appointed officials’ input, and staff discussion.
There will be situations where it is appropriate to amend the comprehensive plan due to changed circumstances in the community or a significant opportunity that will change the character or development pattern of an area in the community, reshape commuting and movement patterns, or alter employment. The Indiana Code (IC 36-7-4-509 through IC 36-7-4-511) establishes the process for amending the Comprehensive Plan:
• Process is the same as for initial adoption
• The legislative body may direct the plan commission to prepare the amendment and submit it in the same manner as any other amendment to the comprehensive plan. The commission shall prepare and submit the amendment within sixty (60) days after the formal written request by the legislative body. However, the legislative body may grant the commission an extension of time, of specified duration, in which to prepare and submit the amendment.
Another part of the process, after the plan is complete, is monitoring progress toward implementation of the action steps. The Community Development Department will have responsibility for this task and should present annual reports to the plan commission, city council, and the public. Every five years the plan should be reviewed and updated based on changes in policy or development patterns (See Chapter 6 for more information). The comprehensive plan should be completely updated every 20 years or sooner if warranted.
During the Phase 1: Baseline Assessment , the consultant team (“the team”) collected and analyzed relevant documents and studies; existing demographics, labor force, market, and physical conditions data; identified high level issues/opportunities; analyzed infrastructure capacity; and researched the market and communities facing similar issues. A market/fiscal baseline analysis and a baseline Trail Oriented Development analysis was completed to be used as a later comparison.
The purpose of Phase 2: Capacity Building was to begin to build local champions for the project. A steering committee was created, a city-wide tour conducted with staff, a project kickoff of the process with the steering committee was held, a project brand was developed, and the project was publicly launched.
Phase 3: Vision & Values focused on creating the 20-year vision for Westfield’s comprehensive plan. Community Planning Week was dedicated to a series of meetings aimed at digging into specific needs, concerns, opportunities, and constraints associated with a variety of themes outlined in Phases 1 and 2. Stakeholder groups, the steering committee, a community survey, engagement of elected and appointed officials, and engagement with staff all contributed to the development of the community vision and values statements, and a preliminary plan framework of placetypes were created. The conclusion of this phase was a community-wide open house to evaluate the vision, value statements, and begin the placetype framework.
The purpose of the Phase 4: Draft Plan was to define and then apply the placetypes to different areas of the city. Each individual placetype describes the character of development, redevelopment, and infill for each geography. These placetypes detail appropriate land uses, building placement and character, building height, lot size, landscaping, amenities, access, parking, multi-modal transportation, utilities, and special considerations which are tailored to the placetype to the exact geography. Every parcel of Westfield and Washington Township has a placetype assigned. Additionally, the team developed additional framework plans to support the placetype plan. These include transportation and utility improvements, economic development, plans, etc. Additionally, the team completed a return on investment and fiscal impact of land use analysis based on the placetype plan and proposed infrastructure improvements. Further adjustments were made to standards based on that analysis and comparison to the baseline in Phase 1.
During Phase 5: Final Plan, the team created a public draft plan that reconciled all comments from staff, stakeholder groups, public comments, and elected and appointed officials. The plan was presented at an open house for the public to review.
Phase 6: Adoption included formal adoption of the plan by the plan commission and city council.
The final phase included the reproduction and delivery of the final plan, training for staff and plan commission members, a staff work plan, and a project close-out meeting with staff.
The following paragraphs summarize the structure of the plan and identify the contents in each chapter. The executive summary is intended to be a “quick read” version of the comprehensive plan to highlight the vision and values, goals, placetypes, and concludes with the recommendations.
Vision and Values summarize the community engagement process, provides and lists the vision and value statements and discusses the major themes of the plan which are transportation, housing, economic development, and quality of life.
Themes & Goals break down each theme in a two-page spread and identifies the goals, why this theme is important, where are we today, what needs to be done (objectives), howe it will be done, who will do it, and measuring success.
Thoroughfare Plan outlines a strategic approach to maintaining and modernizing Westfield’s street network to support current transportation needs while accommodating future growth. This approach emphasizes safety for all modes of transportation and introduces key policies aimed at optimizing roadways, establishing design standards, and facilitating multimodal connections across the City.
Connecting it Together summarizes the policy actions of the plan. This chapter provides an overview of past planning efforts, discussion of the city form, and an overview of the city’s annexation history. Then the chapter takes a deep dive into the themes highlighting the existing conditions, planned development, future development, and policy recommendations. Additionally, the chapter contains guidance regarding water, wastewater, and stormwater systems and innovative and emerging trends and technologies.
Planning Foundation is the introductory chapter of the plan. It explains the purpose, process, and structure of the plan.
Placetypes are the core of the plan that discusses what a placetype is, how it differs in managing land use from a traditional future land use map, and the limitations of the placetype. The chapter ends with a description of each placetype, where it is located on the map, and the guiding principles and standards for each placetype.
Implementation is the final chapter. It includes the implementation matrix which details each goal and objective, lead agency, key partners, priority, level of difficulty, and timing.

This chapter documents the vision and values of the residents and leadership of the City of Westfield. This chapter also discusses the major themes of the plan which are transportation, housing, economic development, and quality of life.

Community outreach is a critical component of the comprehensive planning process, serving as the primary channel for incorporating Westfield’s larger community into the future vision of the comprehensive plan. It is a proactive effort by the city and consultants to inform, involve, and collaborate with residents, businesses, and other stakeholders to ensure that the resulting plan reflects Westfield’s diverse needs and aspirations. The importance of this engagement lies in its ability to build trust, foster a sense of ownership among community members, and ultimately lead to a more widely supported plan. By actively seeking out a wide range of perspectives, community outreach helps to identify potential conflicts early on, address the needs of different groups in Westfield, and create a plan that is both visionary and grounded in the realities of the Westfield community.
The application of community outreach in the comprehensive planning process is multifaceted and extends throughout all phases of the plan. In the early stages, outreach is used to gather input on community values, identify key issues and opportunities, and collaboratively develop a shared vision for the future. This was accomplished through a variety of methods, including public meetings, workshops, surveys, pop-up events, and focus groups, all designed to gather a broad spectrum of public opinion. As the plan developed, outreach continued to play a vital role in presenting draft concepts, gathering feedback on goals, objectives, and specific recommendations, and ensuring that the plan remains aligned with community priorities. This iterative process of engagement not only improved the quality of the plan but also built a stronger, more connected community by providing residents with a meaningful voice in shaping their collective future.
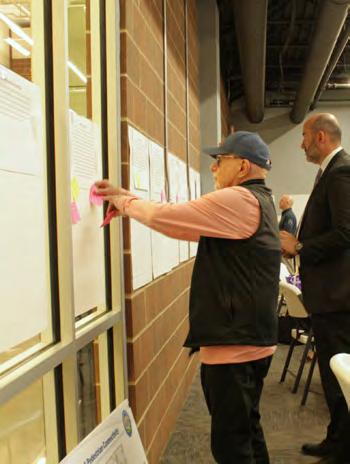
Looking to the Horizon engagement process started with an emphasis on creating a brand for the project, consistent messaging, and meeting people “where they are.” The plan draws its priorities and action steps from extensive community input, which was critical to developing the plan. Since 2024, Westfield residents actively participated through various ways including in-person meetings, pop-up events, focus groups, online surveys, Meeting in a Box, Pastry with a Planner, and presentations to different stakeholder groups (WECAN, young professionals, high school students, etc.). Public feedback was summarized into key land use themes which shaped the vision, goals, objectives, and action steps.
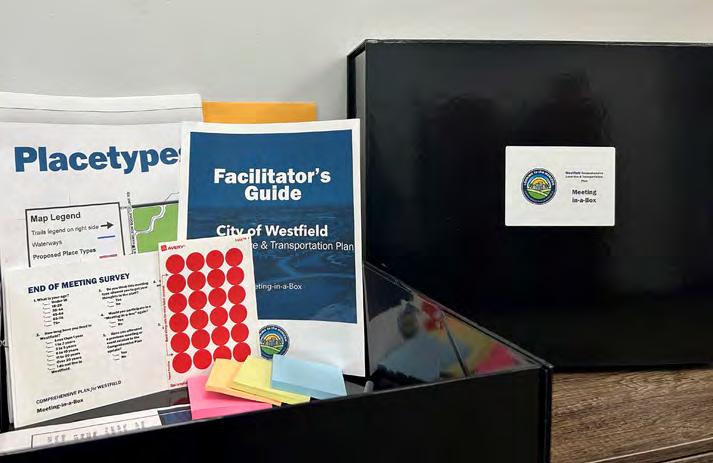
Groups who were unable to attend public meetings were able to check out a Meeting in a Box. It contained complete exercises, that were similar to the public open house exercises, where groups could provide feedback during different phases of a project. These boxes were geared toward groups of people to foster meaningful discussion about the future of the city. The box included instructions via a facilitators guide, materials to respond to, and a survey. Once completed, the facilitator turned the box back to Community Development. The box contents were then incorporated into the public input for that phase.
Meetings were broadly publicized on Westfield’s social media accounts, digital and printed newsletters, and comprehensive plan website to encourage participation. For demographic groups that were underrepresented, specific outreach was conducted in the form of surveys or events such as a high school workshop at Westfield High School, a presentation given at the monthly Westfield Chamber young professionals coffee event, provided input opportunities to the Westfield Diversity Coalition, and a housing survey distributed to residents of rental properties. Focus groups were conducted based on professional affiliation. This included groups that represented local businesses, non-profit organizations, city utilities and services, and developers.
There were five topics where we received the most input: - transportation, housing, economic development, quality of place, and utilities. Those became focus areas for the plan and helped shape the value statements that the plan is based around.
Sub-themes also emerged, which include managing the rapid growth Westfield has experienced in recent years, the density and intensity of growth, and infrastructure improvements. Grand Park was also a popular topic in terms of the use of the campus as an economic driver for the community and other development. Housing variety and affordability was frequently discussed with concerns about housing costs and a lack of options apart from large-scale apartments and single unit homes. Quality of life amenities such as parks, trails, schools, and family-friendly entertainment were also emphasized as a priority for the future.
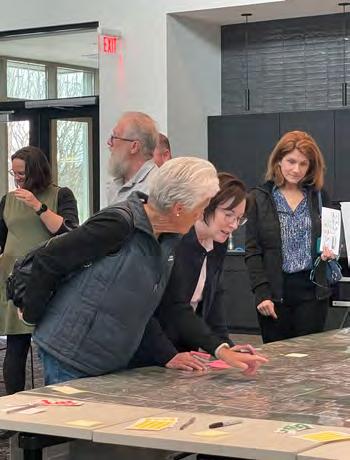
A vision statement in a comprehensive plan serves as the community’s aspirational statement, describing the ideal future that residents, stakeholders, and elected officials collectively hope to achieve. It is concise yet paints a picture of what the community wants to become over the next 10, 20, or 30 years. This provides a unified theme that aligns all other plan elements. By painting a clear picture of the desired future, the vision statement helps guide decision-making, investments, policies, and partnerships, ensuring they are all moving the community in a consistent direction.
Beyond inspiration, a vision statement also establishes a foundation for measurable goals and objectives. It bridges present-day conditions with future aspirations, allowing city staff and city council and plan commission to evaluate whether proposed strategies, land use policies, and development initiatives support the community’s long-term ambitions. In this way, the vision statement is not just a ceremonial introduction, it is the anchor of the comprehensive plan, shaping how priorities are set, resources are allocated, and progress is monitored over time.
Westfield is a welcoming, connected, and resilient community that appreciates its past while purposefully directing its future. Innovative growth, defined neighborhoods, dynamic public spaces, flourishing businesses, and a strong economy support residents of all ages and backgrounds. Using strategic planning and investment, Westfield remains a leader in livability, with excellent schools, walkable districts, preserved green spaces, and a deep sense of civic pride.
Value statements articulate the core principles and shared beliefs that guide Westfield’s decision-making and long-term growth. These statements capture what matters most to residents and serve as the moral and cultural foundation for the plan’s goals, policies, and actions. By clearly stating these values, the plan builds consensus among diverse stakeholders, ensuring that future choice aligns with Westfield’s identity and priorities. Value statements are essential because they help maintain consistency and integrity throughout the planning process, providing a common touchstone that keeps policies grounded in the community’s collective vision, even as conditions and leadership change over time.
Westfield is a place where…
• Community thrives with strong social connections among residents, schools, businesses, local institutions, and government.
• Residents are at the heart of everything we do, ensuring safety, quality of education, access to health care, and support of every stage of life.
• Local, national, and global businesses, entrepreneurs, and other industries are growing, fueling a strong and diverse economy.
• Recreation and entertainment amenities and programming are integral to health, wellness, and social interaction of the community.
• Thoughtful planning guides intentional growth, preserves community identity, and enhances quality of life.
• Attainable housing and services are available at a variety of price points to support a high quality of life for residents of all ages, abilities, and interests.
• Trails, sidewalks, and transit connect people to daily necessities and activities.
• Everyone is welcome.
This chapter provides an overview of the planning themes developed from the community’s visions and value statements. Each theme is made up of a primary goal that provides direction on what the plan will achieve when implemented. Additionally, each theme’s goal has a series of objectives that provide strategic recommendations on how to achieve that goal.
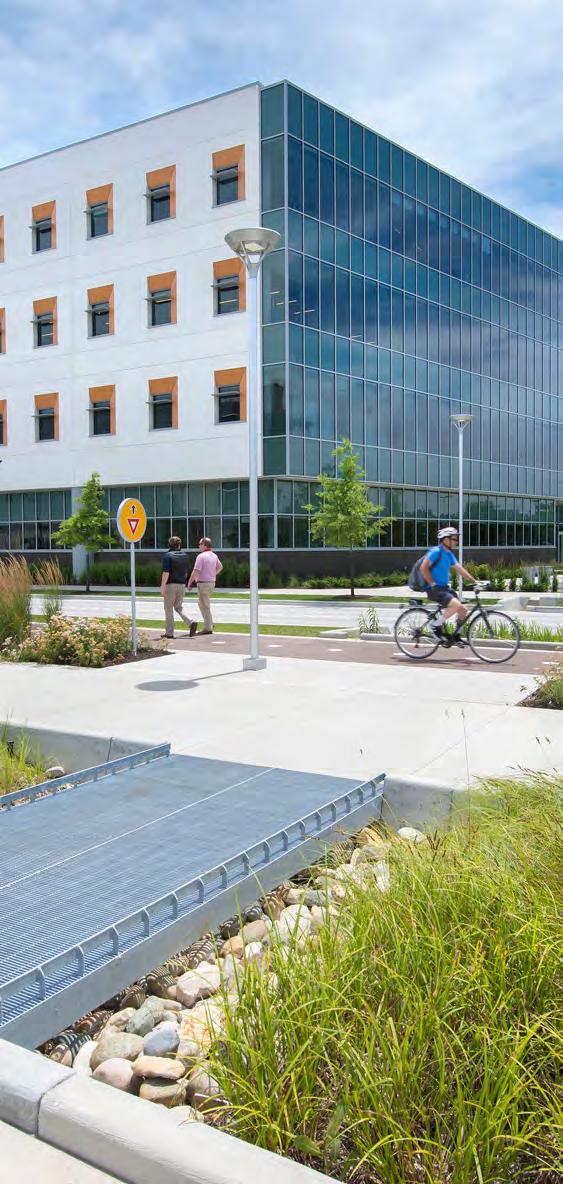
Position Westfield as a dynamic and resilient economic hub by fostering a diversified business base, cultivating innovation and entrepreneurship, strengthening workforce talent, and leveraging strategic investments in infrastructure, quality of place, and partnerships to ensure the city’s sustained competitiveness, prosperity, and leadership within the regional economy.
1. There are opportunities for mixed use developments and increased density for existing single-use commercial sites and shopping centers.
2. Strategic land use necessitates that economicoriented place types are medium-to-high density, well-designed, and integrated developments.
3. The city is economically resilient when the tax base is balanced between residential and employment uses.
4. Partnerships with employers and housing organizations can bring workforce housing to market quicker.
Westfield’s employment opportunities and its resident workforce are unaligned. Residents tend to have higher-paying jobs, but they are commuting outside of Westfield for work. Of Westfield’s working resident population of 23,487 people, only 2,005 of those people work in Westfield. There is opportunity for the City of Westfield to attract high-earning industries to be supported by its resident workforce.
The number of people who live and work in Westfield-Washington Township has grown from 1,160 people in 2002 to 2,005 people in 2021 (a 72.8 percent increase); however, most residents commute outside the city/township for work.
5. A skilled workforce supports strong biotech, aerospace, medical device, battery production, high tech manufacturing, healthcare, technology, and service sectors.
6. Class A and premium office spaces with proximity to quality spaces ensure the attraction and retention of businesses.
7. Infrastructure capacity planning anticipates rapid growth to minimize potential service delivery issues.
The median household income in WestfieldWashington Township continues to increase. It increased from $86,360 in 2010 to $99,855 in 2020 and again to $123,456 in 2024. Westfield-Washington Township income is high in comparison to Indiana. Indiana’s median household income in 2023 was $69,477.
The fastest growing industries from 2002 to 2021 were construction, arts, entertainment, and recreation.
More than 8,000 Westfield-Washington Township workers work for small businesses with fewer than 500 employees. These are often local businesses that contribute to market diversity.
Create world-class infrastructure and quality of place amenities that support business operations and attract residents and visitors.
See Action Steps in Chapter 6 WHO WILL DO IT?
See Implementation Matrix in Chapter 7
Maximize economic development impact through strategic partnerships, regional collaboration, and multisector engagement.
Cultivate an innovative ecosystem that supports startup creation, business scaling, and technology adoption across all sectors.
1. Increase the total amount of developed acres of economic development uses into commercial/office from 3.5 percent to 10 percent, and industrial from 1.4 percent to 5 percent by 2036.
2. No single industry should be greater than 25 percent of total employment.
3. Increase the number of residents who work in Westfield by 5 percent per year.
4. Average wages increase at least 3 percent per year.
5. Unemployment rate at 3 percent or less in 5 years.
6. Increase number of jobs/employment in targeted industries (medical devices, biotechnology, information technology, agribusiness, and sports technology) by an average of 5 percent per year.
Build a skilled, adaptable workforce that meets current and future business needs while attracting and retaining top talent.
Create a robust, diversified economic base that can withstand market fluctuations and provide sustainable growth opportunities.
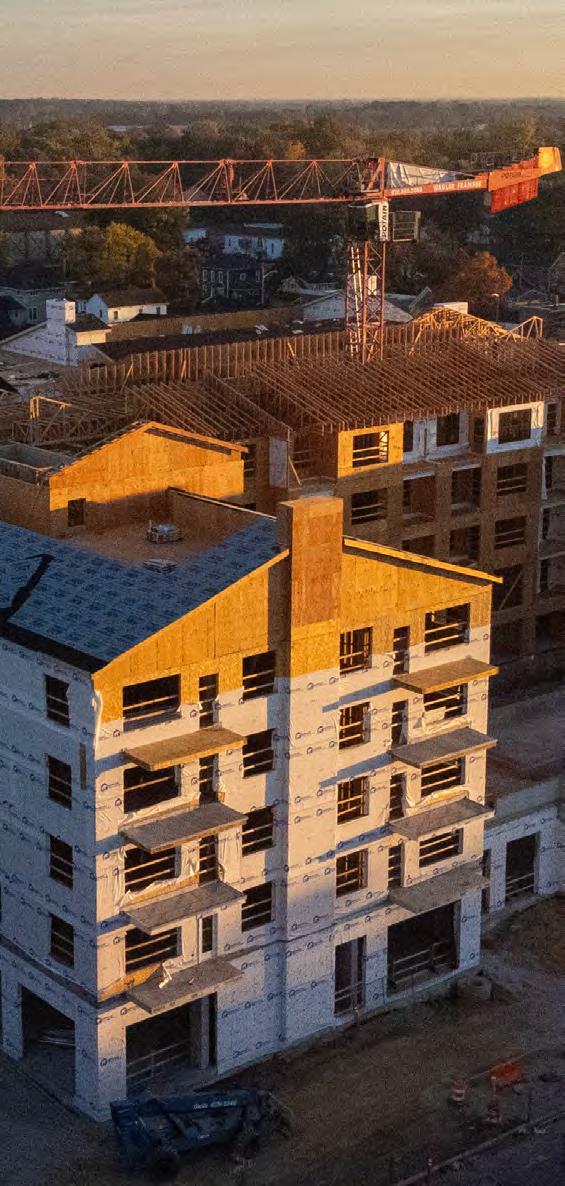
Westfield will be a model community that provides diverse and accessible housing opportunities for residents across all income levels, life stages, and household compositions. As Westfield’s housing opportunities change, the city will maintain its distinctive character and quality of life through innovative planning, strategic partnerships, and equitable development practices that support long-term economic vitality and environmental stewardship.
1. Westfield’s housing opportunities allow individuals to move into the community as young professionals and as their life-stages change, ensures there will be housing opportunities available for them to stay in Westfield as they cycle through the rest of their life. This keeps population stable and growing.
2. Housing variety helps to support a diverse community and population growth, which increases the city’s tax base and economic opportunities.
Low housing vacancy and a lack of housing diversity persist in the community, even with significant housing development over the past decade.
Westfield-Washington Township had an estimated 19,970 housing units in 2022. Nearly 80 percent of housing units are single-unit detached and owner occupied.
Over 65 percent of Westfield’s housing was built after 2000, which means there is less upkeep and maintenance, and a greater likelihood of meeting housing needs as compared to the region.
The desirability of the community and limited housing vacancy can drive housing costs up and reduce the affordability of housing.
3. Well-maintained and abundant, diverse choices for housing and neighborhoods help to retain existing residents and attract new residents.
4. Trail-oriented housing developments promote public health and quality of life while also reducing auto dependency.
More than 60 percent of households in Westfield are housing cost-burdened.
US Census Bureau states the median home value in Westfield-Washington Township in 2024 is $450,000, with 86 percent of owner-occupied housing is valued over $300,000.
Nearly 79 percent of housing units have 3 or more bedrooms, but only 43.8 percent of households have 3 or more people, suggesting a lack of “right-sized” housing.
Focus on regulatory and zoning modernization to provide housing opportunities in Westfield.
See Action Steps in Chapter 6 WHO WILL DO IT?
See Implementation Matrix in Chapter 7
Develop village master plans for Lamong, Eagletown, Jolietville, Hortonville, and other applicable areas.
1. Ensure that residential land uses comprise between 40 percent to 60 percent of total land area.
2. Increase the tax base by increasing the number of residents who live and work in Westfield and attract new businesses to Westfield.
Align the placetypes map with regulatory standards to reflect the development patterns in the residential placetypes.
Plan for mixed use trail-oriented development (TrOD) nodes along the Monon and Midland Trace Trails.
Support efforts such as a community land trust and related tools to increase the supply of attainable housing.
Support diversification of the housing types and integration of neighborhood supporting uses into neighborhoods.
3. Update the UDO to support diversifying the housing stock, either through new developments or infill housing.
4. Increase housing density and encourage mixed use development along trails, downtown, and in villages.
5. Westfield households spend no more than 30 percent of household income on housing and no more than 45 percent on housing and transportation.
6. Westfield maintains a vacancy rate of 6 percent for homeownership units and 8 percent for rental units.
7. New construction in existing and new villages should focus on gentle density increases of 4 - 8 units per acre for single-unit homes and 12 to 18 dwelling units per acre for multi-unit/mixed use development.
8. New construction in the trail-oriented development placetype should be at a density of approximately 8 to 16 dwelling units for neighborhood scale dwellings, and 15 to 30 dwelling units per acre for a core node with mixed use adjacency to trail access.
9. New construction in the Downtown area should increase density to 15 to 30 dwelling units per acre for multi-unit/mixed use development.
10. 90 percent of housing units are within 1-mile of an elementary school and have sidewalks/trails to walk/bike.
11. 25 percent of Westfield housing units are within a 10-min (0.5 mi) walk of a grocery store.
12. 75 percent of Westfield housing units are within a 10-min (0.5 mi) walk of a park.
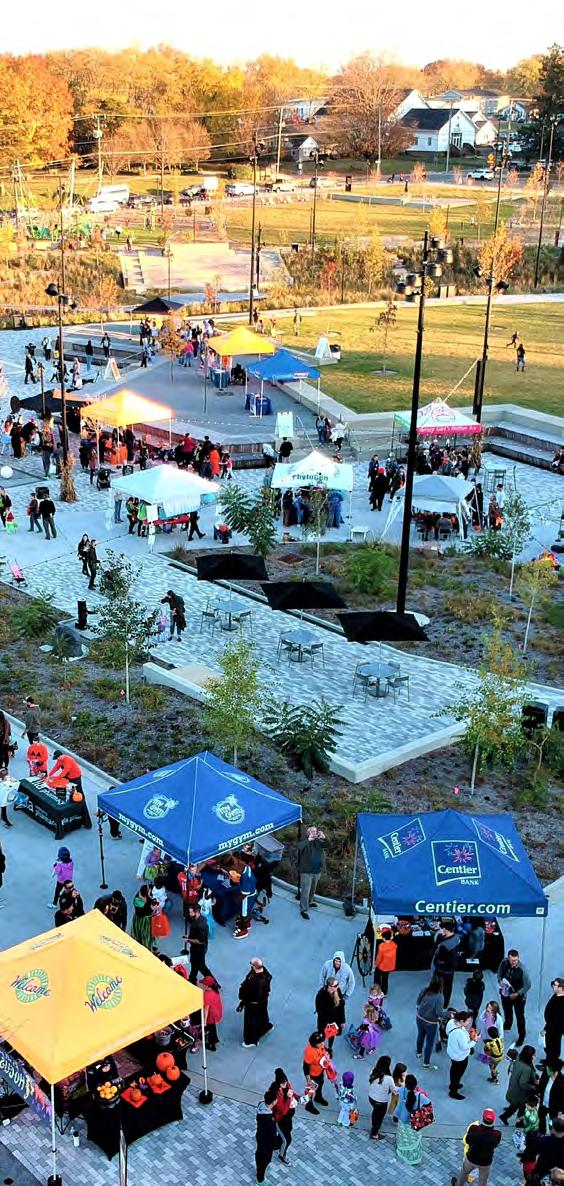
People recognize the quality of place in Westfield that makes it a choice community. It is a place where the local history and natural features are ingrained through public art and initiatives. Events, programming, and recreation for people of all ages is a focus of the Westfield community.
1. Within a metropolitan region, people choose where to live based on several factors, many of which relate to the quality of the place – its art, cultural opportunities, parks and recreational programming, natural environment, and schools.
2. Westfield has made a significant investment in youth sports, particularly for people from out of town. The community has a rich high school sports history and culture as well. Expanding those investments to meet the needs of the
The area now known as Westfield-Washington Township was first inhabited by the Delaware and Miami Native American tribes. A group of Quakers from North Carolina arrived and settled in the area in 1832. Carolinian Quakers came to Westfield, in large part to escape the slave economy of the South. When the Civil War began, some men from WestfieldWashington Township fought for the Union. There were a significant number of community members in Westfield who contributed to the Underground Railroad, hiding runaway slaves as they came from Madison, IN up towards South Bend.
Unincorporated areas west of Little Eagle Creek are mostly agricultural.
Recreational uses comprise 1,640 acres or 5.1 percent of total acres. Most recreational uses are either public parks owned by either the city, township, or county government, or privately-owned
local community, including people of all ages and demographics, will help the community grow a reputation for being an active community.
3. Mature trees and natural areas are limited and take time to establish or re-establish; preserving them as best as possible and thinking to the future will help Westfield residents enjoy natural beauty and the benefits of natural spaces.
golf courses and other recreational facilities, such as Grand Park. There are three golf courses in the city, which are wrapped in residential subdivisions: Chatham Hills, Wood Wind, and Bridgewater.
Most places in Westfield are within a half mile of a trail or multiuse pathway. Westfield has 85.63 miles of trails within corporate limits. There are two regional trails in Westfield (i.e. they connect to distant communities in the same region): the Monon Trail and Midland Trace Trail. The Monon Trail provides a north-south connection to Carmel and Indianapolis, while the Midland Trace Trail provides an east-west connection to Noblesville.
Newer subdivisions often include an internal trail system, recreational amenities, and pathways to nearby businesses.
The City of Westfield Parks Department manages 14 parks and properties.
Communicate and celebrate local history by continually developing public art and placemaking initiatives.
See Action Steps in Chapter 6 WHO WILL DO IT?
See Implementation Matrix in Chapter 7
Invest in local recreation facilities and programming for residents of all ages, abilities, and interests.
Encourage developments and industries that integrate agriculture, including agri-tourism, agri-neighborhoods, and parks.
Establish quality tree standards and natural riparian corridors to preserve, maintain, and enhance the natural environment, where appropriate.
1. Increase park and conservation areas from 7.2 acres per person to 10.5 acres per person based on National Parks and Recreation Association (NPRA) within 20 years.
2. Increase indoor and outdoor recreation facilities and programming for residents by the continued development of in and around Grand Park and other key areas.
3. Increase number of attendees to community events and programs by 5 percent per year. Currently, 45,000 people attend events in 2024.
4. Increase the number of volunteer hours for community events and programs by 5 percent from 3,550 in 2024.
5. Support agri-tourism and rural character as Economic Development Assets. By 2035, increase the number of agri-tourism destinations by 25 percent and annual visitation by 20 percent, while preserving agricultural land use in unincorporated areas for economic diversity.
6. Based on the placetypes map, ensure that at least 70 percent of the wooded/ conservation areas are protected and new developments add and help connect to the green network.
7. Increase park space by 50 percent or as recommended by the 5-year Parks Master Plan.
Maintain and improve passive green spaces that provide valuable connections to nature.

Westfield’s transportation strategy focuses on the modernization of the street network, ensuring the safe and efficient flow of traffic for all modes, reducing car dependency and supporting higher density housing types through improved pedestrian and bicycle infrastructure, enhanced bus/trolley service, and mixed use development patterns that integrate with housing, employment, retail, and service opportunities.
1. Roadway function and design should match density and intensity of land use.
2. Roadways lack comfortable infrastructure for pedestrians and cyclists.
3. Improving traffic safety through design will become increasingly important as the city grows.
Westfield’s major and minor arterial and collector roads follow a macro grid pattern, providing an easy-to-navigate system. US 31 roughly bisects the city and carries the most significant traffic volumes followed by State Road 32/Main Street and 146th Street.
The 2024 baseline year Level of Service shows that all the roads meet or exceed acceptable levels of service except for intersections at State Road 32 & Gray Road, 146th Street & Gray Road, and 161st Street & US 31.
A 5-year crash analysis found a total of 204 killed or serious injury (KSI) crashes from 2019 to 2023. Bicycle and pedestrian crashes were 9.8 percent of all KSI crashes but constitute 28.6 percent of fatal crashes.
Like many Hamilton County communities, Westfield has constructed several single and multi-lane roundabouts at intersections to improve both safety and traffic operations.
Westfield has an increasingly comprehensive multimodal transportation system. The shared use path and trail system currently has approximately 278 miles of public and private sidewalk, and over 80 miles of trails owned by the City of Westfield.
Maintain and modernize the street network to provide for current and future transportation needs that ensure safety for all modes of transportation.
See Action Steps in Chapter 5 WHO WILL DO IT?
See Implementation Matrix in Chapter 7
Establish street design standards including traffic calming tools, landscaping, and lighting standards to enhance safety and the user experience.
Create a comprehensive trails plan for trail development and design.
Provide public transportation between important entertainment and commercial destinations.
1. Increase connectivity throughout the city to reduce vehicle miles traveled by implementing the projects identified on the thoroughfare plan map.
2. Reduce the number of crashes throughout the city to below 30 by 2030.
3. Increase the number of miles of developed trails by 10 percent per year. Currently the city has 80 miles of trails.
4. All new developments should increase bike and pedestrian connectivity by addressing gaps in the bike and pedestrian system. Completed improvements shown on Bicycle and Pedestrian Gaps map by 2045.
5. Study the feasibility of implementing a circulator pilot program to move people from one area of the city to another. (e.g. downtown to Grand Park) within the next 5 to 8 years.
6. To reduce crashes, increase safety, and improve traffic flow, make intersection improvements as shown on the Intersection Improvement Map by 2035.
Ensure utility infrastructure accommodates growth through proactive coordination with utility owners and developers, protection and maintenance of existing assets, and prioritization of green infrastructure.
1. Proactive expansion of utility infrastructure is essential to support community activities and future growth.
2. Close coordination with utility owners ensures existing infrastructure can accommodate planned development.
The drinking water and wastewater systems were acquired by Citizens Energy Group (Citizens) in 2014. Any expansions, modifications, or improvements to these systems require coordination with and approval from Citizens.
Drinking water is supplied by 15 wells. Treatment capacity is 11.8 million gallons per day (MGD) of finished water. There is a total storage capacity of 3.58 million gallons within the distribution system, likely less than the average daily consumption.
The wastewater collection system is 100 percent separated sanitary sewer. There does not appear to be any significant infiltration and inflow (I/I) issues.
The Wastewater Treatment Plant (WWTP) was expanded in 2023 to treat a design average daily flow (ADF) of 5.0 MGD, peak hourly flow of 12.0 MGD, and maximum daily flow (MDF) of 10 MGD.
• The ADF from 2022-2024 was 3.43 MGD, 68.6 percent of the design ADF.
• The MDF from 2022-2024 was 7.26 MGD, 72.6 percent of the design MDF.
3. Maintenance of existing infrastructure decreases the likelihood of failure and associated annual costs of rehabilitation and replacement.
4. Low impact development (LID) and green infrastructure provide stormwater management while minimizing impervious surface, preserving natural features, and improving flood resilience.
The City of Westfield owns and operates a Municipal Separated Storm Sewer System (MS4) which is permitted by the Indiana Department of Environmental Management. To fulfill the requirements of the MS4 General Permit, an update to the Stormwater Master Plan (SWMP) was completed in 2022, and a Stormwater Quality Management Plan (SWQMP) was completed in 2023.
• The SWMP identifies known drainage, flooding, and water quality problem areas and evaluates potential solutions.
• The SWQMP identifies several waterways within the City of Westfield as 303(d) Impaired Waters including Cool Creek, Grassy Branch, Jones Ditch, Lindley Ditch, Little Eagle Creek, Sly Run, and Woodruff Branch. All are impaired for recreational use.
There is limited right-of-way to perform maintenance on older infrastructure.
Work closely with Citizens on expansions, modifications, and improvements to the water and wastewater systems necessary to support development.
See Action Steps in Chapter 6 WHO WILL DO IT?
See Implementation Matrix in Chapter 7
Maximize the useful life of existing infrastructure through regular inspection and maintenance.
Eliminate illicit discharges and address problem areas identified in the SWMP and SWQMP to reduce flooding and improve water quality.
1. Schedule annual conferences with Citizens to discuss drinking water and wastewater infrastructure conditions and capacities, demand projections, and potential improvement projects.
2. Set a period of time in which drainage and flooding complaints submitted by customers will be addressed. Provide timely updates to customers on the progress of the complaint response.
3. Reduce contamination levels in impaired waterways where it is possible for the City of Westfield alone to do so.
4. Maintenance strategy for MS4.
Prioritize sustainable stormwater management in future development.




Placetypes are a detailed, visual description of the characteristics of development patterns that contribute to the unique make-up of the community. They were determined through the public visioning process and evaluation of existing conditions. Placetypes are a way to plan for experiences, character, and sense of place. Placetypes guide the look and feel of future development. They consider the activities or experiences in an area and then build out the development pattern, transportation pattern, design characteristics, public spaces and art, and activities that fit that experience. Placetypes allow the unique qualities of places to be accurately reflected in the built environment.
do placetypes differ from existing and future land uses?
Future land use maps traditionally focus on use-driven guidance for future development. Since the future land use map acts as the foundation for development regulation such as zoning and subdivision, the result can be new development with compatible uses, but not necessarily compatible character to the specific area.
PLACETYPES PLAY A PIVOTAL ROLE IN SHAPING THE IDENTITY AND BRAND OF A COMMUNITY IN MULTIPLE WAYS:
Each placetype has its own distinctive characteristics and atmosphere. For example, a “Downtown” placetype exudes charm and nostalgia, while a “Trail-Oriented Development” placetype emphasizes connectivity and accessibility. These unique experiences contribute to the overall identity of a community and while they could have a similar mix of housing and commercial, their overall character, identity, and architecture would be very different.
Fostering a Sense of Place: Placetypes help create a sense of place by emphasizing the features that make an area special. When those elements and characteristics that create a sense of place are identified, it makes implementation easier to ensure future developments are inline and contributing to that overall placetype. Whether it is the adaptive reuse of a once-industrial area or more open green spaces these designations help residents and visitors connect with the environment on a deeper level. Both provide similar gathering areas for residents but have a different feeling and identity.
A well-defined placetype can attract investment and tourism by offering a distinct appeal and casting a common vision for an area. It is easier for a developer or visitor to see where they fit if a place has a strong identity. Areas with generic identities will attract generic development. A “Destination Development” placetype will draw regional attention, bolstering the community’s identity as a hub of creativity and culture. An “Innovation District,” can attract tech startups and entrepreneurs, solidifying the community’s brand as a center for innovation.
The framework for planning the future of Westfield is based on the character of its existing landscapes, community centers and neighborhoods. It introduces desirable forms of new and redevelopment that may not currently be encouraged through current land use regulations. This approach differs from the conventional future land use mapping that has been used for decades, and which underlies the current planning assumptions in the growth policy. In contrast, placetypes inspire a more comprehensive, sensitive, and effective place based approach to future growth in the city.
The application of Westfield’s placetypes is intended to facilitate the development and redevelopment of a durable, attractive, resource-efficient and well-designed city. The placetypes are arranged along a continuum of development patterns ranging from farmsteads to the urban core downtown. The following pages present the placetypes developed specifically for Westfield. Placetype details include aspirations, a description of existing conditions and opportunities, and guidance on future development and mobility characteristics.
Placetypes describe the long-term vision and characterize specific areas based on different places in Westfield including neighborhoods, recreation/parks, mixed use areas, employment and industry hubs, and open spaces. Westfield’s placetypes are a high-level guide for the desired mix of uses, defining the character, scale, form, and function of these places as well as addressing infrastructure needs. The placetype descriptions have been transformed into a physical two-dimensional map identifying the location of the placetypes within the community. The placetype descriptions also include precedent imagery that invokes the type of well-defined, unique, and desirable places Westfield wants to see occur within each placetype. Identifying these placetypes will involve either redevelopment/improvements to existing places, or development of entirely new places. Overall placetypes help to articulate desired physical characteristics with context sensitive applications across the city, while helping to prioritize trade-offs associated with stated goals.
There are nineteen placetypes and one special development consideration on the Future Development Map. Each placetype defines primary land uses. In many cases, these uses are encouraged to be intermixed. Depending on the placetype, mixed use can be created in different ways. First, there is horizontal mixed use where compatible land uses are developed where each use is contained in separate buildings across the site in a walkable and well-connected fashion. Then, there is vertical mixed use where uses are integrated into a single multi-story building with one use on the first floor and other uses on the upper floors.
Secondary land uses are also identified, but these uses should be developed in an auxiliary or limited capacity, to not exceed the primary land uses within each placetype.
Beyond land uses, the placetypes contain recommendations regarding building form (height, placement, and character), site design (landscape, amenities, access, and parking), and transportation (vehicular, bicycle and pedestrian, and transit). Finally, each placetype includes a set of precedent images that visually describe the intent of the placetype.
Many of the placetypes include additional guidance for development under “Special Considerations.” This guidance relates to specific areas on the Future Development Map that are unique, such as key segments of major roadways, prominent intersections, topographic concerns, or other characteristics that should be taken into context. In some instances, these special considerations are supported with additional precedent imagery and subarea plans that have an in-depth perspective into how development should look and function.
Development intensity is a measurement of how much development is located on a parcel of land. It is important because it allows city staff and elected and appointed officials to understand how the impacts certain uses have on the land, infrastructure, public services, natural systems, and more. Development intensity is often quantified by two units of measurement:
• Floor-to-area ratio (FAR): Often used to measure both residential and non-residential uses.
• Residential dwelling units per acre (DU/acre): Used to measure residential uses. Also referred to as density.
Development intensity is highly related to its ability to pay for itself, meaning a property produces enough property tax for the city to maintain all the required roads, schools, utilities (water, wastewater, stormwater, electric, etc.), and public services (police, fire, EMS, trash, etc.) for that development. Typically, the more intense the development is, the more the development pays for itself in terms of services provided by the city.
As of the writing of this plan, the Indiana Property Tax Cap Referendum adopted in 2010 is in full effect, property tax rates in Indiana have been capped, meaning a property owner’s property tax bill cannot exceed the gross assessed value of:
• 1% for an owner-occupied primary residence (homestead).
• 2% for non-homestead residential property, including apartments, agriculture, and long-term care.
• 3% for commercial and industrial; and personal property.
Note: Institutional properties such as schools, civic buildings, and nonprofits are exempt from property taxes
Additionally, new state legislation that will take effect in, 2026 will limit local government revenues by further limiting property taxes, raising minimum thresholds for business personal property taxes (which will exempt many businesses from personal property taxes), and allowing increases in local income taxes to offset losses in property taxes. Many communities, including Westfield, are projecting revenue shortfalls due to the legislation. Unless there are legislative changes within the next year or two, this will have a significant impact on the services and quality of life that Westfield is able to offer residents in the community. This topic will be monitored by the city, and any relevant or necessary updates to this plan will be made accordingly.
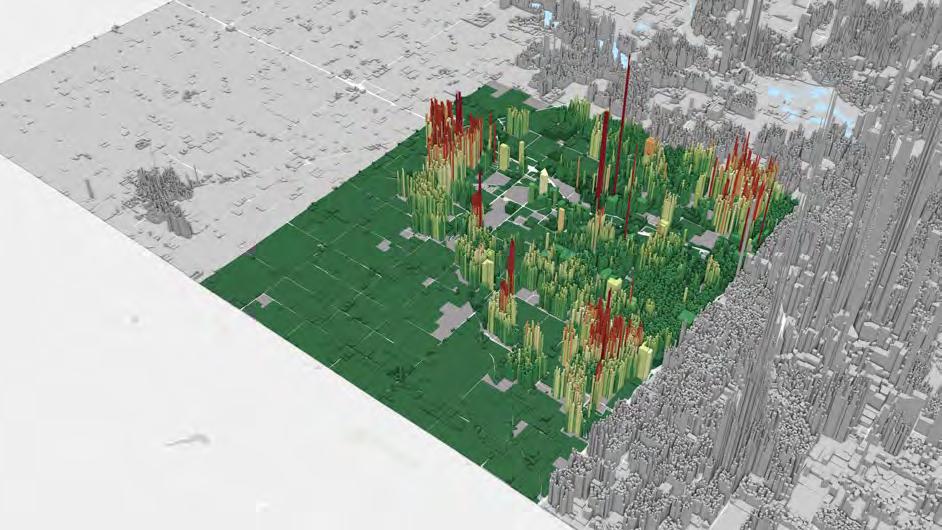

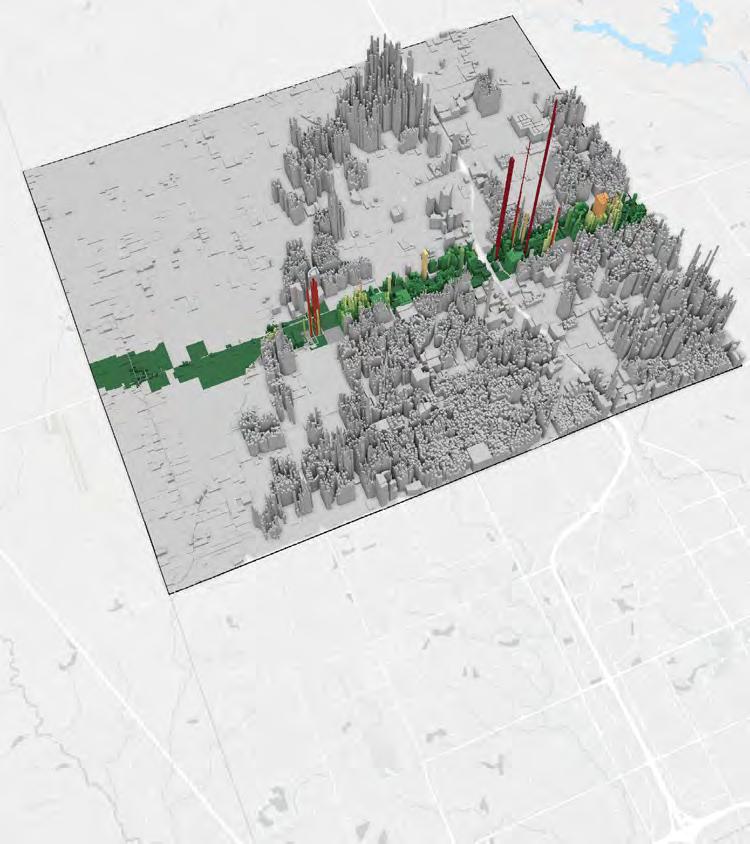
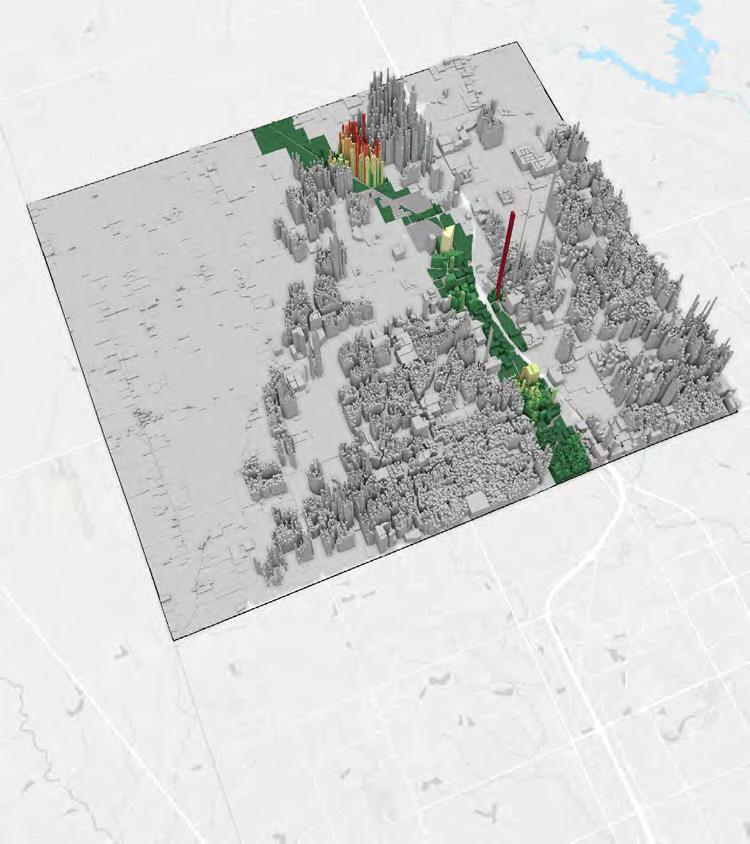
As part of this study, a property value study was completed to understand the density of development impacts the assessed value per acre. As mentioned before, residential density is often measured by the number of dwelling units per acre. Density plays a significant role in preserving both rural and natural areas. When comparing densities to each other, a lower density development uses more land to house 100 people than a higher density development. Higher density developments provide for more development within a smaller area, limiting the amount of infrastructure (roads, utilities) needed to serve the same number of people, reducing public service costs (trash collection, snow removal, police patrols and fire runs), and increasing the amount of tax revenue per acre to provide services. Increasing the density near built-up areas, where existing infrastructure is available, is preferable than continually developing greenfield sites that are typically developed at a lower density and may not have readily available utility extensions.
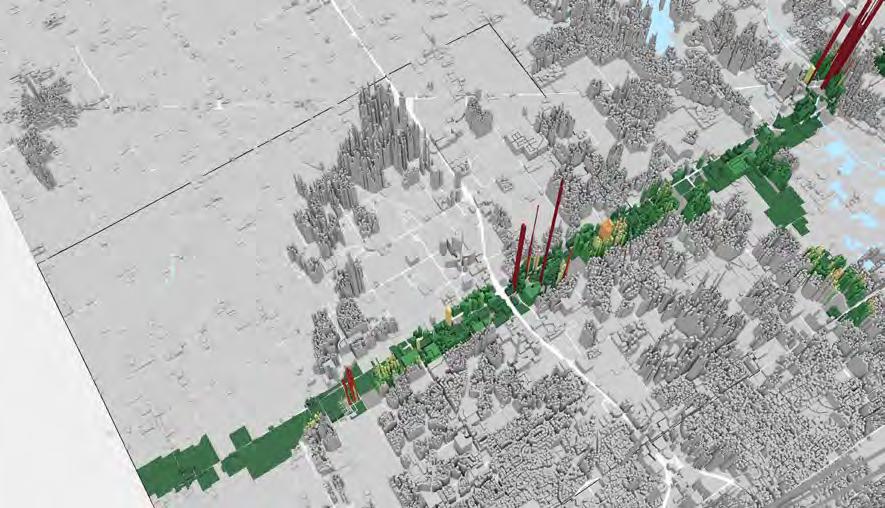
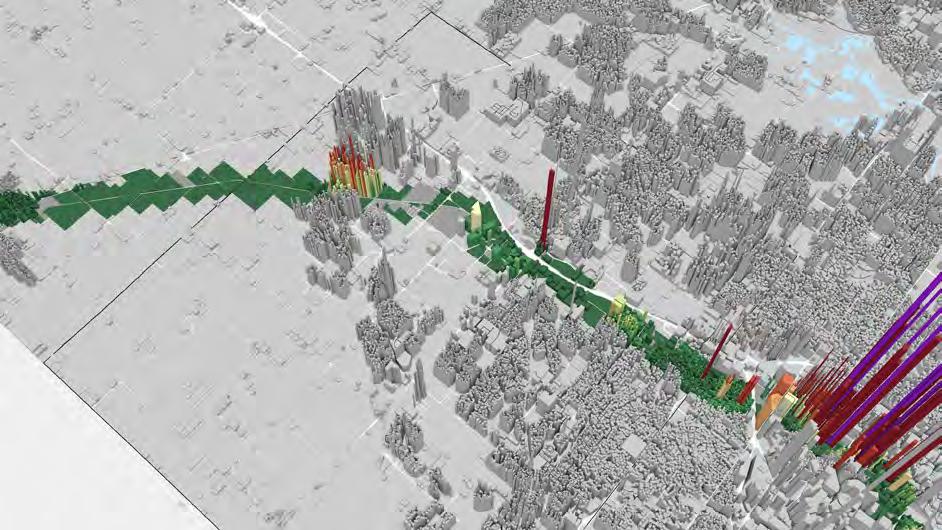
The map on the previous page illustrates the assessed value per acre for Westfield-Washington Township. The areas in red and orange illustrate the highest value per acre in areas like Chatham Hills ($6.8M per acre), Westfield’s downtown ($10M per acre), townhomes on Midland Trace Loop ($14M per acre), and Harmony Apartments along 146th Street ($2.9M per acre).
Additionally, an analysis was completed for the two named trails, the Monon Trail and the Midland Trace Trail. Several developments located along these trails are higher density and aligned with a principle called Trail Oriented Development (TrOD). TrOD is defined as a compact development pattern that is mixed use, residential, and/or commercial; clustered around off-street walking and bicycling infrastructure, walkable, human-scaled design, context oriented specifically towards trails and their users. It intends to create vibrant places that promote active modes of transportation and recreation. The benefits of this type of development include improved transportation options, encouraging physical activity that improves public health, the creation of spaces that support vibrant local economies, and adds amenities that improve neighborhood quality of life.
On the maps on the following page, the assessed value of each trail was calculated. The Midland Trace Trail has an average value per acre of approximately $477K based on a total of $914M in total tax value. Some of the TrOD properties that contribute to this value per acre include Midland by Estridge Homes ($5M per acre), 408 Park Street ($10M per acre), 100 N Union St ($10M per acre), 208 Midland Trace Loop ($14M per acre), and Villages at Oak Manor ($4M per acre).
The Monon Trail has an average value per acre of approximately $414K based on a total of $769M in total tax value. Some of the TrOD properties that contribute to this value per acre include Shadow Lakes ($3M per acre), 408 Park Street ($10M per acre), Retreat on the Monon (3M per acre) and One46 Monon ($9M per acre).
One huge advantage for Westfield is that both the Midland Trace Trail and the Monon Trail have land that can be developed to maximize the value per acre. The Midland Trace Trail has a total of 5,900 taxable
acres with 35% or approximately 2,065 acres remaining for development; while the Monon trail has 4,500 taxable acres and has 44% vacant or 1,980 acres remaining for development.
By increasing the density near built-up areas, especially around the named trails, and adhering to the principles of TrOD, and where existing infrastructure is available, it would be able to maximize development potential for tax revenue, provide a quality of place that attracts talent, and leverages investment in its infrastructure.
Finally, besides recognizing the impact of density, it is important to understand that density can look drastically different between different places, even at the same density level. That is illustrated by the developments along the named trails. The look/feel of density comes down to its design and layout, which is described by the placetypes, to create a vibrant and attractive city.





The Future Placetype Development Map identifies where placetypes should be physically located in the community as Westfield continues to develop and redevelop certain areas. It does not dictate when development occurs, rather it describes how development should look, feel, and function if/when it does occur. The process of making the map included:
• Real estate development, population, economy, housing, and environmental trends in the Township which is document in the Appendix .
• Public feedback from workshops, the project website, and other events.
• Focus group discussions with elected and appointed officials, city staff, Westfield-Washington Schools, utilities, local community organizations, non-profits, developers, downtown and other city/township businesses, county and state agencies, and the public.
The Planning Area includes not only the city, which has annexed land since the 1970’s, but all of Washington Township. The city completed a township joinder back on May 11, 1977, which gave the city planning and zoning jurisdiction over the entire township.
Nodal idea theory was used to construct this plan. Jolietville, Lamong, Eagletown, and Hortonville were founded in the 1800s because they were on a railroad or horse trail. These areas were designated redevelopment hubs in the 2007 comprehensive plan and were carried over into the 2045 comprehensive plan.
The “Village Concept” aspired to make these sites into walkable “mini neighborhood nodes” that reestablished the transportation grid and served nearby neighborhoods. The Village Center Placetype establishes a mini-neighborhood hub for small-scale mixed use development, public spaces, and indoor/outdoor recreation. It is planned for these neighborhoods to seamlessly transition between the Village Center and Village Neighborhood Placetypes. The Village Neighborhood Placetype allows villages around this node to have a mix of housing kinds.
Starting on page 54, the first 18 placetypes are detailed. After Parks, Conservation, and Open Space, 7 mixed or hybrid placetypes exist. Due to the future growth pattern, a parcel or group of parcels could become one of two placetypes, which may not exist in these locations. The following hybrid placetypes exist:
• Tree Stands (Overlay): This overlay shows Westfield and Washington Township’s undisturbed tree groves. The purpose of presenting these tree groves is to demonstrate their community value and encourage their preservation and incorporation into new development.
• Village Neighborhood / Trail Oriented Development: This area is located north of Jolietville and has the potential of higher density development depending on the route of the Midland Trace Trail.
• Innovation District/Open Space: On the east side of Westfield, adjacent to US 31 and SR 38, there is one parcel. Surrounding this parcel is the innovation district placetype, however, it is possible that this area stays as open space as there are also significant park lands, agriculture, and open space.
• Open Space / Estate Rural and Equestrian: Located in the southwest quadrant of Washington Township, these parcels contain several rural estates and equestrian facilities. However, due to environmental features, these parcels may be best preserved as open space and not developed.
• Estate Rural and Equestrian and Traditional Residential: Most of these areas are located outside the city limits in the Township. Currently, these uses are agriculture, estate rural, or other low intensity uses. When the rest of the township fills in with development, these areas are designated to be developed with traditional residential units.
• Estate Rural Equestrian and Master Planned Residential: There is one area located in the northwest corner of the township that could be developed as master planned residential placetype which requires a higher level of design, sensitivity to natural features, and allows a mix of uses.
• Destination Development and Master Planned Mixed Use: This placetype is located just south of Grand Park, east of Spring Mill Road, and south of a large area of destination development. This area could be developed as destination development or master planned mixed use to support Grand Park Sports Campus, the Grand Park district, or commercial areas off SR 32.
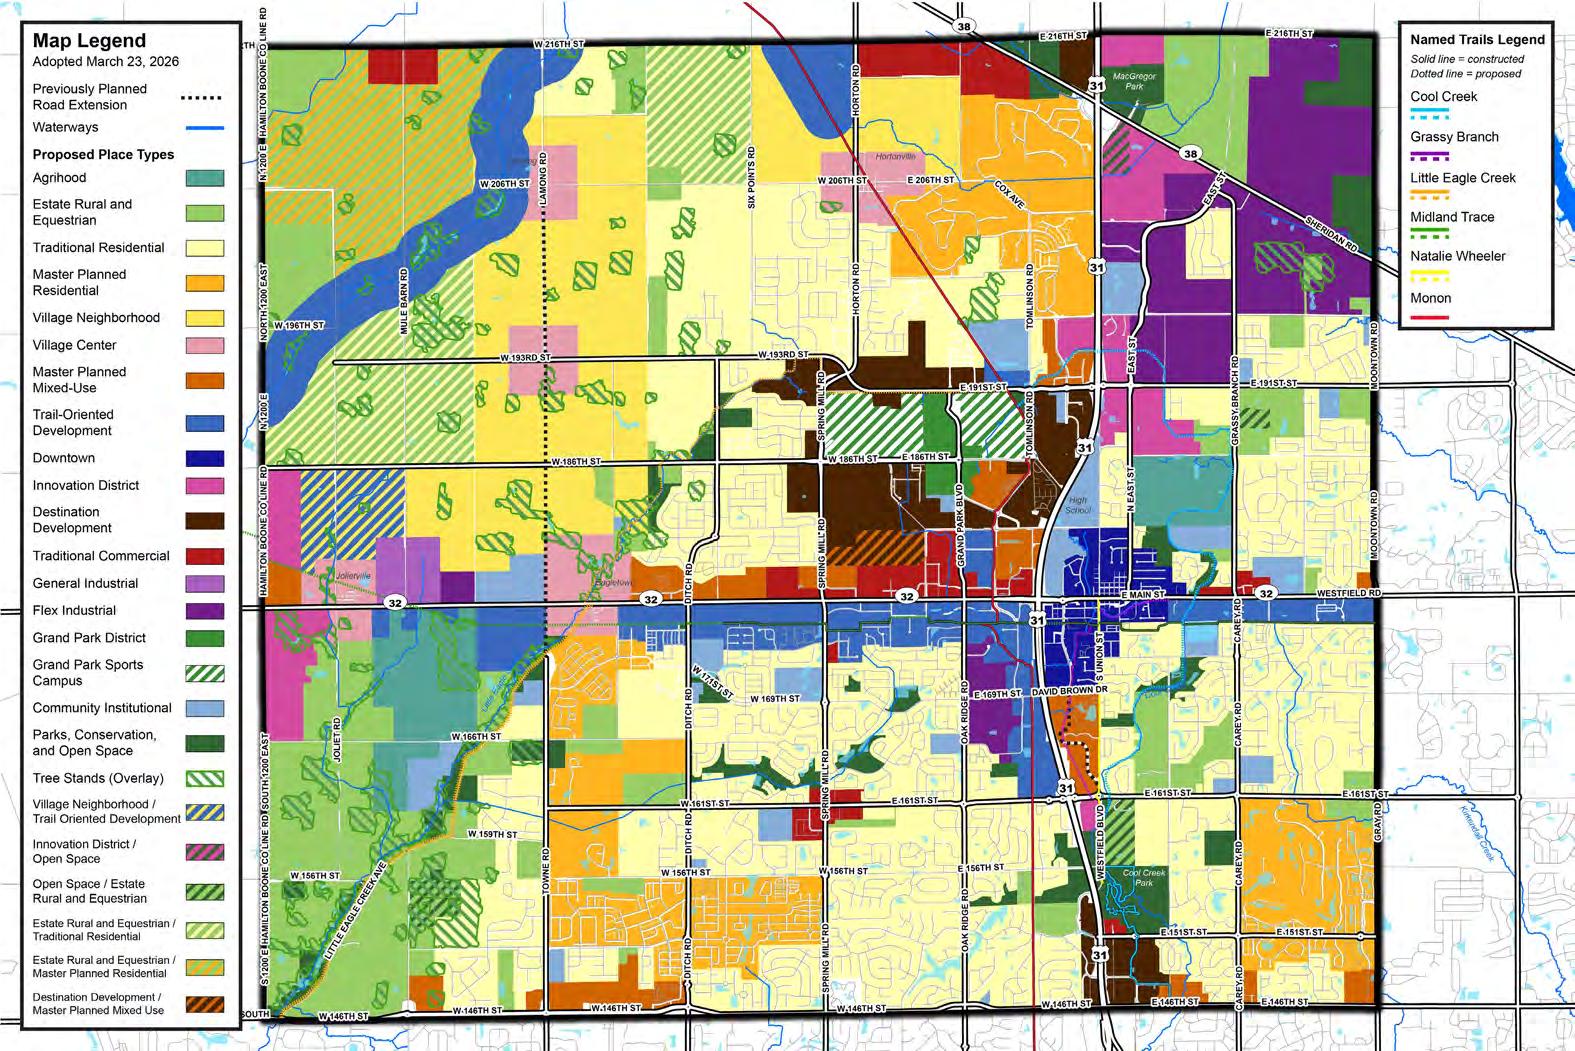
*The examples provided in the table below are not an exhaustive list of uses for the broad category of land use.
Legend
P=Primary Uses
S=Secondary Uses



P=Primary Uses
S=Secondary Uses





The MIBOR Realtor Association, Central Indiana’s chief realtor organization of 10,000+ members, conducts a survey across the Indianapolis Metropolitan Area every six years, most recently in 2022. The survey asks about people’s satisfaction with the community in which they live and/or where they want to live. A full report is available on the Indianapolis Metropolitan Planning Organization (IMPO’s) website here: https://www.indympo.org/maps-and-data/data-studies . Ten key findings from the report include:
1. Higher quality of life satisfaction than other metropolitan areas, especially in suburban counties of the Indianapolis Metropolitan Area like Hamilton County.
2. Only 32% of respondents living in Hamilton County were satisfied with the number of shops/restaurants within walking distance of their home, the second highest satisfaction score, behind Johnson County.
3. Across the metropolitan area, satisfaction with housing affordability, road quality, and walkability lagged other neighborhood qualities.
4. Respondents ranked (1) safety, (2) reliable/high-speed internet, and (3) the quality of streets and roads as the three most important aspects of a community.
5. Neighborhood qualities, like nearby shops and amenities, were consistently more important than home qualities, like size and appliances, in deciding where people would like to move.
6. Most respondents preferred to live in mixed use suburbs with different kinds of housing where you can walk to stores and restaurants.
7. A single-family home remained the most preferred home type but has decreased in preference. On the other hand, singlefamily attached homes (duplexes, triplexes, townhomes) have seen the largest increase in preference.
8. People who were younger, unmarried, and/or currently renting were more likely to favor walkable communities.
9. Households with children were more likely to rank open space with higher importance.
10. In suburban counties, such as Hamilton County, respondents’ preferences were split half-and-half for either (1) a walkable neighborhood with a variety of housing types or (2) a neighborhood with only single-family homes where you must drive to stores and restaurants.
These best practices should be applied to all placetypes. They include greenspace design, street design, connectivity, building and site design. However, their application should always be sensitive to the context of the area by allowing for some flexibility if there is a high level of difficulty in constructing and/or maintaining a development long-term.
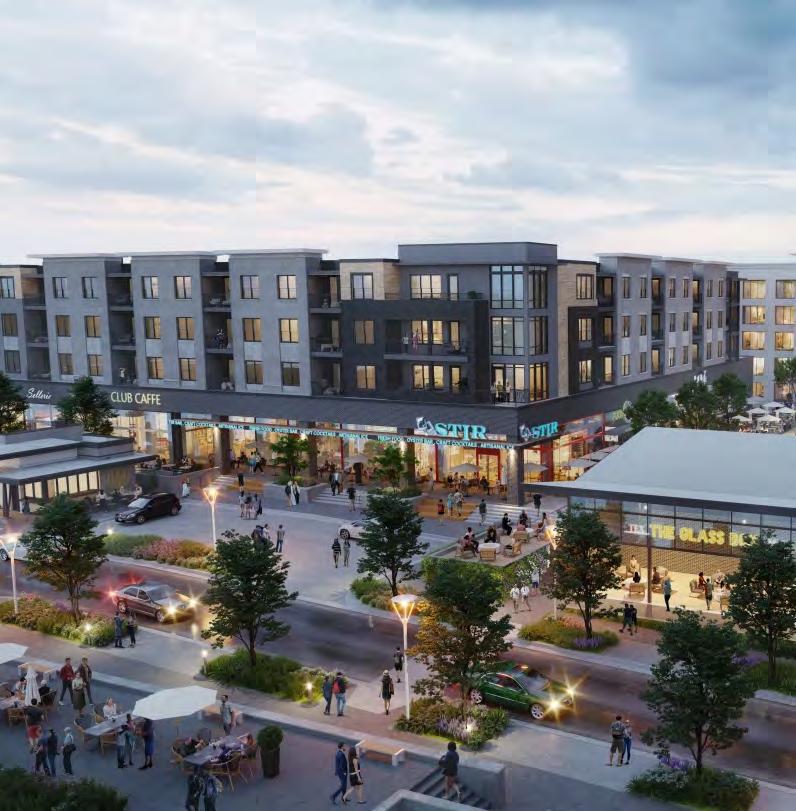
• New development should be contiguous to and with existing development. The city does not support leapfrog development.
• Preserve natural features or integrate them into a development’s design.
• Piece together natural features and open spaces across developments throughout the city and township to create as continuous forested/tree preserve/wildlife corridors.
• Buffer pedestrian, bicycle, and vehicular traffic from each other with grade separations and, where possible, planting strips.
• Use native trees and vegetation in planting strips or medians (see IDNR and the Indiana Wildlife Organization for a list of native species).
• Preserve sight lines at intersections for increased safety and visibility.
• Enforce the city’s Complete Streets policy when repaving, replacing, or designing new streets to incrementally improve and build a safe and connected multi-modal street network.
• Ensure pedestrian and bicycle crossings are highly visible to vehicular traffic.
• Incorporate accessible design infrastructure at crossings where appropriate (e.g., ADA ramps, diagonal crossing, tactile paving, audible pedestrian signals, etc.).
• Locate utility infrastructure underground where possible and, when locating underground is not possible, screen infrastructure with vegetation or beautification methods (e.g., utility boxes can be painted to become public art or murals).
• Connect all commercial and residential developments to nearby multi-use pathways, trails, businesses, green spaces, and other amenities. This makes walking a useful activity.
• Entrances to all buildings should have clear, safe, and convenient pedestrian access to and from nearby pathways, trails, and parking. This makes the walk safe and comfortable.
• There should be several connections between adjacent developments and subdivisions, by both filling in connectivity gaps in existing development and proactively planning connections for new/ future development: including but not limited to stub streets and trails.
• All use mixed use districts should provide an enhanced pedestrian system with the use of through-block trail systems, recreation, corridors, and enhanced rights-of-way which provide direct connections to community facilities, such as parks and civic buildings, as well as shops and employment areas. This makes the walk interesting, which encourages people to choose to walk to destinations.
• Cul-de-sacs are discouraged as they fragment the street network; however, if present, they should maintain pedestrian connectivity to the broader network with pathways between parcels.
• Locate surface parking areas behind buildings or within the interior of developments to promote street-side pedestrian and bicycle activity.
• When a parking lot is present behind or on the side of a building, a secondary entrance is encouraged from that area for convenient access to the building.
• Screen parking lots from the street with vegetative buffers or low-height walls, while maintaining clear sightlines into the lot for public safety.
• Design parking garage facades to complement the character of surroundings buildings while maintaining visibility and/or transparency into and throughout/within the garage to enhance safety.
• Consider first floor retails/services in a parking garage with upper floors for parking to activate the ground floor.
• Locate cafes and gathering spaces along streetscapes and improve pedestrian and bicycle access to building entrances.
• If a parking lot has more than two parking aisles/rows separating the primary building entrance from the street, incorporate a clearly marked, high-visibility pathway for pedestrians and bicyclists to safely access the building entrance.
In his book “Walkable Cities” Jeff Speck establishes that the core principles of walkable communities are:
• Needing a reason to walk
• Safe and comfortable walk
• Interesting walk
• New buildings should complement the character, design, and placement of their surroundings, especially in areas that have existing development.
• Buildings should have at least one front entrance facing the primary street to create an accessible and welcoming appearance. Buildings along trails should have a secondary front entrance facing the trail.
• Along major roads, buildings should be setback farther than on local roads to allow space for outdoor seating, wider sidewalks, bike racks, and other pedestrian-friendly features.
• Sidewalks and trails should be continuous across driveways and entrances, keeping pedestrians and cyclists at the same level as the sidewalk instead of lowered to the vehicular level, making walking and biking more comfortable, improving visibility for drivers, and enhancing traffic safety.
• Encourage landscaping features like rain gardens, bioswales, and other native plantings to manage stormwater runoff, enhance biodiversity, and improve groundwater quality.
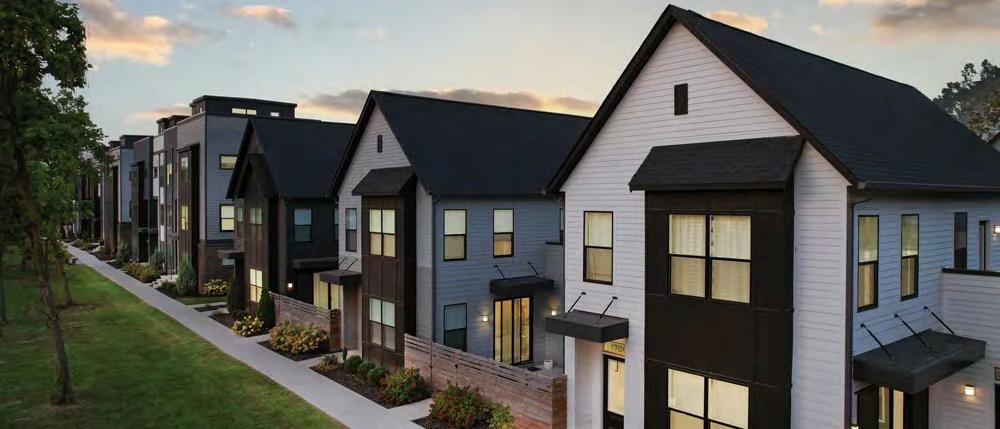
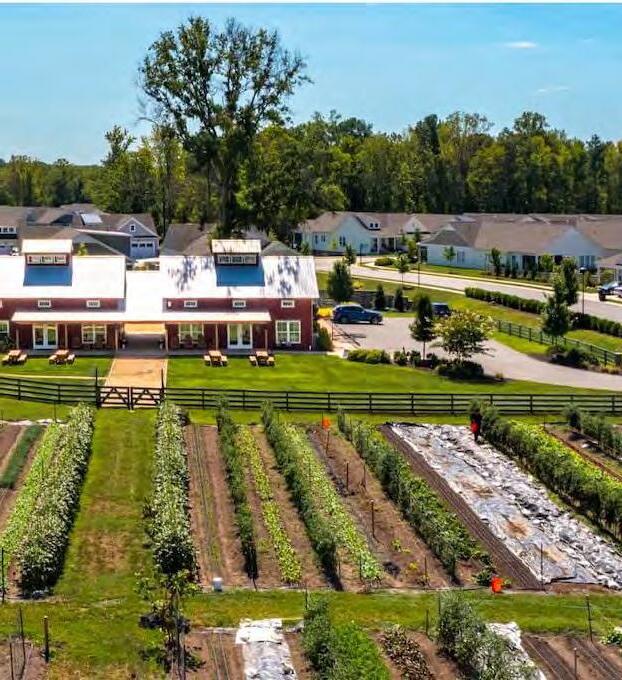
The Agrihood placetype is a well-planned residential community that integrates residential with a working farm or agricultural space, which provides residents with access to fresh food, open space, and opportunities for engagement through farming-related activities. This placetype can be centered around a working farm, community garden, forest, or riparian preservation as the focal point of the neighborhood. Additionally, there is educational and social programming, preserved open space and rural character, containing walkable and bikeable connections. The Agrihood placetype may include a small-scale mixed use retail center integrated into the development to provide everyday goods and services to the surrounding residents.
1. Development is centered around a working farm, community garden, or an orchard as the centerpiece.
2. Promotes shared community connections like harvest fests, farm-to-table dinners, or workshops within dedicated open spaces.
3. Encourages healthy lifestyles through gardening, outdoor activity, and walkable design, providing residents with fresh hyper-local food.
4. Typically include conservation practices such as soil restoration, stormwater management, or habitat preservation.
5. Often integrates a mix of housing types that are clustered to preserve open space, farmland, or tree groves. Farm and open space double as an amenity, like a park or golf course would in other developments.




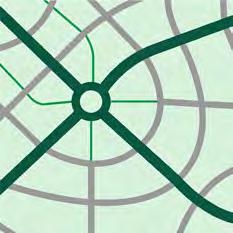
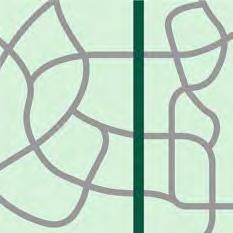
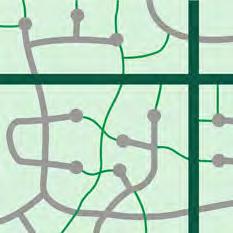

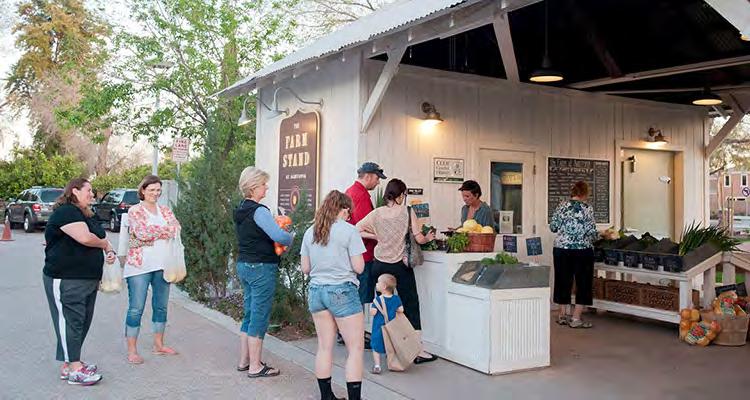
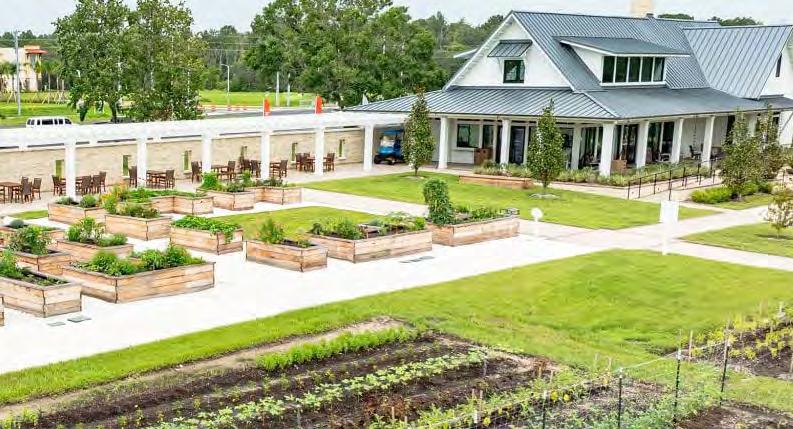
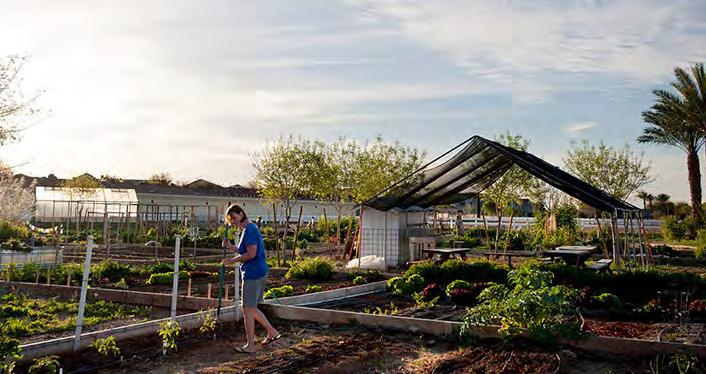
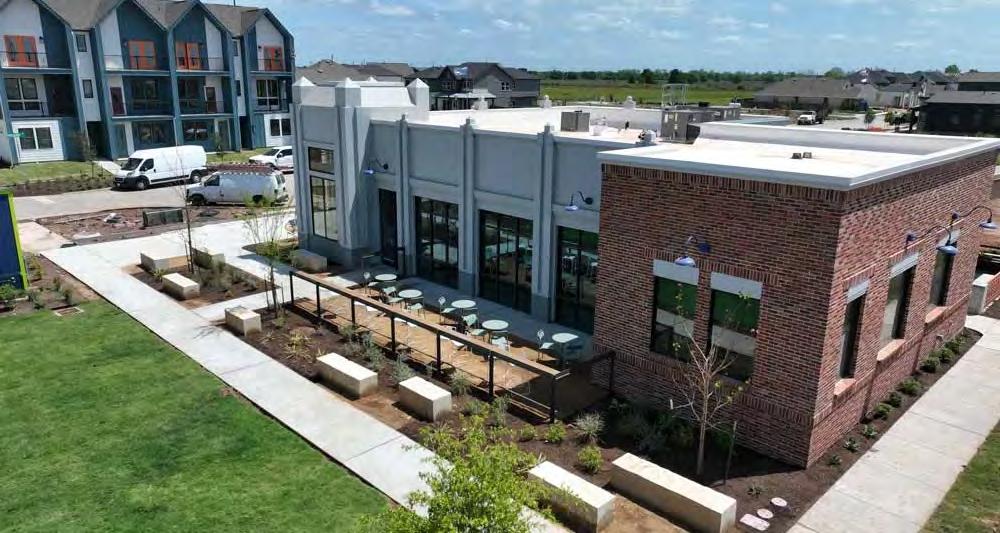
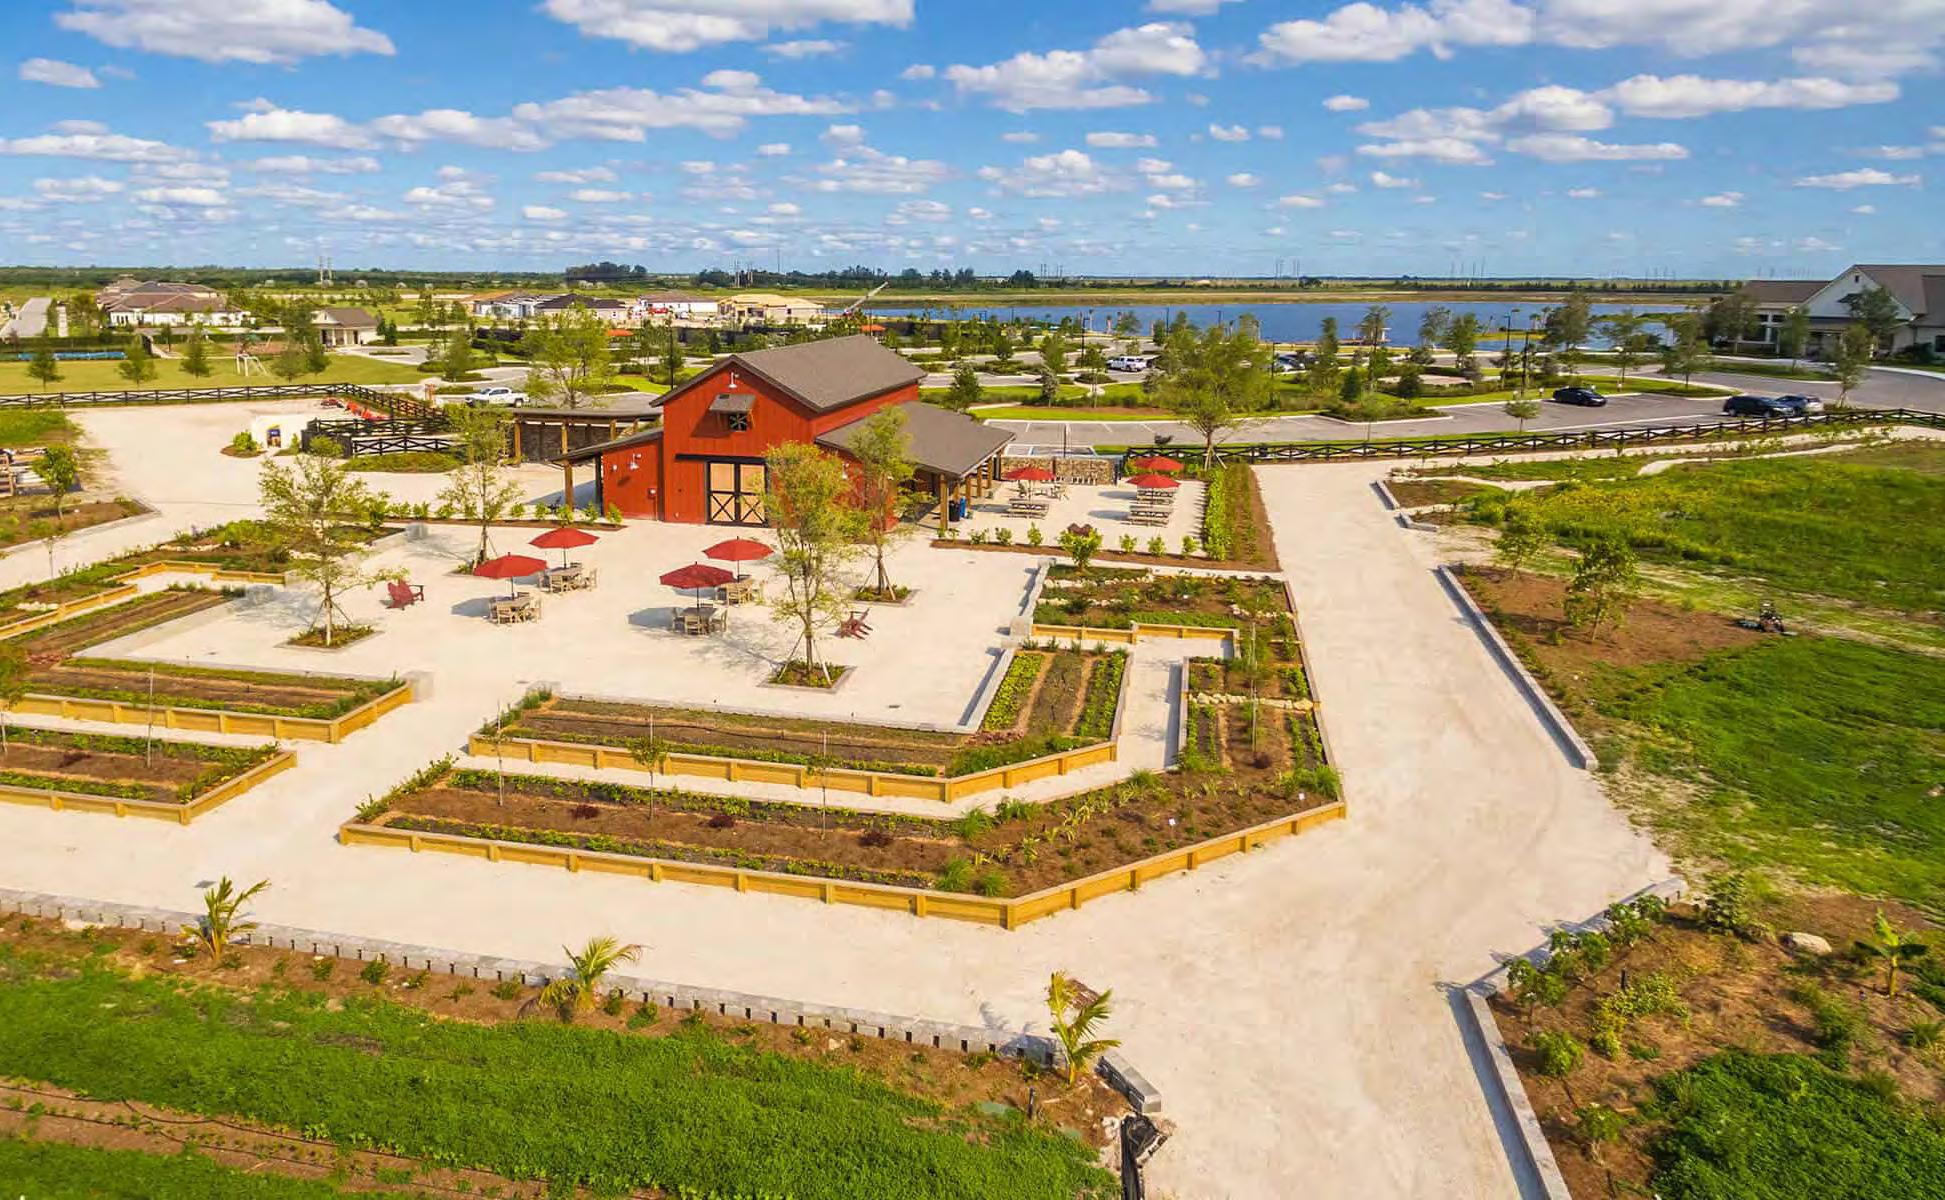
4.19: Agrihood / Agriculture / Agribusiness Placetype Characteristics.
Street Network
The appearance and design of streets within the placetype, especially elements that enhance the experience of the public atmosphere. The character of buildings and amenities that do not sit directly in the right-of-way are discussed in later sections.
• Street networks should follow natural contours of the land and preserve the edges of water bodies, joining gridded networks where possible.
• In this type of subdivision, curvilinear or traditional grid streets will work best to preserve farmland/natural features and connect people with activity.
• Streets should have low speeds and incorporate traffic calming design measures.
• Resident parking should be limited to private cars. Surface parking lots should be avoided in the primary residential areas.
• Streets within the agrihood should be designed for walkability and incorporate street parking for guests. Limit the use of cul-desacs.
Commercial Vehicles
Bicycle and Pedestrians
• Large commercial vehicles should be prohibited in the area and re-routed, except when making a delivery to a building.
• Design farm-loading off local streets with turning radius to accommodate tractors and box trucks; keep conflicts off main roads.
• Development should connect to named and perimeter trails, where feasible.
• Newly developed streets should directly accommodate pedestrians and bicyclists as complete streets.
• Sidewalks should be grade separated. Sidewalks, named and perimeter trails, should be buffered from traffic in some way (bollards, trees, landscaping).
• Internal trail network connecting homes to fields, school bus stops, and nearby parks; shared-use path 10–12 ft wide; farm-service lanes separate from primary trails where feasible.
• Golf carts could serve as alternative form of transportation.
Golf Carts
On-Street Parking
Speed and Capacity
• Golf carts may use the same space as passenger vehicles.
• On-street parking is permitted.
• Turn lanes, deceleration lanes, or roundabouts should be considered at entrances to improve traffic flow.
Characteristics of the design and layout of a property, especially in relation to surrounding properties, which include both the land and any buildings on the property.
• Typical Block Size: N/A
• Typical Lot Size: 6,000 square feet. Smaller lot sizes may be used to accommodate tree preservation and open space.
Block & Lot Patterns
Access Points
• Typical Land Coverage: 60-80% per lot
• Agricultural / Open Space / Community Garden: Enhanced integration and emphasis on Agriculture, Open Space, Community Gardens, Tree Preservation, Forrest, Riparian Preservation, and Enhanced Landscaping throughout development.
• Curb cuts for driveways are common on roadways.
Building Placement
Setbacks/Built to
• Primary building entrances should be oriented toward the street, except for cottage court developments where buildings face a center greenspace.
• Commercial areas should be clustered along the farm/community hub and serve as an anchor to the development.
• Building heights should be 2 stories or fewer but may be higher within a village center when integrated into the Agrihood.
• Agricultural-related accessory structures should not be greater than 100-feet tall. If more than 100-feet tall, Indiana Tall Structures Act is triggered.
• Front Yard Setbacks should generally be a minimum of 10-feet or greater to help frame views to fields and open space and activate edges with porches.
• Non-residential buildings should be minimum of 0-feet to a maximum of 10-feet from the sidewalk. Exceptions for increased front setbacks may be granted for landscape areas or outdoor activities like dining areas.
Off-Street Parking Areas
• There should be at least 2 parking spaces on site for residential dwelling units. Parking for commercial uses should be on-street, or in a designated area.
• Shared parking for events (unpaved stabilized turf or permeable pavers).
Amenities & Open Spaces
• Small amount of commercial space should be planned for and integrated on a local street corner with safe access, pair this with a small plaza and shade trees.
• Maintain open space around buildings to preserve a feeling of openness.
• Playgrounds, green spaces, and other outdoor recreational areas are encouraged for supporting civic and institutional uses.
• Preservation and restoration of natural features including floodplains, riparian buffers, tree rows, forested areas, wetlands, waterways, and other natural features are encouraged, including replacement of invasive plants with native plants.
Landscaping
Stormwater Management
• Lot splits, wherein one lot retains only the riparian buffer and any other natural features like floodplain area, is highly encouraged to better protect and conserve these features.
• Plan for regional drainage detention and water quality measures.
• Integrate swale-connected rainwater from rooftops.
• Riparian Buffers: 75-feet on each side for Cool Creek and Little Eagle Creek; and 50-feet from other streams or ditches.
Special Considerations Areas within each placetype that have unique conditions for which additional considerations are recommended.
• Require at least three different housing types (cottages, townhomes, small lot detached (single dwelling unit).
• Allow accessory dwelling units.
• Ensure there is a buffer between farm operations and dwelling units – between 50 to 100-feet, landscaped in a natural form.
• Develop a farm hub/community hub within walking distance of most units (1/4 – ½ mile).
• Permit seasonal events with event management plans (parking, noise hours, traffic control, etc.).
• Lots require connection to water and sewer.
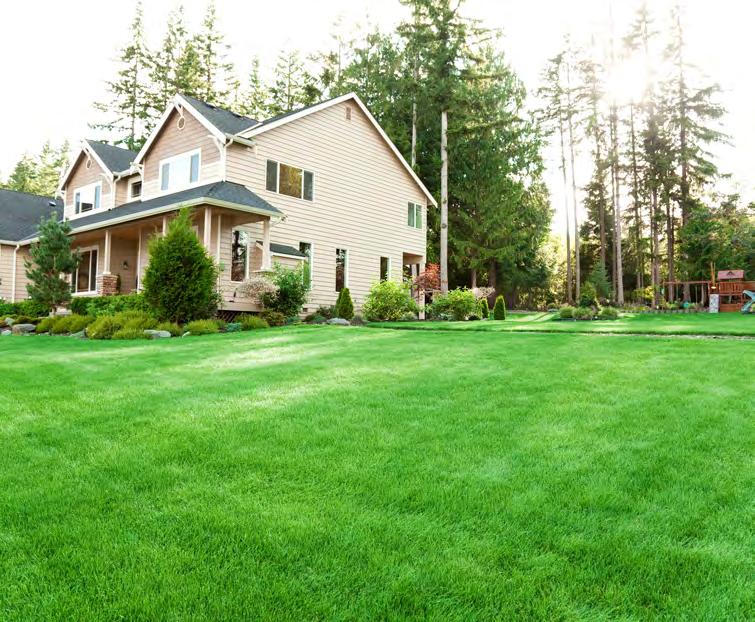
1. County roads lined with crops, interspersed with large lot single-family homes, which define the landscape.
2. Farming and agritourism are present adding to the rural character and beauty of this area.
3. Development is limited to detached single-family homes and accessory dwelling units (ADUs) to preserve the area’s rural and spacious character while maintaining a low-density residential focus.
4. Abundant open spaces create a peaceful, secluded environment for residents seeking privacy and tranquility.
This placetype generally consists of farmland, farms, and large lot estate residential dwelling units. This placetype includes open fields, hedgerows, woodlands, streams, farms of all sizes, single dwelling units, as well as accessory buildings, such as barns. Access to roadways is critical as housing in these areas is not likely in a traditional subdivision. Roadways may be grid-based or curvilinear based on topography and other natural features such as stream corridors and wooded lots. Context sensitive clustered subdivisions, with small lots could be considered in these areas if well-designed and have access to public water and sewer.
These areas include a mix of large estate lots, active agricultural and agritourism uses. The density in these areas is very low. These areas have streams, tree stands, and topography that adds to its scenic beauty.
As landowners feel more pressure from growth moving west, it is anticipated that eventually these areas will build out, but past the lifetime of this plan. However, the city needs to be proactive in protecting the remaining tree stands, stream beds, and other natural features in these areas.
5. Limited sidewalks and trail connections exist, except for the Midland Trace Trail, many cyclists use the county roads for recreation.
6. There are opportunities for agricultural tourism, such as farm tours (Stuckey’s) and roadside produce, that encourage relationships between rural and urban areas.
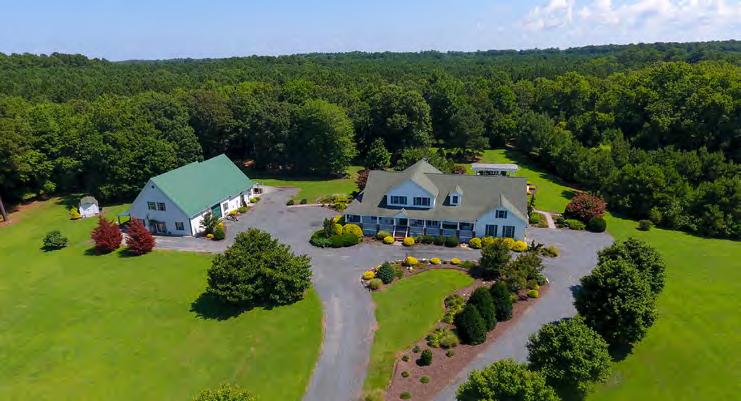
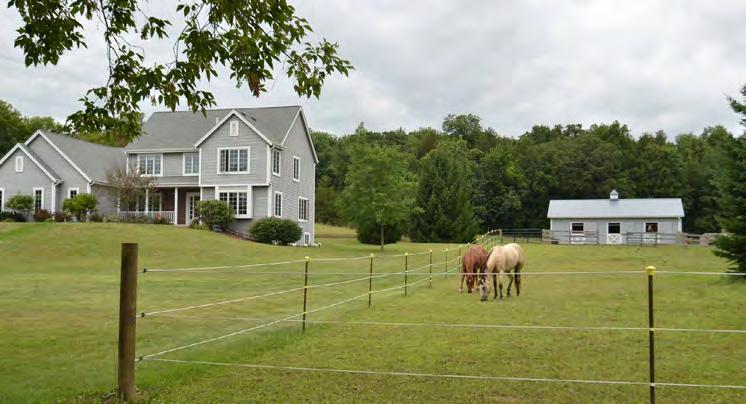
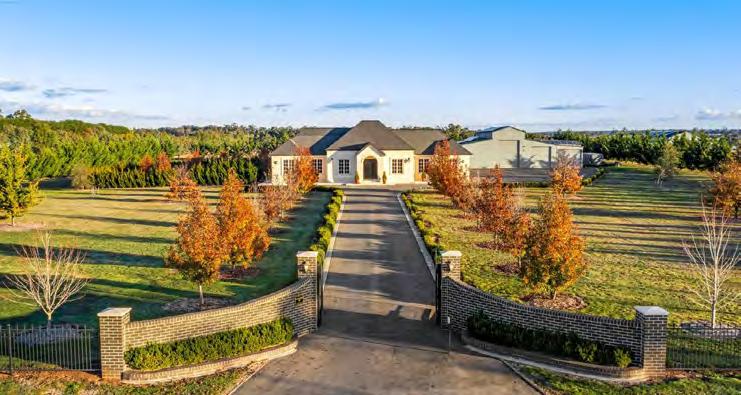
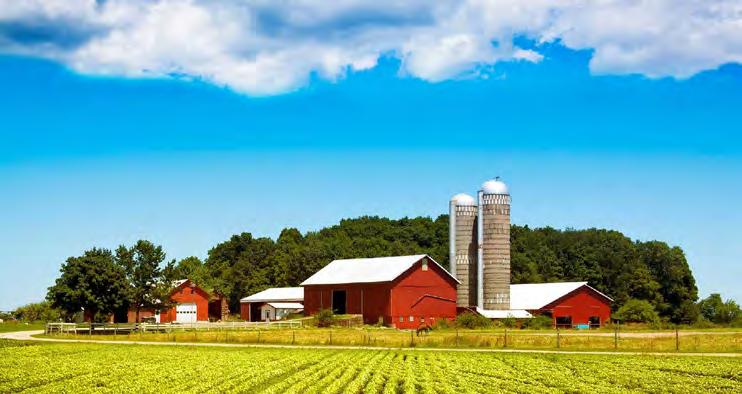
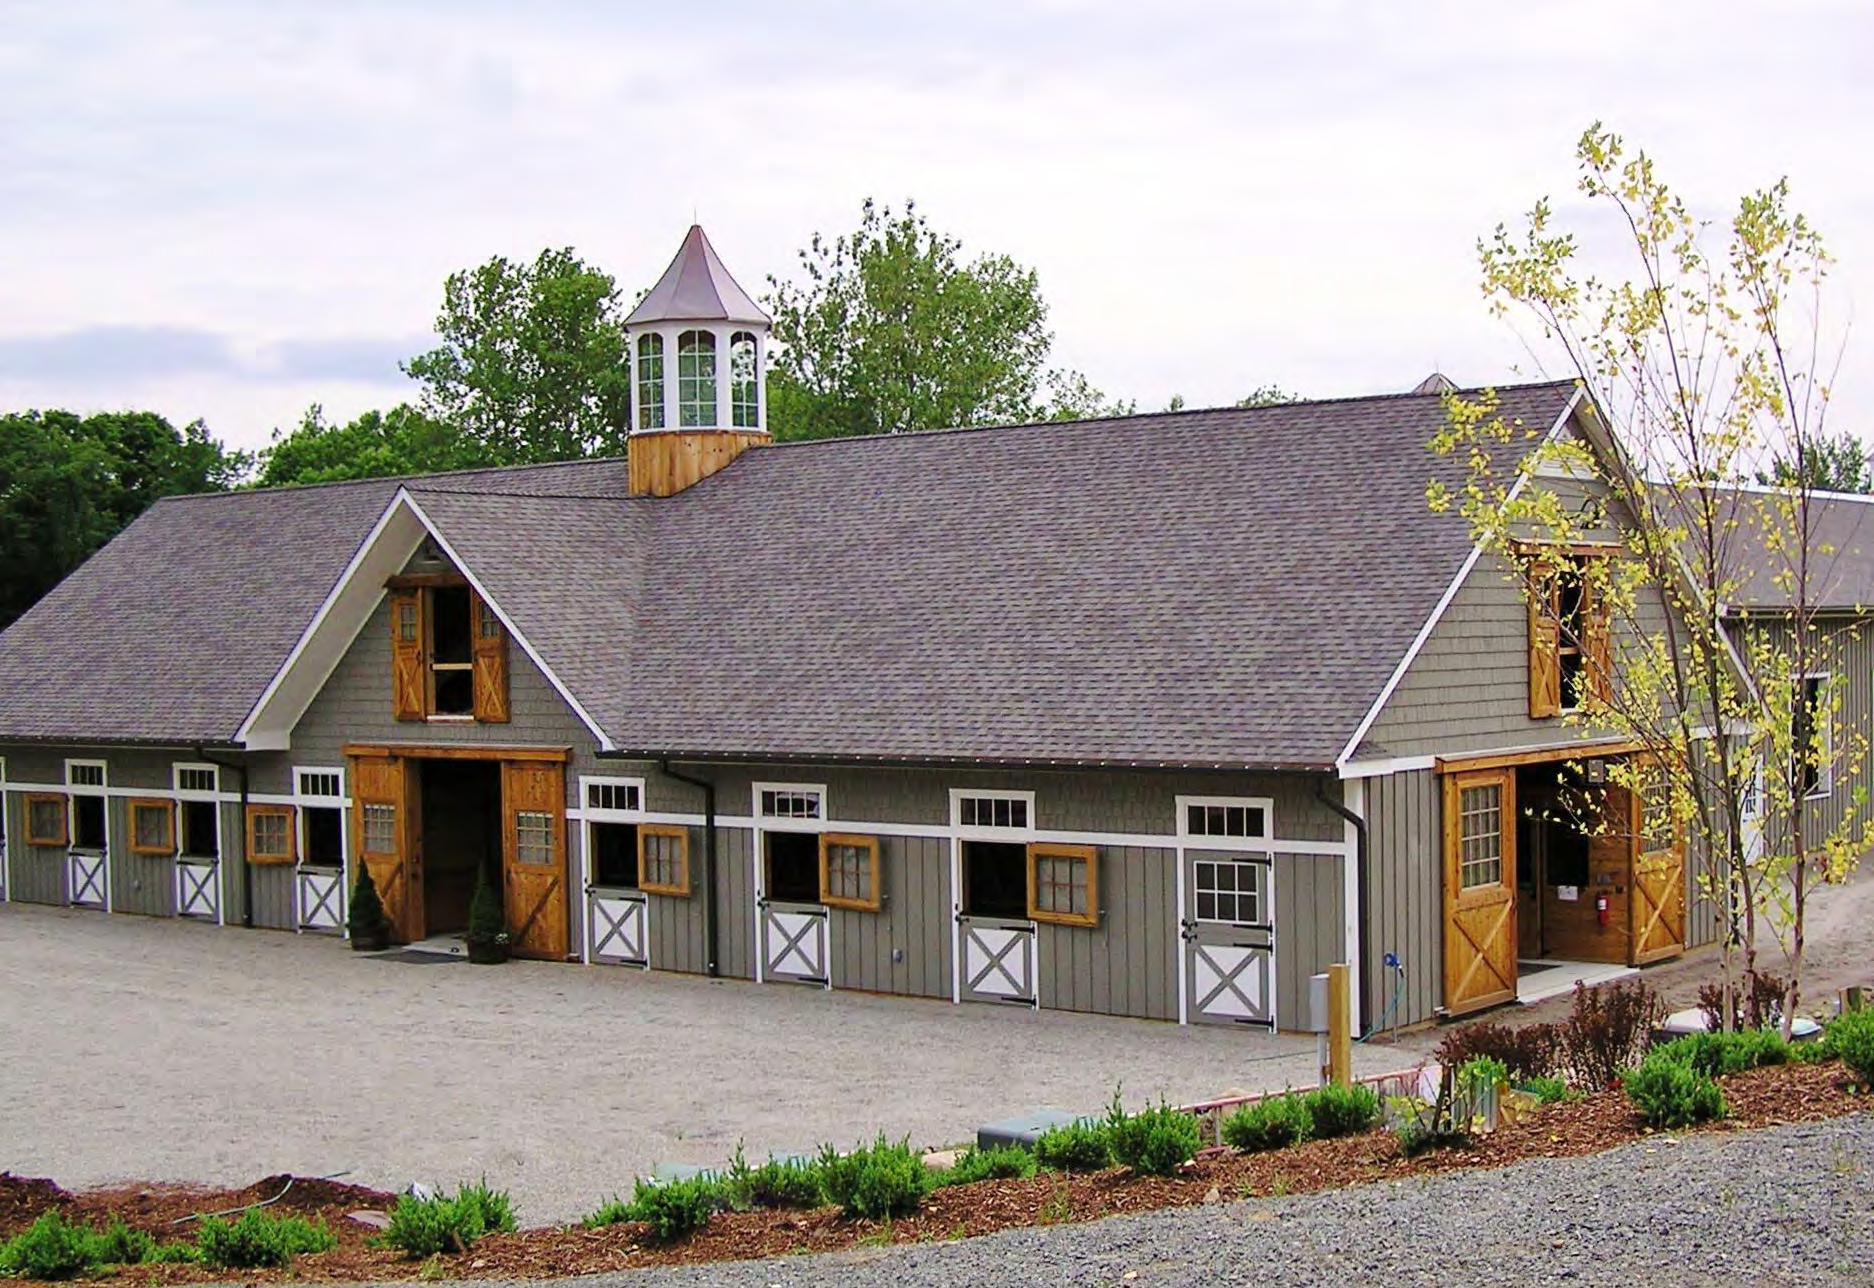
The appearance and design of streets within the placetype, especially elements that enhance the experience of the public atmosphere. The character of buildings and amenities that do not sit directly in the right-of-way are discussed in later sections.
• The transition from suburban to rural is clearly felt through street design and land use, such as farmland and above ground utility lines.
• Roads are usually one lane in each direction with wider shoulders present on either side of the street to accommodate farm vehicles and equipment.
• Super grids are formed by county roads and laid out via the Public Land Survey System (PLSS).
Street Network
• Where possible, streets should be rerouted around legal drains and other water features to reduce the number of bridges needed.
• Intersections where roads meet at an irregular angle or are unaligned with each other should be corrected and straightened when possible.
• Stop signs are and should be present at most intersections.
• For intersections with increased traffic, roundabouts should be used and designed to integrate bike and pedestrian traffic and to maintain easy mobility for farm vehicles and equipment.
Commercial Vehicles
Bicycle and Pedestrians
Golf Carts
• Commercial vehicles are common on major township roads such as Mule Barn, Ditch, Spring Mill, 191st, 186th, 161st, and 193rd Streets.
• Commercial vehicles should not be routed through neighborhood streets.
• There are not many streetside amenities [KA24.1] (like lighting, benches, and waste receptacles) in the rural residential reserve placetype.
• Any new development should be connected to named and perimeter trails, where feasible.
• In subdivisions, sidewalks should be five feet or wider and located along both sides of the street.
• Golf carts may use the same space as passenger vehicles.
On-Street Parking • No on-street parking is permitted.
Speed and Capacity
Block & Lot Patterns
• Improve key roads such as Hamilton/Boone County Line Road, Mule Barn Road, and Joliet Road as they currently do not have the capacity for large developments. As the area around it develops, coordinated improvements in infrastructure will be needed to support growth.
Characteristics of the design and layout of a property, especially in relation to surrounding properties, which include both the land and any buildings on the property.
• Typical Block Size: N/A
• Typical Lot Size: 3 acres
• If proposing a clustered subdivision, lots could be smaller (no smaller than 6,000 square feet) to create a village or hamlet that is connected to water and sewer.
• Typical Building Coverage: 15%
Access Points
Building Placement
• Curb cuts for driveways are common on roadways.
• Shared drives or frontage roads are encouraged where there are clusters of structures to reduce the number of access points, and therefore conflict points on major roads.
• Primary building entrances should be oriented toward the street, except for cottage court developments where buildings face a center greenspace.
• Commercial areas should be along primary/major streets.
• Building heights should be 2 stories or fewer.
• Agricultural-related accessory structures should not be greater than 100-feet tall. If more than 100-feet tall, Indiana Tall Structures Act is triggered.
• In established areas, the front yard setback should be the block average.
• On new parcels, setbacks should be 25-feet or greater.
Setbacks/Built to
Off-Street Parking Areas
Amenities & Open Spaces
• Non-residential buildings should be 0 to 10-feet from the sidewalk or edge of pavement. Exceptions for increased front setbacks may be granted for landscape areas or outdoor activities like dining areas.
• There should be at least 2 parking spaces off-street.
• Maintain open space in the front of buildings to preserve a feeling of openness.
• Playgrounds, green spaces, and other outdoor recreational areas are encouraged for supporting civic and institutional uses.
• Preservation of existing natural features including flood plains, riparian buffers, tree rows, forested areas, wetlands, waterways, and other natural features are encouraged.
Landscaping
• Invasive plants should be removed and replaced with native plants within the riparian buffers.
• Lot splits, wherein one lot retains only the riparian buffer and any other natural features like floodplain area, is highly encouraged to better protect and conserve these features.
Stormwater Management
• If no city drainage connections exist, drainage swales on either side of street are highly encouraged to reduce the likelihood that streets become impassable during major storms or inclement weather events.
Considerations Areas within each placetype that have unique conditions for which additional considerations are recommended.
• Major watersheds in Westfield/Washington Township include Cool Creek, which flows south into the White River in Carmel; Vestal Ditch which covers a portion of the township’s east/southeast, and Little Eagle/Eagle Creek. These watersheds should be protected as the area around the watershed develops. Creative design solutions like using a riparian corridor and floodplain treatment as a natural setting should be considered and incorporated into new development.
• As the remainder of the township develops, beyond the life of this plan, how this area develops, and how land is used efficiently is a key concern. Therefore, the city should encourage creative design and development to create new hamlets or villages within the rural residential reserve areas. This could include encouraging the transformation of street intersections into a hamlet of a cluster of houses around a green area that could later grow into a village. This would increase density by creating smaller lots, effectively and efficiently using land, and incorporating green/open space, commercial nodes, and other uses to support growth farther away from the city.
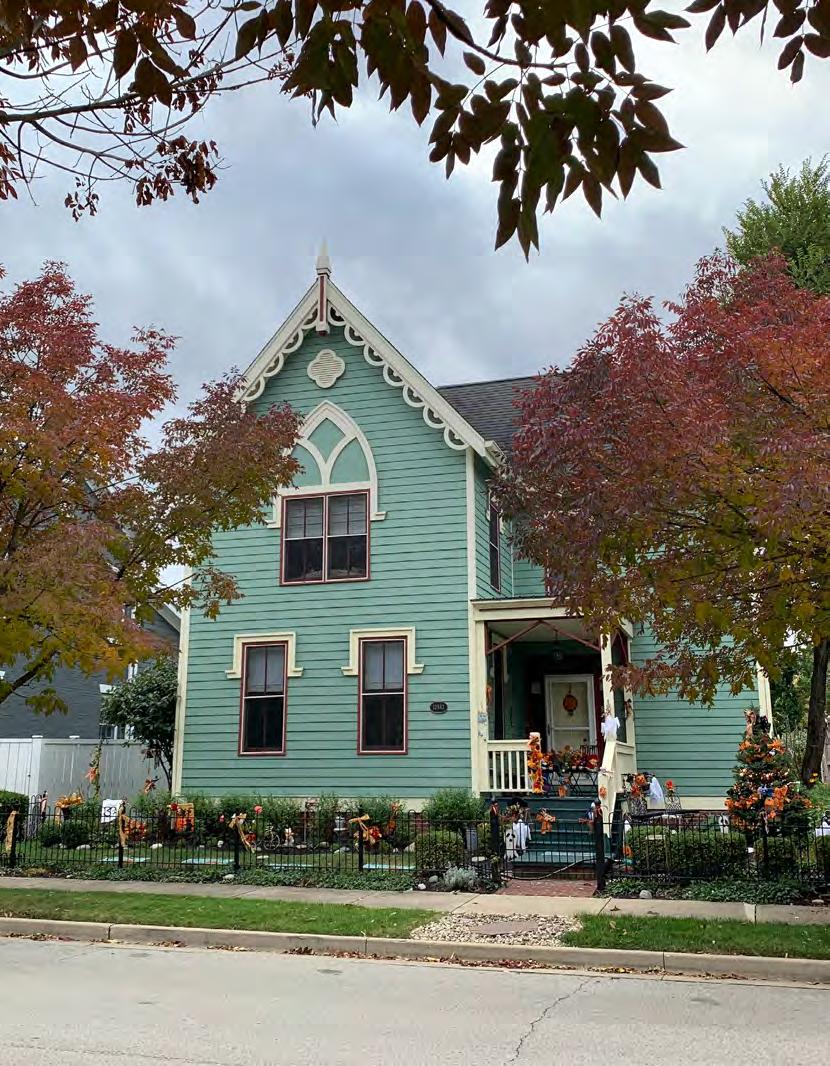
The Traditional Residential placetype identifies existing neighborhoods and new neighborhoods that are at a low to moderate residential intensity. This placetype is intended to facilitate the development of large scale “conventional” single dwelling unit neighborhoods. While not urban in nature, these neighborhoods are walkable and provide a high degree of connectivity between individual neighborhoods, to retail and restaurants, parks, schools, library, and surrounding transportation networks. Where applied to existing conventional single dwelling residential neighborhoods, the associate zoning regulations should provide a degree of protection from the practice of re-subdividing existing lots in a manner that creates inconsistently higher intensity parcels within a lower intensity neighborhood. These areas may include smaller in-fill sites which are often difficult to develop, require flexibility in design, change incrementally, and should generally maintain the existing development fabric.
1. Low to moderate density detached single unit housing on lots with ample yards and separation between dwellings.
2. May include developments featuring attached single unit housing, such as townhomes or duplexes, but still maintain larger lot sizes and lower density.
3. The peaceful residential atmosphere is enhanced by preserving open space, vegetation, and natural features.
4. Neighborhood amenities promote social interaction with neighbors. Examples include trails, picnic areas, playgrounds, and dog parks.
5. Neighborhoods and amenities should be connected by a comprehensive sidewalk and trail network to promote walkability, accessibility, and safety.
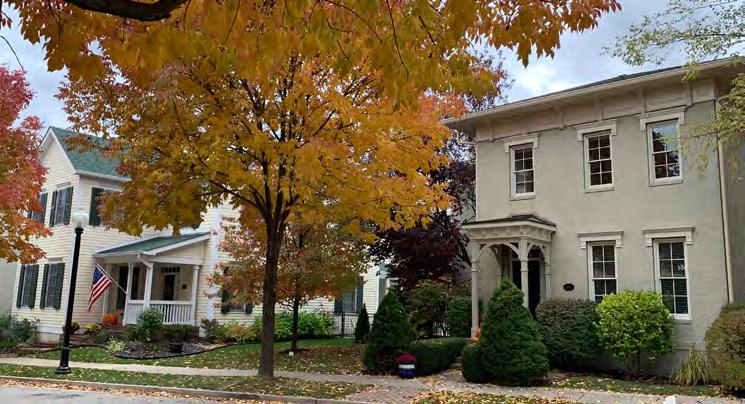
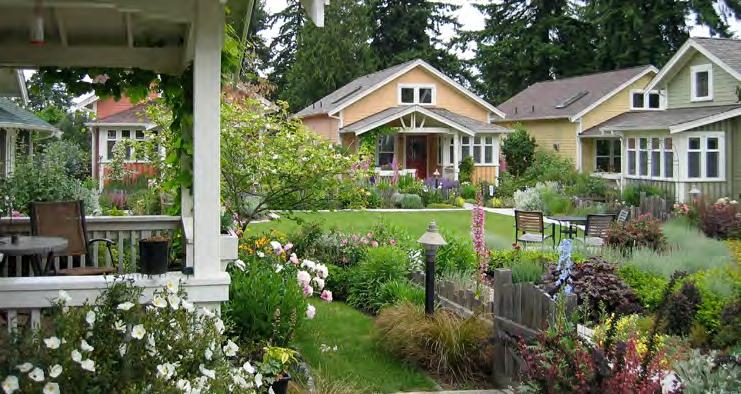
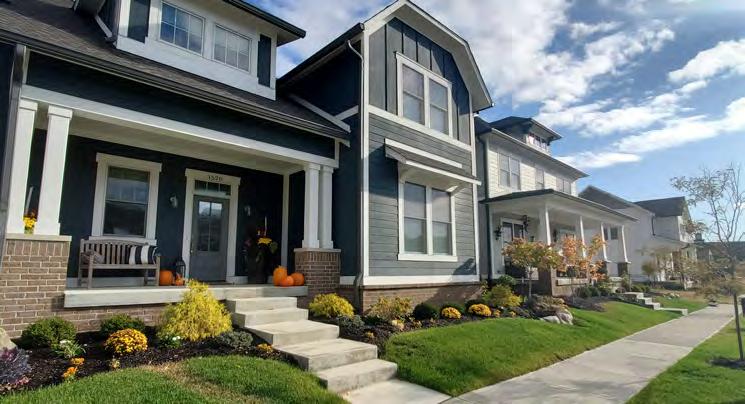
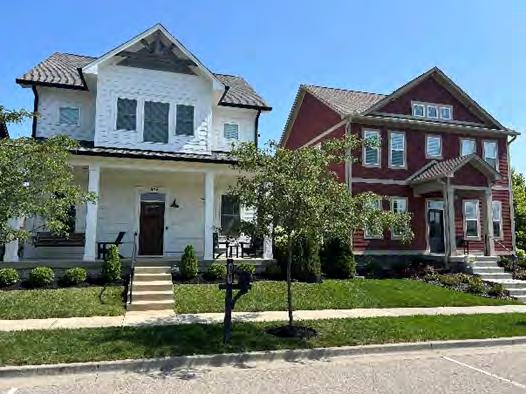
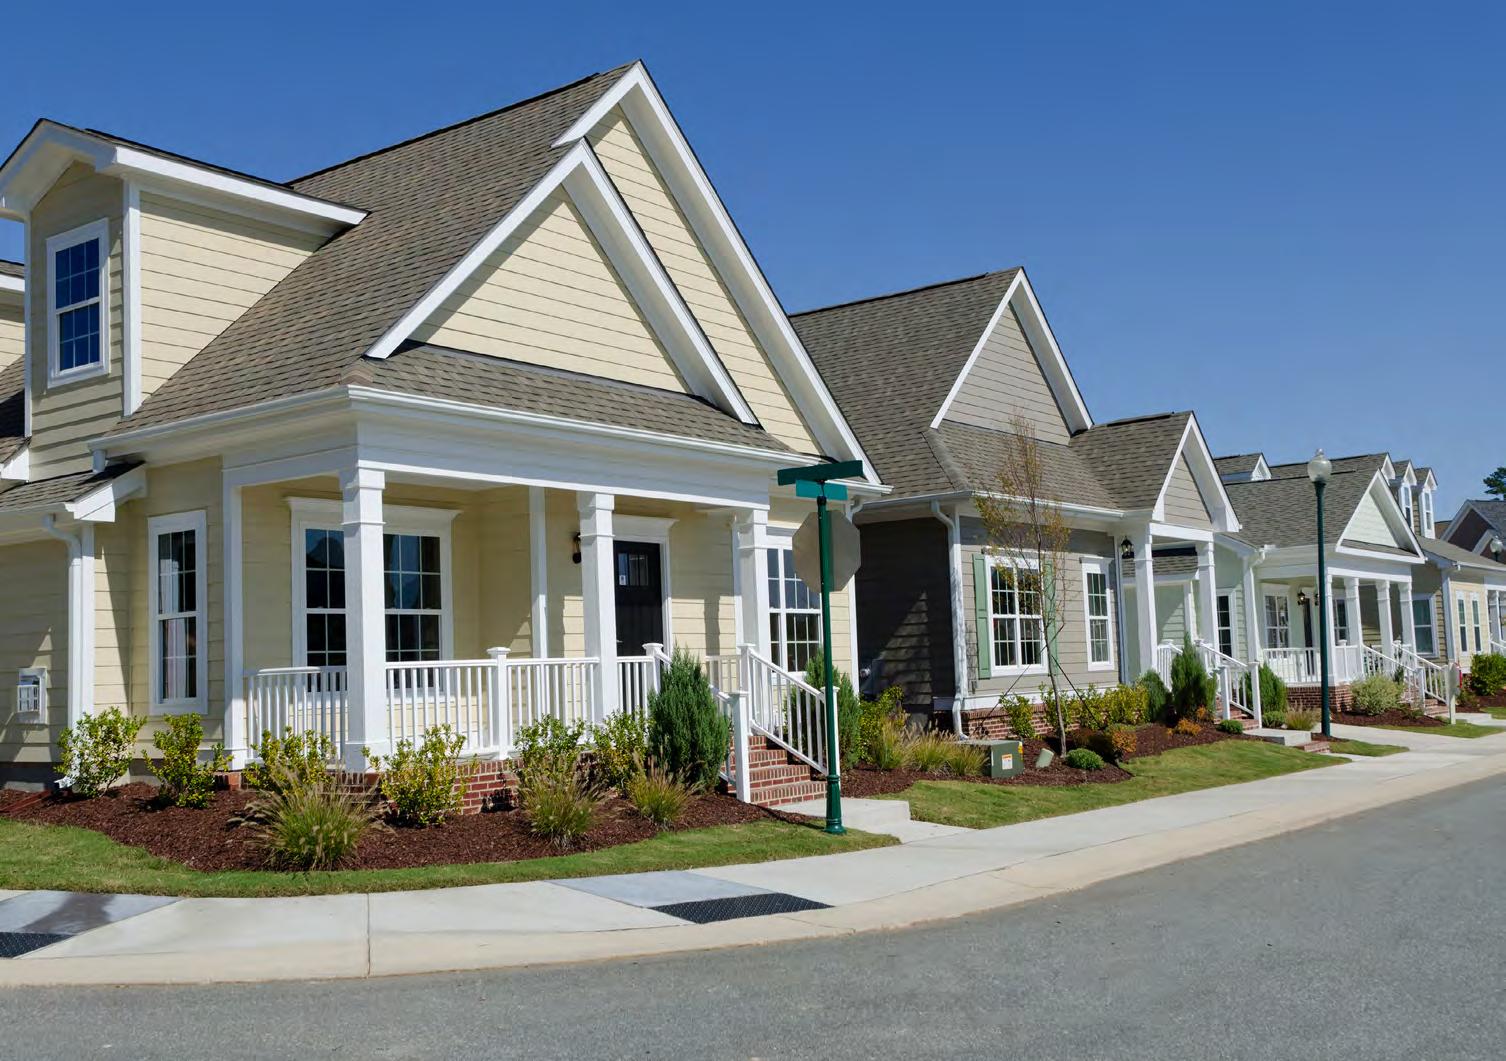
Street Network
The appearance and design of streets within the placetype, especially elements that enhance the experience of the public atmosphere. The character of buildings and amenities that do not sit directly in the right-of-way are discussed in later sections.
• Establish a well-connected street network to improve traffic flow and access.
• Curving streets are preferred to discourage speeding.
• Two-way streets are preferred. On-street parking may be provided.
• Cul-de-sacs may be used to increase build out but should be supplemented with pedestrian and bicycle paths to adjacent streets to support connectivity.
Commercial Vehicles
Bicycle and Pedestrians
Golf Carts
On-Street Parking
Speed and Capacity
Block & Lot Patterns
Access Points
Building Placement
Setbacks/Built to
Off-Street Parking Areas
• Commercial vehicles should not be routed through neighborhood streets.
• Sidewalks should be 5-feet or wider and located along both sides of the street.
• Trails are encouraged throughout developments and to connect neighborhoods.
• Golf carts could serve as alternative form of transportation.
• Golf carts may use the same space as passenger vehicles on local streets.
• On-street parking is permitted only along local streets in residential developments.
• As the area around it develops, coordinated improvements in infrastructure will be needed to support growth.
• Turn lanes, deceleration lanes, or roundabouts should be considered at entrances to improve traffic flow.
Characteristics of the design and layout of a property, especially in relation to surrounding properties, which include both the land and any buildings on the property.
• Typical Block Size: up to 400 - 800-feet
• Typical Lot Size: 8,000 sq. ft.
• Typical Building Coverage: 40% or less
• Only one curb cut/driveway should be provided per dwelling.
• Shared drives may be used for attached dwellings.
• Primary building entrances should be oriented toward the street, except for cottage court developments where buildings face a center greenspace.
• Building heights may be up to 2.5 stories.
• In established areas, the front yard setback should be the block average.
• Setbacks should preserve open spaces in the front yard.
• Single-unit dwellings should provide a garage large enough to accommodate two vehicles.
• Maintain open space in the front of buildings to preserve a feeling of openness.
• Playgrounds, green spaces, and other outdoor recreational areas are encouraged as development amenities or for supporting civic and institutional uses.
• Neighborhood pools and clubhouses are anticipated in these developments.
• Preservation of existing natural features including flood plains, riparian buffers, tree rows, forested areas, wetlands, waterways, and other natural features are encouraged.
• Street trees on residential streets.
• Invasive plants should be removed and replaced with native plants within the riparian buffers.
• Lot splits, wherein one lot retains only the riparian buffer and any other natural features like floodplain area, is highly encouraged to better protect and conserve these features.
• Developments should include drainage elements that connect to municipal drainage or provide retention/detention facilities on site.
• On-site drainage facilities should be easements or common areas and reserved for that specific purpose.
Areas within each placetype that have unique conditions for which additional considerations are recommended.
• Support efforts to maintain and modernize existing neighborhoods, especially surrounding the downtown area.
• Subarea planning is needed in this placetype to help determine the appropriate mix of land uses and infrastructure improvements to promote multimodal connectivity within the neighborhood and to surrounding neighborhoods, public spaces, commercial, and mixed use areas.
• Encourage the creation of new neighborhoods that are safe, pedestrian friendly, and provide diverse housing opportunities.
• Key intersections, local commercial areas, and areas within 1/2 miles of TRoD nodes may represent the most appropriate opportunities for redevelopment with supporting land uses.
• Changes to areas within Traditional Neighborhood placetype should look to add housing in a way that is gentle, incremental, and sensitive to the existing context, while doing so in a manner that strengthens these neighborhoods and incorporates inclusive community engagement efforts. Incompatible multiplex, townhome, duplex, triplex, and apartment development should be located outside of existing single-unit neighborhoods.
• Village Farms is governed by The Village Farms Plan, which is incorporated into the comprehensive plan by reference. Additional standards, guidelines, or special consideration for development in the campus should be reviewed and incorporated based on that master plan.
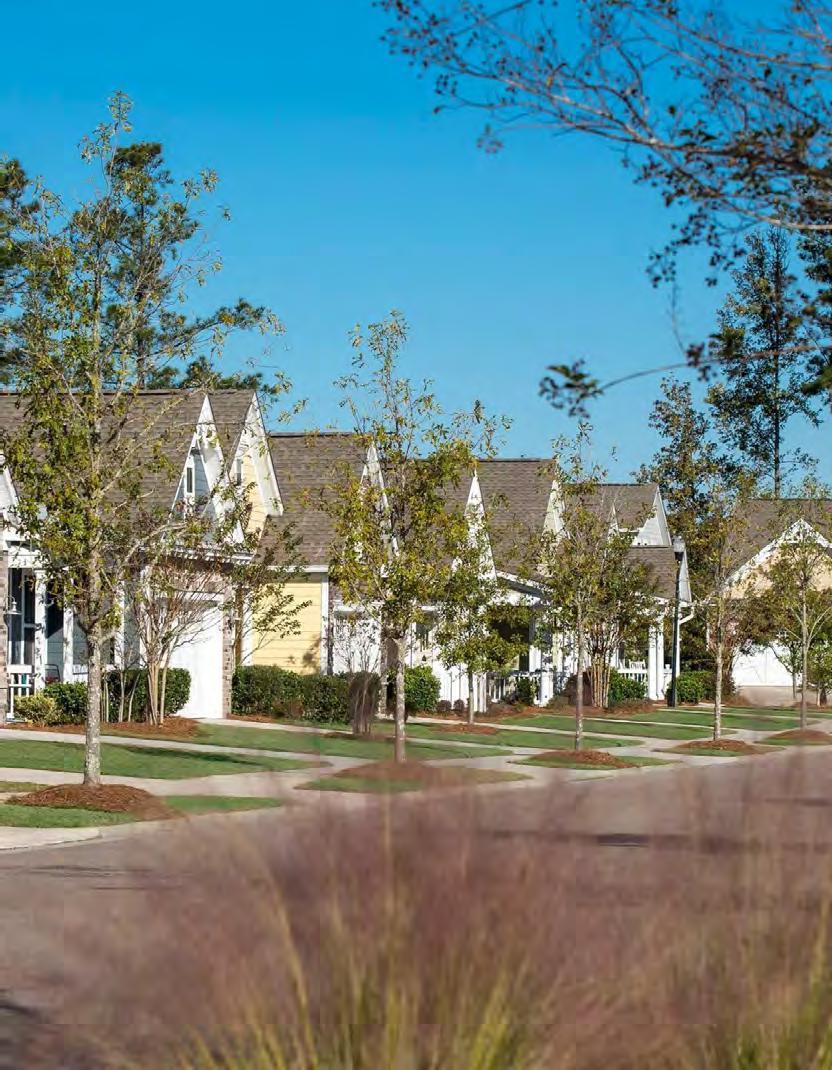
The Master Planned Residential placetype is a residential development designed under a single, unified plan that includes a variety of housing types (such as single-family homes, townhomes, apartments), coordinated infrastructure (roads, utilities, stormwater systems), and integrated amenities (clubhouse pool, passive open space, active recreational areas, public spaces, fountains, walking trails, gazebos, fitness centers, etc.) to create a complete, balanced community. This placetype has cohesive design standards, internal street, and path networks, access to shared amenities, is integrated with its surroundings, and is a phased development built in stages over several years with long-term land use and transportation planning as the focus.
1. A variety of housing is provided for a range of preferences. Similar architectural styles and materials are used to create a cohesive neighborhood aesthetic.
2. Neighborhoods have a high level of connectivity with welldesigned street networks.
3. Developments provide multiple quality of life and recreational elements into the site design.
4. Streetscapes and landscapes showcase creativity and limit large expanses of grass lawns, except for recreational areas or private yards.
5. Some non-residential or mixed use elements can be incorporated into residential areas. These uses should be developed to coordinate with the characteristics of residential developments.
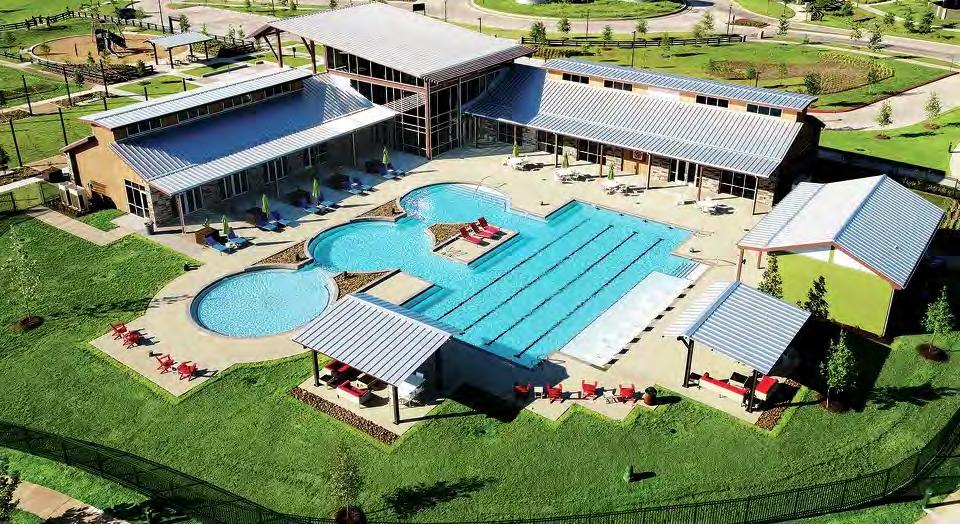
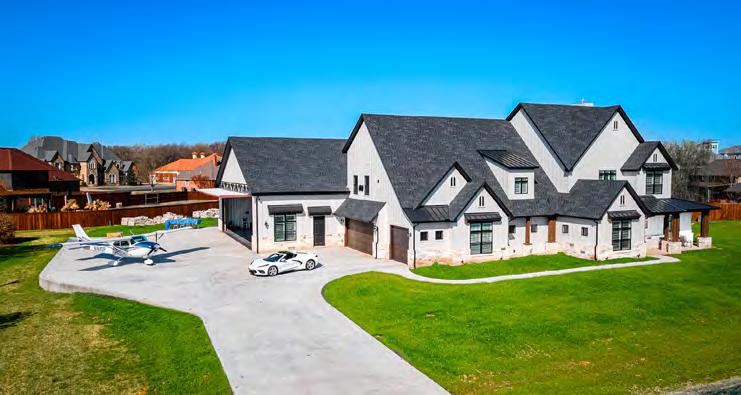
offer a higher level of
here a single-unit detached dwelling with hanger for a plane and access to the airfield.
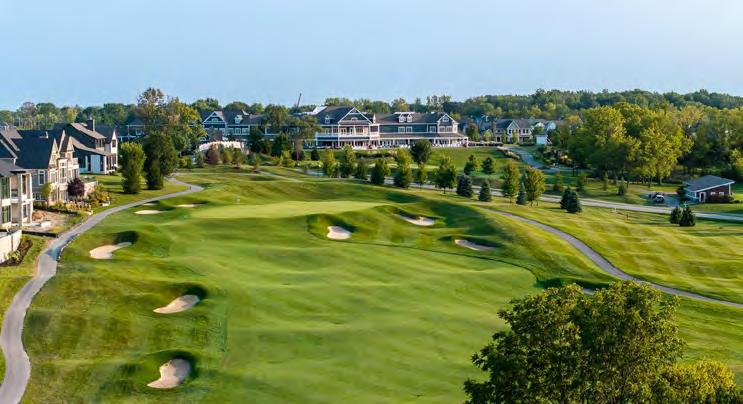
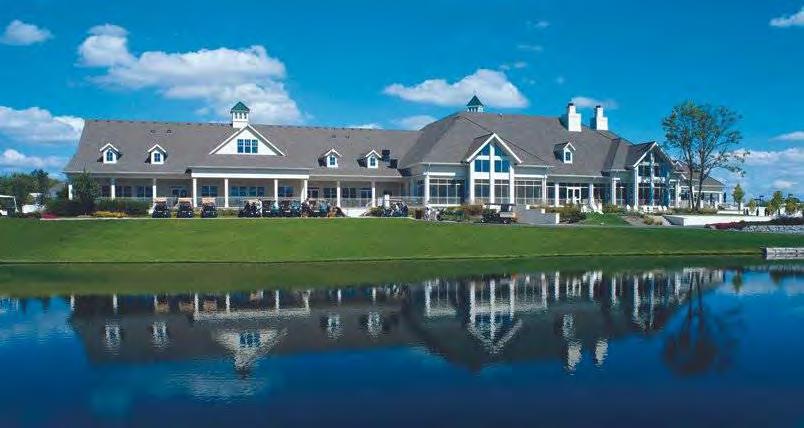
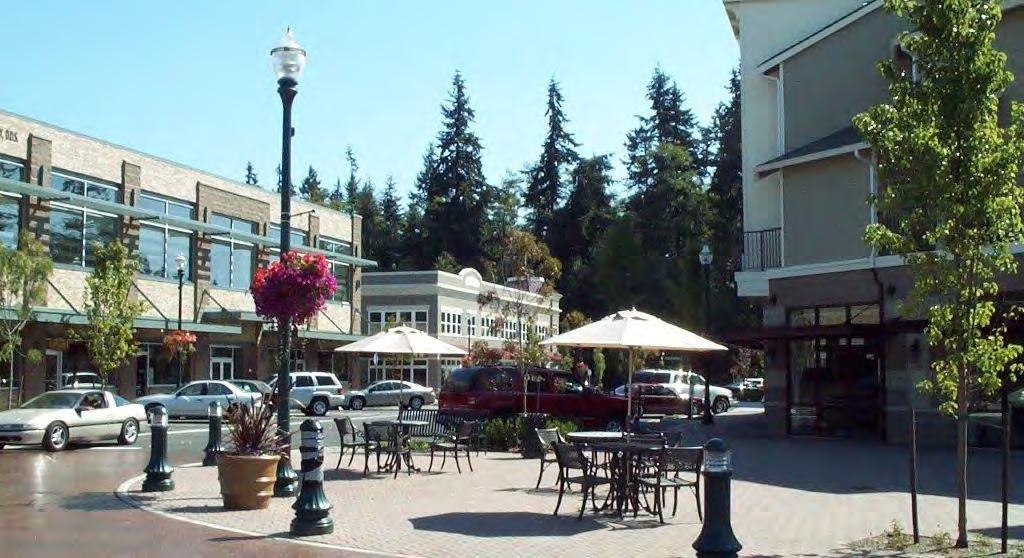
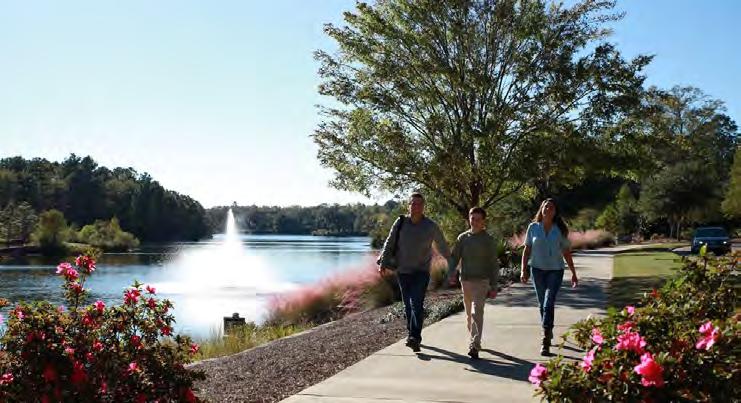
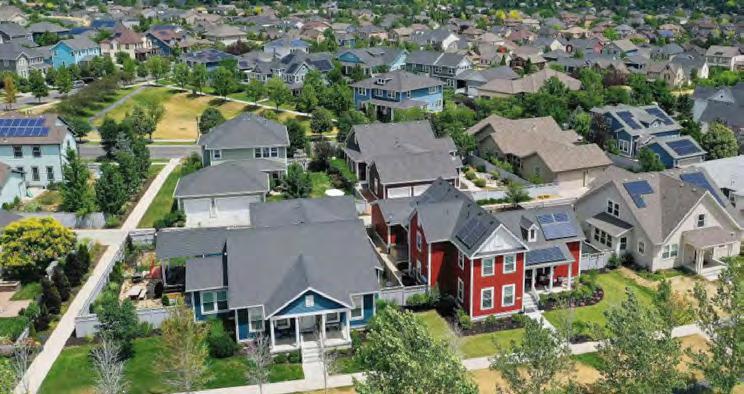
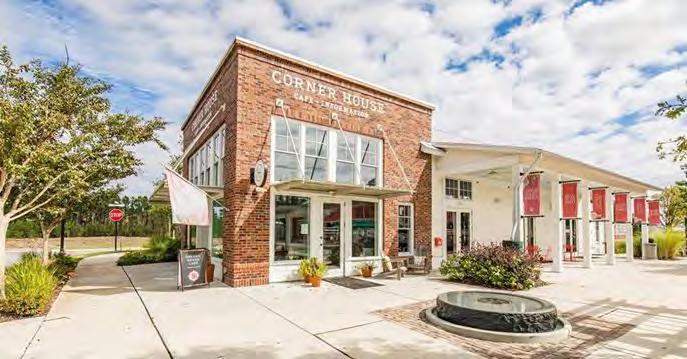
Street Network
Commercial Vehicles
Bicycle and Pedestrians
Golf Carts
On-Street Parking
Speed and Capacity
Block & Lot Patterns
Access Points
The appearance and design of streets within the placetype, especially elements that enhance the experience of the public atmosphere. The character of buildings and amenities that do not sit directly in the right-of-way are discussed in later sections.
• Streets are highly connected and support multiple modes of transportation.
• Large commercial vehicles should not be routed through residential areas.
• Trails and sidewalks provide additional connections to supplement the street network.
• High traffic areas have dedicated bike lanes.
• Golf carts may serve as alternative form of transportation.
• Golf carts may use the same space as passenger vehicles.
• On-street parking is permitted on both sides of the street. Providing additional on-street parking areas throughout the development is encouraged. On-street parking should be provided in front of commercial uses.
• Streets should be designed with traffic calming measures to slow speeds and enhance pedestrian safety.
Characteristics of the design and layout of a property, especially in relation to surrounding properties, which include both the land and any buildings on the property.
• Typical Block Size: varies
• Typical Lot Size: varies
• Typical Building Coverage: varies
• Curb cuts for driveways are common for detached houses.
• Attached dwellings and multi-unit dwellings are encouraged to use shared driveways to minimize sidewalk interruptions.
• Buildings should be oriented towards the street except for court-style developments, which may orient to central green spaces.
• Detached houses may be 2 to 2.5 floors. Apartments or townhomes may be 3 stories.
Building Placement
Setbacks/Built to
Off-Street Parking Areas
Amenities & Open Spaces
• Buildings taller than 3 stories may be considered for areas adjacent to nonresidential placetypes; floors above 3 stories should have step-backs to preserve views and sunlight access.
• Promote alleyways or side-loaded garages to provide a welcoming and walkable environment.
• Front yard setbacks should generally be aligned with established setbacks.
• Setbacks may vary for different types of housing and whether they are oriented towards a street or green space.
• Front, side, and rear setbacks vary in size across neighborhoods but are generally consistent within an individual neighborhood.
• Detached houses should have garages that can accommodate at least 2 vehicles.
• Attached housing may have garages or surface parking.
• Surface parking shall locate in rear yards and be hard surfaced.
• Playgrounds, green spaces, and other outdoor recreational areas are encouraged for resident use as well as supporting civic and institutional uses.
• Large expanses of lawn should be avoided except for recreational amenities or private lawns.
Landscaping
Stormwater Management
• Landscaping and streetscapes should showcase creativity with native plant variety, topography, and more.
• Preservation of existing tree stands is highly encouraged and shall be incorporated into overall development design.
• Landscapes for stormwater management and environmental sustainability are highly encouraged.
• Sites should be connected to the city storm sewer, provide on-site retention/detention facilities, or encouraged to participate in regional detention, if available.
• Landscapes for stormwater management and environmental sustainability are highly encouraged.
Areas within each placetype that have unique conditions for which additional considerations are recommended.
• Anchor neighborhoods with local-serving commercial nodes.
• New development should be context- sensitive, and building scale, height and massing should complement existing buildings.
• Attention should be given to building height, orientation, architectural style, and setbacks to ensure new structures fit into existing neighborhood context.
• Front yards are semi-private and may include front stoops and porches that contribute to a neighborhood’s character.
• Density in the form of multiplexes should be prioritized along arterials and collectors, and not local streets.
• Provide visual buffers between single unit uses and other more intense adjoining uses.
• Accessory Dwelling Units permitted in this placetype.
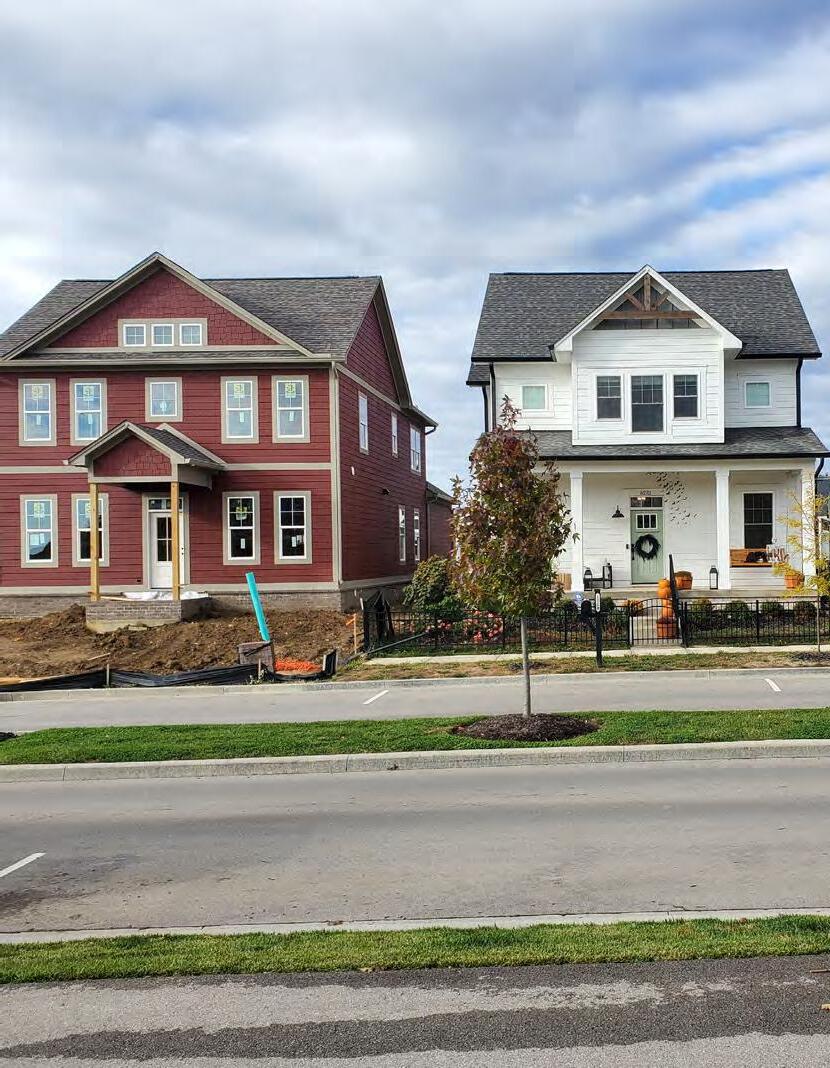
The Village Neighborhood placetype contains a variety of residential, commercial, and retail uses. This placetype is adjacent to major arterial and collector roads. This placetype includes a mix of residential uses at a higher density than the Traditional Residential placetype. Nonresidential uses are typically located at key intersections adjacent to neighborhoods, considered support to the neighborhood, and should be located no more than a 15-minute walking distance of all residential uses. Transportation infrastructure should support and encourage connectivity, safe walking, biking, and golf carts.
1. Single-unit dwellings, attached or detached, are laid out in walkable and connected neighborhoods.
2. Individual low-rise apartment buildings (4 to 8 units) that are well-designed, integrated into neighborhood development, have consistent site setbacks as other sites, and have compatible design style to other single-unit dwellings so it doesn’t appear from the front to be a multi-unit development.
3. Infill development is scaled to match the character of established neighborhoods.
4. Civic and institutional uses are located within walking or biking distance of residential areas to provide convenient access to services and gathering places.
5. Neighborhoods may have small-scale businesses that cater to residents’ daily needs in higher-traffic areas or intersections.
4.48: Village Neighborhood Recommended Land Uses.
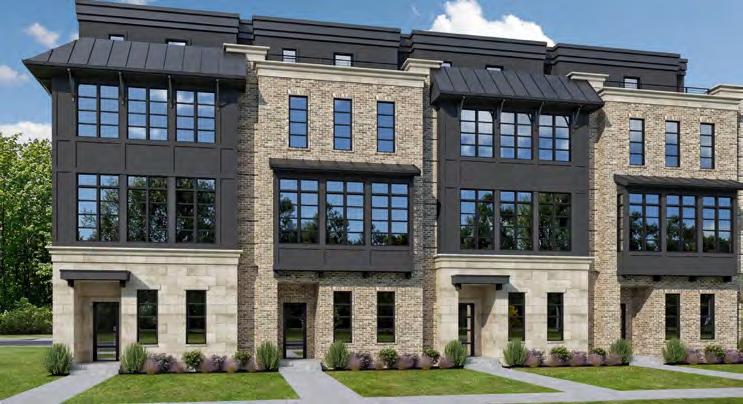
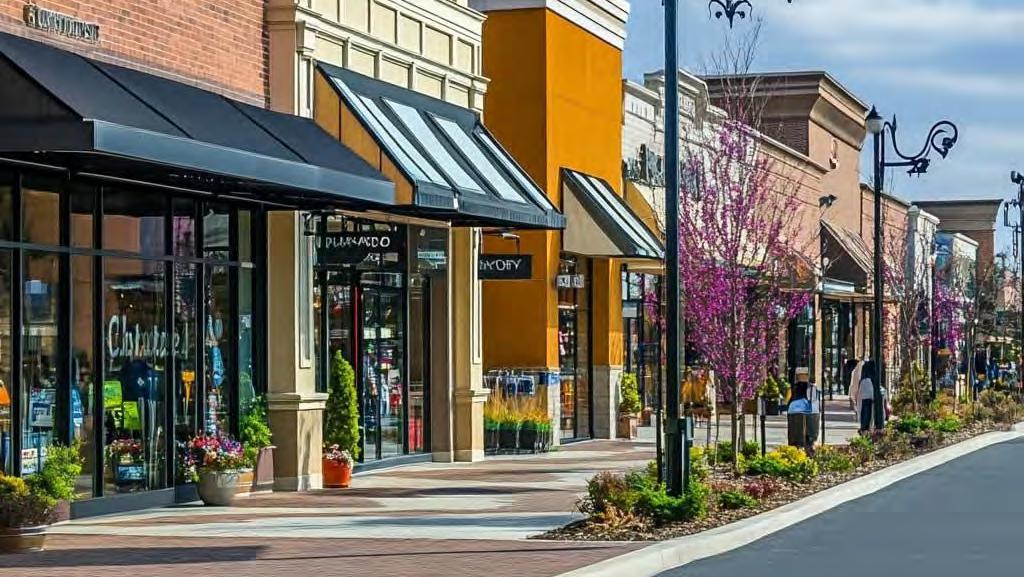
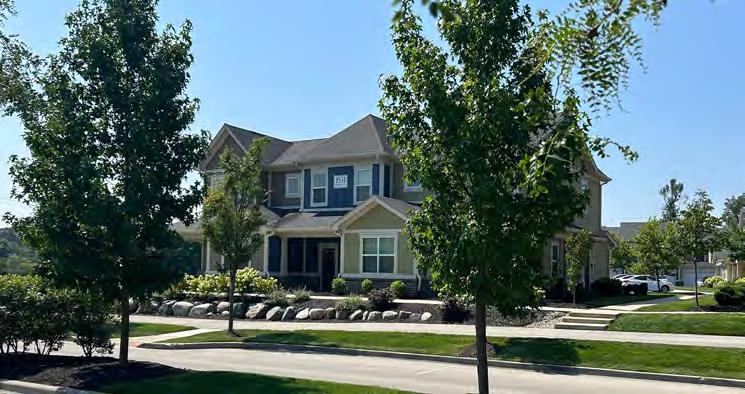
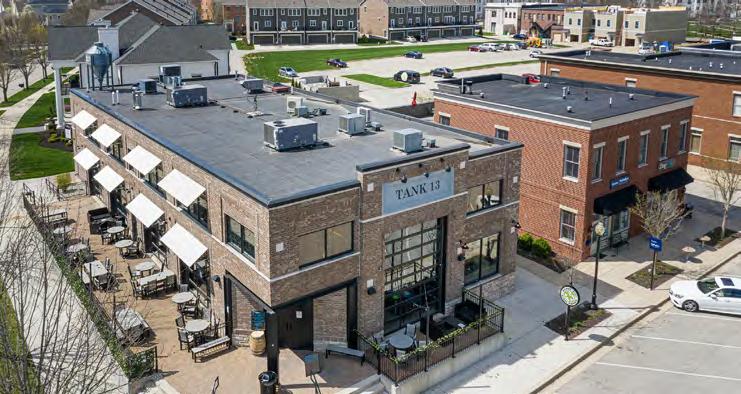
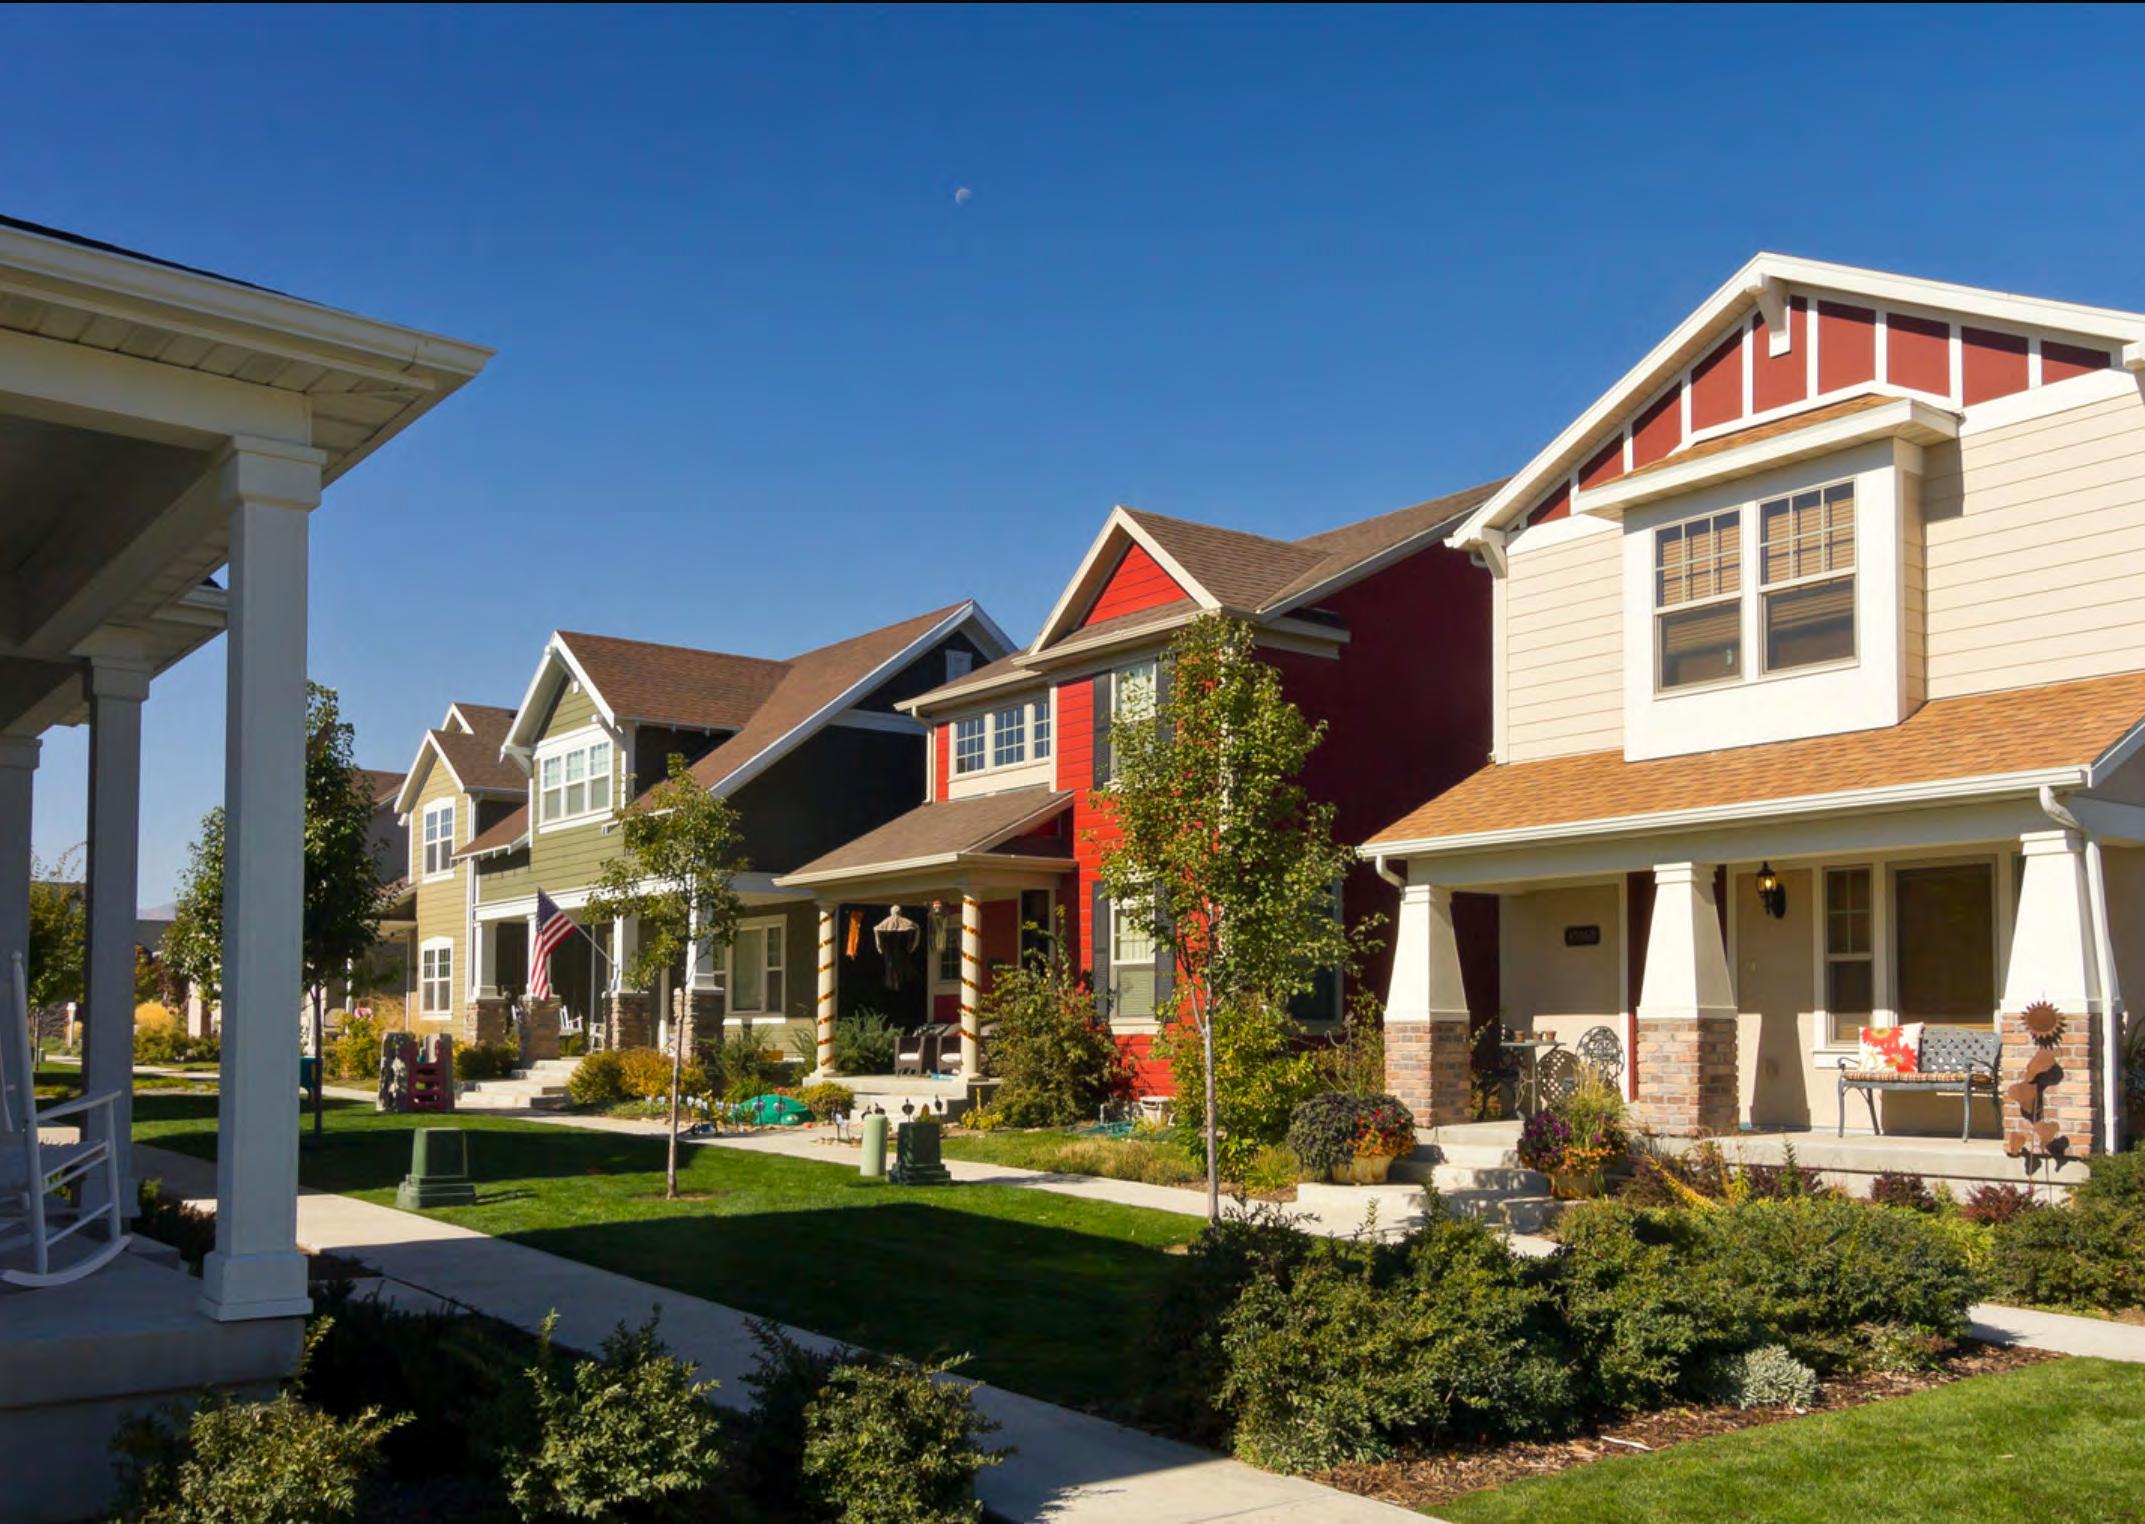
Street Network
Commercial Vehicles
Bicycle and Pedestrians
Golf Carts
On-Street Parking
Speed and Capacity
Site Design
Block & Lot Patterns
The appearance and design of streets within the placetype, especially elements that enhance the experience of the public atmosphere. The character of buildings and amenities that do not sit directly in the right-of-way are discussed in later sections.
• Establish a well-connected street network to improve traffic flow and access.
• Traditional grids are preferred with traffic calming strategies such as narrowing, street parking, etc. Some curving streets may be used but not the predominate street type.
• Two-way streets are preferred. On-street parking is allowed.
• Commercial vehicles should not be routed through neighborhood streets.
• Sidewalks in residential areas should be 5-feet or wider and located along both sides of the street.
• Trails are encouraged throughout developments and to connect neighborhoods and other named trails.
• Golf carts may serve as alternative form of transportation.
• Golf carts may use the same space as passenger vehicles on local streets.
• On-street parking is permitted only along local and collector streets in residential developments.
• As the area around it develops, coordinated improvements in infrastructure will be needed to support growth.
• Turn lanes, deceleration lanes, or roundabouts should be considered at entrances to improve traffic flow.
Characteristics of the design and layout of a property, especially in relation to surrounding properties, which include both the land and any buildings on the property.
• Typical Block Size: between 500 and 900-feet
• Typical Lot Size: 0.1 acre to 0.3 acre
• Typical Building Coverage: 60% or less for residential and 90% for commercial.
• Only one curb cut/driveway should be provided per lot. Shared drives may be used for attached dwellings or if many detached single buildings are built on one parcel. Alley loaded garages encouraged.
Access Points
• Supporting commercial areas should be designed to promote walkability including enhanced sidewalks, street trees and landscaping, minimal curb cuts, and pedestrian scale lighting.
• Establish a comprehensive pedestrian network emphasizing multimodal connections to commercial areas, schools, and parks. Building Placement
• Entrances should be oriented to the street, except cottage court developments, which may face a courtyard.
• Apartments may face courtyards or pedestrian pathways.
• Detached houses may be 2 to 2.5 floors. Apartments, townhomes, or commercial uses may be up to 3 stories. Buildings taller than 3 stories may be considered for areas adjacent to nonresidential placetypes. Floors above 3 stories should have step-backs to preserve views and sunlight access.
• Commercial areas, including retail mixed use development, should be located at key intersections and along a collector or arterial.
• Promote alleyways or side-loaded garages to provide a welcoming and walkable environment.
Building Placement (cont)
Setbacks/Built to
• Because placetypes adjacent to this placetype may have a different scale, buffering should occur to reduce any land use incompatibilities. Buffering could include increasing setbacks to provide landscaped buffer yards, existing tree preservation, or incorporate drainage easement transitions.
• Infill development should meet the established front setbacks.
• Building setbacks should generally be uniform; setbacks of 20-feet or less are preferred to incorporate street trees, sidewalks, and front yards.
• Commercial buildings should be located at the edge of the sidewalk to create a strong street presence. In some situations, a portion of a commercial building could be setback 5-feet to accommodate outside dining or public plaza.
• Single-unit dwellings should include garages capable of storing a minimum of 2 vehicles.
Off-Street Parking Areas
• Multi-unit apartments may rely on garages, surface parking, or nearby street parking. Parking areas should incorporate landscaping and screening elements to prevent light trespass.
• Parks, playgrounds, green spaces, plazas, open spaces, and other outdoor recreational areas are encouraged for supporting civic and institutional uses.
Amenities & Open Spaces
• Residential streets should have 5-foot sidewalks with planting strips in locations with less intense development. Commercial areas should have an 8-foot to 10-foot sidewalk with planting strips in locations with more intense development.
• Developments should have well-designed trail connections throughout the neighborhood and a perimeter trail connecting to other community trail networks.
• Have street connections to parks, schools, and other destinations, and include well-designed pedestrian connections to trails or greenways.
• Landscape strips with street trees are encouraged to separate pedestrian pathways from streets.
• Preservation and restoration of natural features including floodplains, riparian buffers, tree rows, forested areas, wetlands, waterways, and other natural features are encouraged.
Landscaping
Stormwater Management
• Plant parkways and private yards with native species shade trees to expand the urban forest and improve neighborhood character. Street trees used for parkways should ensure the roots of the varietal selected do not damage sidewalks or infrastructure.
• Front and rear yards serve as private open spaces.
• City should encourage coordination between adjacent development to provide regional retention instead of each development having their own retention facility onsite.
• Developments should include drainage elements that connect to municipal drainage or provide retention/detention facilities on site. On-site drainage facilities should be in easements or common areas and reserved for that specific purpose.
Areas within each placetype that have unique conditions for which additional considerations are recommended.
• Office, commercial, or retail uses should be located at the perimeter of residential areas at intersections or along collector and arterial streets.
• Housing such as duplexes, townhomes, and multiplexes should be designed to complement the scale and character of the surrounding neighborhood and dwelling units.
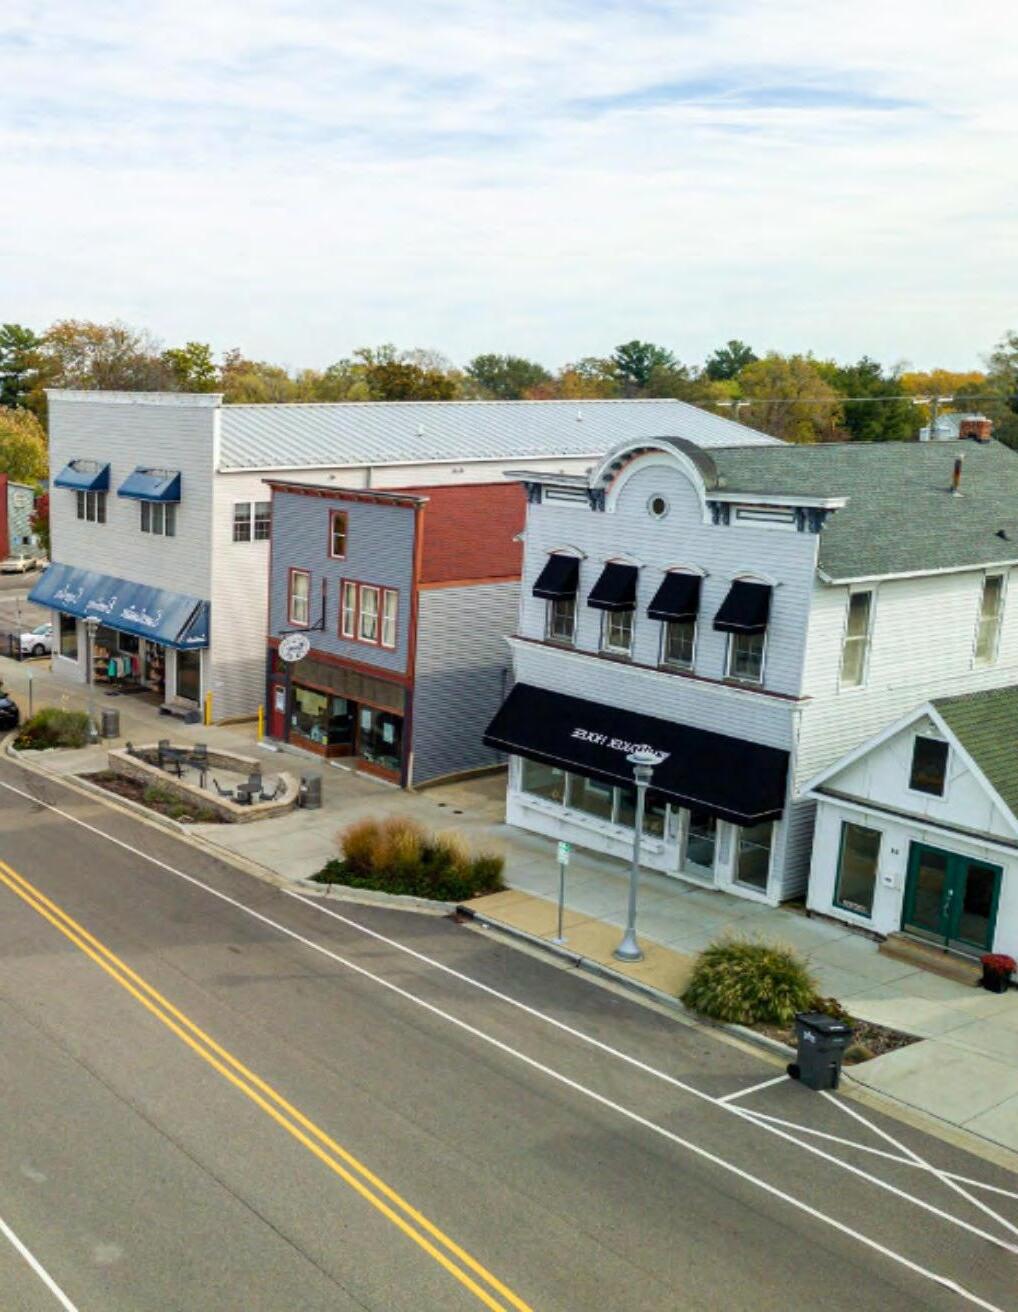
The Village Center placetype is intended to support the development of small-scale mixed use, commercial, service, retail, and civic uses that are strategically located within identified residential areas to provide essential goods, services, and gathering spaces for nearby residents. Designed to be unique and accessible predominantly by foot and bike, these Village Centers support regular needs while fostering a sense of neighborhood identity. Village Center daily needs are not those in large format buildings like typical grocery stores, car washes, and gas stations. These nodes have a compact development pattern that is within a 5-to-15-minute walking distance from home. Each Village Center should have its own unique vision, not replicating other areas in the city. These areas feature small businesses, local markets, coffee shops, pharmacies, convenience stores, personal services, and small-scale offices. These uses are found in low-rise mixed use buildings with retail or office on the ground floor and residential units above. New development and infill should be quaint, scaled to fit the character of the surrounding neighborhood, avoiding largeformat retail, drive-throughs, or auto-centric designs. This placetype incorporates thoughtful building placement, street trees, and human scaled architecture.
1. The Village Center place type acts as mini “Main Streets” which is at most, a few blocks in size, for neighborhoods within Westfield and Washington Township.
2. The Village Center place type supports low-rise mixed use and live-work buildings built up to the street at major intersections.
3. As new developments occur, the Village Centers should establish a street grid with sidewalks and bike lanes for the safety and comfort of pedestrians and cyclists. The Village Center should prioritize pedestrian and multi-use connections to surrounding residential neighborhoods.
4. The Village Center’s architectural character is encouraged to incorporate elements from historic or vernacular architecture that pay homage to the neighborhood’s history.
5. The Village Center should provide a transitional area adjacent to low density housing; the transitional area should encourage medium density, compact housing, and limit commercial uses.
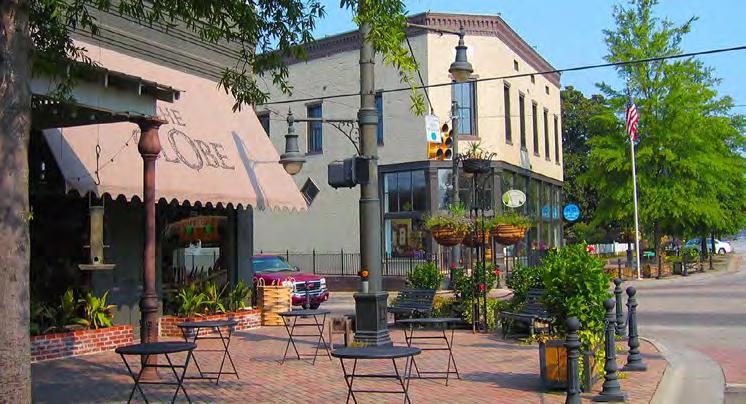
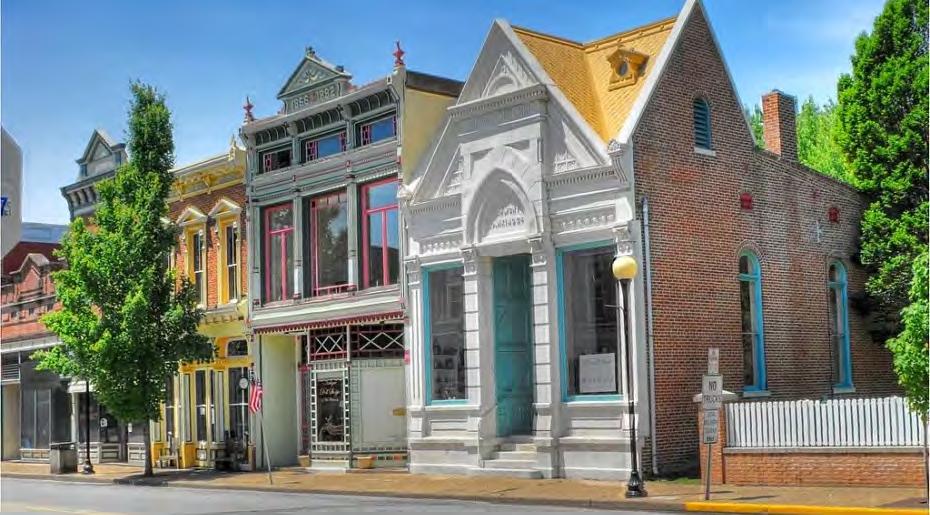
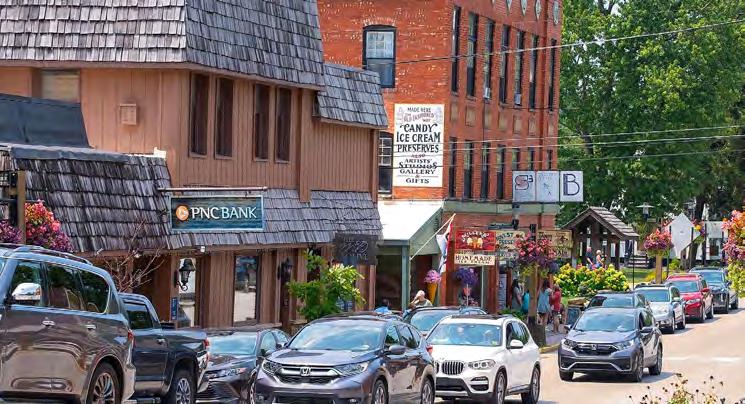
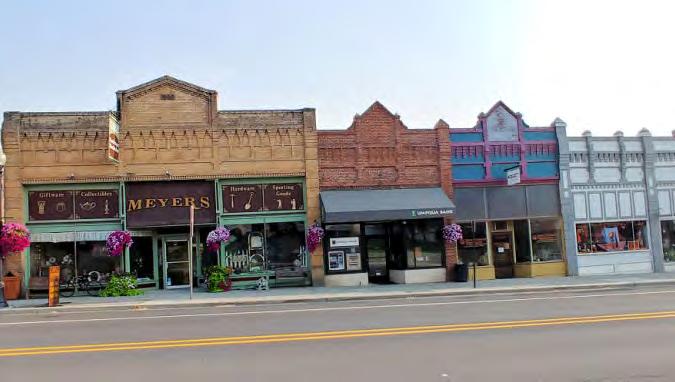
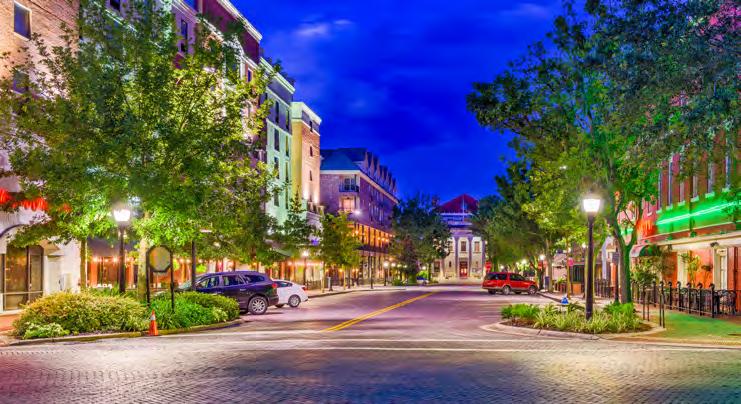
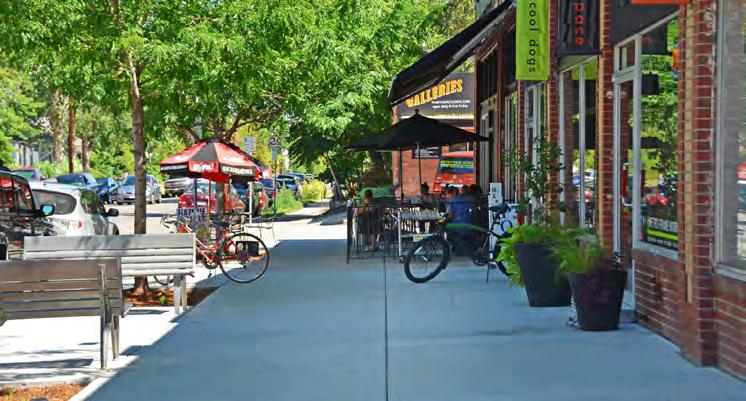
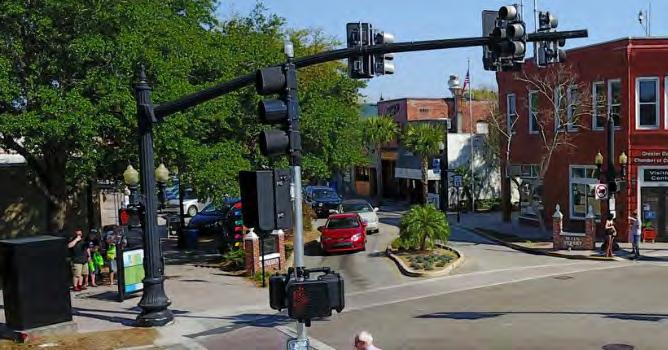
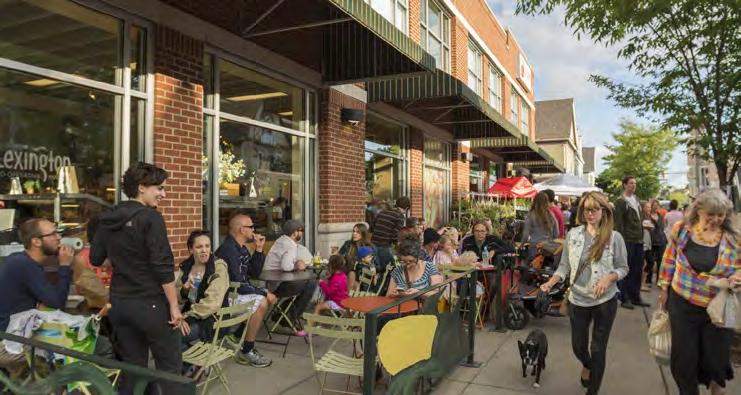
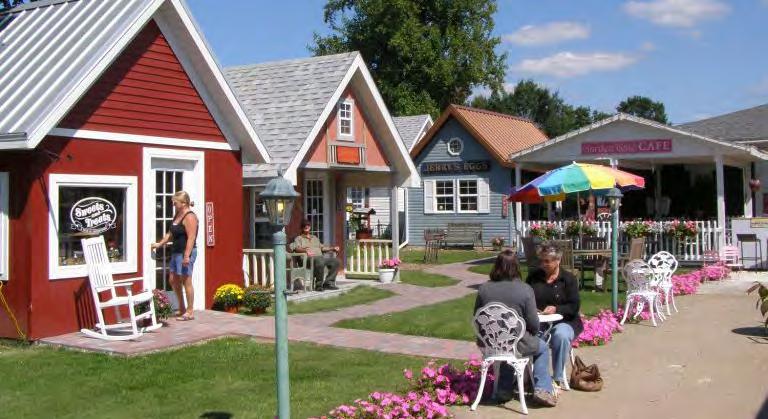

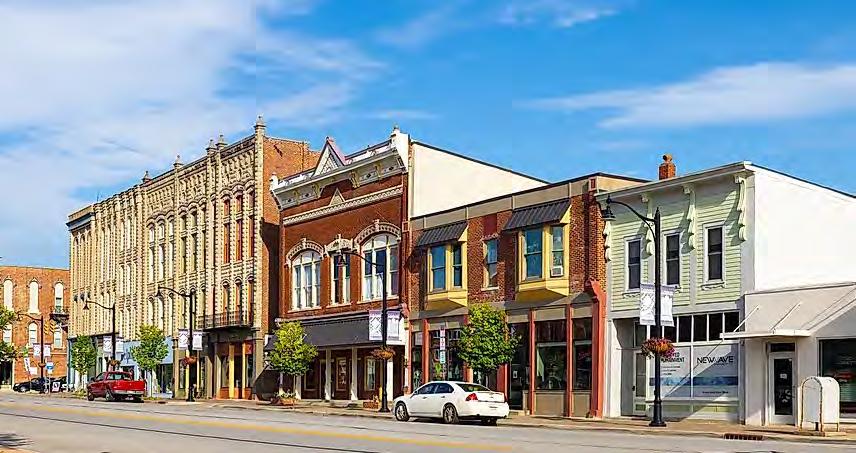
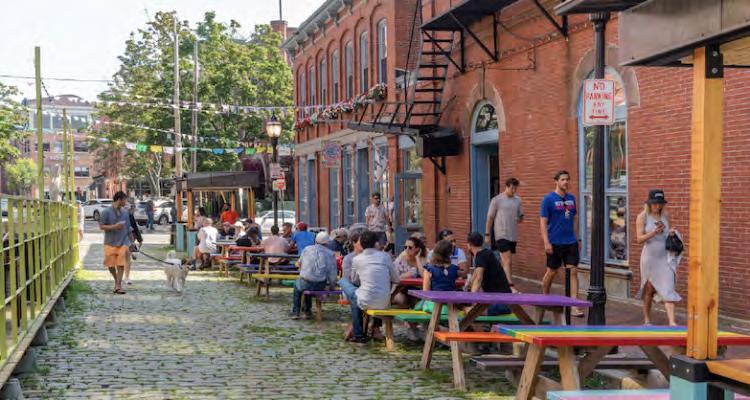
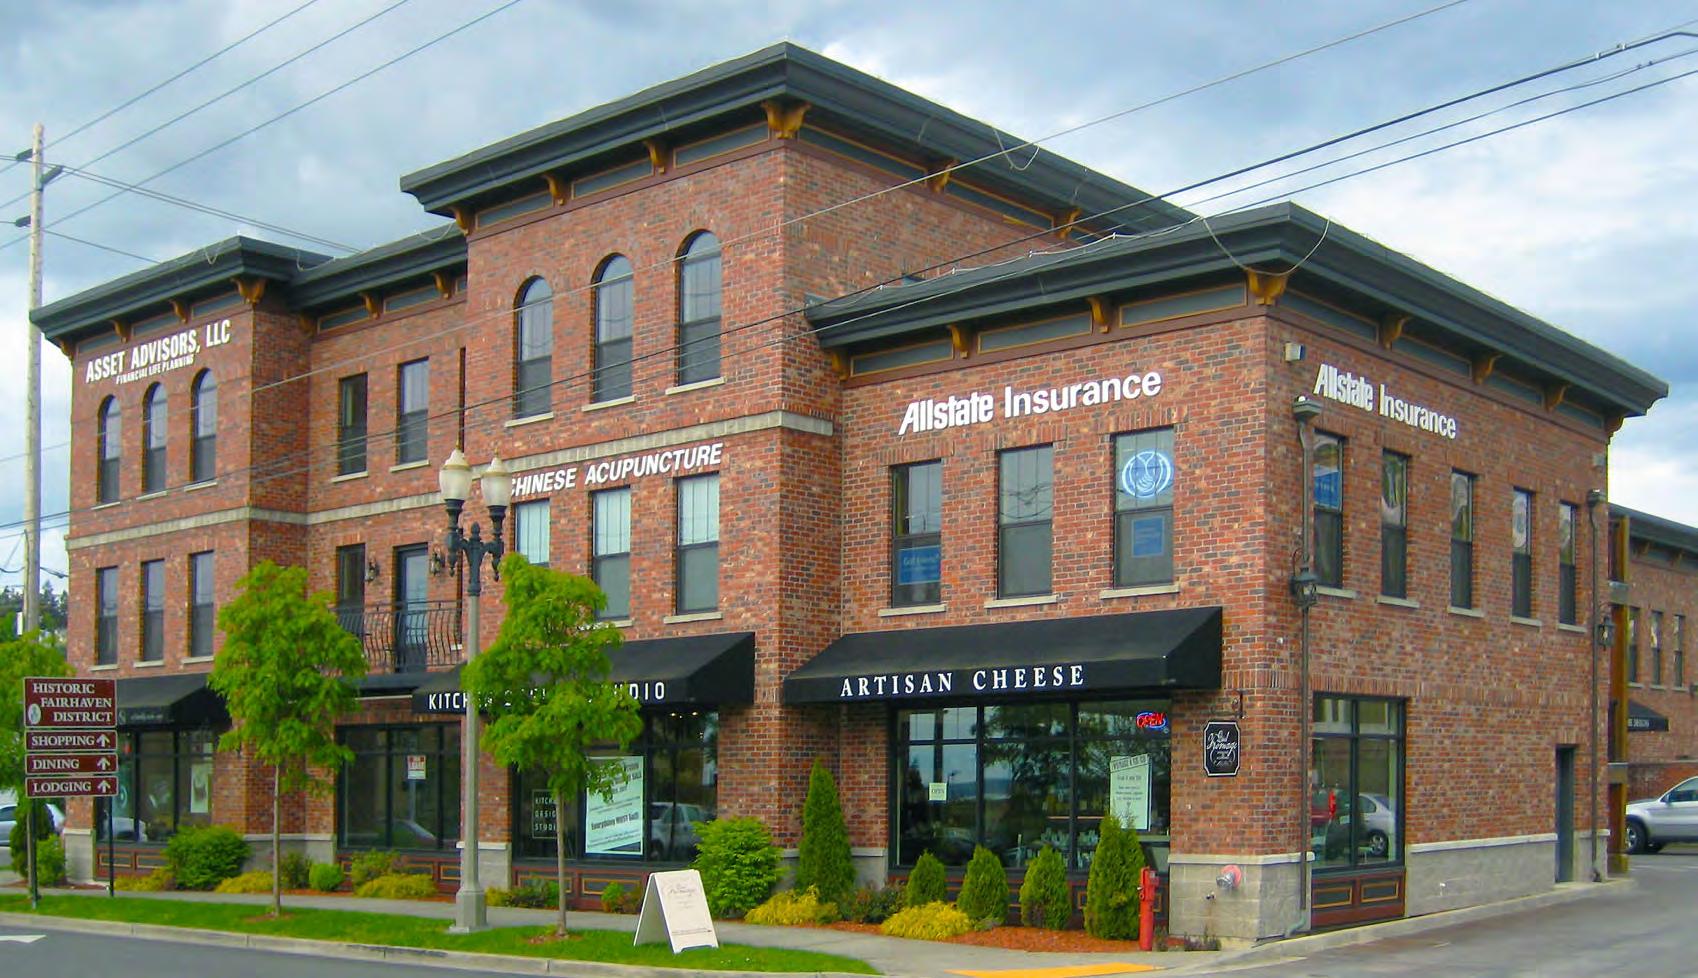
Street Network
Significant Streets
Vehicular
Speed and Capacity
Bicycle and Pedestrian/ Micromobility
Street Character
The movement of people, goods, and/or services through and within the placetype, including travel between this placetype and surrounding placetypes.
• A traditional grid should be established.
• Alleys are encouraged.
• Joliet Rd, Lamong Rd, Horton Rd, Eagletown Rd
• Two-way and two-lane traffic is preferred.
• High traffic intersections should consider traffic controls.
• Wayfinding signs are highly encouraged.
• Residential streets are low speed and low capacity to discourage through traffic.
• Sidewalks should be added along all road frontages where they do not exist.
• Trails and sidewalks should connect to encourage nearby residents to walk and bike to Village Center amenities.
• Businesses should consider identifying golf cart parking spaces on-street or in parking lots and not allow parking on sidewalks or trails.
The appearance and design of streets within the placetype, especially elements that enhance the experience of the public atmosphere. The character of buildings and amenities that do not sit directly in the right-of-way are discussed in later sections.
• Bike lanes and other bike infrastructure should be provided along roadways.
• Residential streets may share streets with bicycles. Sharrow markings (the markings in street that show a bike and arrows) and “share the road” signage should be incorporated to remind drivers to look for cyclists.
Streetside Amenities
On-street Parking
Block Pattern
Access Points
• Amenities should include street trees, pedestrian-scale lighting. Lampposts may include banners or other decorative elements to identify the neighborhood. Native plants are encouraged.
• Benches and trashcans may be provided along sidewalks at intersections.
• Local and residential streets may include on-street parking.
• On-street parking is encouraged.
Characteristics of the design and layout of a property, especially in relation to surrounding properties, which include both the land and any buildings on the property.
• Typical Block Size: 200-500-feet
• Typical Lot Size: 0.1 to 0.3 acres
• Typical Building Coverage: 85% or less
• Access from alleys or side streets is preferred.
• Driveways are encouraged to be shared to reduce the number of curb cuts across sidewalks.
Building Placement/ Character
Setbacks/Build to
• Building placement should align to the street grid.
• Entrances should face the public street.
• Entrances should incorporate porches, vestibules/recesses, columns, or similar features.
• Elements from historic and vernacular architecture styles are encouraged.
• Buildings may be up to 3 stories, but single-unit dwellings should be limited to 2.5 stories.
• Building setbacks should generally be uniform; setbacks of 20-feet or less are preferred to incorporate street trees, sidewalks, and front yards.
• Business signs should be wall mounted or projecting signs. Freestanding or ground signs should be avoided.
• Buildings should align to the street grid.
• Courtyard style developments may be oriented to a central green space.
Off-Street Parking Areas
Amenities & Open Spaces
Landscaping
Stormwater Management
• Parking areas should be located beside or behind buildings.
• Parking for bikes, scooters, and similar micromobility devices is encouraged for trail and bike lane users.
• Bike racks are encouraged next to commercial and mixed use buildings’ entrances.
• Small outdoor areas (pocket parks) are encouraged for recreation and social interaction.
• Central gathering spaces are encouraged.
• Street trees and sidewalks are encouraged.
• Landscape strips should buffer sidewalks from the street.
• Drainage ditches should be diverted or replaced with storm sewers to allow for frontage sidewalks.
• Side or rear yards may include rain gardens, bioswales, or retention areas as appropriate.
• When possible, coordinate between adjacent development to provide regional retention instead of each development having their own retention facility onsite.
• On-site drainage facilities should be in easements or common areas and reserved for that specific purpose.
• Landscapes for stormwater management and environmental sustainability are highly encouraged.
Areas within each placetype that have unique conditions for which additional considerations are recommended.
• The Village of Hortonville is governed by The Village of Hortonville Plan which is incorporated into the comprehensive plan by reference. Additional standards, guidelines, or special consideration for development should be reviewed and incorporated based on that plan.
• Office, commercial, or retail use should be located adjacent to residential areas at intersections or along collector and arterial streets.
• Housing such as duplexes, townhomes, and multiplexes should be designed to complement the scale and character of the surrounding neighborhood and dwelling units.
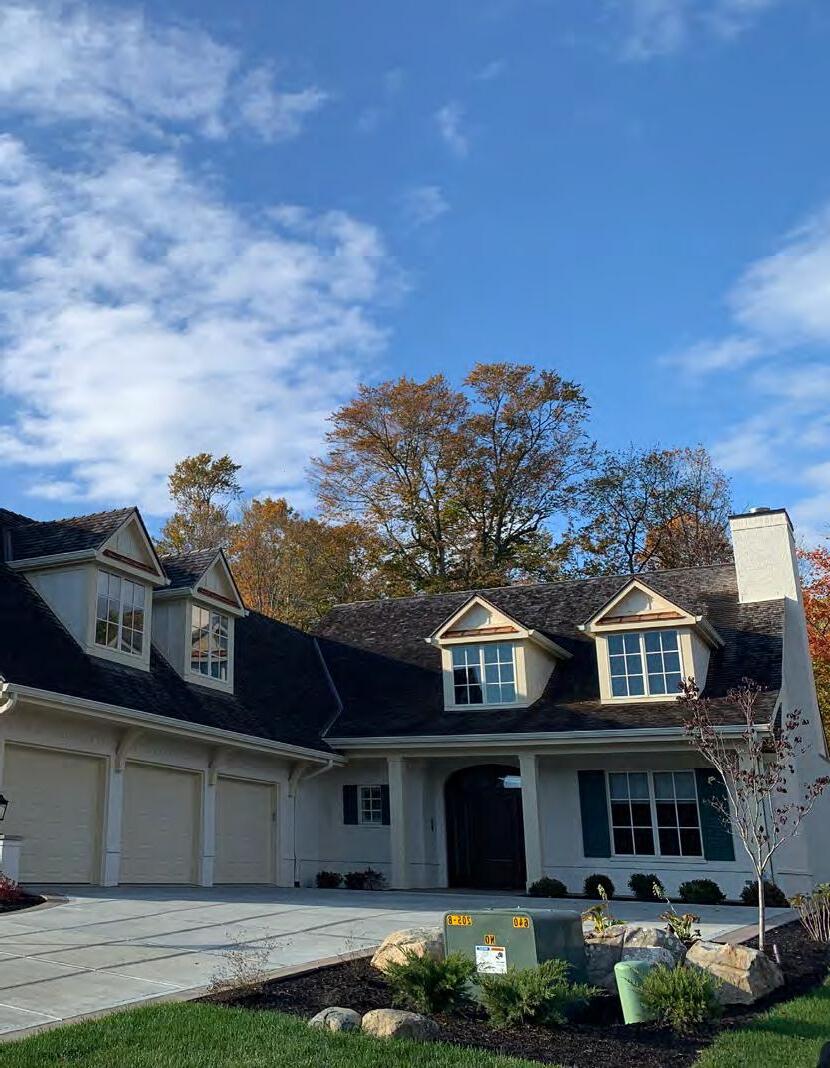
The Master Planned Mixed Use placetype is applied to new residential neighborhoods that lie along primary transportation routes and similar suburban residential/commercial districts that are in transition. These areas are intended to have a mix of residential types that would include both horizontal and vertical mixed use. These areas should have a higher degree of walkability and connectivity with surrounding residential areas, institutional uses, and commercial nodes. These developments may be smaller in nature due to their proximity to primary transportation routes. Housing density will vary but could include 2 to 3-story residential and commercial buildings. These areas would serve as a buffer to lower density residential areas.
1. This placetype will continue to evolve as different residential types and commercial and office uses are developed or redeveloped.
2. This placetype is typically located along major transportation corridors or at the edges of established commercial areas.
3. Nonresidential uses should be integrated with design of a new development or redevelopment of an existing node.
4. This placetype provides a low-impact transition from higher density residential and commercial uses to lower density residential uses. Developments are encouraged to use yards and open spaces as buffers.
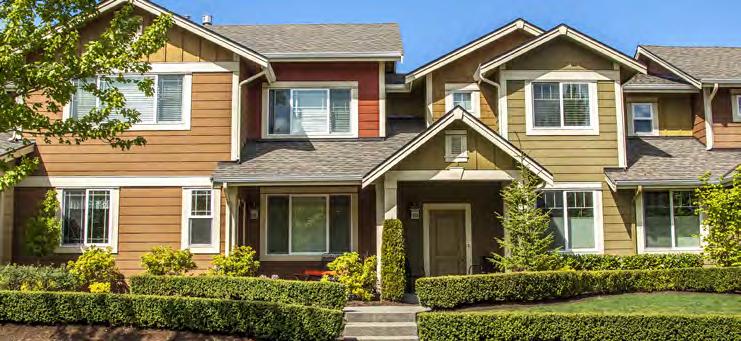
4.73: Example of Attached Multi-Unit Development that has characteristics of single-unit development.
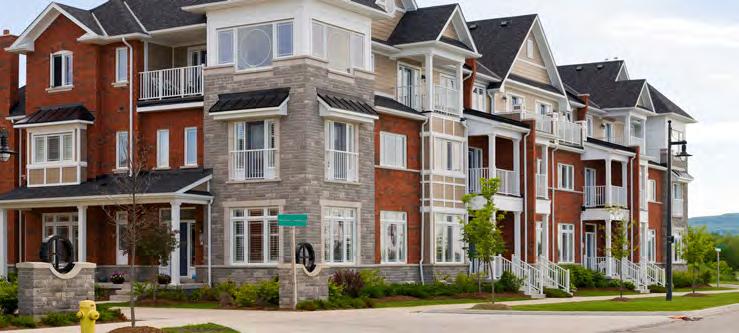
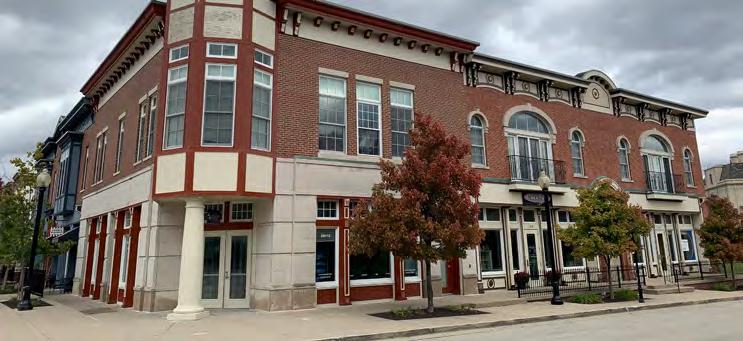
4.74: Example of mixed use building with commercial on the first floor and office and residential above. On-street parking and landscaping incorporated into design.
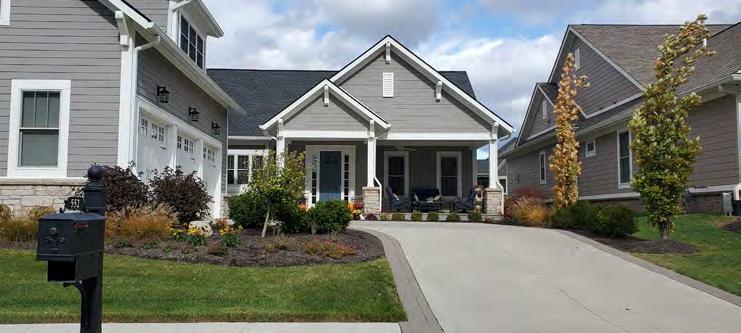
Street Network
Commercial Vehicles
Bicycle and Pedestrians
Golf Carts
On-Street Parking
Speed and Capacity
Block & Lot Patterns
Access Points
Building Placement
Setbacks/Built to
Off-Street Parking Areas
Amenities & Open Spaces
Landscaping
Stormwater Management
The appearance and design of streets within the placetype, especially elements that enhance the experience of the public atmosphere. The character of buildings and amenities that do not sit directly in the right-of-way are discussed in later sections.
• The street network provides a high degree of connectivity with multiple routes to get to destinations.
• Residents have options for walking, biking, or driving.
• Commercial vehicles should not be routed through residential areas.
• High-quality sidewalks, crosswalks, and walking paths; these should extend beyond the development to connect to commercial areas, parks, and essential services.
• Dedicated bike lanes, shared-use paths, and bike storage facilities help to promote safety and use.
• Golf carts could serve as alternative form of transportation.
• Golf carts may use the same space as passenger vehicles.
• On-street parking may be in dedicated parking areas.
• On-street parking helps to further separate vehicle traffic and pedestrians using the sidewalk.
• Circulation within developments should be slow speeds and use traffic calming methods, such as raised crosswalks and narrow widths.
Characteristics of the design and layout of a property, especially in relation to surrounding properties, which include both the land and any buildings on the property.
• Typical Block Size: 400 - 800-feet
• Typical Lot Size: 3,000 - 5,000 square feet
• Typical Building Coverage: 75%
• Curb cuts for driveways should be shared for sites with multiple buildings.
• Sidewalks should connect from the street to the front door.
• Buildings should be oriented to the street or an interior courtyard.
• Buildings may be up to 3 stories.
• Setbacks from the street should align with the established setback.
• Garage or surface parking may be used.
• Off-street parking areas should be located behind or beside buildings. No parking areas should be in the front yard.
• Playgrounds, green spaces, and other outdoor recreational areas are encouraged for residents’ use.
• Pools, clubhouses, and fitness facilities are common amenities for residents’ use.
• Landscaping should include plenty of shade trees to encourage walking and recreation.
• Parking areas should be screened with fences and/or landscaping.
• Sites should be connected to the city storm sewer or provide on-site retention/detention facilities.
• Landscapes for stormwater management and environmental sustainability are highly encouraged.
Special Considerations
• None
Areas within each placetype that have unique conditions for which additional considerations are recommended.
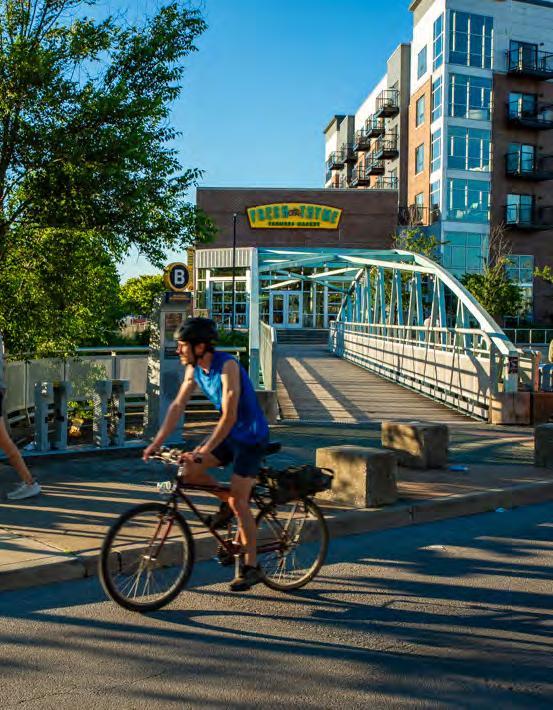
The Trail-Oriented Development placetype builds upon the established network of trails and pathways throughout Westfield and the region. A mix of medium to high intensity uses are concentrated around the existing named trails. The predominant land uses can vary significantly depending on the trail node, but could include, ranging live/work units, small scale apartments, townhouses, commercial, retail, office, professional services, etc. Higher-intensity development should be limited to select nodes along the trail and development should be well connected to these facilities.
1. Trail-oriented developments should be designed to fit within their local context and neighboring placetypes regarding development scale and character. Buildings should be designed with a primary facade facing the trail, including residential or commercial main entrances, patios, landscaping, or other amenities.
2. Trail-oriented developments incorporate public spaces for trail users including public art, small parks, recreational activity areas, and rest areas with benches, bathrooms, and water fountains.
3. Semi-public areas adjacent to trails attract visitors to their businesses with unique and interactive landscaping, lighting, public art, and outdoor activity spaces.
4. Trail-oriented developments should incorporate dense mixed use housing to meet demand for trail adjacent living and to maximize investment.
5. Trails provide economic opportunities for businesses that rely heavily on foot traffic. Mixed use buildings are encouraged to allow more businesses and housing near trails.
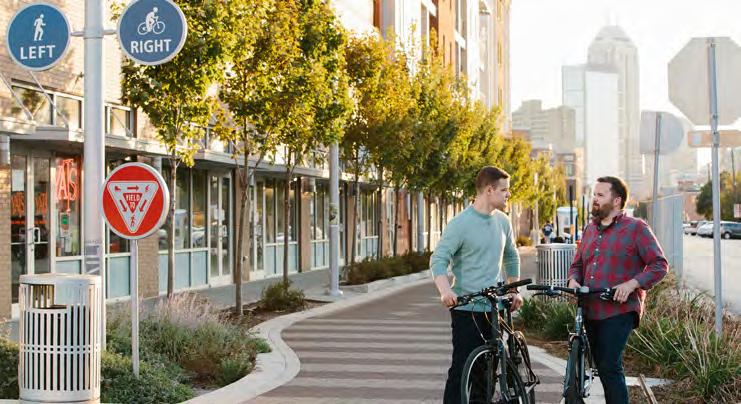
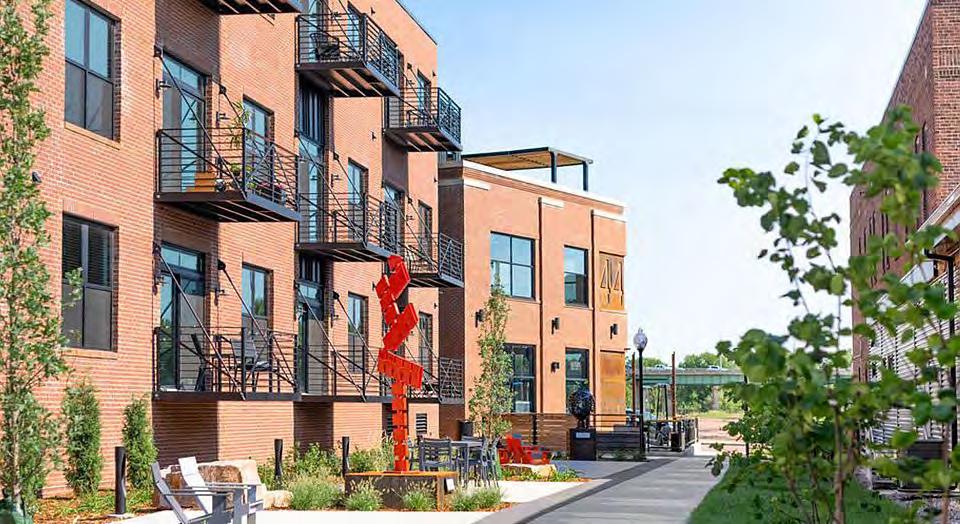
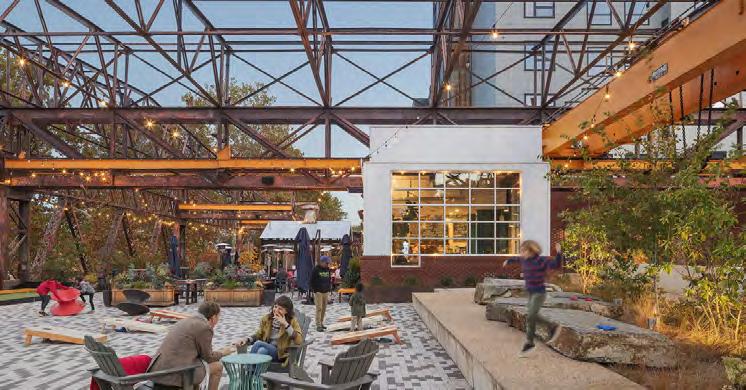
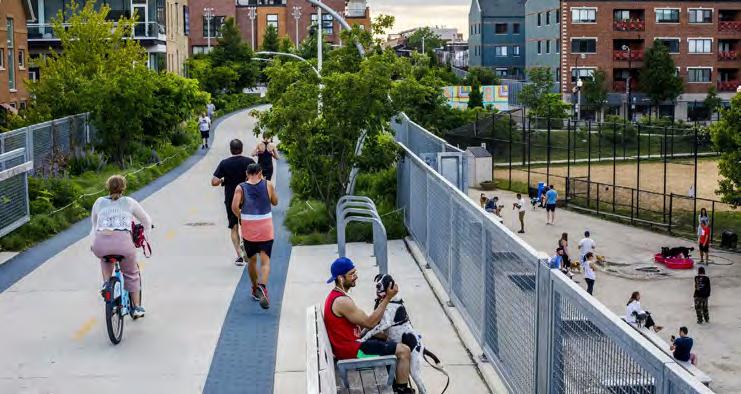
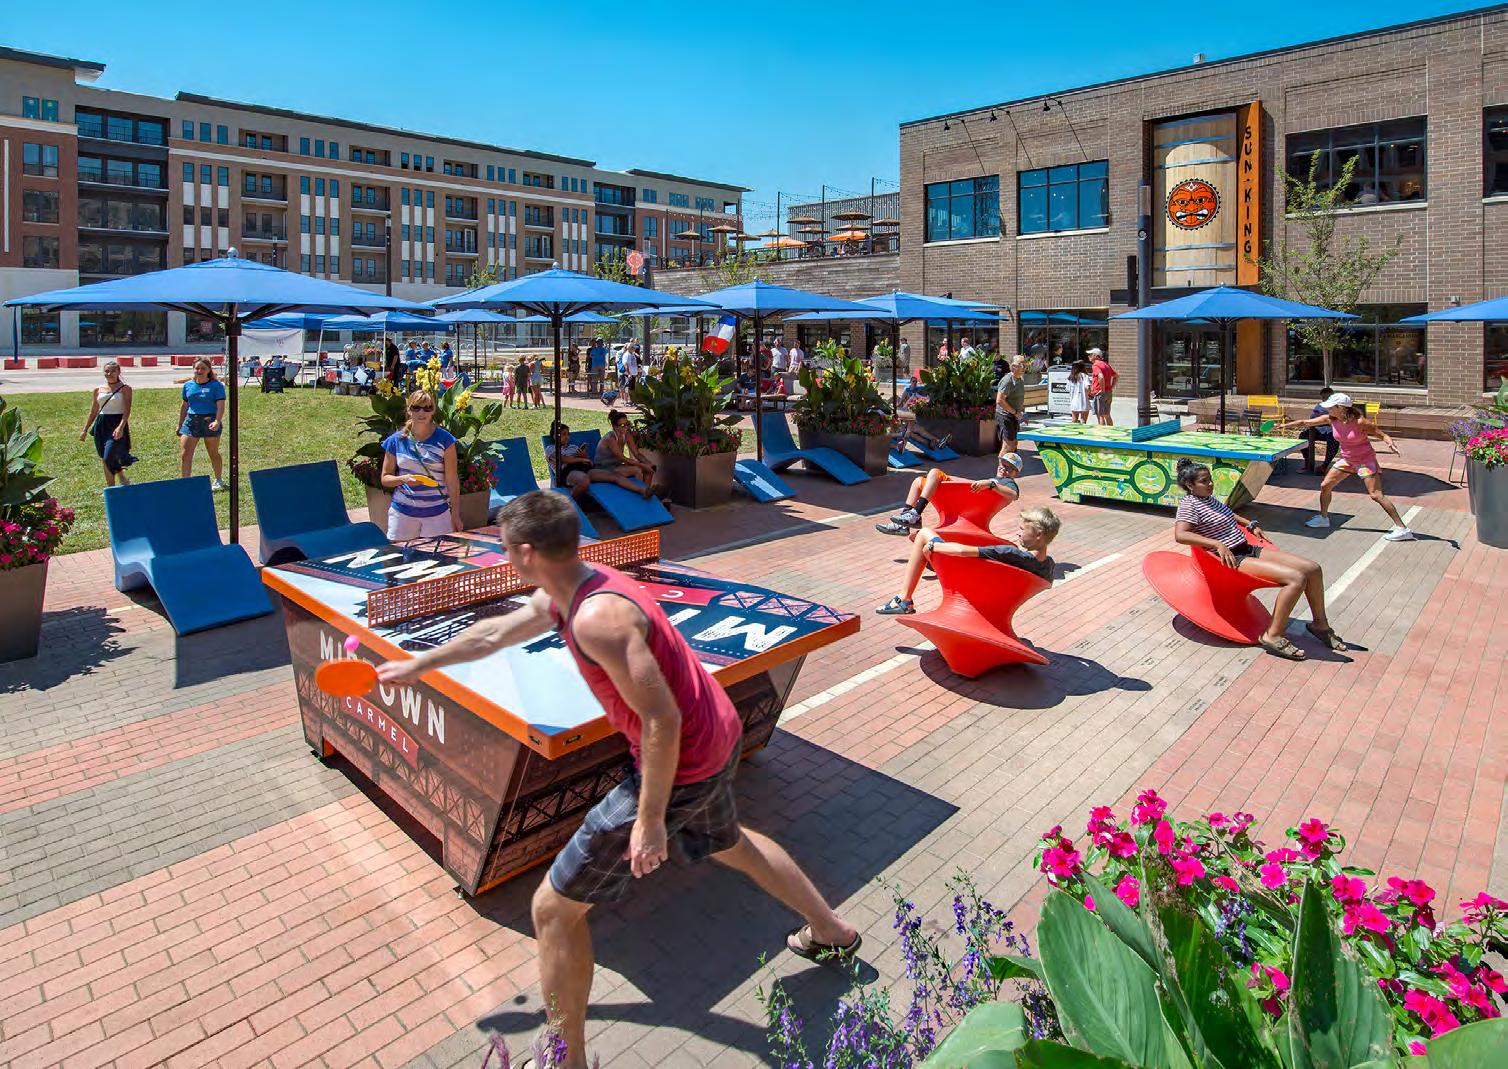
Street Network
The appearance and design of streets within the placetype, especially elements that enhance the experience of the public atmosphere. The character of buildings and amenities that do not sit directly in the right-of-way are discussed in later sections.
• A traditional grid network is preferred to provide high connectivity between trail users and destinations.
• Streets should avoid crossing trails for improved safety.
• Where trails intersect with roadways, they should have trail signs and raised, well-marked crosswalks.
• Multi-lane street trail crossings should include a midway pedestrian refuge.
• High traffic arterials should consider having a trail bridge or tunnel instead of an at-grade crossing.
• Commercial vehicle traffic should be limited.
Commercial Vehicles
Bicycles and Pedestrians
Golf Carts
On-Street Parking
Speed and Capacity
Site Design
Block & Lot Patterns
• Commercial vehicles should access buildings on the opposite side of the trail frontage.
• Sidewalks and bike lanes along streets should connect to the trail network.
• If a trail intersects with a roadway, it should have a pedestrian-activated crossing signal.
• Vehicle traffic should always give right-of-way to trail users.
• Golf carts could serve as alternative form of transportation.
• Golf carts may be used on trails that are wide enough to allow two-way passing.
• Golf cart use may be prohibited on some trails. Trail information should specify whether golf carts are permitted.
• On-street parking is permitted.
• Spaces may consider using meters to avoid long-term parking in high traffic areas.
• Narrow street widths are encouraged to slow traffic and to provide more space for pedestrian and bicycle infrastructure.
Characteristics of the design and layout of a property, especially in relation to surrounding properties, which include both the land and any buildings on the property.
• Typical Block Size: varies
• Typical Lot Size: varies
• Typical Building Coverage: varies
• Curb cuts for driveways should avoid crossing trails.
Access Points
• Design for minimal conflicts between vehicles and pedestrians.
• Trails should be easily accessible and highly visible from nearby buildings and sidewalks.
• Buildings should orient to the trail and any other pedestrian pathway. Buildings may need more than one entrance.
• Vertical mixed-use buildings are encouraged.
Building Placement/ Character
• Ground floor frontages should be active spaces. Increased transparency or roll up doors are encouraged to engage with trail users.
• Ground floor residential uses should use elements such as stoops or stairs to create a sense of separation from public spaces.
• Building setbacks should be planned to allow opportunities for outdoor activities between the building and trail.
Setbacks/Built to
Off-Street Parking Areas
Amenities & Open Spaces
Landscaping
Stormwater Management
• Setbacks should be between 10 and 20-feet.
• On-site parking should not be in the yards between a building and the trail.
• Trails should have periodic rest areas with seating, bathrooms, and water fountains.
• Public or private recreation and activity areas may be integrated with trails.
• Trails should have pedestrian scale lighting for evening use.
• Trees are encouraged along streets and trails to provide shade and comfort for users.
• Creative and interactive landscaping is encouraged.
• Urban developments should connect to the storm sewer.
• Landscapes and on-site retention/detention facilities should incorporate environmentally sustainable stormwater management, such as bioswales and rain gardens.
Special Considerations Areas within each placetype that have unique conditions for which additional considerations are recommended.
• None
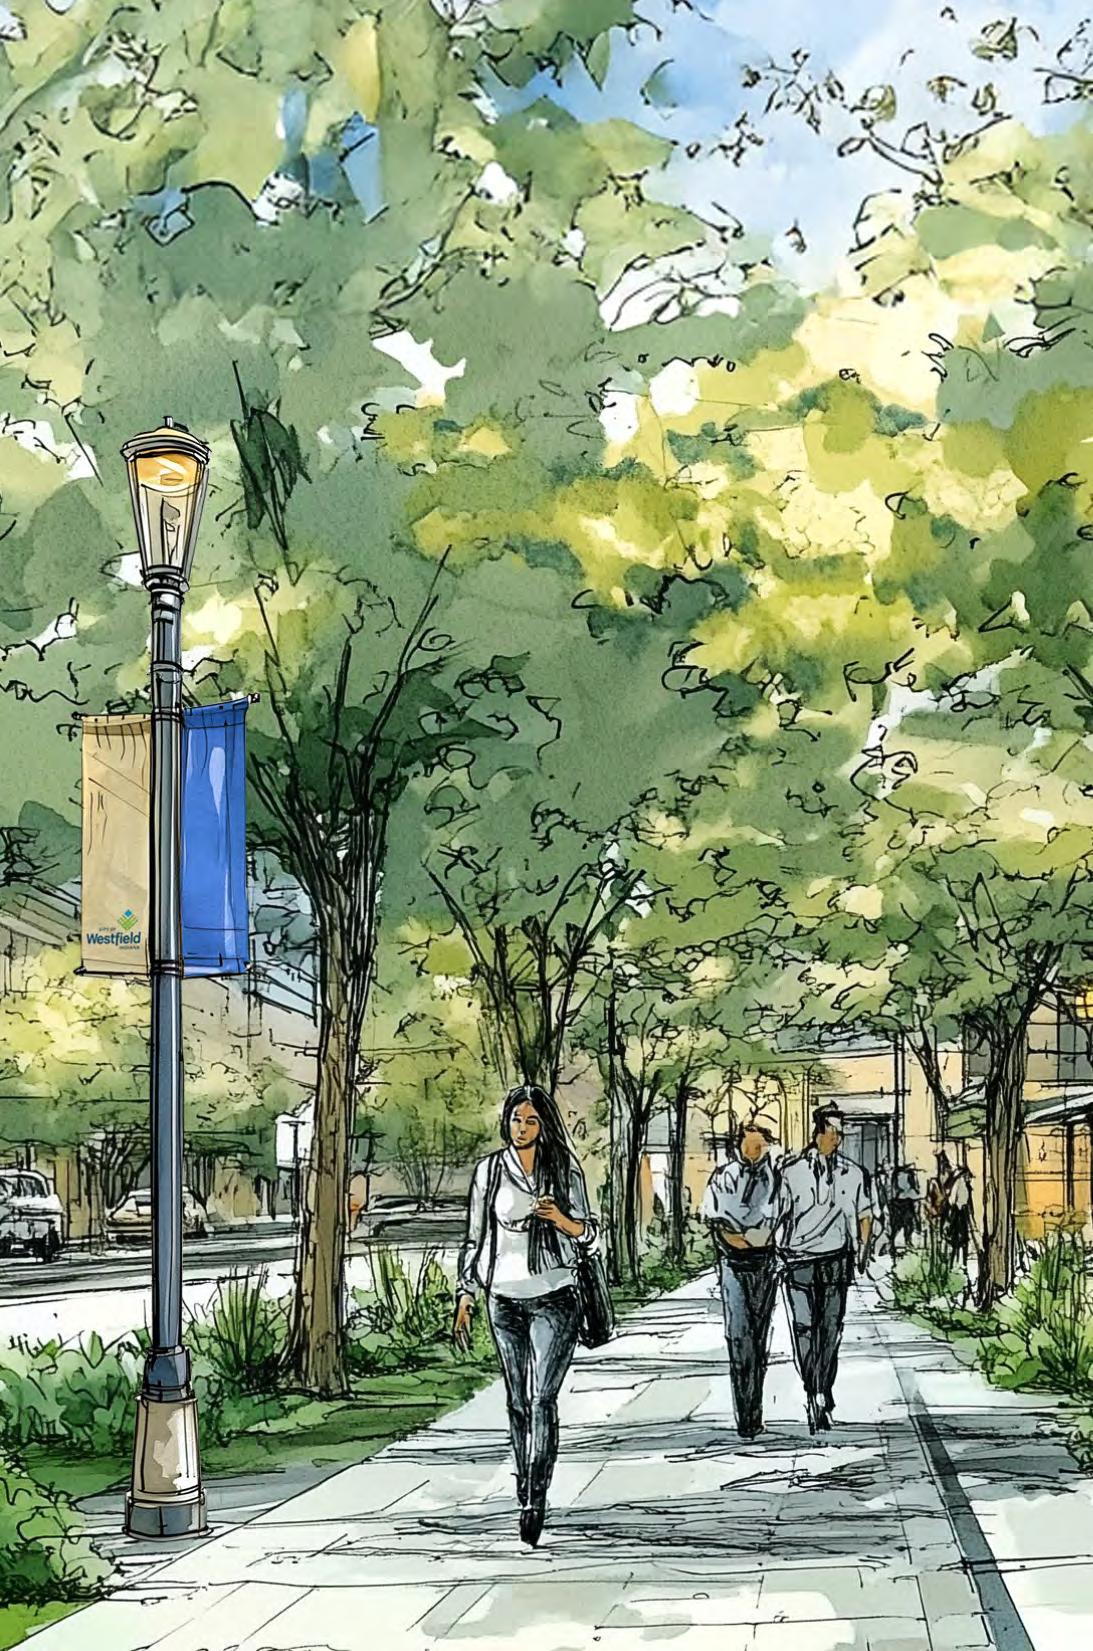
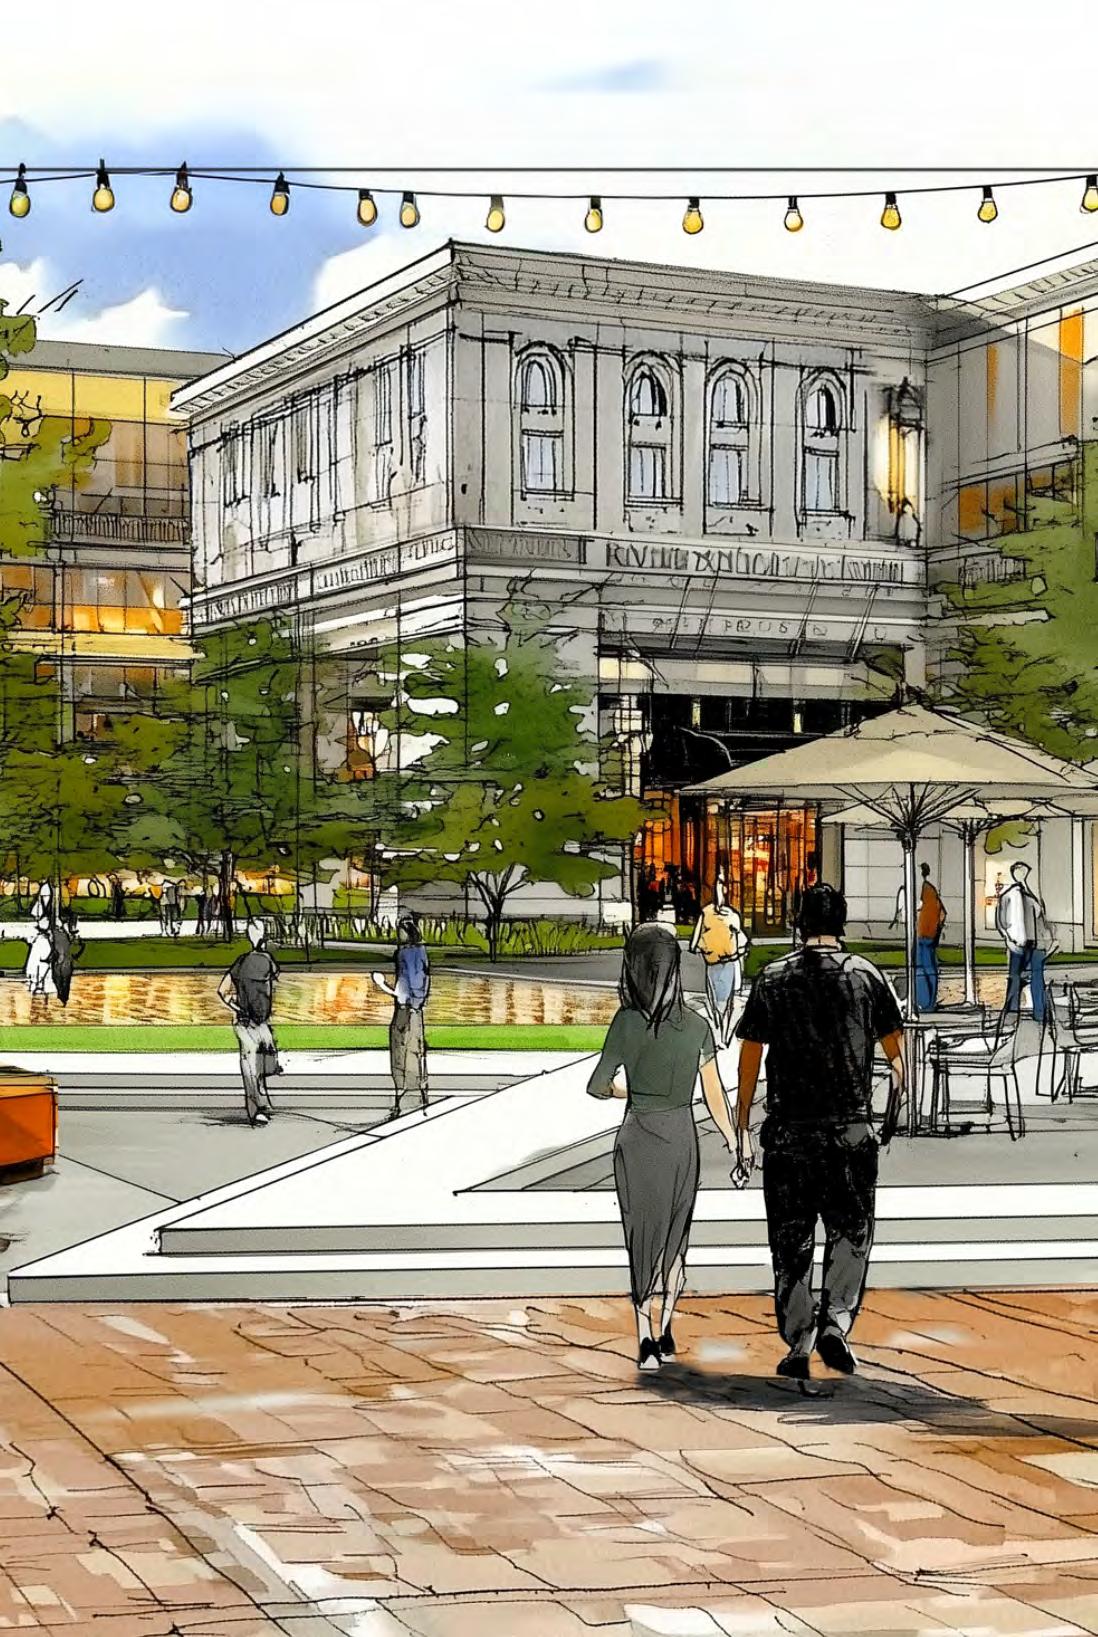
Downtown features an intense mix of uses characterized by a fusion of historic charm, modern appeal, convenience, and interconnected public green spaces and plazas. The downtown features mixed use buildings that contain retail shops, offices, and restaurants without drive-throughs. Urban living spaces include ground floor retail with residential apartments above and shared structured parking. multi-family buildings and single-family homes, both attached and detached, offer supplementary housing options and make a transition to the adjacent neighborhoods. Anchor office buildings with distinctive architecture serve as community centerpieces, grounded in memorable public plazas and community gathering spaces. Tree-lined sidewalks and multi-use trails, accommodating walking, biking, and golf carts, providing interconnectivity between existing trails and parks throughout the city. Urban woodland creek enhancements, including walking trails, overlooks, and urban plazas, complement the downtown area, creating a dynamic balance between nature and urban life.
1. Downtown is the heart of the city. Public spaces and plazas, like Grand Junction Plaza, host events and activities that bring the community together.
2. Downtown is a hub for local and small businesses and civil services, providing ample economic development opportunities.
3. Maintain the established development patterns for street layout, block size, building envelopes, and architectural inspiration.
4. Include wide sidewalks with amenities like benches and outdoor seating/ dining, trash receptacles, public art, attractive streetlights, and street trees for pedestrian comfort.
5. Mixed use buildings and commercial ground floors should create an active street wall to support social interaction and the local economy.
6. Incorporate urban living options to diversify the housing stock and attract residents to downtown.
7. Downtown is governed by a Master Plan Study which is incorporated into the comprehensive plan by reference. Additional standards, guidelines, or special consideration for development in the downtown should be reviewed and incorporated based on that master plan.
• Number of Acres Devoted to Placetype: 384 acres
• Percentage of Total Acreage of All Placetypes: 1.17%
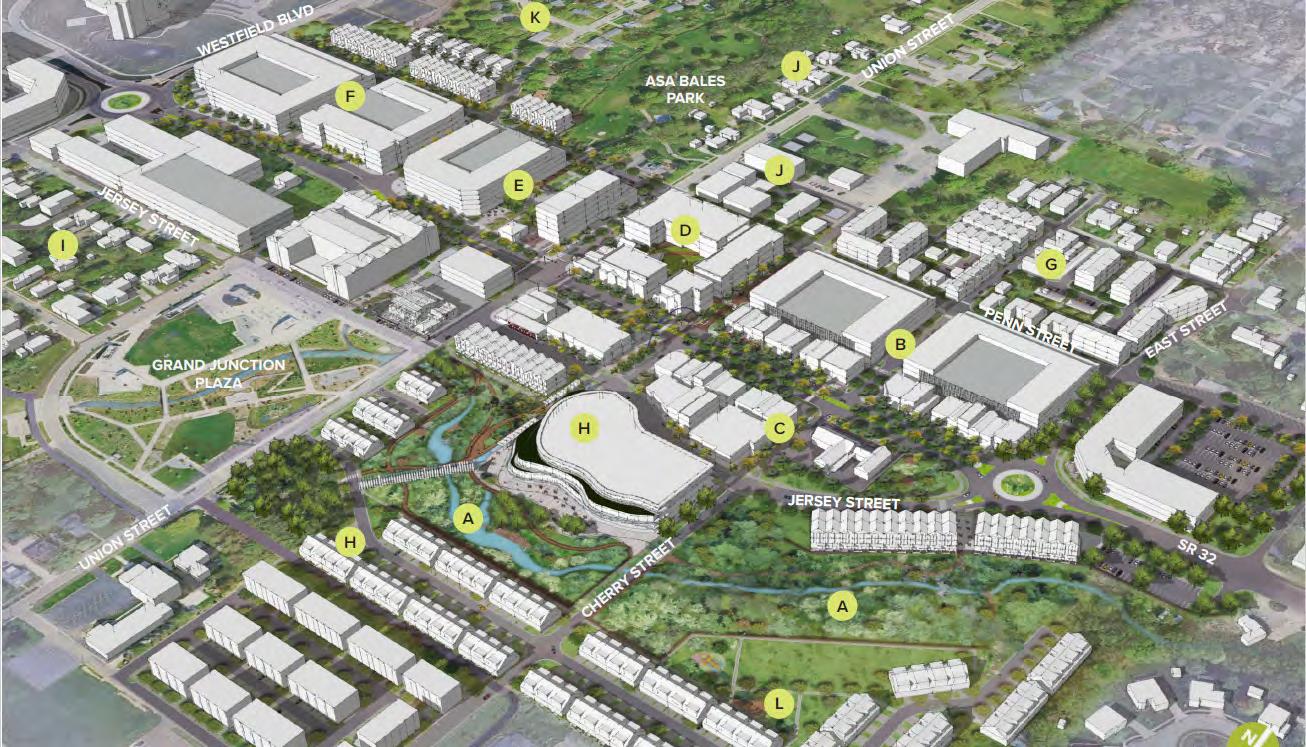
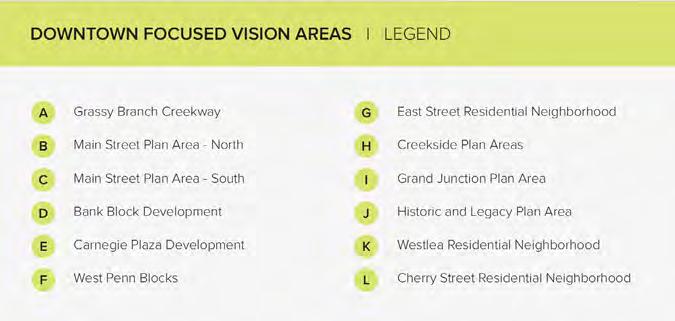
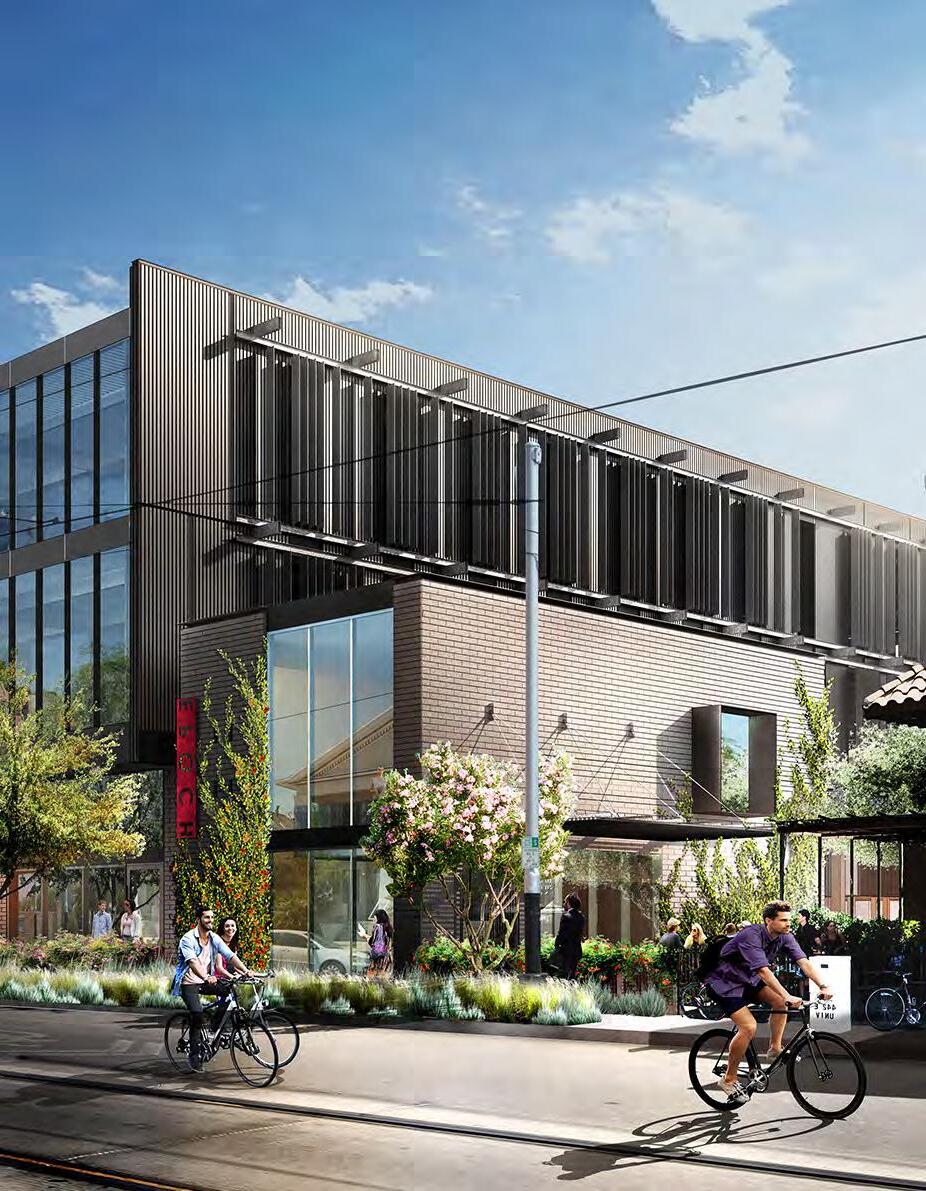
This placetype contains predominately office and other flex space designed to foster creativity, collaboration, and the development of new ideas, products, or services. These districts typically encourage interdisciplinary cooperation and provide the infrastructure and support necessary for entrepreneurship, research and development, and technological advancements. These districts may include shared workspaces, incubators, accelerators, labs, maker spaces, and offices designed to promote interaction and creativity as well as provide access to mentors, investors, or experts. These areas often have multi-modal transportation choices, partnerships with educational institutions, and are designed in the context of urbanized, walkable areas adjacent to higher density residential. This district needs infrastructure integration including high-speed internet, smart technologies, and data-sharing capabilities. This placetype encourages an integrated mix of uses and amenities including cafes, event spaces, green areas, and housing to attract and retain talent.
1. An Innovation District encourages compact, urban environments where pedestrian and bicycle infrastructure are integral to the streetscape.
2. The district should be designed as a campus, with strategically placed gathering spaces that promote interaction between thought leaders.
3. Buildings should be designed for multiple tenants and be adaptable for a mix of uses.
4. Sites are designed to promote collaboration and social interaction with shared outdoor spaces.
5. Architecture and streetscape design should showcase innovative and unique designs to establish a strong sense of place.
6. An Innovation District should connect residential neighborhoods with sidewalks, bike lanes, and mixed use paths to promote alternatives to vehicle commuting.
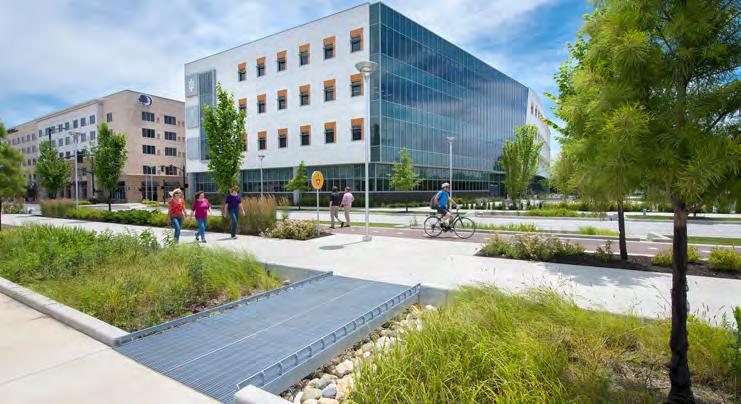
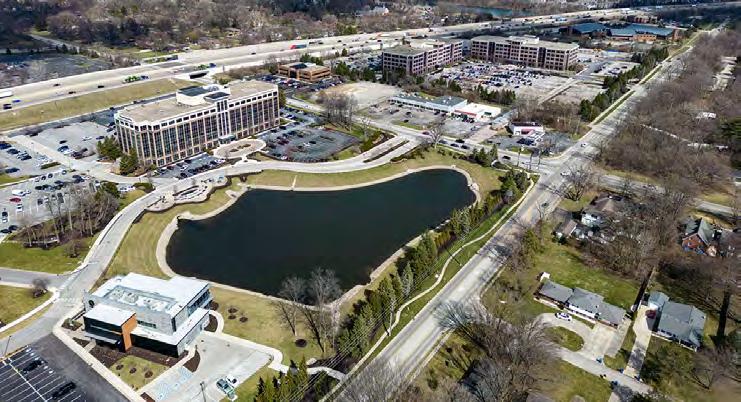
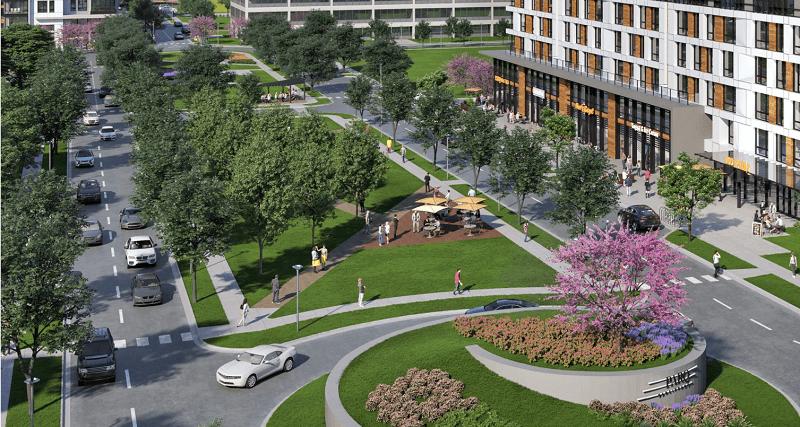
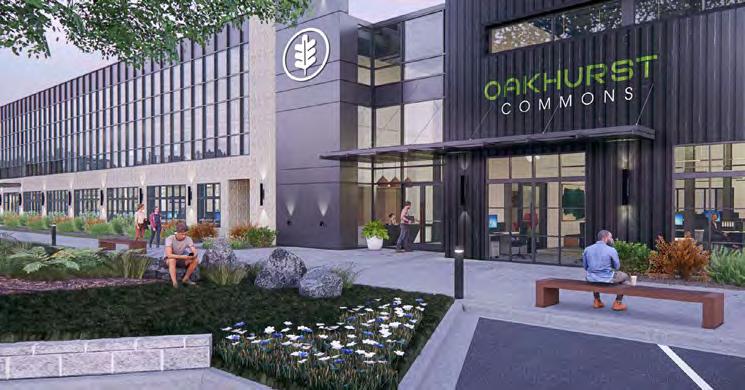
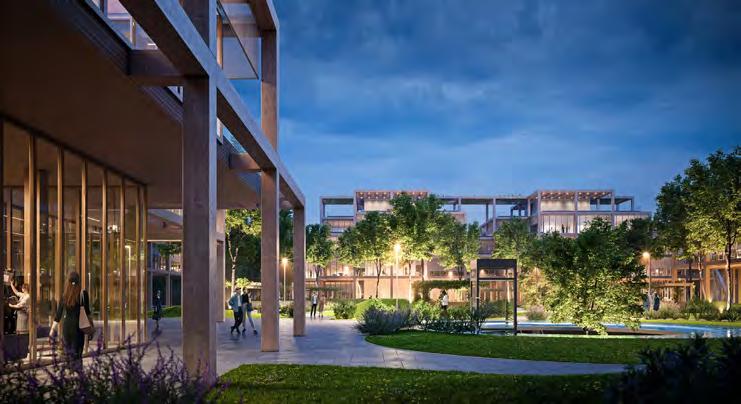
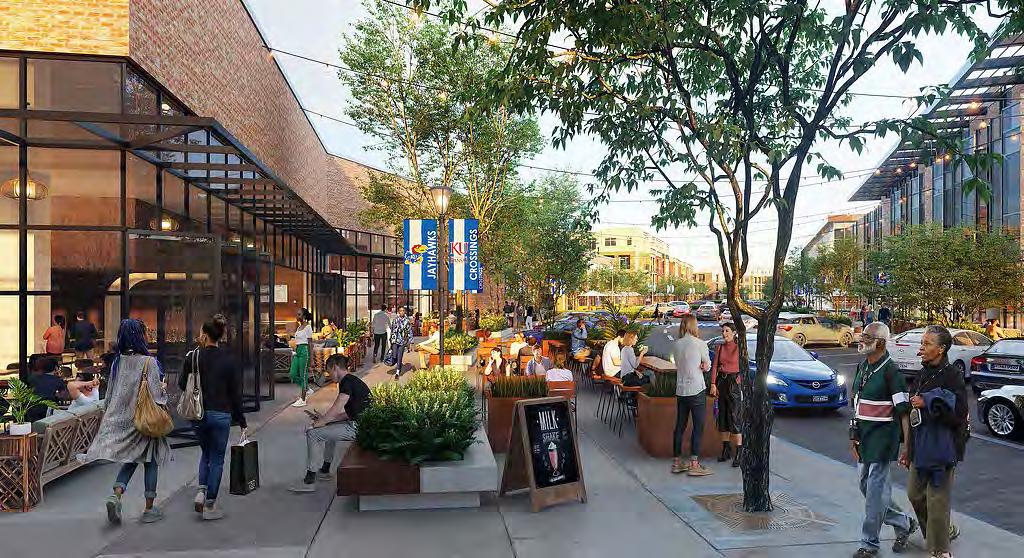
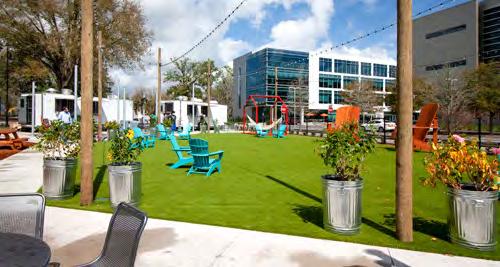
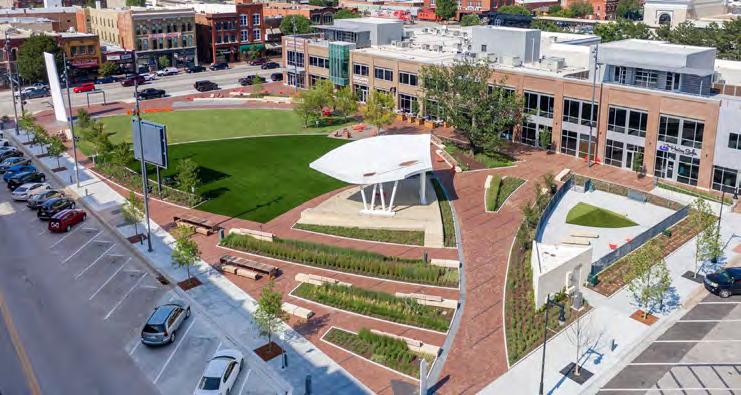
Street Network
The movement of people, goods, and/or services through and within the placetype, including travel between this placetype and surrounding placetypes.
• New streets throughout Innovation developments should generally follow grid patterns.
• Cul-de-sacs should be avoided.
• Locations should be easily accessible from major transportation corridors.
• Two-way traffic is preferred. Roadways should typically be two lanes and may include turn lanes at intersections. Sites’ internal circulation (parking areas, loading areas) may be one-way.
• High traffic intersections should have stop signs or roundabouts.
• Wayfinding signs are highly encouraged for multi-tenant developments.
Speed and Capacity
Bicycle and Pedestrian/ Micromobility
Street Character
• SR 32, SR 38, East Street, 181st Street, 181st Street & Wheeler Road (southeast corner of intersection), 191st Street, Hamilton Boone County Road
• Hamilton Boone County Road may need improvements to accommodate increased traffic due to the establishment of an Innovation District.
• Sidewalks should be added along all road frontages where they do not exist, and sidewalks should connect to building entrances.
• All principal buildings should have on-site bicycle racks or indoor bike storage.
• Bike lanes or multi-use paths are encouraged.
The appearance and design of streets within the placetype, especially elements that enhance the experience of the public atmosphere. The character of buildings and amenities that do not sit directly in the right-of-way are discussed in later sections.
• Multi-modal streets are highly encouraged to support the innovative district character.
• Bike lanes and other bike infrastructure should be integral to developments to promote the workplace desirability and healthy lifestyles in the Innovation district.
• In this placetype, developments are expected to provide a higher level of amenities for employees, guests, and the public. See Amenities & Open Space for more details.
Streetside Amenities
• Creative landscaping, public art, and interactive elements will be important to promote the innovation district identity.
• Benches and trashcans should be provided at intervals for comfort and cleanliness.
• Mixed use areas that include retail or dining components should include outdoor seating and dining.
On-street Parking • Parallel parking may be provided on slower speed streets in front of mixed use and commercial areas.
Block Pattern
Characteristics of the design and layout of a property, especially in relation to surrounding properties, which include both the land and any buildings on the property.
• Typical Block Size: varies
• Typical Lot Size: varies
• Typical Building Coverage: 65% to 80%
• Sidewalks should be on all frontages and always extend to building entrances.
• Campus-style developments should include walking paths between buildings and through common areas using the shortest distances between entrances (anticipating user actions).
• On-site parking should avoid interacting with pedestrians; access drives should be accessed from side streets or alleys. Structured parking is encouraged.
• Building entrances should be architecturally prominent, which may be achieved by adding projections or recesses in the building’s elevations, changes in materials or color, or other methods.
• Entrances facing common green spaces or plazas are encouraged.
• Buildings should cluster around green spaces and plazas.
• Loading and service areas should be located near alleys and parking areas and away from public facing areas.
Setbacks/Build to
Off-Street Parking Areas
• Buildings should be two or more stories to encourage mixed use.
• Tall buildings near residential neighborhoods should have step-backs on stories above three floors to reduce shadows and visual impact.
• Shared pylon signs that identify multiple businesses at entrances are preferred. Individual tenants are discouraged from using freestanding signs.
• Buildings should be located at the street frontage along the curb to promote a more walkable environment.
• Campus-style developments should have buildings surrounding a central activity space or green space.
• Parking should be designed for the entire campus and located outside the campus to encourage pedestrian connectivity. Shared parking is encouraged. Parking structures are encouraged for campus-style developments. Campus style developments should locate parking to the side or between buildings, leaving the front and rear yards for pedestrian activity.
Amenities & Open Spaces
Landscaping
Stormwater Management
• An Innovation District should include a higher level of amenities than traditional campus development. Increased amenities should include higher landscape, specialized lighting, public plaza, fire pits, adult swings, food trucks, fountains, water features, plug and play technological hook ups, coordinated wayfinding, shared outdoor green spaces or plazas for recreation or dining, and integration of public art or interactive elements.
• Street frontages should include street trees.
• Green infrastructure and technology are encouraged to support the Innovation District’s sense of place.
• Any loading or service areas should include native plantings and vegetation and complementary opaque fences for screening.
• Encourage shared regional retention areas instead of individual on-site ponds.
• Permeable pavement is recommended for private parking lots and private roads to reduce the burden on storm sewers.
• Retention areas should use bioswales and other eco-friendly drainage methods.
Special Considerations
Areas within each placetype that have unique conditions for which additional considerations are recommended.
• Attention should be given to building height, orientation, architectural style, and setbacks to ensure new structures fit into existing context.
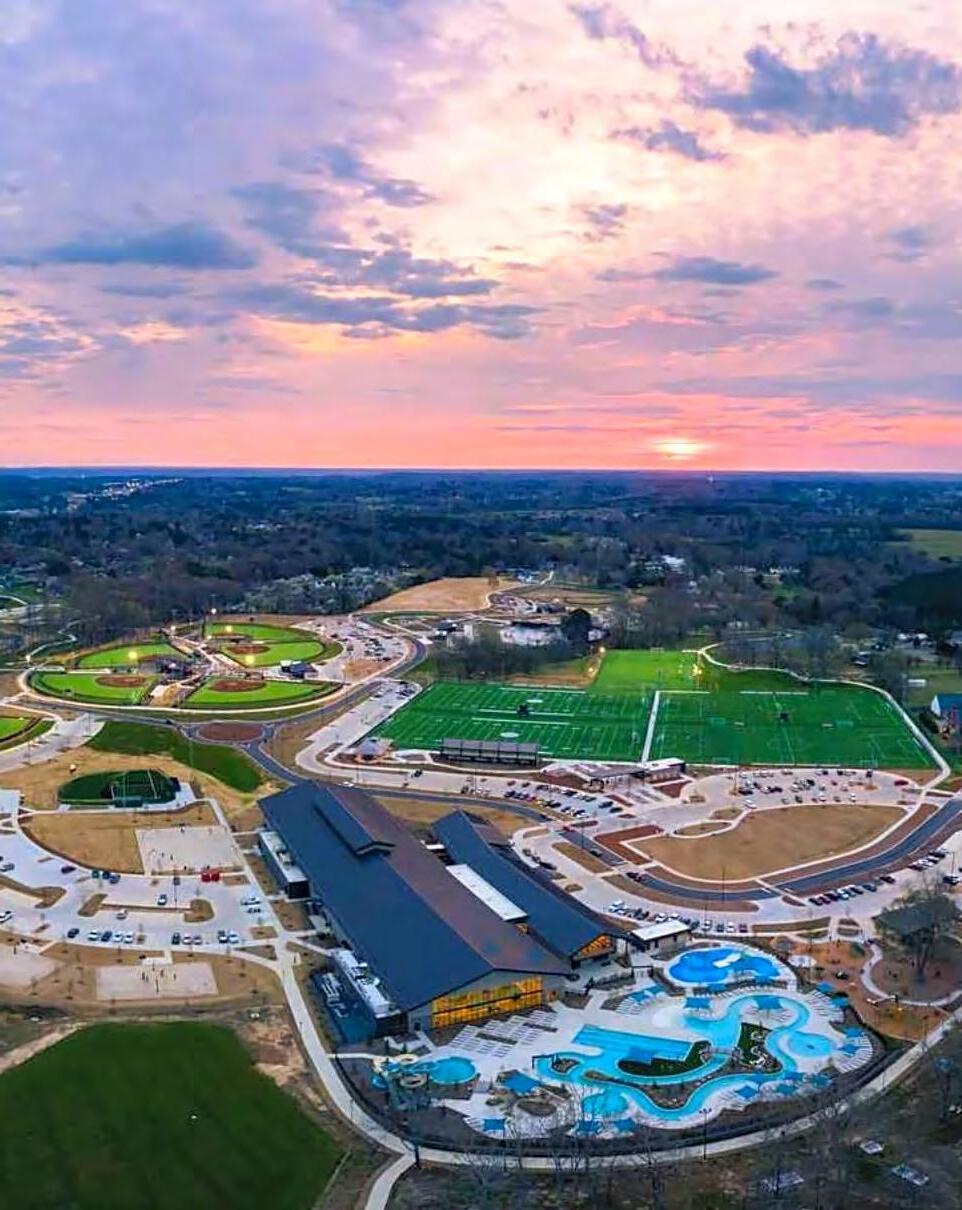
The Destination Development placetype is a specialized district designed to visitors from a broad geographic area by offering a diverse, high-quality, and experiential-driven retail or entertainment environment. This placetype serves as a major economic anchor within Westfield and functions as a significant contributor to local tax revenue, job creation, and tourism. Destination Developments combine retail offerings with entertainment, dining, hospitality, and experiential attractions to create vibrant and engaging consumer destinations. These areas are well designed, walkable, include areas with pedestrian-friendly streetscapes, plazas, and green spaces, and include well-integrated wayfinding, lighting, and aesthetic features that enhance the shopping experience. Mixed use apartments and condominiums could support retail where appropriate.
1. Destination Development includes upscale and large-scale retailers, entertainment, experiential dining experiences, and hospitality that attracts tourists to Westfield.
2. Destination Development should include easy-to-identify gateways and landmarks to create a sense of arrival.
3. Destination Development maybe a single site or a “park once” district where visitors primarily travel on foot between destinations. Buildings should be grouped together and have strictly limited parking areas between buildings for an enhanced pedestrian experience.
4. The placetype should include a mix of indoor and outdoor activity spaces.
5. Streets leading into Destination Development should be designed to support anticipated traffic volumes associated with regional attractions. Major entrances should be designed to minimize the impact on local traffic and commuters.
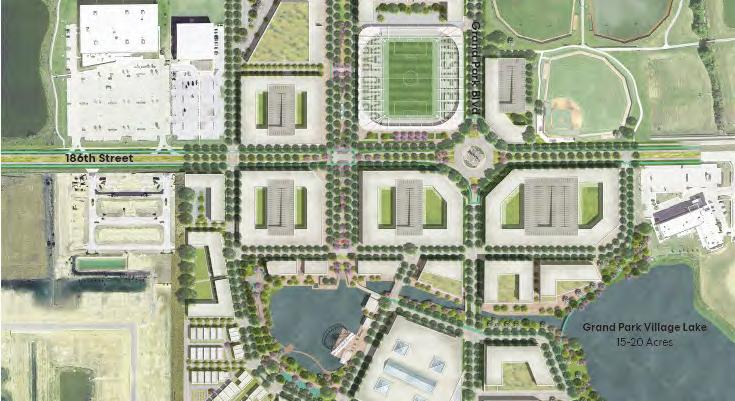
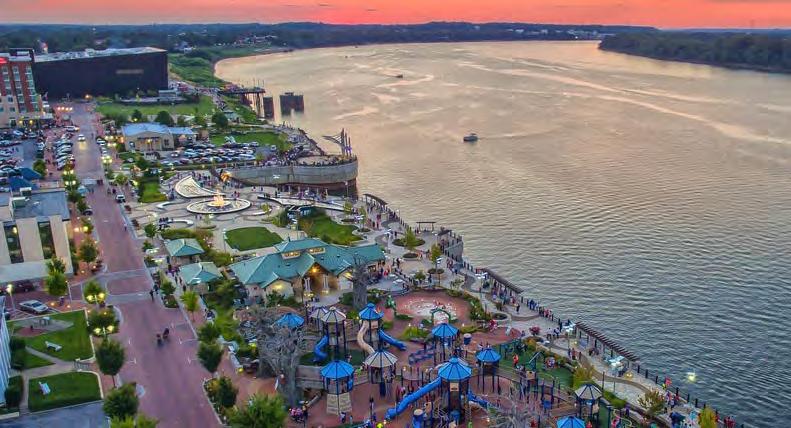
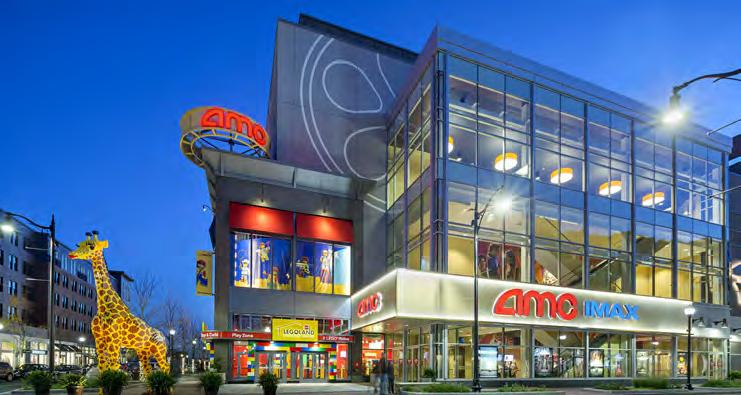
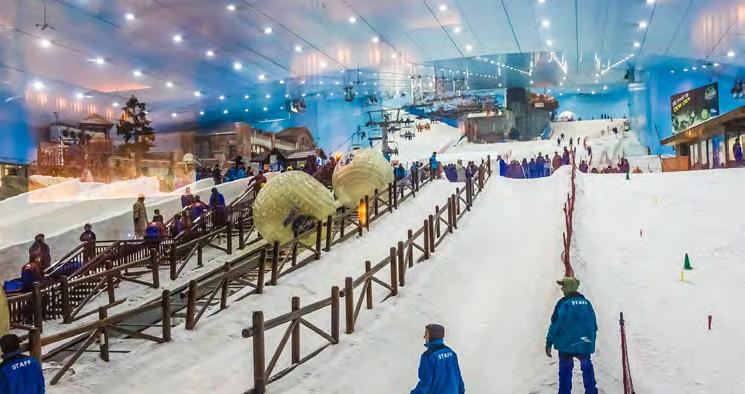
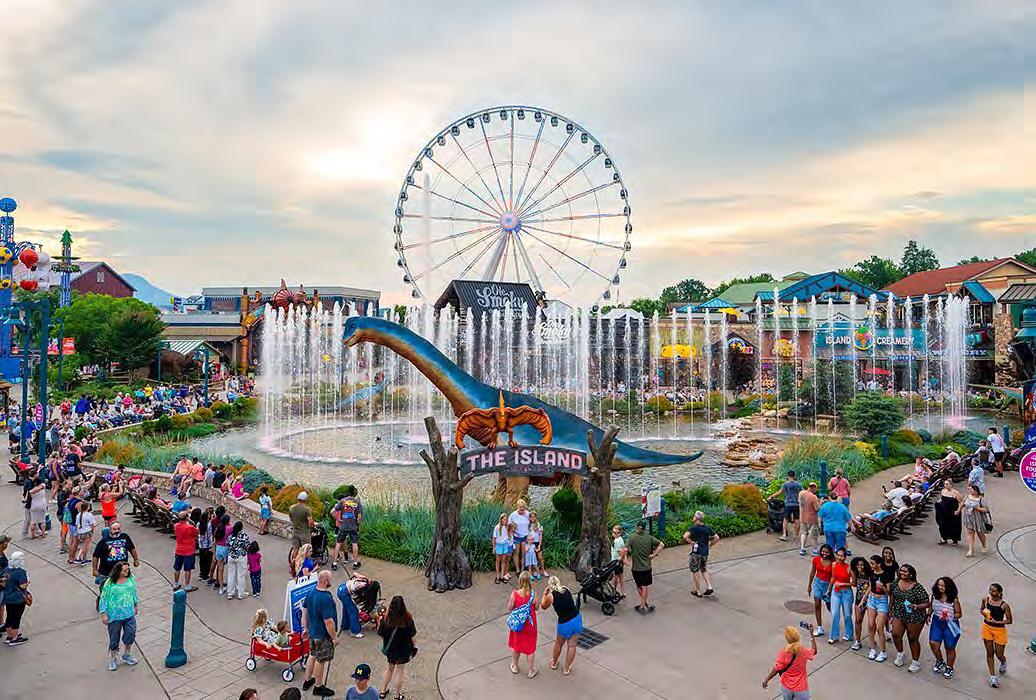
4.106: Destination Development Placetype Characteristics.
Street Network
The movement of people, goods, and/or services through and within the placetype, including travel between this placetype and surrounding placetypes.
• Intersections at perimeter streets should include turn lanes at development entrances. Signalized intersections or roundabouts are encouraged.
• Streets routing through the site should be limited.
• Site circulation should be primarily sidewalks and pedestrian pathways.
• Two-way traffic is preferred.
• High traffic intersections should have stop signs or roundabouts.
• Wayfinding signs are highly encouraged.
Significant Streets
Speed and Capacity
Bicycle and Pedestrian/ Micromobility
• 186th Street, 191st Street, Grand Park Boulevard, Spring Mill Road
• N/A
• Sidewalks should be added along all road frontages where they do not exist.
• Internal sidewalks should be provided throughout the development. Internal bike paths should be limited.
• All principal buildings should have on-site bicycle racks or indoor bike storage near parking areas.
The appearance and design of streets within the placetype, especially elements that enhance the experience of the public atmosphere. The character of buildings and amenities that do not sit directly in the right-of-way are discussed in later sections.
• The site’s internal circulation should primarily be a pedestrian mall. Decorative paving and innovative materials are encouraged to support the sense of place.
Street Character
Streetside Amenities
On-street Parking
Block Pattern
• Single destination sites should locate parking to the side or rear of destination away from main pedestrian corridors, design parking in a way that supports pedestrian connectivity. Single sites should be located on arterial streets that can move traffic to and away from venue.
• Multi-modal streets are highly encouraged.
• Bike lanes and other bike infrastructure should be provided along roadways.
• Amenities should include street trees, lighting, and wayfinding.
• Benches and trashcans should be provided at intervals for comfort and cleanliness.
• On-street parking may be used limitedly. It should not be on primary streets.
Characteristics of the design and layout of a property, especially in relation to surrounding properties, which include both the land and any buildings on the property.
• Typical Block Size: 400-800
• Typical Lot Size: varies
• Typical Building Coverage: 80%
Access Points
Building Placement/ Character
• A pedestrian mall should connect all buildings to each other throughout the site.
• Sidewalks should also be on all street frontages.
• Driveways into parking areas should be accessed from perimeter streets.
• High traffic intersections should have roundabouts or traffic signals to avoid backups.
• Building entrances should be architecturally prominent, which may be achieved by adding projections or recesses in the building’s elevations, changes in materials or color, or other methods.
• Buildings should be oriented to pedestrian areas.
• Buildings should be two or more stories to encourage mixed use.
• Tall buildings near residential neighborhoods should have step-backs on stories above three floors to reduce shadows and visual impact.
• Shared pylon signs that identify multiple businesses at entrances are preferred. Individual freestanding signs should be avoided.
Setbacks/Build to
Off-Street Parking Areas
Amenities & Open Spaces
Landscaping
Stormwater Management
• Building placement should be built up to pedestrian walkways regardless of if it is a front yard.
• Parking areas should be located along perimeters of the district.
• Parking garages are encouraged.
• Non-vehicle parking is encouraged for trails and bike lane users.
• Developments should include outdoor areas and walking paths throughout the site.
• Integrate public art or interactive elements into pedestrian areas.
• Street and sidewalk trees should be provided along corridors for all types of transportation.
• Raised planters are recommended for pedestrian areas.
• Creative and innovative landscaping is encouraged to enhance sense of place.
• Permeable pavement is recommended to reduce the burden on storm sewers.
• Because of the high development density, site drainage will likely depend heavily on storm sewer systems and underground detention.
Special Considerations Areas within each placetype that have unique conditions for which additional considerations are recommended.
• None
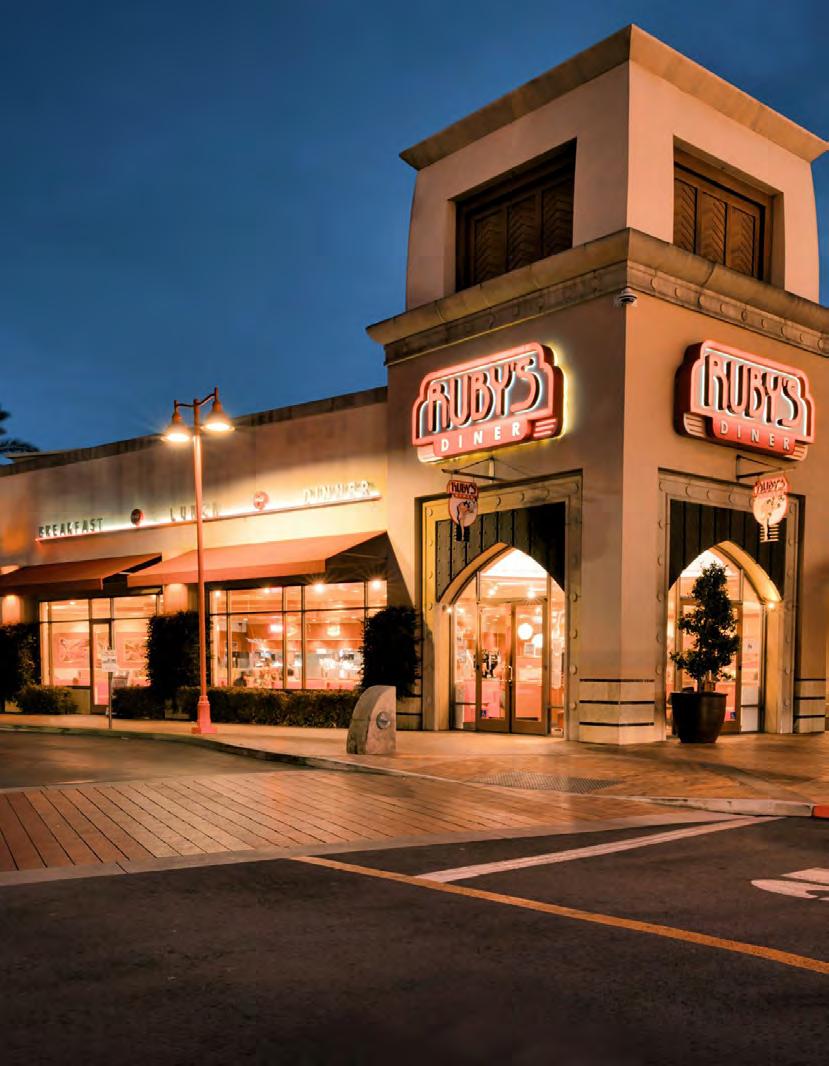
This placetype is a mid-scale and service-oriented commercial area that serves the daily and weekly needs of nearby neighborhoods and the broader community. This placetype has a diverse mix of retail, dining, and essential services in a format that supports automobiles, pedestrians, and micro-mobility access. These districts are typically located along key corridors, at major intersections acting as a hub for commerce and employment.
1. The Suburban Commercial placetype supports uses that attract many users, but for short periods of time.
2. The Suburban Commercial placetype is usually vehicle-oriented for convenience of customers to transport merchandise; however, it is important that site access and interior circulation are designed for all forms of transportation so that residents can safely make shorter trips on foot or by bike as well.
3. Buildings are integrated with each other and into trail networks within the community for safe, convenient, and accessible ways to walk and bike.
4. This placetype should be located along major transportation corridors to support high traffic turnover. Direct connections to major roads are discouraged to reduce disruptions to traffic flows and improve pedestrian and bicyclist safety.
5. Buildings are designed to be adaptable for a variety of commercial uses for long term viability.
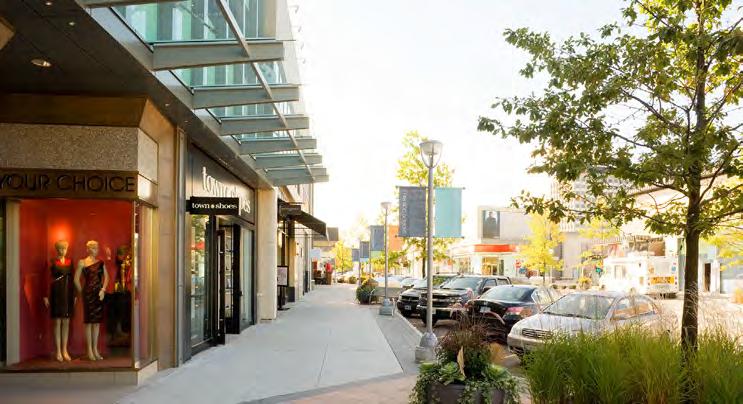
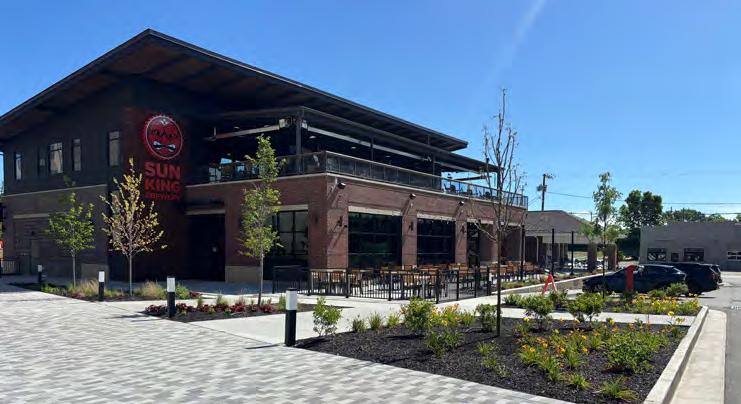
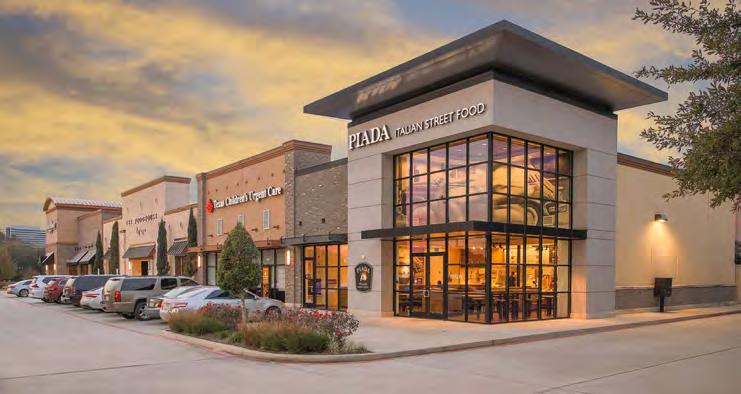
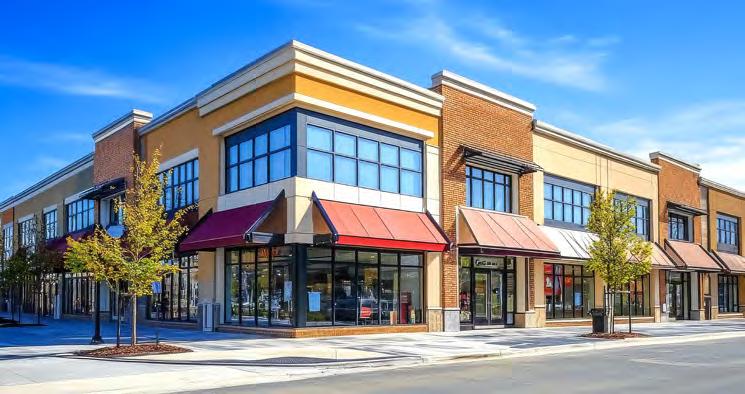
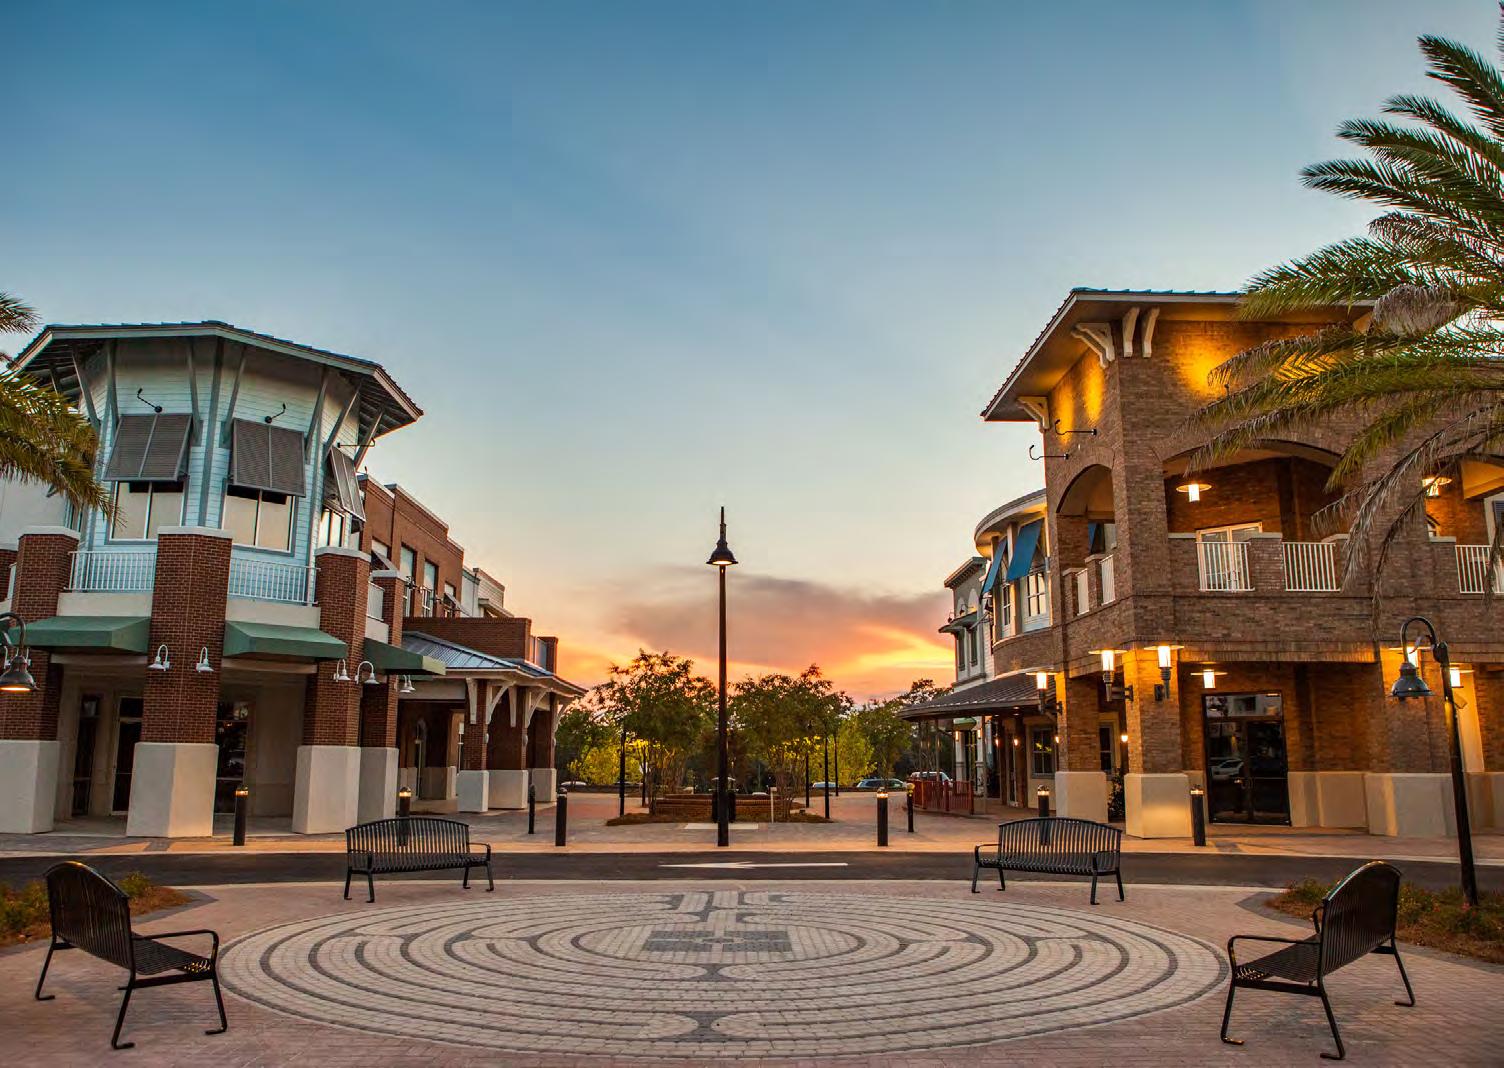
Street Network
The movement of people, goods, and/or services through and within the placetype, including travel between this placetype and surrounding placetypes.
• Create a well-connected multi-use street network with an emphasis on connecting residential areas to commercial centers.
• Plan for multiple mobility options in new developments.
• Incorporate traffic calming measures to maintain safe speeds.
• Frontage roads should be used to access parking areas.
• High traffic intersections should have stop signs or roundabouts.
• Wayfinding signs are highly encouraged.
Speed and Capacity
Bicycle and Pedestrian/ Micromobility
Street Character
Streetside Amenities
On-street Parking
Block Pattern
• TBD
• Sidewalks should be added along all road frontages where they do not exist.
• Internal sidewalks and bike lanes/paths should be provided throughout the development.
• Bicycle racks should be located near building entrances.
The appearance and design of streets within the placetype, especially elements that enhance the experience of the public atmosphere. The character of buildings and amenities that do not sit directly in the right-of-way are discussed in later sections.
• Frontage streets and shared access should connect developments.
• Sidewalks and bike lanes should be integrated into site circulation.
• Amenities should include street trees, lighting, and wayfinding.
• Benches and trashcans should be provided near building entrances rather than along streets.
• On-street parking may be used along local streets where appropriate.
• On-street parking should not be used along major roads.
Characteristics of the design and layout of a property, especially in relation to surrounding properties, which include both the land and any buildings on the property.
• Typical Block Size: 500-800 ft
• Typical Lot Size: varies
• Typical Building Coverage: 70% or less
• Entrances should mostly be coming from frontage streets rather than direct access from major thoroughfares.
Access Points
• Parking areas should have minimal curb cuts for continuous sidewalks.
• Shared driveways are encouraged to reduce paved surface areas.
Building Placement/ Character
• Ground floors of buildings should have high transparency with two-way visibility at entrances.
• Building entrances should be architecturally prominent, which may be achieved by adding projections or recesses in the building’s elevations, changes in materials or color, or other methods.
• Buildings should be oriented to pedestrian areas with wide sidewalks.
• Mechanical equipment and service areas should be located behind buildings.
• Tall buildings near residential neighborhoods should have step-backs on stories above three floors to reduce shadows and visual impact.
• New development should be located at the edges of large blocks to create a walkable environment.
• Shared pylon signs that identify multiple businesses at entrances are preferred. Individual freestanding signs should be avoided.
• Parking and service areas should be screened from public view.
Setbacks/Build to
Off-Street Parking Areas
Amenities & Open Spaces
Landscaping
Stormwater Management
• Buildings should be located up to the sidewalks on local streets but have greater separation between buildings and arterial streets.
• Parking areas should be accessed from frontage roads and easily identifiable. Shared off-street parking between developments is strongly encouraged.
• Incorporate green spaces and landscaping in and around parking areas.
• Incorporate green infrastructure, such as rain gardens, permeable pavement, or green roofs, to mitigate urban flooding and heat-island effects.
• Existing natural features should be preserved or integrated into developments.
• Street and sidewalk trees should be provided along corridors for all types of transportation.
• Incorporate landscape buffers adjacent to residential areas.
• Use landscaping to screen parking lots and service areas.
• Permeable pavement is recommended to reduce the burden on storm sewers.
• Because of the high development density, site drainage will likely depend heavily on storm sewer systems and underground detention.
Areas within each placetype that have unique conditions for which additional considerations are recommended.
• Spring Mill Station is governed by The Spring Mill Station Plan which is incorporated into the comprehensive plan by reference. Additional standards, guidelines, or special consideration for development in the campus should be reviewed and incorporated based on that master plan.
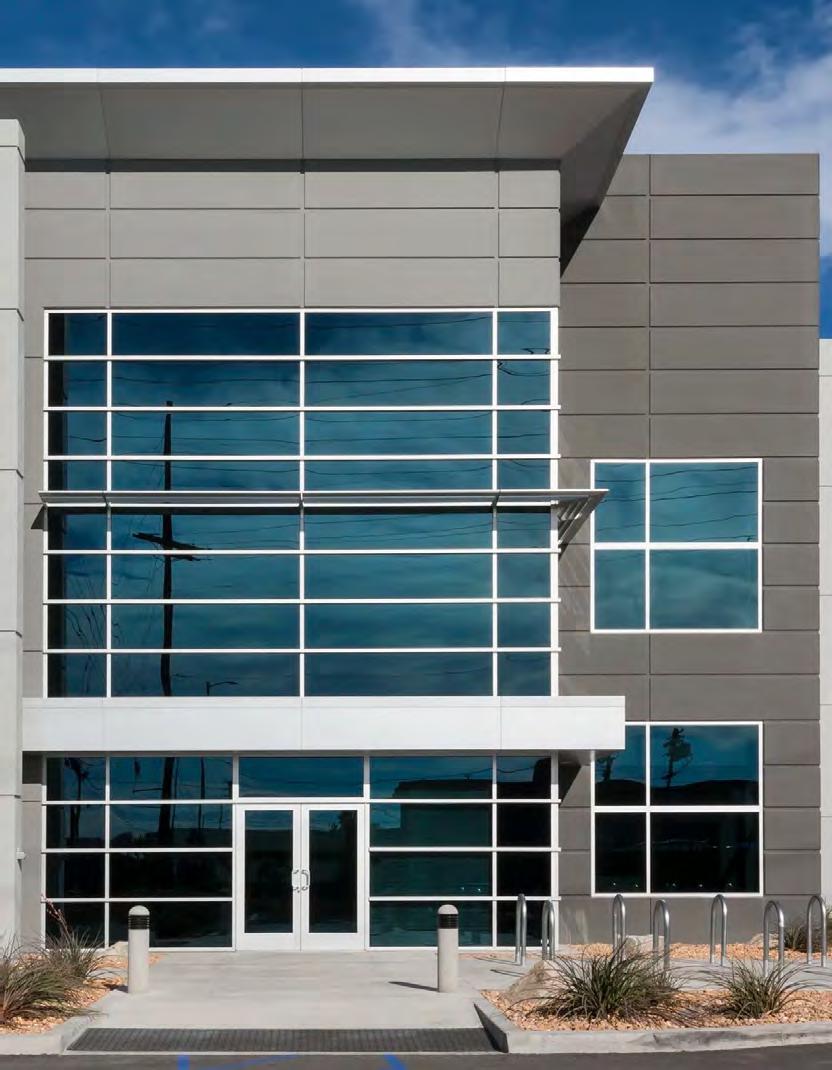
This placetype supports a variety of processing, production, and manufacturing uses. Unlike the Flex Industrial and the Innovation Districts, General Industrial includes light manufacturing, heavy industrial production, and outside storage. This district’s location should be limited and heavily buffered from any adjacent residential area to avoid negative impacts on residents.
1. Development is encouraged in areas with easy access to major transportation routes that can support truck traffic. Trucks should be diverted from local roads and residential areas.
2. Uses producing noise, dust, vibration, or other nuisances should be buffered from less intense uses; large setbacks, dense landscaping, soundwalls, and other industry best practices should apply.
3. Parking and service areas, such as loading bays and waste disposal, should be located behind buildings and screened with evergreen trees and shrubs, attractive fences, and/or vegetative berms.
4. Passenger vehicle traffic should be separated from truck traffic for efficient circulation.
5. Uses with high electricity and/or water consumption should mitigate impacts. Renewable energy components are encouraged in building design and site features, such as geothermal systems, rooftop solar panels, solar panels on parking shade structures, or small wind turbines. High efficiency fixtures and appliances and greywater reuse for non-potable applications (cooling, landscape irrigation) are encouraged.
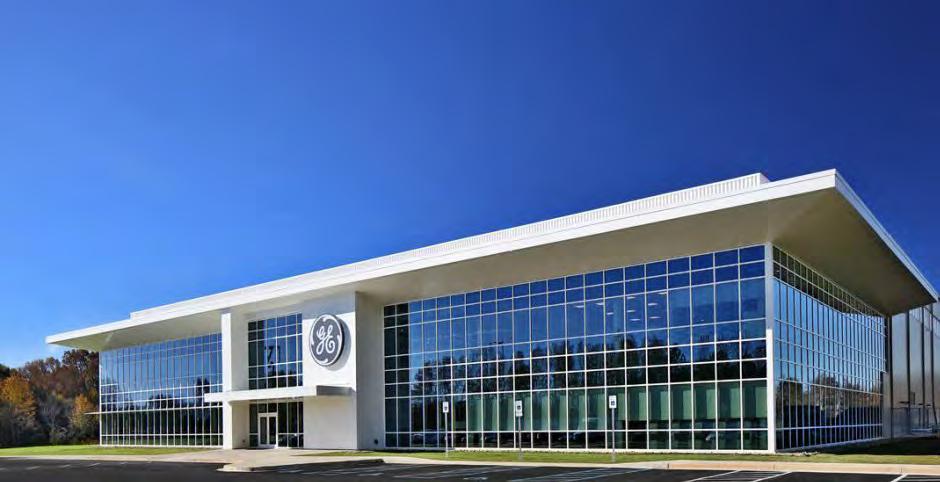
Street Network
The movement of people, goods, and/or services through and within the placetype, including travel between this placetype and surrounding placetypes.
• New streets throughout General Industrial developments should generally follow grid patterns; where a traditional grid is too rigid for large scale developments, radial or curvilinear grids should be used.
• Cul-de-sacs should be avoided anywhere trucks need to maneuver.
• General Industrial areas should be located along major roadways.
• Entrances to General Industrial campuses should have dedicated turn lanes and signalized intersections if warranted by anticipated traffic counts.
• If roundabouts are used, they should be large enough to accommodate semi-trucks.
• Two-way traffic is preferred. Sites’ internal circulation (parking areas, loading areas) may be one-way.
• Intersections should have stop signs or roundabouts. Roll curbs should be used for easy truck maneuvering.
• Traffic and wayfinding signage should be highly visible. Truck entrances should be identified.
Significant Streets
Speed and Capacity
Bicycle and Pedestrian/ Micromobility
• SR 38 (Sheridan Road), US 31, N East St., US 32 (176th St), Mule Barn Road
• Mule Barn Road does not have the capacity for large developments. Improvements need to be made to accommodate increased traffic.
• Sidewalks should be added along all road frontages where they do not exist, and sidewalks should connect to building entrances.
• Parking areas should include clearly marked paths for pedestrians.
• All principal buildings should have on-site bicycle racks or indoor bike storage.
• Bike lanes or multi-use paths are encouraged to connect General Industrial sites to neighborhoods.
The appearance and design of streets within the placetype, especially elements that enhance the experience of the public atmosphere. The character of buildings and amenities that do not sit directly in the right-of-way are discussed in later sections.
• Streets used by semi-trucks and commercial vehicles should be built with durable materials to withstand heavy vehicle weights and have larger turn radius for large vehicles to maneuver.
• Employee/passenger vehicle areas may use narrower street widths and smaller turn radius as appropriate.
Character
• Utilize on-site landscaping and parking lot design to screen parking and service areas to create an inviting pedestrian environment.
• Parking for large commercial trucks should be located toward the rear or side of buildings when possible and should not abut residential areas.
• Future decisions regarding parking and drive-aisle paving materials should take into consideration both storm water and airquality considerations.
Street Character (continued)
• When located on arterials or edge areas, buildings may be set back further to accommodate enhanced landscape and open spaces to provide greater separation between street traffic and/or less intense uses.
• Orient new, commercially focused buildings toward the street with street fronting entrances that connect to sidewalks and parking for non-commercial vehicles.
• When an industrial facility includes a structure that requires increased height, the structure is located so that it does not significantly visually or physically impact nearby residential areas.
• Loading, trash service, and other back-of-building functions should not be visible from the front of the building to ensure an attractive and inviting face to the community.
• Amenities should include native species of street trees, lighting, and wayfinding.
Streetside Amenities
On-Street Parking
Block Pattern
• Benches and trashcans should be provided at intervals for comfort and cleanliness.
• None on primary streets.
• Parking on interior streets may be used where appropriate.
Characteristics of the design and layout of a property, especially in relation to surrounding properties, which include both the land and any buildings on the property.
• Typical Block Size: varies
• Typical Lot Size: varies
• Typical Building Coverage: 60% or less
• Sidewalks should always extend to building entrances.
• Driveways are preferred on the side of the building.
• Service areas should be at the building’s rear.
Access Points
Building Placement
• Locate industrial uses along truck routes designed for anticipated capacity and divert traffic away from residential neighborhoods.
• Provide direct paths for pedestrians from parking areas to primary building entrances within large development as well as to and from available transit stops.
• Building entrances should connect with sidewalks or trails.
• Building entrances should be architecturally prominent, which may be achieved by adding projections or recesses in the building’s elevations, changes in materials or color, or other methods.
• Facade plane changes for areas of a building that are used for production and/or warehousing are not required.
• Public-facing areas, such as lobbies and visitor entries, should be at the front of the building.
• Loading and service areas should be at the rear of the building.
• Building heights should be no taller than their setbacks from primary streets.
• Height exceptions can be made for special equipment or utility structures.
• Shared pylon signs that identify multiple businesses at entrances are preferred, if applicable.
• The front setback should be smaller than rear setbacks.
Setbacks/Build to
• Manufacturing uses should have at least a 300-foot setback from residential zones.
Amenities & Open Spaces
• Parking should be located to the side or rear of buildings.
• Depending on the facility, two more entrances may be required to facilitate traffic flow to and from the site.
• Truck accesses and parking areas should be separate.
• Parking structures are encouraged for campus-style developments.
• Outdoor green spaces or plazas for employees to use for recreation or dining are encouraged to enhance workplace quality. These spaces can be shared when part of campus style development.
• Street frontages should include street trees.
• Any loading or service areas should include vegetative screening.
Landscaping
• A significant buffer yard is needed between General Industrial and less intensive placetype (agrihood, estate rural, residential, etc.), except for Flex Industrial. Buffer yard should have elements like evergreen vegetative screening. Fences, walls, or berms may apply based on the site’s use.
• Due to the intensive nature of this use, mounded and landscaped buffer yards are encouraged with particular attention to the treatment of edge areas against adjacent less intensive uses.
• Encourage shared regional retention areas instead of individual on-site ponds.
• Permeable pavement is recommended for private parking lots and private streets to reduce the burden on storm sewers.
• Retention areas should use bioswales and other eco-friendly drainage methods.
• Rainwater capture or greywater for non-potable applications are highly encouraged for high water users. Examples: hydro cooling systems, landscape irrigation.
• Integrate green infrastructure such as tree boxes, permeable pavement, and green roofs to reduce urban flooding and heat island effects.
Areas within each placetype that have unique conditions for which additional considerations are recommended.
• Reinvestment should include enhancements to parking areas and streetscape, such as added landscaping, street trees, and connections to sidewalks and internal site pathways.
• With the increased buffer areas required to adjacent, less intensive uses, reforestation of these buffer areas provide an excellent opportunity to increase the tree canopy in Westfield.
Key Characteristics:
1. Buildings should cluster around shared greenspace, or other amenities for campus-style developments. Pedestrian pathways should connect buildings’ main entrances.
2. Development is encouraged in areas with easy access to major transportation routes that can support truck traffic. Trucks should be diverted from local roads and residential areas.
3. The transportation network should safely and efficiently connect commuters between Flex Industrial and their homes. A variety of transportation options should be accommodated.
4. Buildings should be adaptable and allow for multi-purpose use for a range of uses at varying scales. Architectural innovation and resilient building materials should be prioritized for longevity.
This placetype is designed to create an adaptable, dynamic, and efficient environment for clean industrial and high-tech innovation activities to support the economic growth of Westfield. The Flex Industrial placetype comprises areas that are designed for a business park or single sites for flexible industrial activities that include a mix of light industrial operations, office spaces, and sometimes retail or service functions. The design of these spaces allows for easy modifications to meet the changing needs of businesses, whether they are startups or established companies. Flex Industrial districts are strategically located near major transportation routes. These districts should be developed to integrate with surrounding neighborhoods, providing job opportunities, and fostering economic development while minimizing negative impacts, such as light pollution, on residential areas.
5. Parking and service areas, such as loading bays and waste disposal, should be located behind buildings, and screened with evergreen trees and shrubs, attractive fences, and/or vegetative berms.
6. Pedestrian and passenger vehicle traffic should be separated from truck traffic for efficient circulation.
7. Green infrastructure and renewable energy components are encouraged in building design and site features, such as rooftop solar panels, solar panels on parking shade structures, permeable pavements, and vegetative stormwater management.
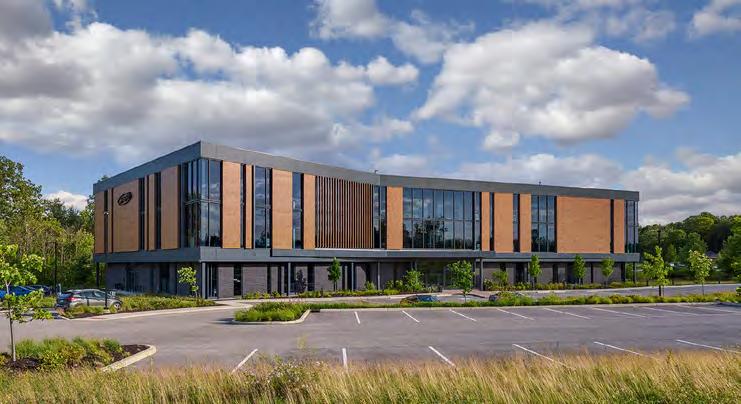
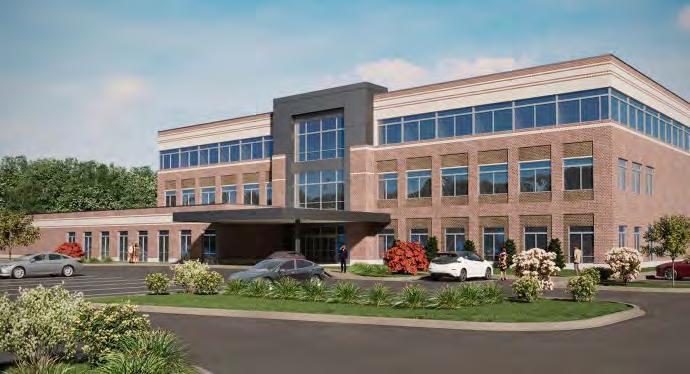
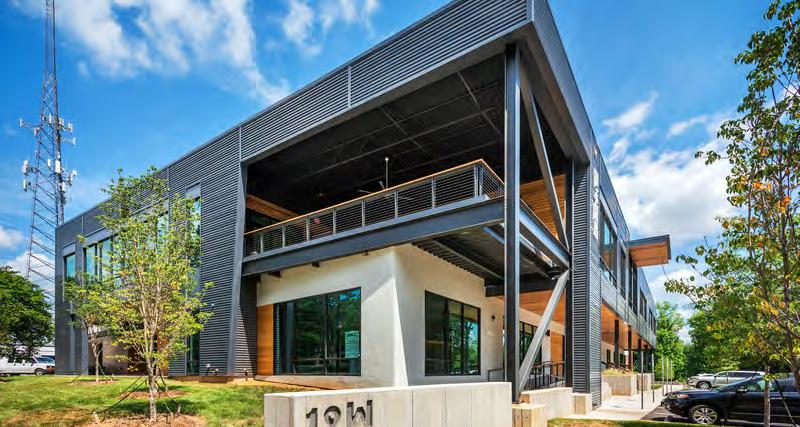
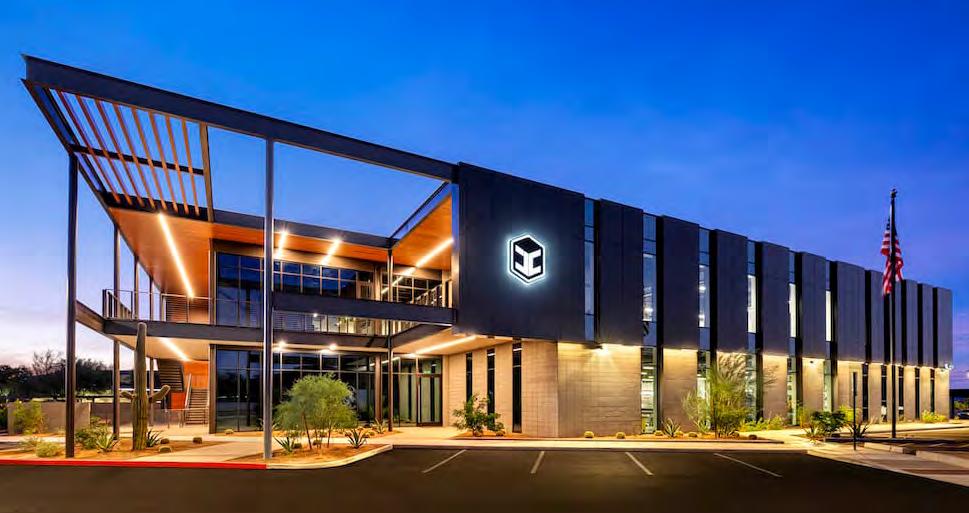
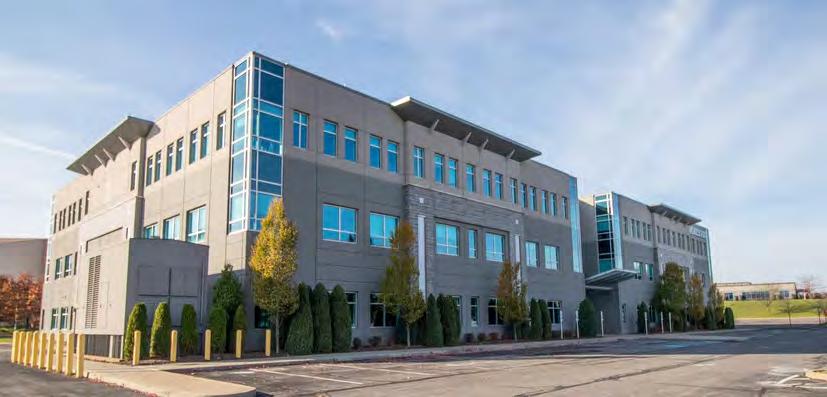
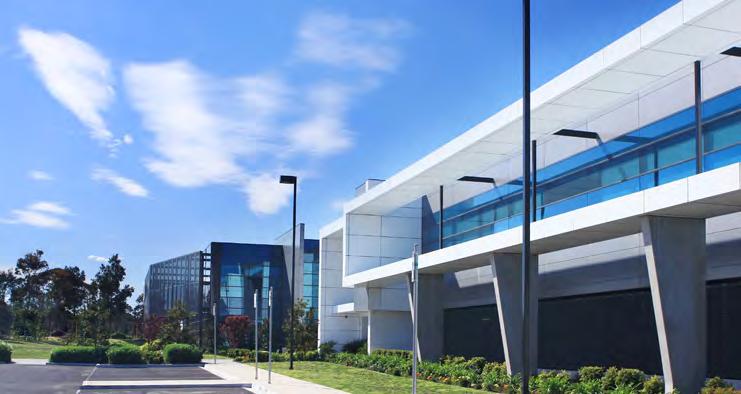
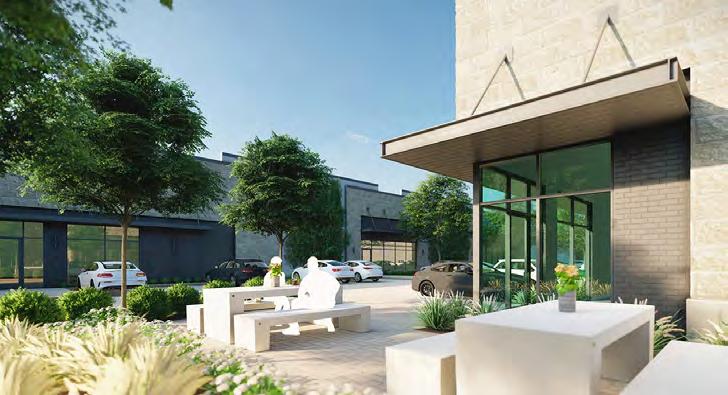
Street Network
The movement of people, goods, and/or services through and within the placetype, including travel between this placetype and surrounding placetypes.
• New streets throughout Flex Industrial developments should generally follow grid patterns; where a traditional grid is too rigid for large scale developments, radial or curvilinear grids should be used.
• Cul-de-sacs should be avoided anywhere trucks need to maneuver.
• Flex Industrial areas should be located along with arterials.
• Entrances to Flex Industrial campuses should have dedicated turn lanes and be located at controlled intersections if warranted by anticipated traffic counts.
• If roundabouts are used, they should be large enough to accommodate semi-trucks.
• Two-way traffic is preferred. Sites’ internal circulation (parking areas, loading areas) may be one-way.
• Intersections should have stop signs or roundabouts. Use roll curbs for easy truck maneuvering.
• Traffic and wayfinding signage should be highly visible and avoid obstructing views of oncoming traffic. Truck entrances should be identified.
Significant Streets
Speed and Capacity
Bicycle and Pedestrian/ Micromobility
Street Character
• SR 38 (Sheridan Rd), US 31, N East St., SR 32 (176th St), Oak Ridge Road
• SR 38 needs to be improved to accommodate truck traffic.
• Sidewalks or perimeter trails should be added along all street frontages where they do not exist, and sidewalks should connect to building entrances.
• Parking areas should include clearly marked paths for pedestrians.
• All principal buildings should have on-site bicycle racks or indoor bike storage.
• Bike lanes or multi-use paths are encouraged to connect Flex Industrial sites to neighborhoods.
The appearance and design of streets within the placetype, especially elements that enhance the experience of the public atmosphere. The character of buildings and amenities that do not sit directly in the right-of-way are discussed in later sections.
• Streets used by semi-trucks and commercial vehicles should be built with durable materials to withstand heavy vehicle weights and have larger turn radius for large vehicles to maneuver.
• Employee/passenger vehicle areas may use narrower street widths and smaller turn radius as appropriate.
• Amenities should include street trees, landscaping, lighting, and wayfinding.
Streetside Amenities
On-street Parking
• Benches and trashcans should be provided at intervals for comfort and cleanliness.
• None on arterials or collectors.
• Parking on local streets should be used where appropriate.
Characteristics of the design and layout of a property, especially in relation to surrounding properties, which include both the land and any buildings on the property.
Block Pattern
Access Points
Building Placement
Signage
Setbacks/Build to
Off-Street Parking Areas
Amenities & Open Spaces
• Typical Block Size: varies
• Typical Lot Size: varies
• Typical Building Coverage: 75% or less
• Sidewalks should always extend to building entrances.
• Driveways and loading docks are preferred on the side or back of the building. No loading dock should face residential uses.
• Service areas should be at the building’s rear and screened from adjacent development.
• Buildings should orient towards roadways and sidewalks.
• All building entrances should connect to a public sidewalk or trail.
• Each business should have their own identification sign. Ensure signage is consistent amongst a development.
• For a multi-tenant development, a shared monument sign at each entrance is encouraged that identifies multiple businesses in the development. This would be in addition to any wall or window signage for the business.
• Front setbacks from primary streets should be no more than 200-feet from the street centerline.
• Manufacturing uses should have at least a 300-foot setback from residential zones.
• Parking should be located to the side or rear of buildings.
• Only one driveway per site is preferred for parking areas.
• Truck access and parking areas should be separate.
• Outdoor green spaces or plazas for employees to use for recreation or dining are encouraged to enhance workplace quality. These spaces can be shared when part of campus style development.
• Encourage landscaped areas, especially outdoor spaces that can be used for employees and clients for recreation.
• Street frontages should include native species of street trees and ensure trees selected will have minimal impact on sidewalks, foundation, infrastructure, etc. over time.
Landscaping
Stormwater Management
• Any loading or service areas should include vegetative screening.
• Any buffer yard between Flex Industrial and a residential placetype or less intense use should have evergreen vegetative screening. Fences, walls, or berms may apply based on the site’s use.
• Encourage shared regional retention areas instead of individual on-site ponds.
• Permeable pavement is recommended for private parking lots and private streets to reduce the burden on storm sewers.
• Retention areas should use bioswales, riparian buffers, and other eco-friendly drainage methods.
Special Considerations Areas within each placetype that have unique conditions for which additional considerations are recommended.
• Buildings within the Flex Industrial placetype are expected to have a higher level of architectural design. However, façade plane changes for areas of a building that are used for production and/or warehousing are not required.
• Commercial and smaller office uses should be integrated into edge areas to transition into and provide a buffer for surrounding neighborhoods.
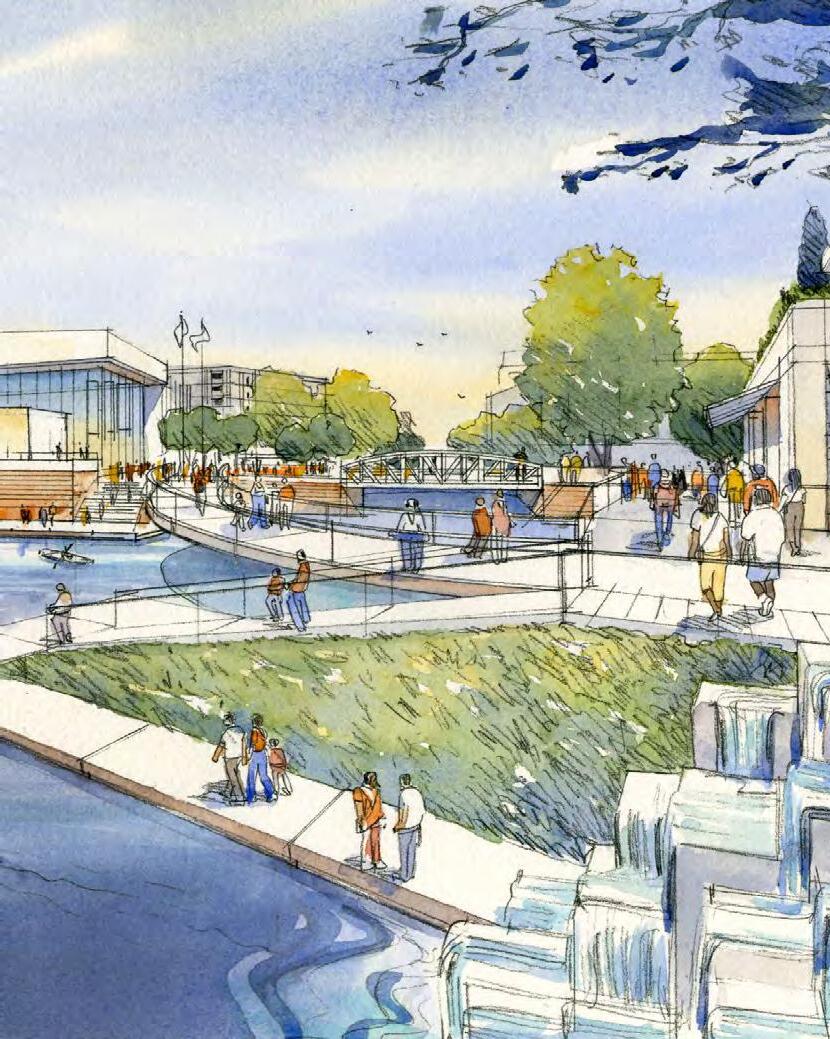
The Grand Park District expands upon the sports tourism destination and operational success of Grand Park Sports Campus supports development that is designed to be compact, mixed use, and walkable. The development is a park-once environment that frees residents and visitors from driving between different activities. This means the creation of a safe, comfortable, and engaging environment. The focus of the district is on the development of sports tech innovation and entertainment uses along with a stadium and ice rink facility that are integrated with a complete street network and a linear park. Other uses include hotels, restaurants, healthcare and sports medicine facilities, professional offices, retail uses, higher density residential uses, parking structures, and other supporting commercial uses.
1. The Grand Park District should incorporate elements of the Grand Park Sports Campus operations to connect the two placetypes.
2. The Grand Park District should be a regional destination for entertainment, retail, and hospitality that support the Grand Park Sports Campus.
3. The Grand Park District is a master planned site that prioritizes a strong pedestrian environment supported by outdoor activities and gathering spaces. Pedestrian traffic should be prioritized over vehicular traffic.
4. Site development should encourage a mix of uses that support community vibrancy, tourism, and hospitality.
5. The Grand Park District should create community gateways along primary streets.
6. The Grand Park District is governed by the Grand Park Master Plan which is incorporated into the comprehensive plan by reference. Additional standards, guidelines, or special considerations for development in the district should be reviewed and incorporated based on that master plan.

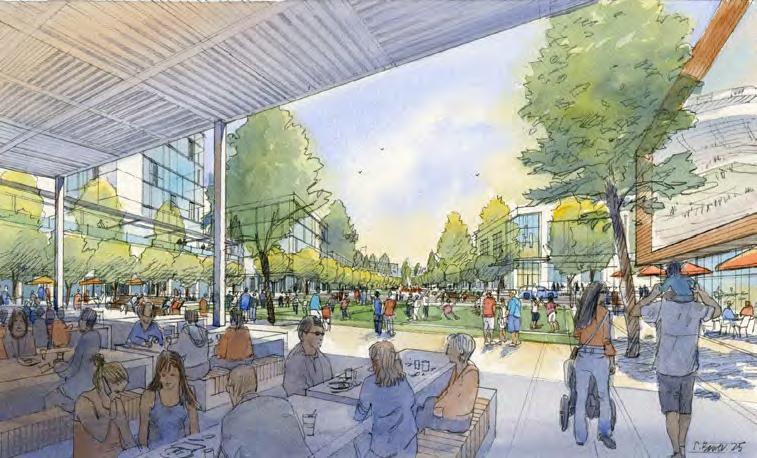
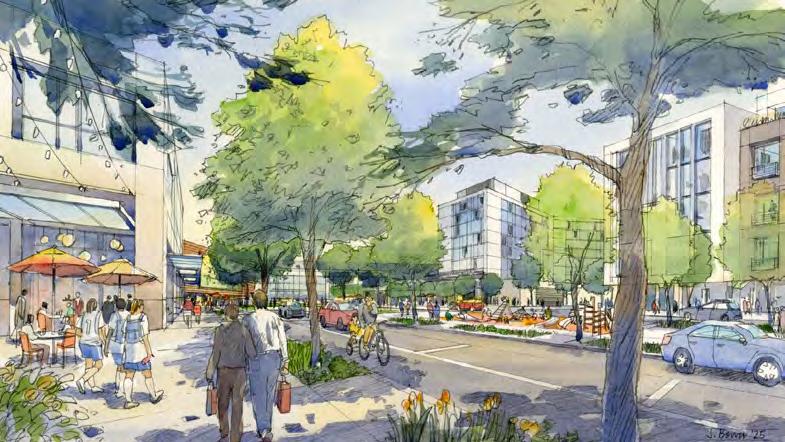
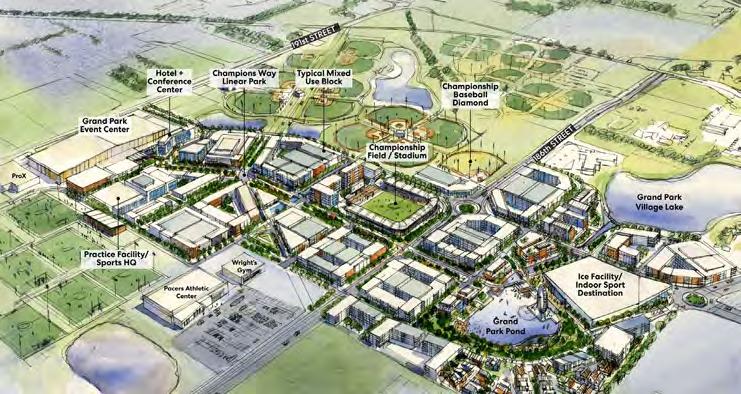

• Number of Acres Devoted to Placetype: 130 acres
• Percentage of Total Acreage of All Placetypes: 0.40%

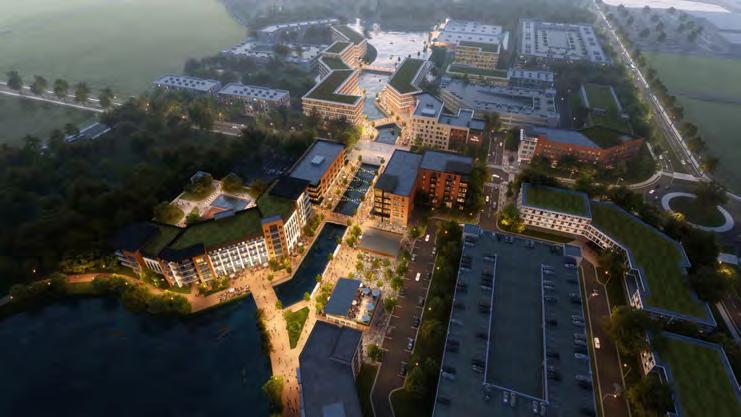
Use Development Opportunity.
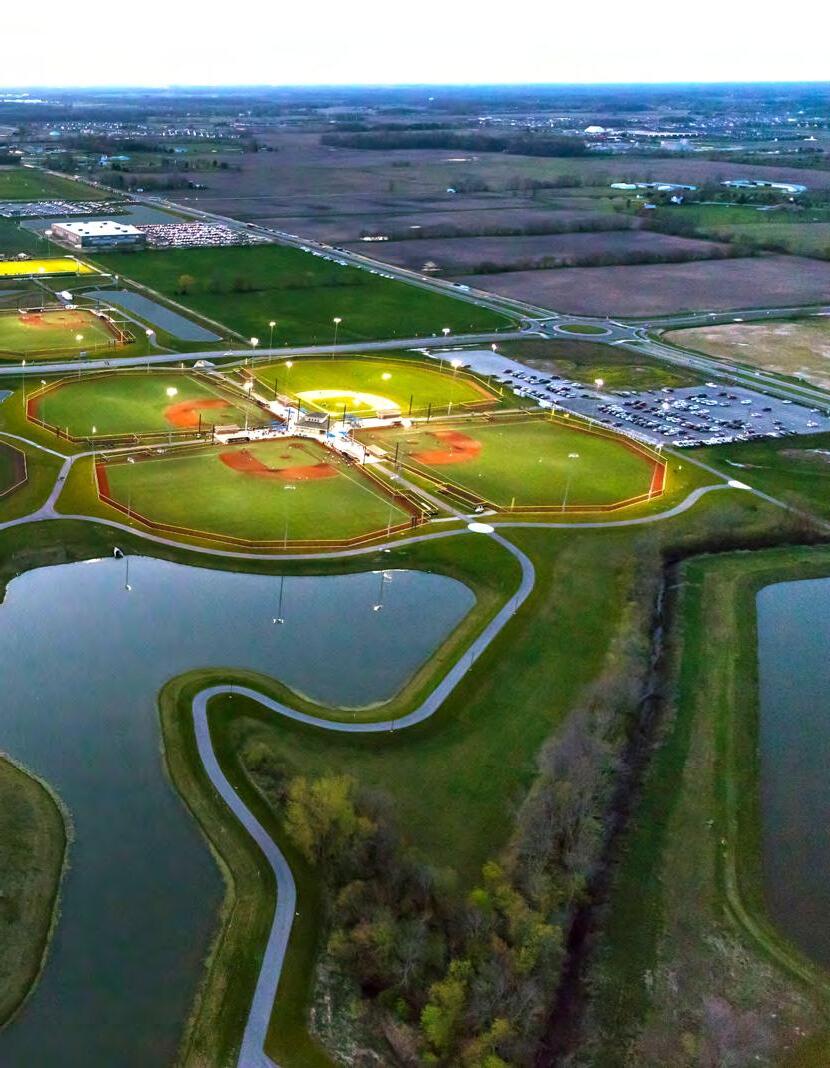
The Grand Park Sports Campus is a championship sports complex that supports Westfield and youth and family sports, but also professional and semi-professional teams. The campus hosts championship level youth and amateur sports tournaments outdoor and indoor at the event center. The complex is designed to accommodate field sports such as football, softball, soccer, lacrosse, rugby, and baseball and indoor winter sports including basketball, volleyball, gymnastics, and wrestling for year-round activation. The Grand Park Sports Campus has access to primary arterials as noted in the Westfield Thoroughfare Plan.
1. The Grand Park Sports Campus is a master planned site and national destination, focusing on recreation and entertainment, especially outdoor recreation. Development of buildings is limited.
2. Entrances to Grand Park should be built to accommodate high traffic. Additional accommodation, like traffic control and shuttle services, may be used during special events.
3. Entrances to Grand Park should include pedestrian, bicycle, and other micro mobility infrastructures to allow locals and visitors to safely access the site from neighborhoods and nearby tourist accommodations.
4. Branding and wayfinding are important features for navigating in and around Grand Park Sports Campus and should be prominently displayed.
5. Natural and environmentally friendly landscaping is encouraged in passive green spaces to provide shade and offset the environmental impact of high maintenance sport fields.

Street Network
The movement of people, goods, and/or services through and within the placetype, including travel between this placetype and surrounding placetypes.
• Intersections at perimeter streets should include turn lanes at park entrances. Signalized intersections or roundabouts are encouraged.
• Streets routing through the site should be strictly limited.
• Site circulation should be primarily bike lanes, sidewalks, and multi-use paths.
• Two-way traffic is preferred.
• High traffic intersections should have stop signs or roundabouts.
• Wayfinding signs are highly encouraged.
Significant Streets
Speed and Capacity
Bicycle and Pedestrian/ Micromobility
Street Character
Streetside Amenities
On-street Parking
Block Pattern
• 191st Street, Spring Mill Road, 186th Street, Grand Park Boulevard, Tomlinson Road
• Need to upgrade streets around Grand Park including 191st Street, Spring Mill Road and Tomlinson Road.
• Sidewalks should be added along all road frontages where they do not exist.
• Internal sidewalks should be provided throughout the development.
• All principal buildings should have on-site bicycle racks or indoor bike storage.
• Bike lanes or multi-use paths are encouraged.
The appearance and design of streets within the placetype, especially elements that enhance the experience of the public atmosphere. The character of buildings and amenities that do not sit directly in the right-of-way are discussed in later sections.
• Multi-modal streets are highly encouraged.
• Bike lanes and other bike infrastructure should be provided along roadways.
• Amenities should include street trees, lighting, and wayfinding.
• Benches and trashcans should be provided at intervals for comfort and cleanliness.
• On-street parking is permitted in designated areas.
Characteristics of the design and layout of a property, especially in relation to surrounding properties, which include both the land and any buildings on the property.
• Typical Block Size: N/A
• Typical Lot Size: N/A
• Typical Building Coverage: N/A
• Sidewalks should be on all frontages and always extend to building entrances.
Access Points
• Entrances for parking areas should include turn lanes.
• High traffic intersections should have roundabouts or traffic signals to avoid backups.
Building Placement/ Character
Setbacks/Build to
Off-Street Parking Areas
Amenities & Open Spaces
Landscaping
• Buildings are limited.
• Building heights should be limited to less than 50-feet near residential areas.
• Buildings should be located around the perimeter of the site, except for the concession stands.
• Building entrances should be architecturally prominent, which may be achieved by adding projections or recesses in the building’s elevations, changes in materials or color, or other methods.
• N/A
• Parking areas should be located along perimeters of the sports fields.
• Parking garages are encouraged.
• Non-vehicle parking is encouraged by trails and bike lane users.
• Integrate public art or interactive elements into the overall sports campus.
• Street frontages should include street trees and landscaping.
• Green infrastructure and native landscaping are encouraged to offset the impacts of maintaining sports fields.
• Any loading or service areas should include vegetative screening.
• Tall tree species are encouraged to provide shade and block sport field lighting from surrounding residential areas.
• Encourage shared regional retention areas instead of individual on-site ponds.
Stormwater Management
• Permeable pavement is recommended to reduce the burden on storm sewers.
• Retention areas should use bioswales and other eco-friendly drainage methods.
• Uses shared detention for field irrigation.
Special Considerations Areas within each placetype that have unique conditions for which additional considerations are recommended.
• Commercial uses should generally support uses for Grand Park, such as concessions and small-scale shops.
• Consult the Grand Park Master Plan for more detailed standards.
• In accordance with Grand Park Master Plan, replace some surface parking with structured parking garages to encourage walkability between Grand Park Sports Campus and the Grand Park District.
• The Grand Park Sports Campus is governed by a Master Plan Study which is incorporated into the comprehensive plan by reference. Additionally, standards, guidelines, or special consideration for development in the campus should be reviewed and incorporated based on that master plan.
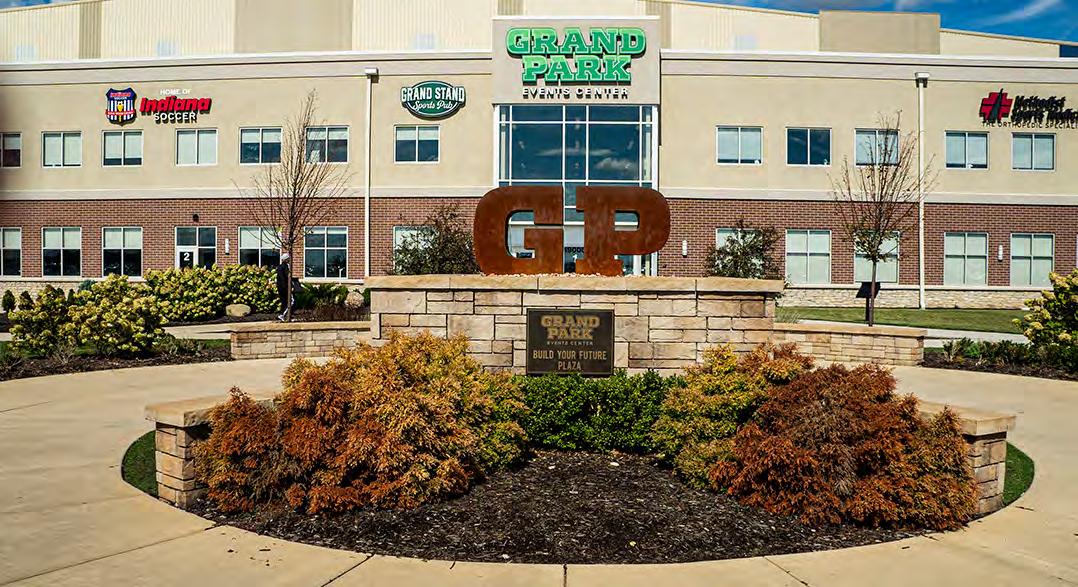
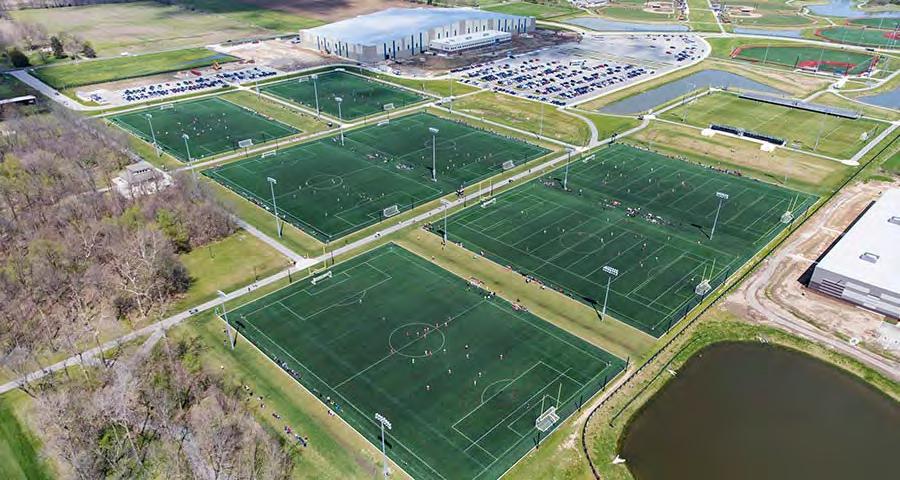
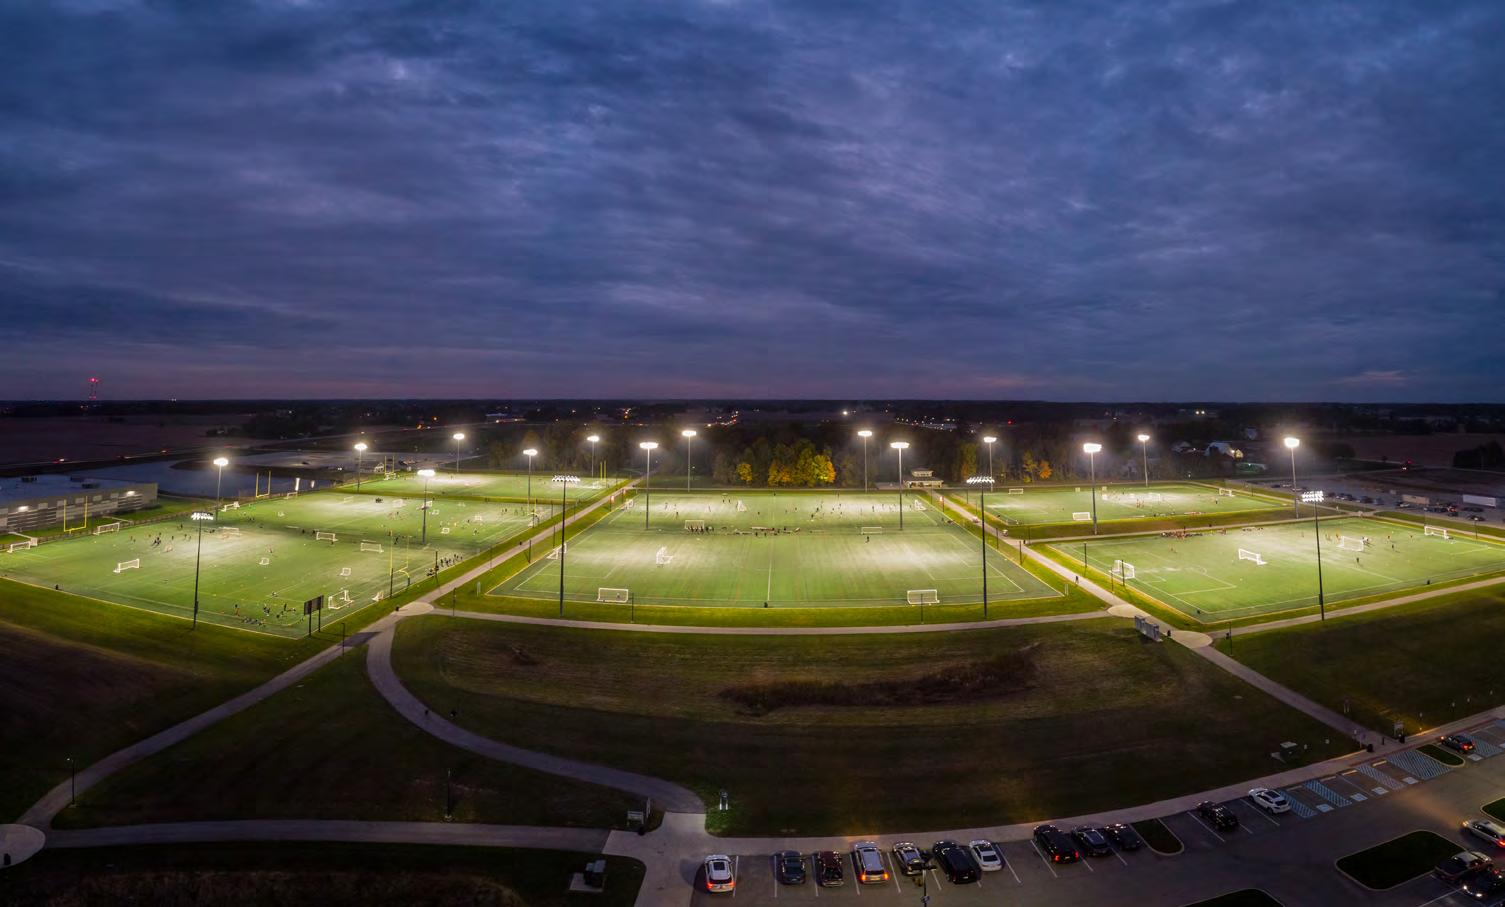
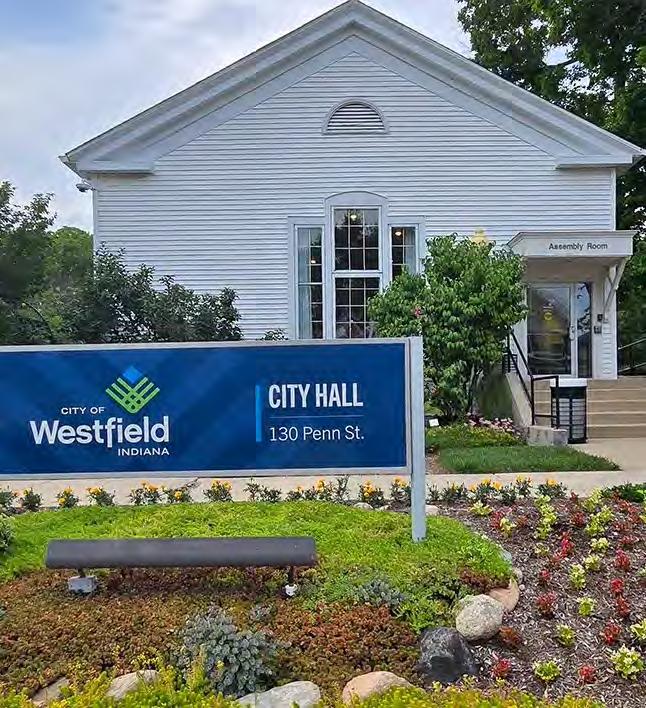
The Community Institutional placetype includes a wide range of public and private uses such as public and private schools, athletic complexes, public recreational facilities, places of worship, civic facilities, police/fire/EMS services, libraries, public golf courses, and large public open spaces.
1. Community institutions are social resources that support the community’s identity and culture.
2. Community institutions provide spaces for public interactions and shared activities to foster social cohesion.
3. Buildings have high quality architecture and design elements that serve as landmarks for the city.
4. Sites are easily accessible by all forms of transportation.
Street Network
Commercial Vehicles
Bicycles and Pedestrians
Golf Carts
On-Street Parking
Speed and Capacity
Block & Lot Patterns
The appearance and design of streets within the placetype, especially elements that enhance the experience of the public atmosphere. The character of buildings and amenities that do not sit directly in the right-of-way are discussed in later sections.
• Community institutions should be in areas with high connectivity ideally on primary arterials and grid networks.
• Commercial vehicles should be directed to the rear of buildings.
• Dedicated bike lanes are recommended. Bike racks should be provided close to entrances.
• Sidewalks should be over 5-feet wide to accommodate high pedestrian traffic.
• Walkways or shared paths should connect to local and regional trails.
• Golf carts may serve as alternative form of transportation.
• Golf carts may use the same space as passenger vehicles.
• On-street parking is permitted for appropriate street types.
• Metered parking may help to prevent long-term parking in front of high traffic destinations.
• Improve streets with bike lanes and wide sidewalks to promote multi-modal transportation.
• Use traffic calming tools at intersections and crosswalks to protect pedestrians and bicyclists.
• Roundabouts or traffic signals are recommended for high traffic uses.
Characteristics of the design and layout of a property, especially in relation to surrounding properties, which include both the land and any buildings on the property.
• Typical Block Size: 400 - 800
• Typical Lot Size: 2500 sq feet
• Typical Building Coverage: 60% or less
• Sidewalks should connect all entrances to the street.
Access Points
Building Placement/ Character
Setbacks/Built to
Off-Street Parking Areas
Amenities & Open Spaces
• All street frontages should have sidewalks.
• Entrances should face the public street.
• Building heights may be up to 3 stories; taller buildings may be permitted in high-density areas.
• Setbacks should generally meet the established setbacks.
• Setbacks may be determined by context sensitive factors such as topography, use, etc.
• Parking areas should be behind or beside buildings.
• Parking may be off-site for urban areas.
• Playgrounds, green spaces, and other outdoor recreational areas are encouraged.
Landscaping
• Parking should be screened with landscaping and/or fences.
• Landscaping is encouraged to use existing topography and unique features to promote a sense of identity.
• Sites should connect to the storm sewer system or provide on-site retention/detention.
• Landscapes for stormwater management and environmental sustainability are highly encouraged.
• Landscaping should have dense vegetation wherever possible and increase the urban tree canopy. Stormwater Management
Special Considerations Areas within each placetype that have unique conditions for which additional considerations are recommended.
• None
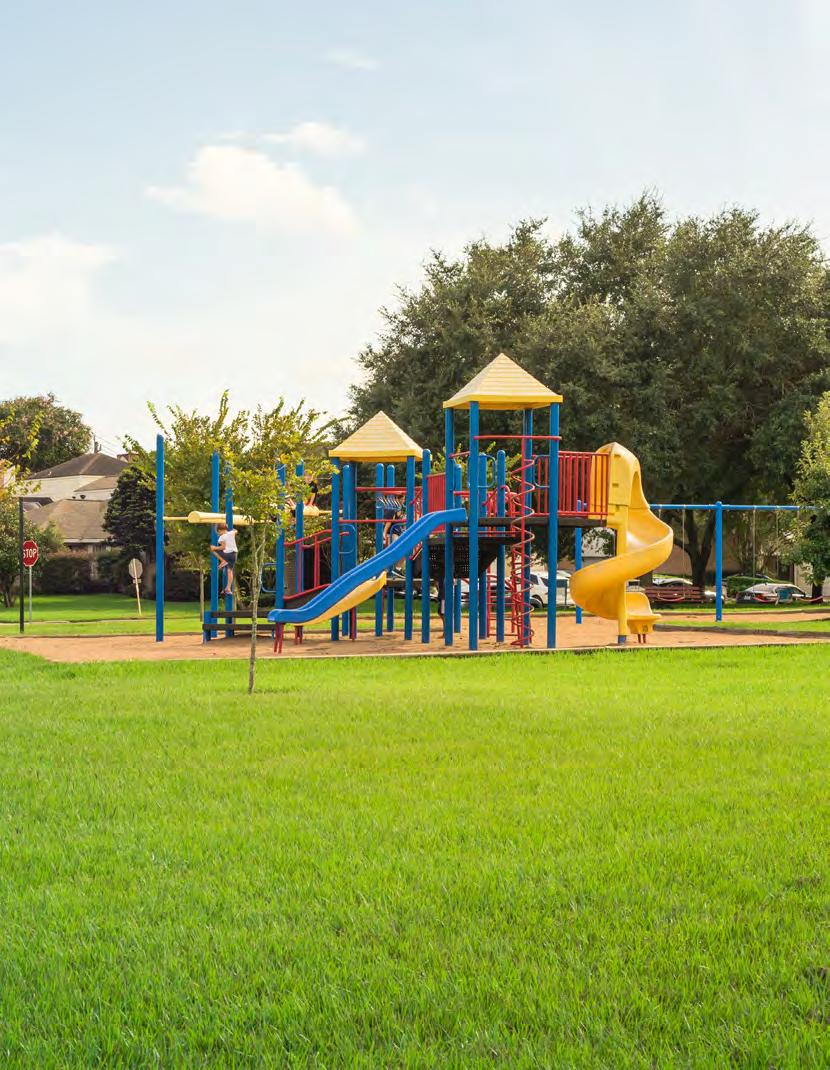
Natural Areas and Open Space have little or no development within them. These areas are designated for major public open space preservation, greenways, floodplain, community and linear parks, and trails. These third spaces are intended to retain their character to provide a respite from everyday life and recreation and leisure opportunities. The Natural Areas and Open Space placetype should be accessible from neighborhoods and not require a vehicle to access. The uses in this placetype are often used as buffers between more intense uses.
1. This placetype preserves the natural environment and holds the city’s undevelopable land.
2. Natural areas and open spaces provide habitats for plants and animals and preserve natural resources like water and air quality.
3. Development is strictly limited.
4. This placetype may incorporate low impact recreational amenities, such as trails and picnic shelters.
5. Natural areas should provide a high level of connectivity to walking and biking paths but strictly limit vehicle traffic.
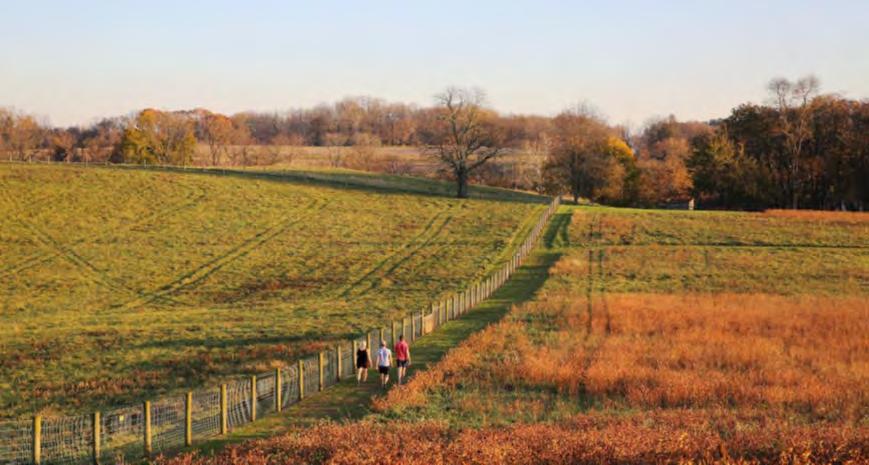
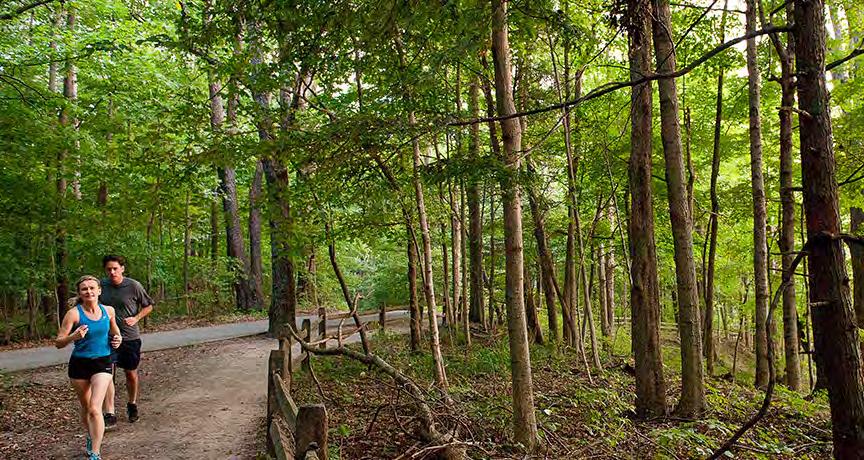
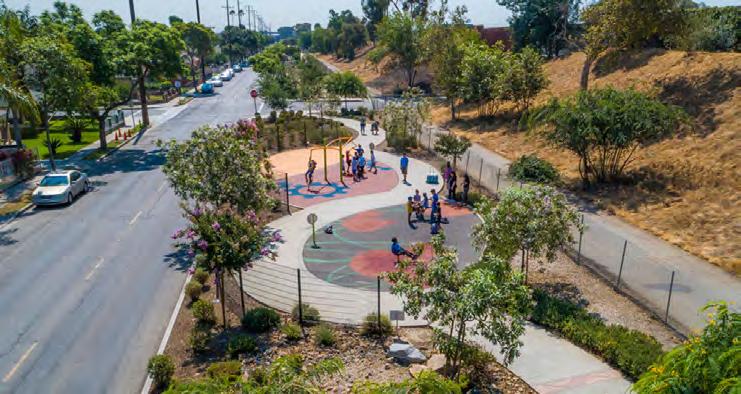
Figure 4.155: Parks, Conservation, and Open Space Placetype Characteristics.
Street Network
Commercial Vehicles
Bicycles and Pedestrians
Golf Carts
On-Street Parking
Speed and Capacity
Block & Lot Patterns
Access Points
Building Placement/ Character
Setbacks/Built to
Off-Street Parking Areas
Amenities & Open Spaces
Landscaping
Stormwater Management
The appearance and design of streets within the placetype, especially elements that enhance the experience of the public atmosphere. The character of buildings and amenities that do not sit directly in the right-of-way are discussed in later sections.
• Street and vehicle connections are discouraged.
• Commercial vehicles are prohibited.
• Walking and biking trails should connect natural areas to residential neighborhoods and other nearby developments.
• Golf carts are prohibited unless stated otherwise.
• On-street parking may be permitted on local streets provided there is adequate right-of-way width.
• Streets should be limited to the outer edges of this placetype. Internal circulation should be primarily for walking or biking.
Characteristics of the design and layout of a property, especially in relation to surrounding properties, which include both the land and any buildings on the property.
• Typical Block Size: varies
• Typical Lot Size: minimum: none
• Typical Building Coverage: N/A
• Trails or pedestrian pathways should be primary site access.
• N/A
• N/A
• Small parking areas may be provided along roadways.
• Larger parking areas should be on a site’s perimeter or primary entrance to avoid disturbing the natural environment.
• Maintain open space in the front of a building to preserve a feeling of openness.
• Playgrounds, green spaces, and other outdoor recreational areas are encouraged for supporting civic and institutional uses.
• Retain existing landscaping. Invasive species may be removed.
• Encourage native plantings and reforestation.
• Natural wetlands, floodplains, ditches, or other topography features should remain in their original/natural state.
• If site drainage interventions are required, they should mimic natural landscapes and use sustainable practices to keep water on-site as much as possible.
• None
Areas within each placetype that have unique conditions for which additional considerations are recommended.
As Westfield experiences rapid growth and evolving mobility needs, the Thoroughfare Plan serves as a long-term roadmap to create a safe, efficient, and resilient multimodal transportation system. Developed in tandem with the Westfield Comprehensive Plan, this document ensures that infrastructure investments align with land use, economic development, and housing strategies.
The Plan marks a strategic shift from a purely auto-oriented network to one that prioritizes modernization, reduces reliance on automobiles, and expands access to walking, bicycling, and transit. The goal of the Thoroughfare Plan is to create a connected network that supports the City’s prosperity while enhancing the quality of life for residents of all ages and abilities.
Westfield’s current network is anchored by regional backbones such as US 31, SR 32, and 146th Street, which facilitate high-volume movement but sever local connectivity.
Current Status: The city remains primarily auto oriented. While many segments currently operate at acceptable levels, traffic projections for 2050 indicate significantly increased congestion (Level of Service D or E) along major arterials if no action is taken.
Safety: Between 2019 and 2023, the city averaged 41 fatal or incapacitating crashes per year. The Plan prioritizes safety interventions, such as roundabouts and geometric improvements, to reduce crash severity.
This Plan introduces an approach to roadway design that utilizes two complementary classification systems:
This traditional framework categorizes roads based on their priority between mobility (speed/throughput) and access (connectivity). The Plan updates the 2013 classifications:
• Primary Arterials: (e.g., Highways) High mobility, limited access.
• Secondary Arterials: Balance of mobility and access.
• Collectors: Connect neighborhoods to arterials.
• Local Roads: Direct property access.
New to this Plan, Street Types ensure roadways reflect the character of the surrounding land use (Placetypes). This context-sensitive approach dictates the look and feel of the street including lane width, lighting, and pedestrian facilities. The five Street Types are:
• Regional Boulevard: High volume, multimodal support.
• Crosstown Avenue: Connects neighborhoods to commerce; strong bike/pedestrian focus.
• Mixed Use/Low Density Commercial Connector: Supports retail/office areas with slower speeds.
• Neighborhood Avenue: Residential focus, traffic calming, pedestrian-scale lighting.
• Agricultural/Industrial: Freight-focused, wide lanes, minimal pedestrian infrastructure.
The Plan places a heavy emphasis on closing gaps in the pedestrian and bicycle network to leverage assets like the Monon and Midland Trace Trails.
Trail Gaps: A detailed analysis identifies Immediate, Secondary, and Future priority gaps to be filled through capital projects and development requirements.
Alternative Mobility: The Plan incorporates forward-looking mobility options, including potential circulator shuttles (connecting Grand Park and Downtown), bike-share programs, and the integration of golf carts on designated low-speed streets and crossings.
To realize this vision, the Plan establishes clear Right-of-Way (ROW) standards to be secured during the development process (150’ for Primary Arterials, 120’ for Secondary, 100’ for Collectors), which are consistent with current practice and remain appropriate for guiding future development.
The implementation strategy focuses on four key objectives:
1. Modernize the Street Network: Right-sizing roadways and expanding the grid to include more east-west connections.
2. Establish Design Standards: Utilizing roundabouts, traffic calming, and dark-sky lighting to enhance safety and aesthetics.
3. Comprehensive Trail Expansion: Updating the trails master plan and funding missing segments.
4. Public Transportation: Exploring shuttle feasibility and regional transit partnerships.
By adhering to these guidelines, Westfield aims to build a transportation network that not only moves traffic but also defines the public realm, fosters community connection, and supports sustainable growth.
A safe, efficient, and resilient multimodal transportation system is essential to Westfield’s continued success as a growing and vibrant community. The way people travel influences how neighborhoods develop, where businesses invest, and how residents experience access to jobs, schools, parks, and essential services. The transportation system is more than a network of streets and intersections. It is a defining element of the public realm that affects quality of life, economic competitiveness, and community identity.
Westfield’s Thoroughfare Plan provides a long-term vision for how the transportation network will evolve in response to rapid growth and changing mobility needs. The Plan establishes a functional classification system for roadways that aligns each corridor’s purpose with its surrounding land use context. It also outlines design standards and right-of-way needs that will guide future construction and improvements. Through this coordinated approach, the Plan ensures that infrastructure investments contribute to a modern, accessible, and safe network for residents, visitors, and businesses.
This update was developed in tandem with the Westfield Comprehensive Plan to ensure both documents reinforce one another. The two plans are designed to work as a unified framework for growth by aligning land use, housing, economic development, and transportation strategies so that future decisions are coordinated and mutually supportive. The Thoroughfare Plan provides the mobility foundation that enables the Comprehensive Plan’s vision to be realized, while the Comprehensive Plan provides the land use context that guides transportation priorities.
The purpose of this Plan is to support a transportation strategy that prioritizes modernization of the street network while expanding access to multiple travel options. The City of Westfield intends to support alternate modes by creating environments where walking, bicycling, and transit are convenient and comfortable choices. The transportation system must support higher density housing types and mixed use development patterns that integrate daily needs within proximity. Providing a connected network of facilities for people of all ages and abilities is central to this strategy.
This Plan will strengthen public and private decision-making. It establishes consistent expectations for right-of-way dedication and roadway design through the development review process. It informs coordination with nearby communities, state agencies, and the Indianapolis Metropolitan Planning Organization (IMPO), whose participation is essential in securing state and federal transportation funding. Ultimately, the Plan supports long-term prosperity by ensuring transportation investments meet community goals and respond to future growth.
Each roadway in Westfield serves a distinct role, from moving people and goods through the city, to providing access to neighborhoods, schools, jobs, and other destinations. The network is anchored by three state highways and a major county arterial that forms the backbone of regional and local mobility.
US 31 is the most heavily traveled corridor in the city, functioning as a limited-access highway that provides fast, reliable north–south travel between Indianapolis and northern Indiana communities. Additional, local north–south travel relies on a grid of parallel corridors: Towne Road, Spring Mill Road, Ditch Road, Oak Ridge Road, Union Street, Carey Road, and Gray Road. While these routes offer several options south of SR 32, gaps and jogs north of SR 32 still affect network continuity and remain priorities for future improvements.
East–west travel is primarily carried by SR 32 and 146th Street. SR 32 connects Westfield with neighboring Lebanon and Noblesville and has received targeted improvements to handle growing traffic. 146th Street is a four-lane divided arterial supporting cross-county travel between US 31 and I-69 while also serving major destinations within the city. SR 38 provides additional regional access along the northeast side of the planning area. Local east–west options are more limited. Only SR 32 and 146th Street provide continuous crossings; streets such as 151st, 156th, 161st, and 166th serve as important connectors but vary in capacity and continuity.
Roadways are categorized by functional classification, which indicates whether their primary role is mobility (moving people efficiently) or access (connecting to destinations). Most roads provide a mix of both, but classification identifies their dominant purpose.
Westfield’s Thoroughfare Plan, adopted in 2007 and last amended in 2013, identifies the following roadway types, from highest to lowest function:
• Primary Arterial
• Secondary Arterial
• Collector
• Local
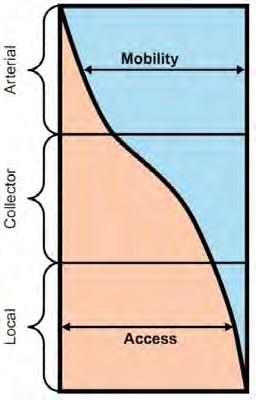
Further descriptions of these classifications can be found later in this chapter. A map of Westfield’s 2013 Thoroughfare Plan is shown on the following page followed by a map of roadway ownership within the City of Westfield.
Proposed
Realignment Areas
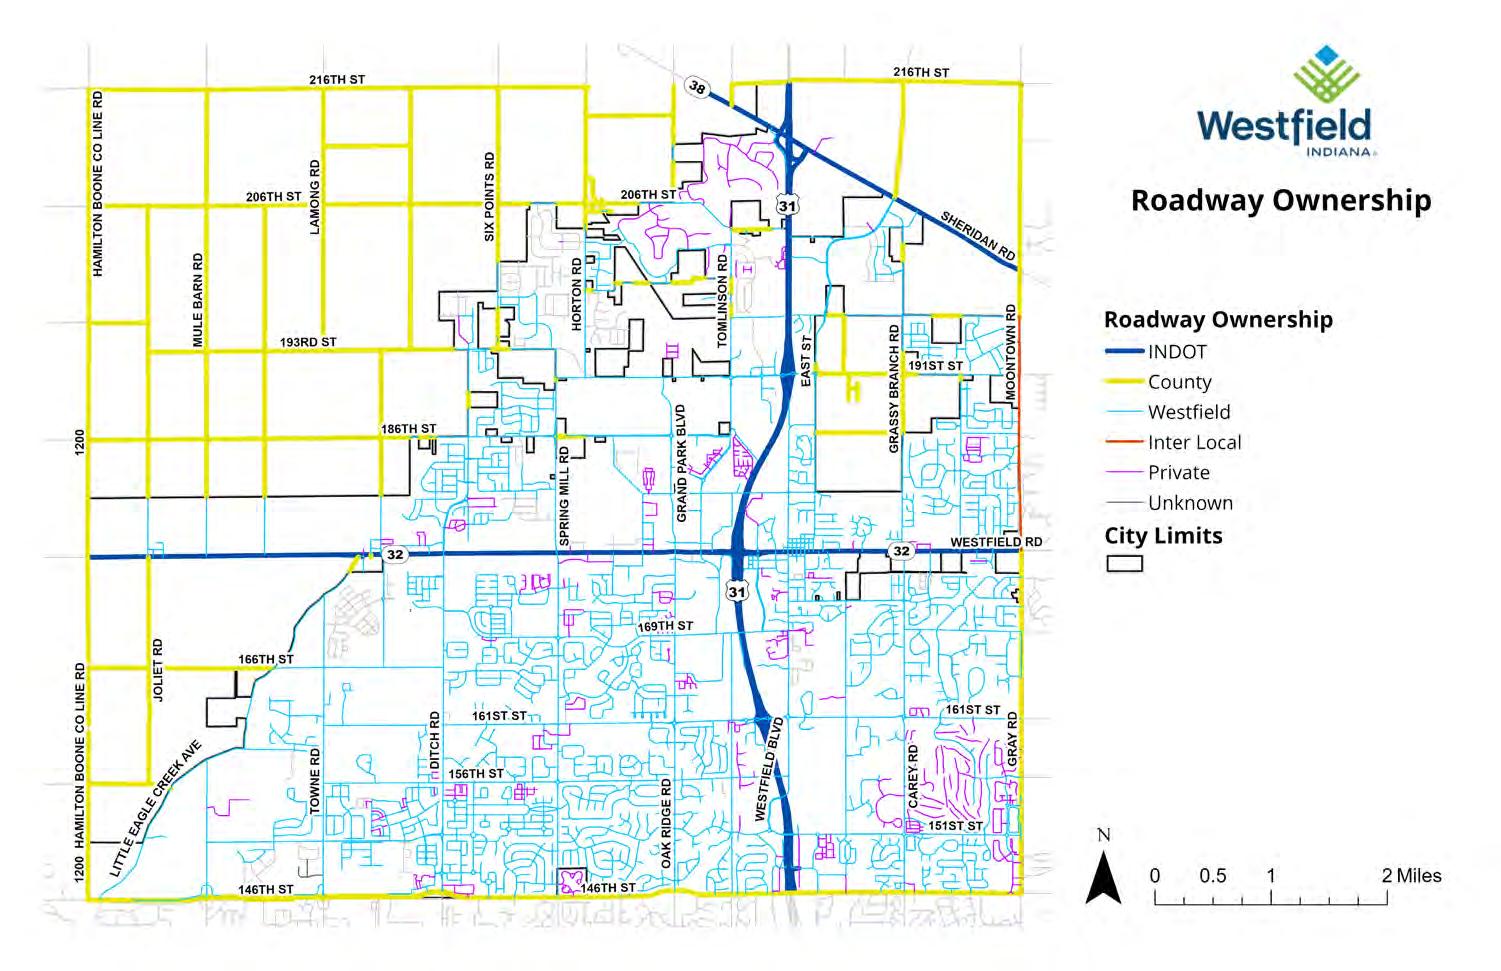
Westfield is primarily an auto-oriented community, with most travel occurring by personal vehicle. Understanding the traffic volumes on major roads helps illustrate travel patterns, roadway capacity, and implications for future improvements.
INDOT and local agencies measure traffic using Annual Average Daily Traffic (AADT), the average number of vehicles passing a point each day. These counts help determine a roadway’s importance, evaluate level of service, track changes over time, project future volumes, and assess capacity for right sizing or reconfigurations to better support all modes.
According to 2022 INDOT data, US 31 near 161st Street carries the highest volume in Westfield with an AADT of 74,702. State Road 32 between Oak Ridge Road and US 31 is the only other roadway above 25,000 AADT, at 27,425. Elsewhere along SR 32, AADT ranges from about 14,000 to 23,500.
E 146th Street carries the next highest volumes, with 22,427 vehicles near US 31 and just under 12,000 near the City’s western edge.
US 31 and SR 32 are owned and operated by INDOT, and 146th Street by Hamilton County. As principal or minor arterials are not owned by the city, Westfield has limited control over traffic volumes on these corridors. The Traffic Volume Map on the following page shows 2022 AADT volumes from INDOT.
Similar to AADT, the Annual Average Daily Truck Traffic (AADTT) identifies the average volume of truck traffic for a one day (24-hour period) during a data reporting year. US 31 carries the highest truck traffic in Westfield, followed by 146th Street and State Road 32.
The National Network supports interstate commerce by regulating the size of trucks on its routes. National Network routes in the City of Westfield are shown to the right. US 31 and State Road 32 are both part of the National Network, shown below.
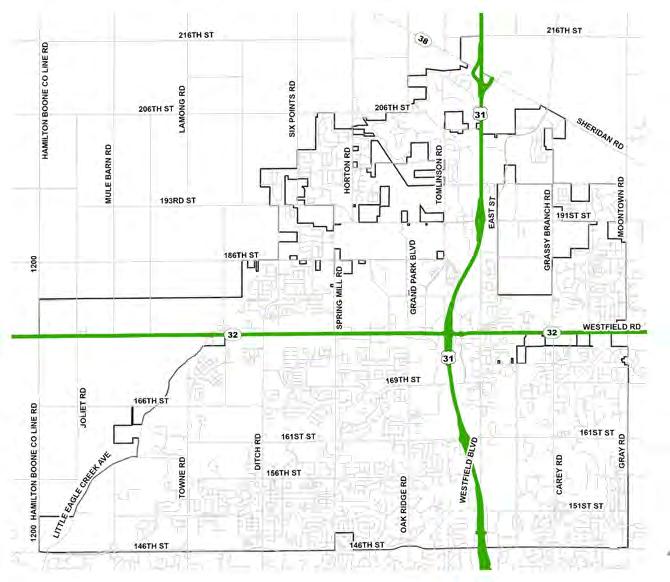

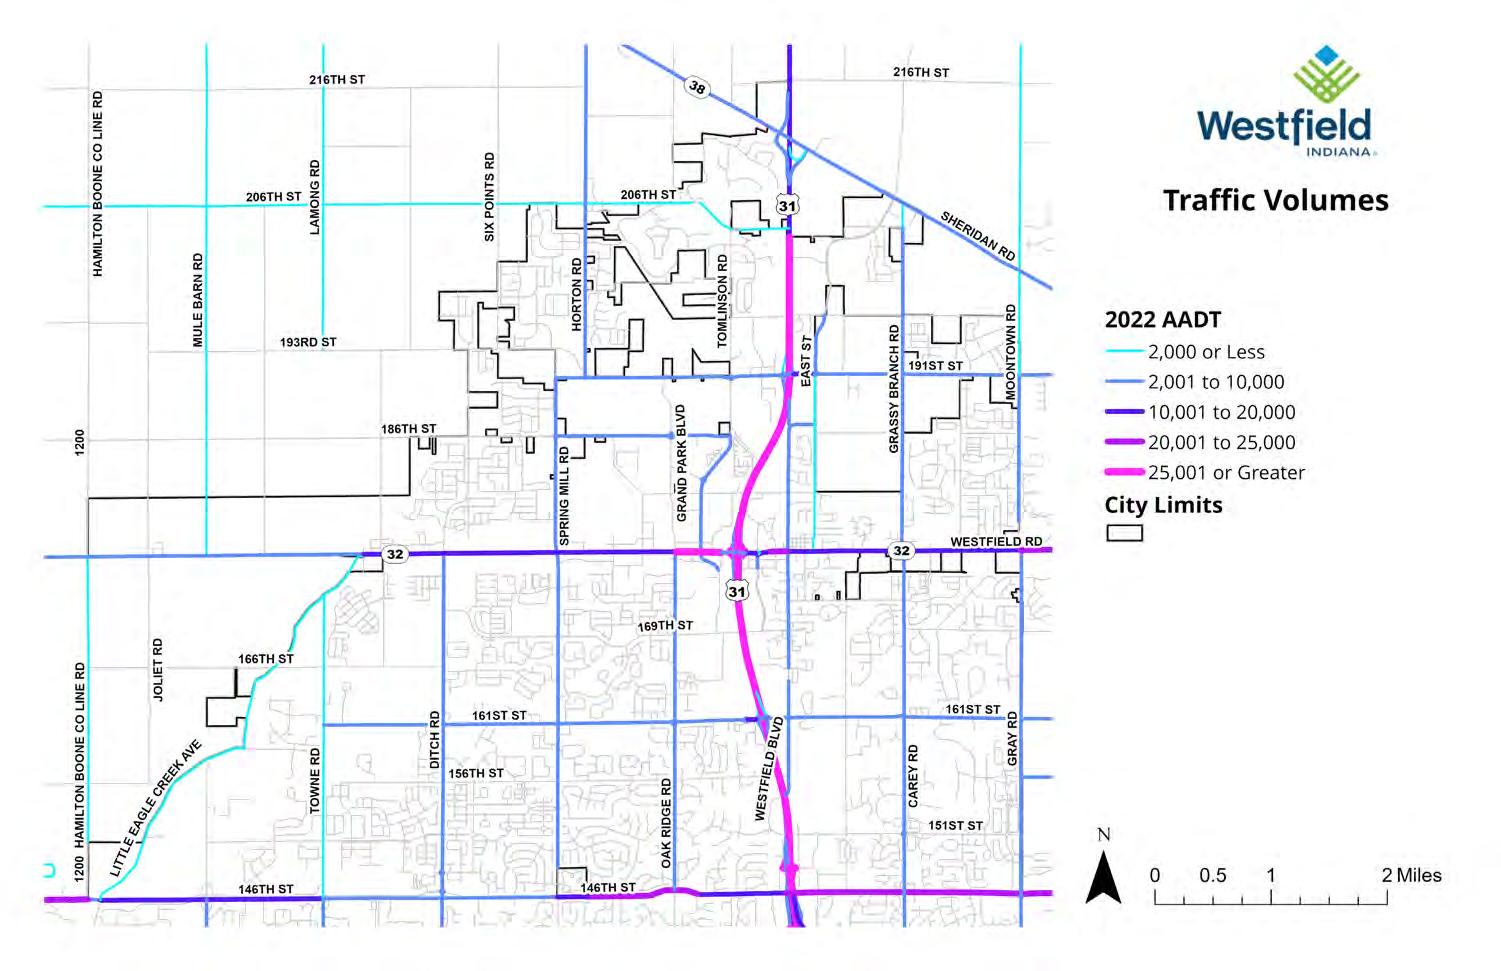
The operations, or success, of a roadway network to operate at free flow speed are measured in terms of Level of Service (LOS). LOS measures the delay experienced by motorists at intersections. LOS is quantified by six Levels of Service (LOS), shown in Table 5-1, which range from LOS A (“Free Flow”) to LOS F (“Fully Saturated”). LOS C is normally used for design purposes and represents a roadway with volumes ranging from 70% to 80% of its capacity. LOS D is generally considered acceptable for peak period conditions in urban and suburban areas and would be an appropriate benchmark of acceptable traffic for the study area road system.
The Indianapolis Metropolitan Planning Organization (IMPO) provided the regional Travel Demand Model (TDM) data for Westfield. This data includes volume to capacity (V/C) ratios for roadway segments which is representative of congestion on a roadway and can be used to illustrate LOS along a roadway segment. Based on the V/C ratios, LOS ranges from level A (less than .3) down to LOS F (more than 1) as shown in the table that follows.
The 2024 baseline year segment LOS for afternoon peak hour traffic in the northbound and eastbound directions is shown on the following page in the 2024 Traffic Level of Service Map. The afternoon northbound and eastbound directions are shown to visualize afternoon rush hour, typically the worst hour of operation. All segments operate with LOS D or better. However, select segments at intersections operate at LOS E including State Road 32 at Gray Road, 146th Street at Gray Road, and 161st Street at US 31.
5.6: Level of Service Levels.
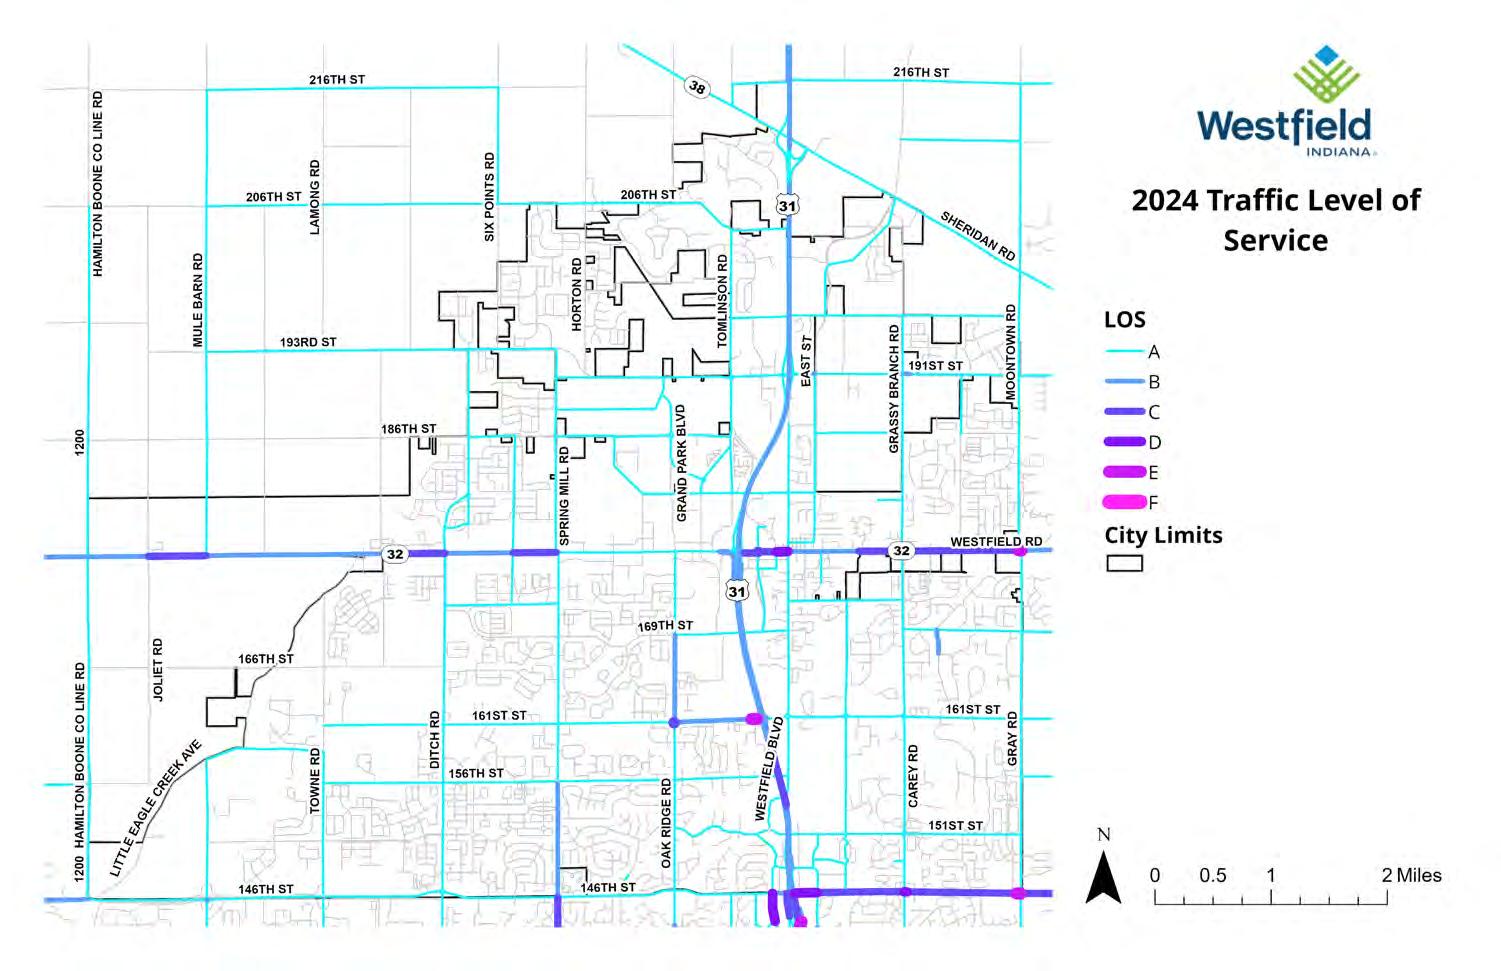
The 2050 future year segment LOS for afternoon peak hour traffic in the northbound and eastbound directions is shown on the map to the right. The future forecast considers projected traffic growth and planned network improvements based on the Indianapolis Metropolitan Planning Organization (IMPO) regional TDM.
A comparison of the 2024 and 2050 LOS maps indicates increased congestion along several key corridors. While many roadway segments currently operate at LOS D or better, a notable increase in segments experiencing LOS E is expected, particularly along major arterial roadways and highway interchanges. Several segments along US 31 are projected to experience worsening congestion, with many segments reaching LOS D and E, particularly near major intersections. The 146th Street corridor, which already sees moderate congestion in 2024, is expected to face increased delays by 2050, especially east of US 31, where conditions deteriorate to LOS D or E. Similarly, State Road 32 west of Spring Mills Road is anticipated to worsen with an LOS of E in some segments.
Beyond major corridors, additional localized congestion increases are expected, particularly in commercial and high-growth residential areas, leading to greater delays and reduced travel efficiency. The intersection at 161st Street and US 31 is one area that is projected to improve service. These findings highlight the need for proactive transportation planning, including infrastructure expansions, signal timing optimizations, and multimodal enhancements to help mitigate congestion and maintain an acceptable level of service across the study area.
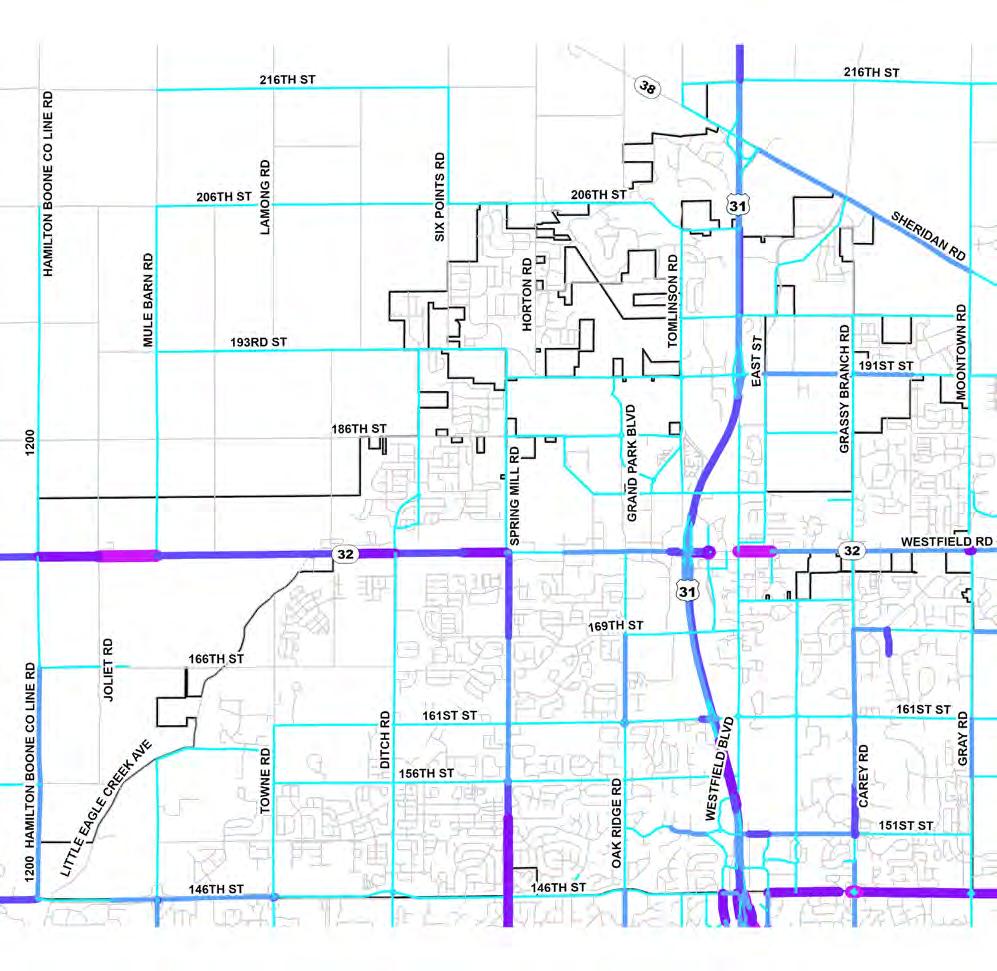


There were 204 fatal and incapacitating injury crashes in the City of Westfield from 2019 through 2023, averaging 41 crashes per year. The table below shows the severity of all crashes by year. The total number of fatal and incapacitating crashes reached a low in 2020 after peaking in 2019. It should be noted that no fatal crashes occurred in 2020, 2021, or 2022.
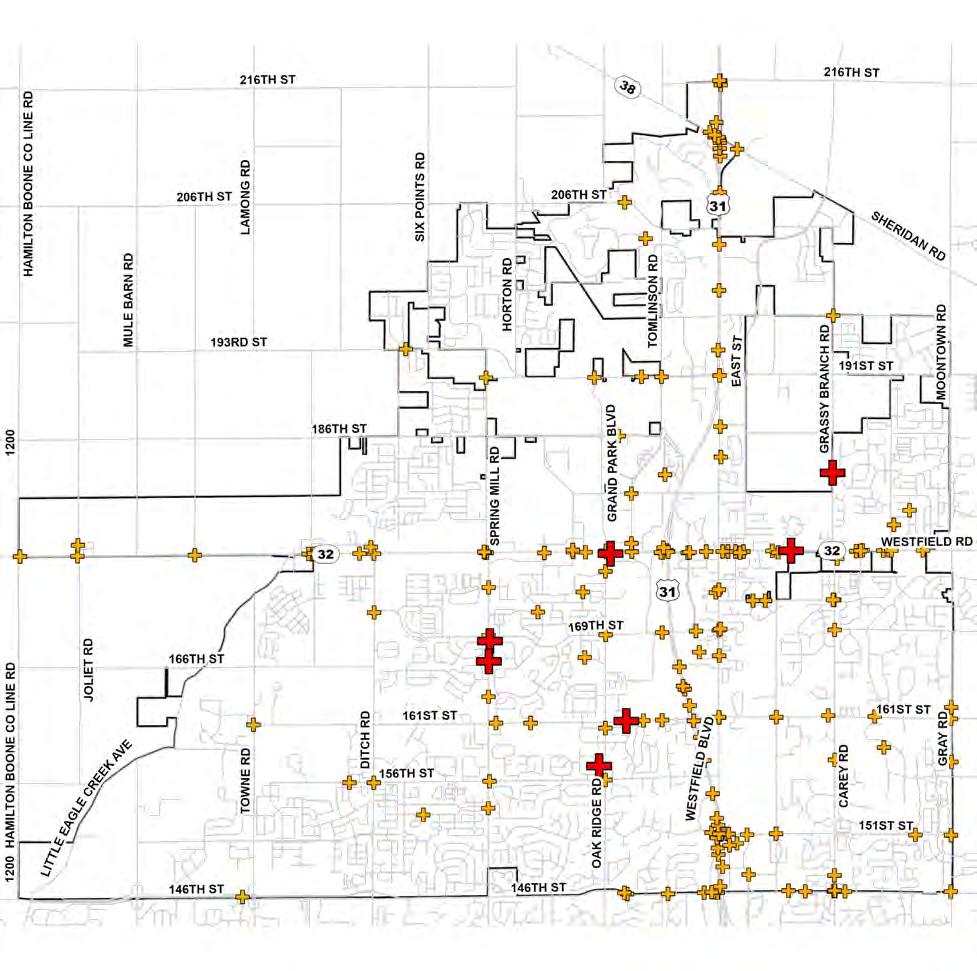
Sidewalks, trails, and on-street bikeways like bicycle lanes and signed bicycle routes are integral components of the transportation network. These facilities are necessary to create a robust multimodal transportation system. Existing pedestrian and bicycle facilities are summarized below.
The pedestrian network includes upwards of 278 miles of public and private sidewalk per spatial data provided by the City of Westfield Public Works Department. Approximately 242 miles of sidewalk is owned by the City of Westfield. The location and ownership of sidewalks in Westfield are shown on the map. Note that not all sidewalks in the city are included in the spatial data provided.
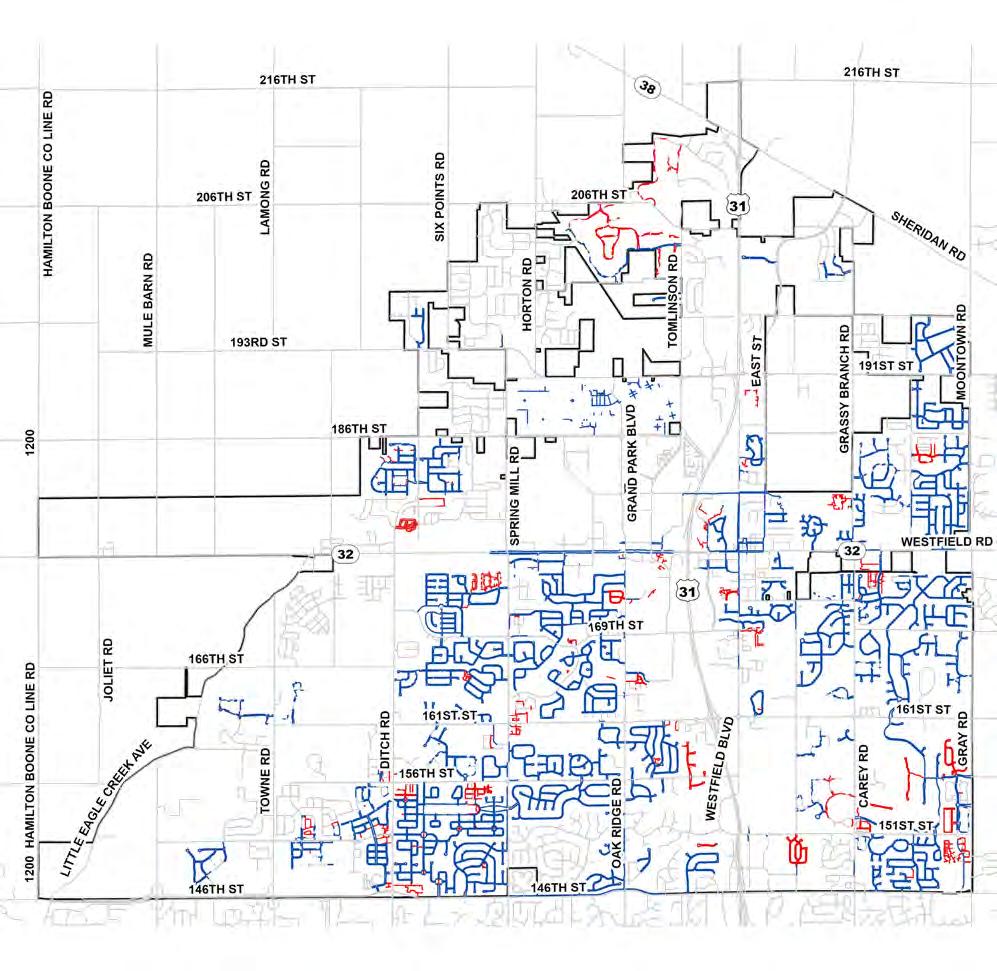
Based on 2013 Thoroughfare Plan Amendment
Most bike facilities in Westfield are separated shared use paths and trails with limited on-street facilities. On-street bike lanes do exist at 186th Street from Kinsey Road to Tomlinson Road, however the facilities are unprotected, and markings are faded. Unprotected bike lanes are marked on John Dippel Boulevard from Grand Park Boulevard to the roundabout at Wheeler Road where the bike lanes end and share-theroad markings begin. Share-the-road pavement markings are marked on Wheeler Road from the roundabout at John Dippel Boulevard and Wheeler Road to 181st Street. These on-street facilities are made redundant by the existing trails and trails under construction. The 2013 amendment to the Thoroughfare Plan proposed Cycle Corridor Routes which are shown on the map below. The Monon Trail is also a designed Cycle Corridor Route.
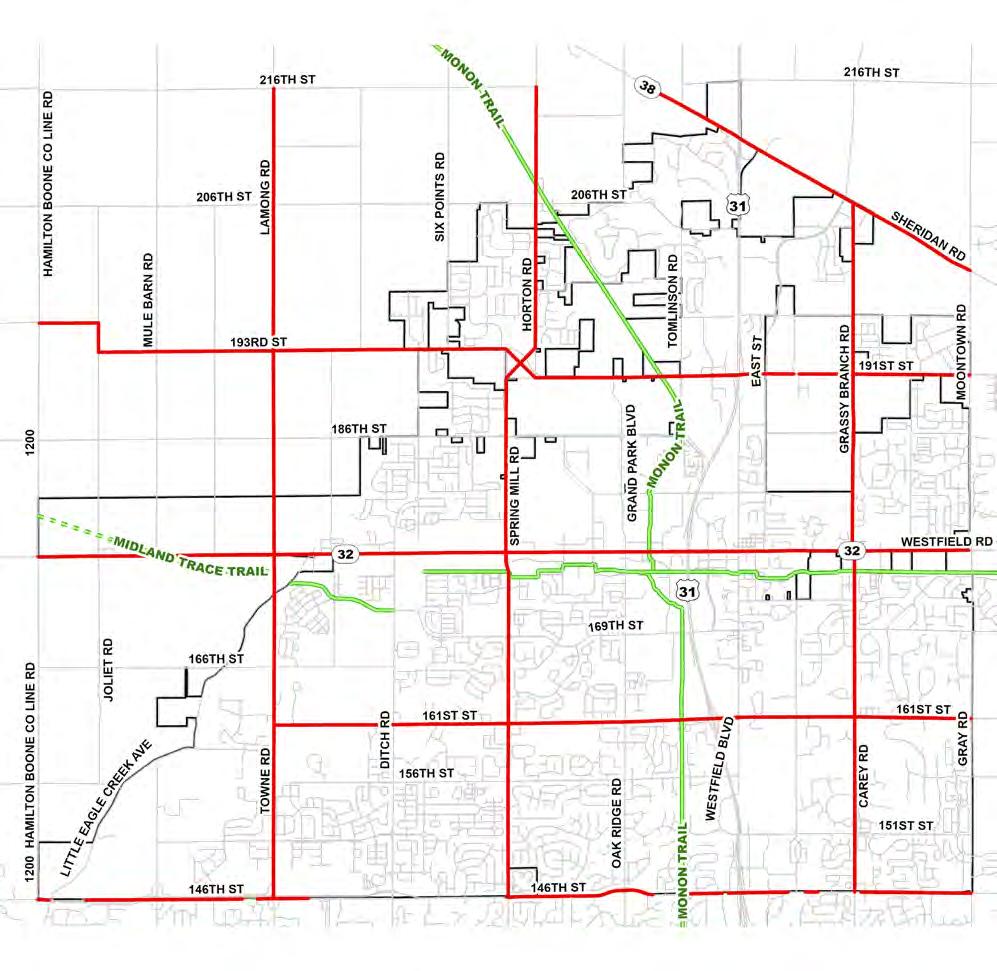
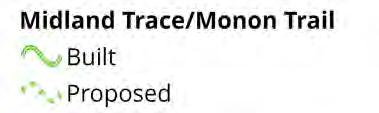
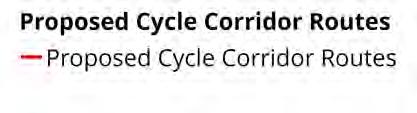
The trail system in Westfield includes over 80 miles of trails owned by the City of Westfield. Notably, the Westfield portion of the Monon Trail runs north-south through the center of the city, connecting Westfield to Downtown Indianapolis. The Midland Trace Trail runs east-west through the city, providing access to Noblesville. Existing trails owned by the City of Westfield are shown on the map.
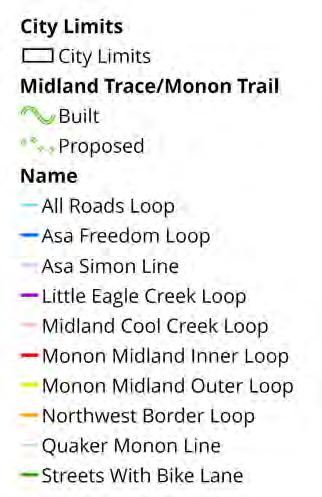
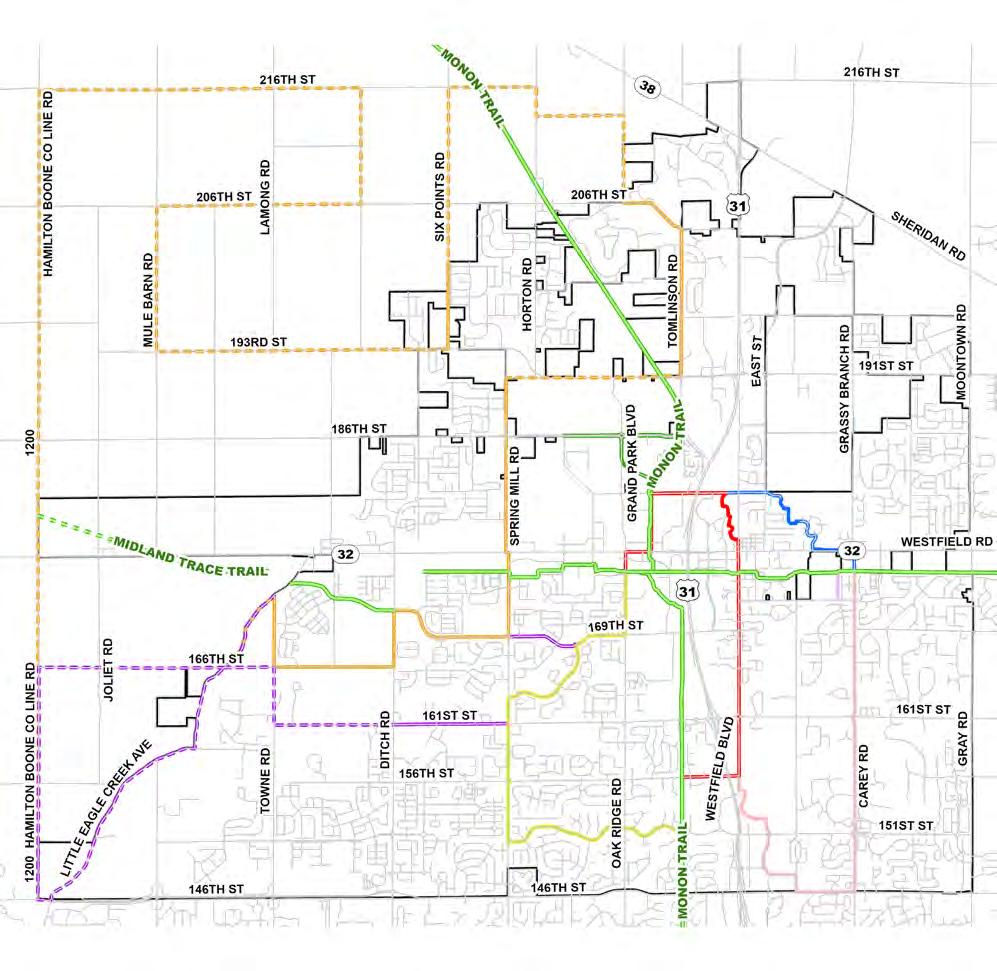
The City of Westfield does not operate a fixed-route public transit system. In place, Janus operates an affordable, on demand public transit system for Hamilton County. The Hamilton County Express is a demand-response, origin-to-destination service available to all members of the public in Hamilton County. Riders call in advance to schedule a ride. Vehicles are handicapped-accessible with wheelchair lifts. Service is available from 6 a.m. to 6 p.m. Monday through Friday, Saturdays 7 a.m. to 3 p.m., and is unavailable on Sundays and major Holidays.
The City of Westfield adopted the most recent zoning ordinance, the “Westfield-Washington Township Unified Development Ordinance” (UDO), in August 2023. Pertinent specifications for transportation in the UDO include block length and connectivity requirements.
• The maximum length of a block in a single-family residential Subdivision shall not exceed one thousand two hundred and fifty (1,250) feet; except where an Internal Street or Frontage Road parallels an Expressway or Arterial.
• Streets shall align and connect with existing or planned streets and provide connections with adjacent property. Proposed streets, where appropriate, shall be extended to the boundary line of the tract to be developed to provide for normal circulation of traffic within the vicinity.
Source: janus-inc.org/hamilton-county-express
In addition to the above, the UDO discourages cul-de-sacs, permits only temporary dead-end streets for future connections, and includes provisions for pedestrian connections between cul-de-sacs for likely pedestrian destinations. The UDO requires that sidewalks and pedestrian paths and trails for new developments be constructed in accordance with the Thoroughfare Plan.
The Downtown Westfield Plan, “A Vision for Downtown” was completed in November 2022 by the Downtown Westfield Association. It envisions what Downtown Westfield could be by outlining what responsible growth looks like, while improving walkability and properly planning for current and future traffic congestion. Potential improvements include various new connections including possible extensions on Shamrock Boulevard, Hoover Street, Westfield Boulevard, North Street, Penn Street, Maple Street, 171st Street, Jersey Street, Walnut Street, Oak Road, and Jersey Street.
Westfield’s Capital Improvement Plan includes 39 projects totaling $222 million, funded through sources such as RIF, INDOT, ARPA, GO bonds, MPO, the 2024 budget, and developer contributions. The projects range from road reconstructions, extensions, improvements, widenings, and roundabouts to intersection upgrades, bridge reconstruction, drainage improvements, and new trails. Roundabouts at locations like 151st and Towne and 181st and Wheeler will improve traffic flow and safety, while widening projects on Mule Barn Road and Tomlinson Road will reduce bottlenecks and support growth. Intersection upgrades and new trails will enhance connectivity, promote walking and cycling, and improve pedestrian safety. Economic benefits include revitalizing the SR 32 downtown corridor, while drainage improvements will reduce flooding risks. These investments also lower emissions through improved traffic flow and encourage active lifestyles through expanded trail networks. Guided by traffic studies and strategic planning, these projects position Westfield for sustainable growth, improved mobility, and a stronger community.
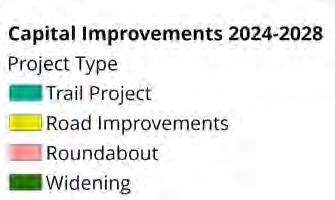
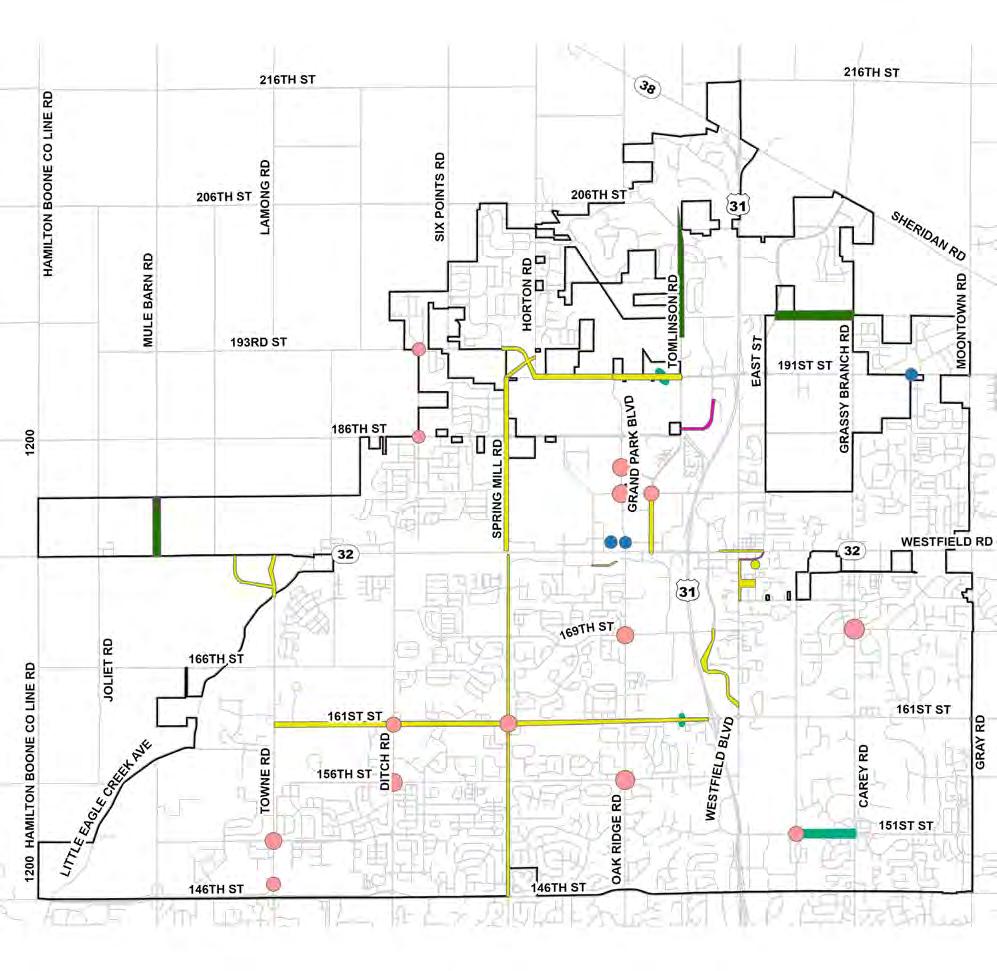
The Thoroughfare Plan is the mapped classification of existing roadways by type which designates the role and function of each route within the transportation network. Roadways are typically classified using Functional Classifications which are linked with design guidelines and standards for right of way to be set aside as development occurs. The Thoroughfare Plan also identifies planned, future roadways and connections to provide a roadmap as development occurs and to aid planning efforts. The Thoroughfare Plan is focused on vehicular roadways and future corridors. Multimodal facilities for bicycle and pedestrian accommodations are addressed separately later.
The purpose of the Thoroughfare Plan is to classify all roadways within Westfield by their role in the transportation network and plan for future roadways, connections, or extensions. The Thoroughfare Plan will utilize the Functional Classification system framework, developed by the Federal Highway Administration in 1974, to classify each roadway in Westfield.
Functional Classification is one classification framework for categorizing roads according to their function within the transportation system. Within the Functional Classification framework, roadways serve two primary travel needs: access and mobility. Access is the ability to travel to various destinations within a given amount of time. Mobility is the ability to travel freely to a destination in a given amount of time. While most roads in the network provide some combination of access and mobility, a roadway’s Functional Classification indicates its primary purpose. The Functional Classification framework is primarily concerned with access and mobility in the context of motor vehicle trips and does little to consider surrounding context or other modes. This mitigating factor will be addressed later by introducing the complementary classification framework of Street Types.
The Functional Classification of a road typically guides design decisions such as roadway width, roadway elements, and access management standards. It can have funding impacts as well; oftentimes federal funding is restricted from “local” roads. Definitions of each Functional Class are based on their basic role within the roadway network in terms of access and mobility. Four classifications of roadways are used in Westfield which is consistent with Hamilton County and the Indianapolis MPO as described below.
Primary arterials chiefly serve through traffic movements rather than land access. Full or partial access control is desirable on these facilities. In rural areas, these facilities serve substantial statewide or interstate travel. Within urbanized areas, these facilities serve both through trips and longer intra-city trips. It is important that primary arterials are coordinated across jurisdictional lines since, by definition, they serve trips that typically originate or end outside the planning area.
Secondary arterials prioritize mobility but provide land access to a greater extent than primary arterials. Generally, they provide lower travel speeds and accommodate shorter trips than primary arterials. Secondary arterials connect with and supplement the primary arterial system. These facilities provide for major intra-city trips and provide connections to the surrounding primary and secondary arterial system. Although secondary arterials have an access role, they should not penetrate neighborhoods and good access management practices should be applied to protect their essential mobility function.
Collectors serve a balanced role with respect to mobility and access. As the name implies, they collect traffic from local roads and provide a link with arterials. Collectors provide service to residential, commercial and industrial areas. If not served directly by an arterial, all major traffic generators and neighborhoods should be served by a collector roadway. Collectors penetrate neighborhoods to link the arterial network with local streets.
All public roads and streets not classified as arterials or collectors are classified as local roads and streets. They provide direct access to abutting properties and are intended to serve only local traffic movements. Traffic speeds and volumes are generally low, and through traffic is discouraged.
Note, US 31 and SR 32 are viewed as “Highways” by the City of Westfield and fall outside the four Functional Classes defined above.
Guidelines provided by the Federal Highway Administration provide a structured approach for the classification of roadways within a transportation network. Basic principles and the process used to classify roadways in Westfield are described below.
The classification of a roadway by function is dependent on a number of considerations. These considerations include:
• Rural vs. urban
• Adjacent land use
• Internal vs. external trips
• Typical trip lengths
• Traffic volumes
• Destinations served
• Spacing
• System balance of road miles and vehicle miles traveled
5.17: Arterial Spacing.
System balance should be achieved that reflects the fact that most roadway mileage within any jurisdiction is on local streets, while most vehicle miles of travel occur on arterial streets. Spacing of roadways of different functional classes is another consideration in establishing a system. The pacing of arterials should correspond with the density of development, as illustrated in the table.
Functional Classification Principles cont.
In addition to the previous guidelines, key considerations include system linkages and continuity. In this regard, two “rules” should be applied in establishing a Functional Classification system:
• Arterials and collectors link to form a continuous network. These classifications do not “end.” They connect to other arterials or collectors.
• All arterials and collectors end at intersections. These classifications do not change on a roadway between intersections.
With those principles in mind, the process of determining the Functional Classifications for a transportation system is as follows:
1. Identify future land use patterns
2. Identify highways as primary arterials
3. Identify entering arterials from adjacent areas
4. Identify secondary arterials based on spacing and role within the system, considering linkages from other communities
5. Review of the arterial system for area coverage
6. Identify the collector street system based on spacing and role within the system
7. Identify the local street system as the remaining roadways
8. Review the system for “balance and reasonableness”
A review of the above process indicates that the key considerations in establishing a Functional Classification system are land use, adjacent plans, roadway spacing, and system linkages and continuity. Each of these factors is considered in applying the process for Westfield.
The recommended Functional Classification system for Westfield largely consists of the existing designations from the 2013 Thoroughfare Plan update. Adjustments to existing designations are detailed in the following map, along with recommended extensions, new connections, and targeted spot improvements to strengthen network continuity and address localized mobility or safety concerns.
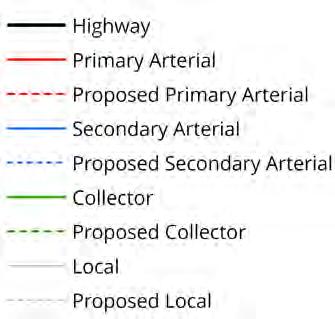
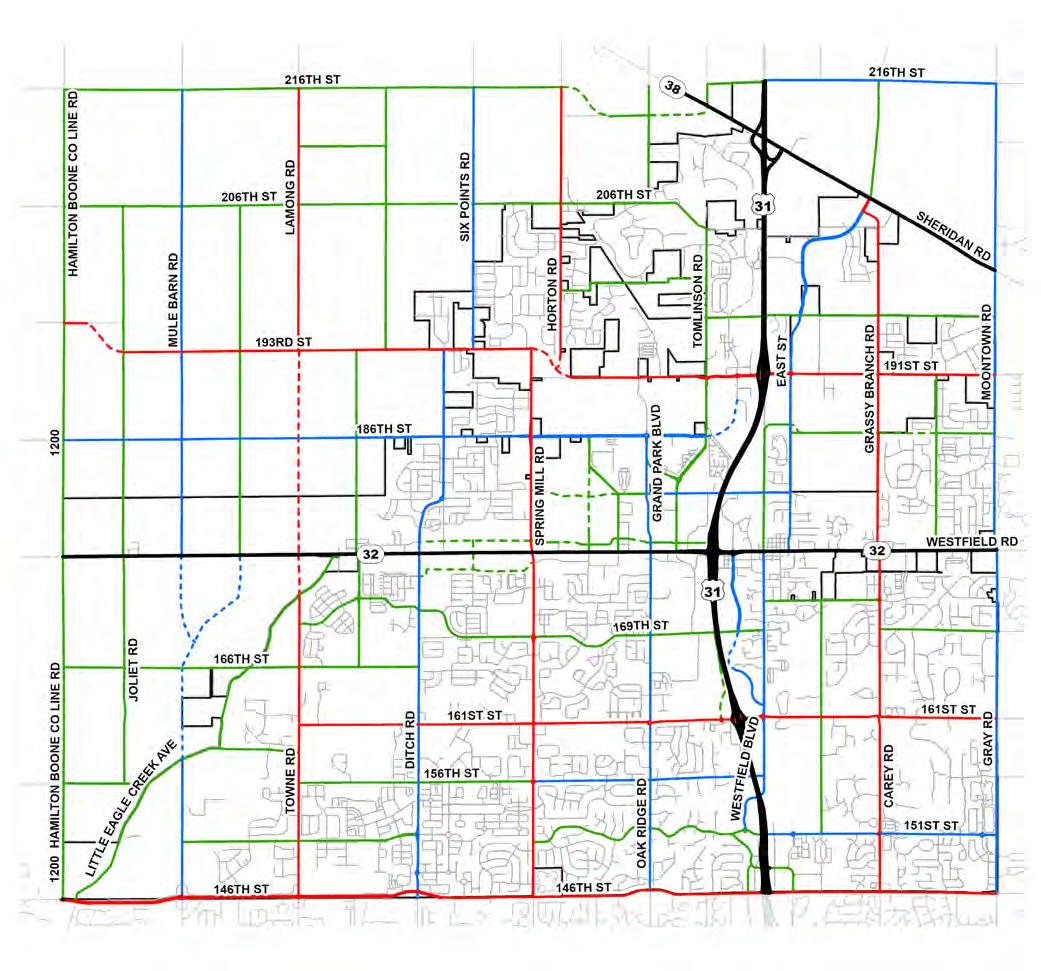
Right of way is publicly owned land reserved for a transportation facility or other public uses. One primary purpose of the Thoroughfare Plan is to classify roadways to guide the preservation of right of way as development occurs to ensure the integrity of the roadway network while minimizing cost and disruption. Right of way to set-aside standards for new development differ from the process used to acquire right of way from existing property owners in already developed areas. This section describes the process for each scenario and recommends right of way standards for the differing Functional Classifications.
Right of way is ordinarily set aside as a condition of rezoning or other development approval action for proposed developments based on Functional Classifications identified in the Thoroughfare Plan and standards adopted as part of the community’s subdivision control ordinance. Typically, half of the needed right of way is requested from developments located on one side of a road.
Additional right of way may be set aside as part of the approval process for individual projects if the need is identified by traffic impact studies associated with the development. This additional requirement is frequently driven by a need for auxiliary lanes, approach realignment, roundabout construction at intersections, or to accommodate multimodal facilities.
Where there is no rezone, plan approval or other action by the Plan Commission or Council, right of way is acquired only for specific project needs, as described in the next section. The Thoroughfare Plan and associated right of way standards have no direct relationship with the right of way acquisition from individual property owners for areas already developed.
In the absence of development approval action as described previously, right of way is acquired from property owners on a case-base-case basis as projects are developed. Right of way needs are identified based on specific project requirements identified through the project design process.
Generally, the process is as follows:
1. A project is identified through engineering and environmental studies
2. Hearings are being held to inform the public of the project.
3. Field surveys are conducted to define existing features and property lines
4. Designs are refined to identify specific project details and right of way needs.
5. More hearings are being held to present project details to the public.
6. Right of way needs are identified for each adjoining parcel to meet specific project needs.
7. Right of way is acquired in accordance with state law and funding program requirements. Some of this right of way may be temporary for off-site grading or to construct drive connections. Either way, property owners are compensated.
8. The project is bid and constructed.
Although the Thoroughfare Plan can (and should) be a factor in driving the definition of project definition and design, it has no direct relationship to the acquisition of property from individual property owners.
Minimum right of way standards are intended for the reservation of right of way in new development areas as projects are being reviewed. Minimum right of way standards are NOT intended for general right of way acquisition from existing property owners. Where necessary, right of way will be acquired from existing property owners through a separate project design that will be sensitive to each unique set of circumstances. Design features, such as those listed below, can be used to minimize the amount of land needed from existing property owners.
1. Use of roundabouts.
2. Shifting from 8-foot paths to 5-foot sidewalks.
3. Eliminating sidewalks or paths from one or both sides of street.
4. Offsetting the centerline of the road.
5. Acquiring temporary construction easements instead of ROW.
6. Acquiring landscape easements instead of ROW.
Roadway rights of way must be wide enough to accommodate travel lanes, auxiliary turning lanes, medians, parking lanes, sidewalks, bicycle and pedestrian facilities, roadway drainage, utilities, safety buffers, and landscaping. Sufficient right of way should be set aside at the time development occurs to accommodate all necessary uses.
It is important to identify right of way requirements in advance so that adequate space will be set aside for transportation needs as an area is developed. While these widths will accommodate the additional right and left turn lanes typically required at driveways and intersections, additional right of way could be required to accommodate unusual circumstances or traffic flow patterns.
Conversely, when a road is to be constructed or improved in an area that is already developed or is environmentally sensitive, the City may request less right of way at the time of development. A roadway facility should typically be centered within the right of way, but this may also be altered at the discretion of the City to accommodate special circumstances.
The minimum right of way to be set aside at the time of new development is based on the Functional Classification of the roadway. The following minimum right of way widths are recommended:
Primary Arterials - 150 FT
Secondary Arterials - 120 FT
Collectors – 100 FT
In most cases, the recommended right of way widths are adequate to provide sufficient roadway capacity, along with multi-use paths and the other items listed above. Right of way recommendations by Functional Classification are described on the following page.
Right-of-way for primary arterials is recommended to be 150-feet to provide room for a four-lane divided roadway and two multi-use paths. Travel lanes are 12-feet wide, and the center median is 16-feet wide to accommodate a 4-foot median and a 12-foot left turn lane. Multi-use paths are assumed to be 8-feet wide to accommodate users flowing primarily with traffic. There is sufficient right-of-way to accommodate wider paths in lieu of selected landscape components. This right-of-way width is adequate to allow for the construction of additional through lanes, right-turn lanes, deceleration lanes and acceleration lanes as necessary. The right-of-way will allow for the construction of utilities without placing the utilities under the roadway pavement.
The minimum right-of-way for secondary arterials is set at 120-feet to accommodate a four-lane divided roadway, with two multi-use paths and a modest degree of landscaping. Travel lanes and median dimensions are the same as primary arterials. The right-of-way width is adequate to allow for the construction of auxiliary lanes and the provision of utilities without the need to place them under the roadway pavement.
A minimum right-of-way width of 100-feet is recommended for collectors to accommodate a three-lane roadway and two multi-use paths. Travel lanes are 12-feet wide, and the center lane is 16-feet wide to accommodate a two way left turn lane (TWLTL) or a future raised median (4-feet) and a 12-foot left turn lane. These multi-use paths are 8-feet wide to accommodate users flowing primarily with traffic. This right-of-way will allow for the construction of right-turn lanes, deceleration lanes and acceleration lanes as necessary. Utilities can generally be installed outside pavement areas.
Local roadway right of way widths are covered by standard drawings which are included in the Westfield Construction Standards and Specifications. These standards cover items such as on-street parking, street trees and underdrains Roadway width is to be a minimum of 31-feet from curb to back of curb with a 59-foot right of way set aside. Right-of-way width varies and is dependent on the roadway alternative selected by the developer. The use of narrow streets requires the provision of off-street parking. Wider streets can accommodate on-street parking.
Similar to nearby Indianapolis suburbs, Westfield has adopted roundabouts as a frequently used intersection safety improvement. Roundabouts require different right of way consideration and to ensure future construction is possible, additional right of way reservation at public road intersections is preferable to allow for future roundabout construction.
In the absence of site-specific studies, right of way is recommended to be set aside in a manner similar to roadways using Functional Classification designations. It is recommended that an area within a 300-foot diameter circle centered on the intersection should be reserved as right of way at arterial intersections. This right of way reservation typically provides sufficient area to construct either a single lane roundabout or a two-lane roundabout.
At any other public road intersection, an area within a 200-foot diameter circle centered on the intersection should be reserved as right of way. The right of way reservation at these locations typically provides sufficient area to construct a single lane roundabout. Location specific adjustments and design decisions may be made to accommodate unique circumstances. These design decisions could result in the need to acquire additional right of way beyond that reserved by these typical requirements. For simplicity in right of way description, a straight-line corner cut could be used between the points where the required diameter crosses the right of way lines of the approach roads.
Access management typically involves ordinances that control the location, spacing and design of intersections and driveways on arterial and collector roads. Proper access management can preserve through throughput of a corridor, reduce congestion, minimize crashes, improve aesthetics, increase pedestrian safety and comfort, encourage development, and increase property values.
Access management procedures are important in Westfield, where growth and development are continuing. Westfield has included some of the past access management recommendations from the 2013 Thoroughfare Plan in its 2025 Unified Development Ordinance. Recommendations remaining to be implemented include:
• Establish intersection and driveway spacing requirements for arterial and collector roads including setback requirements from freeway ramp terminals.
• Encourage property access requirements to support shared access to adjacent developments.
• Require that existing properties be brought into compliance with access management requirements upon:
• Subdivision of property
• Change in zoning
• Significant increase in trip generation by the property
• Request for new driveway permit
Building on the Thoroughfare Plan, intersection improvements play a critical role in creating a safer and more efficient transportation network. Intersections are often the most complex and high-risk points in any roadway system, where conflicting movements and heavy traffic volumes can lead to congestion and crashes. Addressing these challenges requires a combination of strategies, including the installation of modern roundabouts, signal upgrades, and geometric modifications that streamline traffic flow and enhance visibility.
Roundabouts, for example, reduce severe collisions by eliminating leftturn conflicts and lowering vehicle speeds, while signal improvements can optimize timing to minimize delays during peak periods. Geometric changes, such as adding turn lanes or adjusting approach angles, further improve operational efficiency and accommodate future traffic demands. Together, these targeted upgrades complement the City’s broader mobility goals by reducing travel times, improving safety for all users—including pedestrians and cyclists—and supporting economic growth through reliable access to key destinations.
Potential intersections for improvements were selected based on the City’s future land use and Placetypes Plan, with consideration of anticipated growth patterns, traffic volumes, and safety priorities. This approach ensures that improvements are focused on locations where they will have the greatest long-term impact, supporting both current needs and the evolving transportation demands of the community.
The following map and tables are intended as a starting point, illustrating potential locations for intersection improvements rather than definitive project sites. Any intersection located on or above a collector roadway should be carefully evaluated for improvement opportunities. These locations are subject to further engineering analysis and community input to ensure that proposed solutions align with safety priorities, operational needs, and stakeholder expectations. Recommended design solutions and estimated cost ranges are provided to ensure that these investments remain strategic and transparent.
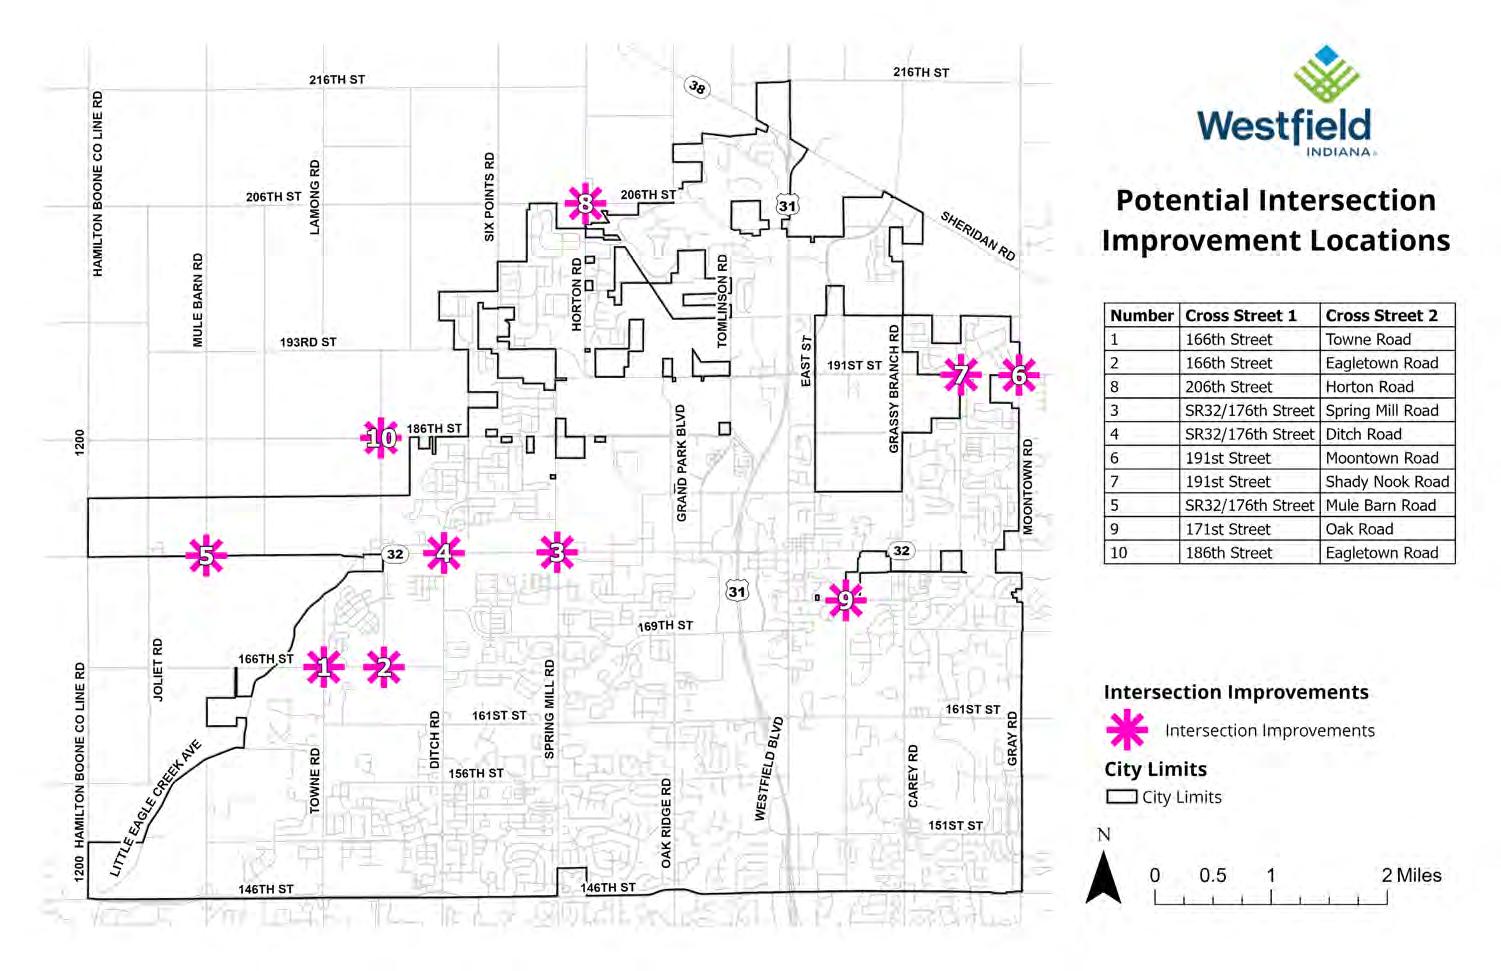
Roundabout
A gap analysis was conducted using available GIS data and the most recent Google Earth aerial imagery. The map shows existing facilities including the Monon Trail and Midland Trace Trail, Westfield Loop Trails, and existing bike lanes, side paths, and trails. Proposed facilities included in the most recent (2024-2028) Capital Improvement Plan are shown in teal for the Midland Trace Trail and other trail projects.
Gaps in the network are shown in orange and yellow dashed lines. Orange indicates gaps in the bicycle and pedestrian network within the City of Westfield and yellow indicates gaps outside the city limits that may require external partners to address but that close crucial gaps in the City’s network. Locations that may need crossing improvements are indicated using an orange cross.
The map below may appear to have gaps in the network that are not called out. The gap analysis was created using Google Earth as a validation tool to ensure existing facilities not yet included in available GIS data were accounted for.
Westfield has several facilities on the ground that are too new to be included in available data.
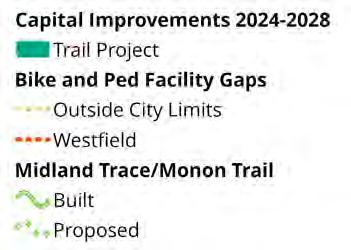
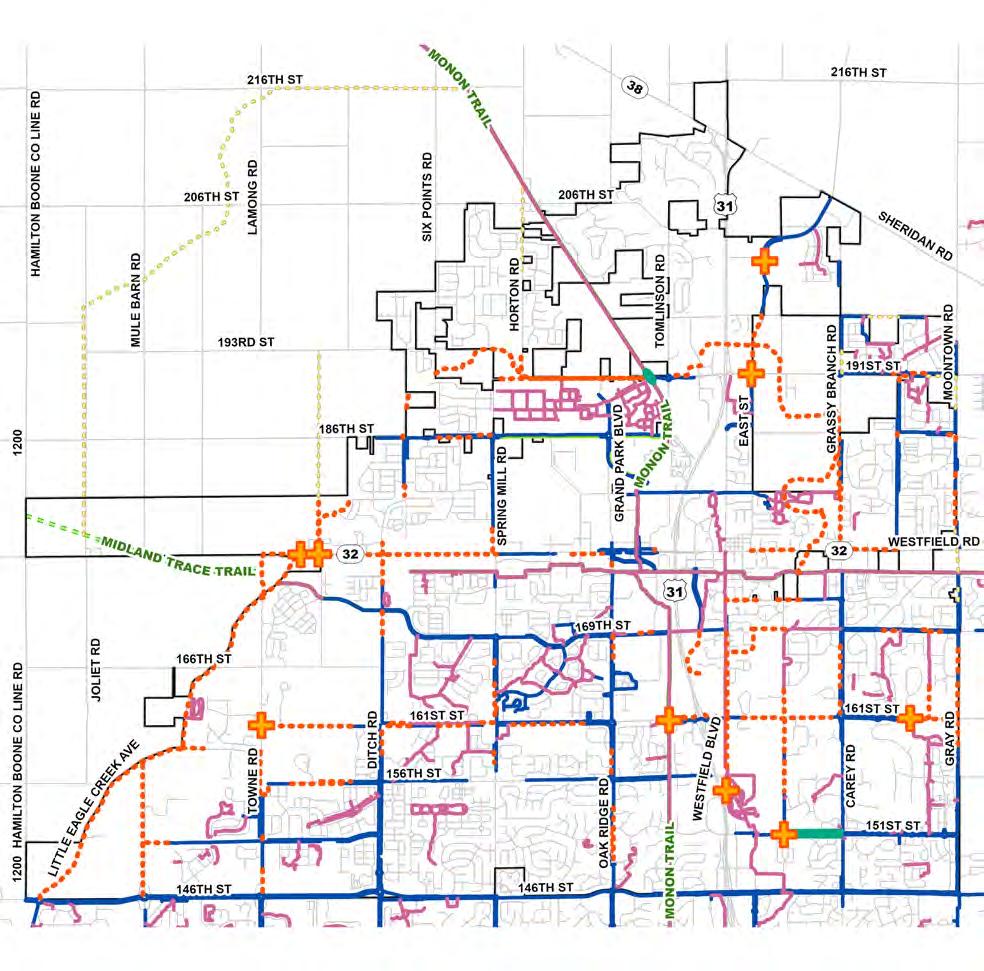
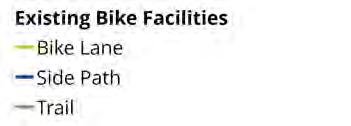
Several different types of trail improvements may be used depending on local context and alignment with proposed street types.
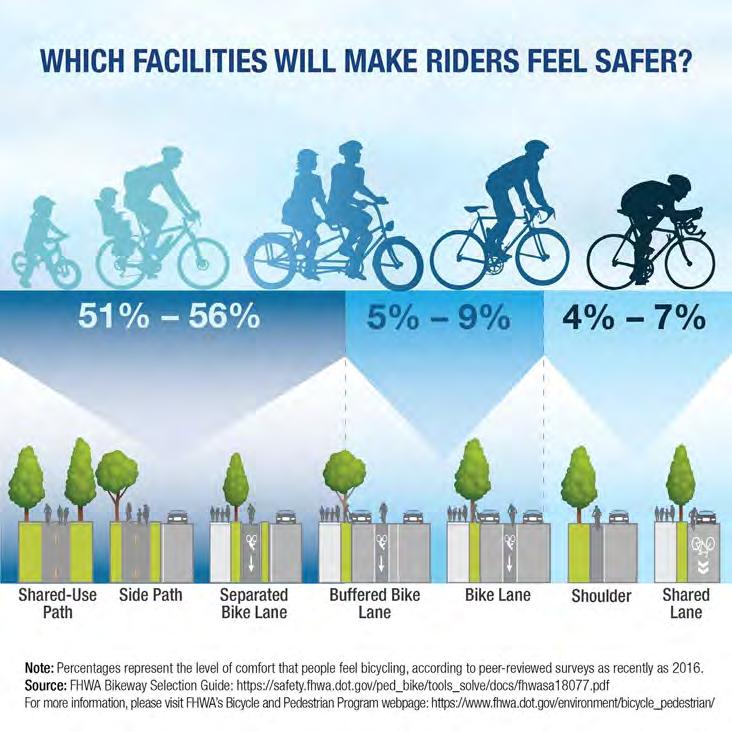
Shared-Use/Side Path: Paved 8-12 foot path, fully separated from motor vehicle traffic. Best for Regional Boulevards and Low-Density Residential roadways.
Bicycle Lanes: 3-6 foot On-Street Facilities can either be buffered, separated, or adjacent to traffic. It should be found on Crosstown Avenues and Mixed Use/Low Density Commercial Collectors.
Shoulders and Shared Lanes: Limited or no dedicated space for cyclists on the roadway. Shared lane markings are appropriate for Neighborhood Avenues.
Additional Resources: NACTO Urban Bikeway Design Guide, FWHA Bikeway Selection Guide
Filling in these trail gaps will be a multi-phase process that requires significant coordination and funding. Improvements have been prioritized based on crash data, public input, and system connectivity, with highest priority gaps being areas that should immediately be targeted as potential project candidates. Note that some immediate gaps may already be in the process of being filled pending the completion of current capital projects.
156th Street Towne Road Edenvale Drive
159th Street Eagle Creek Avenue Existing Path Terminus
161st Street Towne Road Ditch Road
161st Street Ditch Road Spring Mill Road
161st Street Spring Mill Road Oak Ridge Road
161st Street Monon Trail Union Street
161st Street Union Street Carey Road
161st Street Colleton Court Gray Road
169th Street Carey Road Gray Road
169th Street Oak Ridge Road Westfield Park Road
171st Street Futch Way Union Street
176th Street Dartown Road Oak Ridge Road
186th Street Casey Road Spring Mill Road
191st Street Spring Mill Road Tomlinson Road
191st Street Grassy Branch Road Moontown Road
32/Main Street East Street Carey Road
Carey Road 161st Street 169th Street
Ditch Road 156th Street Casey Road/ Hamilton Way
Bike Lanes or Shared-Use Path
Bike Lanes or Shared-Use Path
Bike Lanes or Shared-Use Path
Bike Lanes or Shared-Use Path, where needed
Bike Lanes or Shared-Use Path, south side
Shared-Use Path across US-31
Bike Lanes or Shared-Use Path
Bike Lanes or Shared-Use Path
Shared-Use Path where needed or mid-block crossings
Bike Lanes or Shared-Use Path
Bike Lanes or Shared-Use Path
Bike Lanes or Shared-Use Path, south side
Bike Lanes or Shared-Use Path
Bike Lanes or Shared-Use Path
Bike Lanes or Shared-Use Path, within city limits
Buffered/Separated
Bicycle Lanes or Shared-Use Path
Bike Lanes or Shared-Use Path, west side
Bike Lanes or Shared-Use Path, where needed
East Street 191st Street 196th Street
Grassy Branch Road 32/Main Street Mere Boulevard
Gray Road Killarney Drive 169th Street
Gray Road 32/Main Street 186th Street
Horton Road 191st Street Brunson Street/ Lone Isle Road
Oak Road 151st Street Oak Manor Road
Bike Lanes or Shared-Use Path
Bike Lanes or Shared-Use Path
Bike Lanes or Shared-Use Path
Bike Lanes or Shared-Use Path, where needed
Bike Lanes or Shared-Use Path
Shared-Use Path, Bike Lanes, or Shared Lanes
Oak Ridge Road 146th Street 32/Main Street
Shady Nook Road 186th Street 191st Street
Shelborne Road 146th Street Little Eagle Creek Avenue
Spring Mill Road 156th Street 169th Street
Spring Mill Road SR 32/Main Street 186th Street
Sun Park Drive SR 32/Main Street Current Path Terminus
Towne Road 146th Street 161st Street
Union Street 161st Street 169th Street
State Road 32 Carey Road Gray Road
Figure 5.24: Priority – Immediate.
Buffered or Separated Bike Lanes, or SharedUse Path, where needed
Bike Lanes or Shared-Use Path. Where needed
Bike Lanes or Shared-Use Path
Bike Lanes or Shared-Use Path, where needed
Bike Lanes or Shared-Use Path
Bike Lanes or Shared-Use Path
Bike Lanes or Shared-Use Path
Bike Lanes or Shared-Use Path
Bike Lanes or Shared-Use Path, where needed
32/176th Street Eagletown Road Spring Mill Road
Cool Creek Trail
Following alignment of Cool Creek to 191st Street/ Tomlinson Midland Trace Trail
Cool Creek Trail Oak Road Union Street
Eagletown Road 176th Street City Limits
Grassy Branch Trail 169th Street/ Westfield Boulevard 161st Street
Little Eagle Creek Trail Moose Ridge Lane, following alignment of Little Eagle Creek 146th Street
161st Street North to Miller Way Colleton Court
Shared-Use Path (extension)
Shared-Use Path/ Off-street trail
Shared-Use Path/off street trail
Bike Lanes or Shared-Use Path
Bike Lanes or Shared-Use Path
Shared-Use Path/ Off-Street Trail
Shared-Use Path/ Off-Street Trail
The remaining trail gaps are all located outside of Westfield city limits and are designated as “future” projects accordingly.
Eagletown Road 193rd Street City
Gray Road Scofield Farms Boulevard along 191st Street City Limits south
196th Street Moontown Road Grassy Branch Road
Grassy Branch Road 19th Street City Limits
Gray Road City Limits Westfield Road
Gray Road Outside City Limits Whitney Road
Path or Mid-Block Crossing Horton Road Monon Trail City Limits
Westfield’s transportation system is evolving to meet the diverse mobility needs of its residents, workers, and visitors. While the City does not currently operate a fixed-route public transit system, it benefits from Hamilton County Express, an on-demand, origin-to-destination transit service operated by Janus. This service is available to all members of the public and is especially valuable for seniors, individuals with disabilities, and those without access to a personal vehicle. While this system provides essential coverage, it is limited in frequency and geographic flexibility. As Westfield continues to grow, especially in areas like Grand Park and the downtown core, there is increasing interest in expanding mobility options beyond personal vehicles and demand-response transit.
One concept under consideration is a circulator shuttle or trolley service that would connect key destinations such as Grand Park, downtown Westfield, and other commercial or recreational hubs. This service could operate during peak hours and special events, reducing parking demand and encouraging local exploration. A circulator would also support tourism and economic development by improving access to restaurants, shops, and entertainment venues.
Westfield’s extensive trail system—including the Monon Trail and Midland Trace Trail—makes it an ideal candidate for a bike share program. Such a program could be deployed at strategic locations like:
• Downtown Westfield
• Grand Park
• YMCA and Library campuses
Bike share would provide flexible, short-distance travel options for residents and visitors, especially those who do not own a bicycle. It would also complement the City’s goals for active transportation and sustainability.
Golf carts are increasingly popular in Westfield neighborhoods and could play a larger role in local mobility. The city already permits golf carts on certain low-speed streets and shared-use paths with speed limits of 25 mph or less. Future planning could include:
• Designated golf cart crossings at major roads
• Golf cart parking areas near trailheads and commercial centers
• Safety signage and rules for shared-use paths
Golf carts offer a low-emission, low-speed alternative for short trips and are particularly useful in residential areas and near recreational facilities.
As Westfield continues to grow, the city may explore additional transportation options such as:
• Micro transit services that use smaller vehicles and flexible routes
• Partnerships with ride-hailing platforms to subsidize trips for underserved populations
• Electric vehicle (EV) charging infrastructure to support the transition to cleaner transportation
• Multimodal hubs that integrate parking, bike share, transit, and trail access
These ideas reflect Westfield’s commitment to building a transportation system that is inclusive, adaptable, and aligned with its placemaking goals.
Designing streets is not just about moving vehicles efficiently; it is about creating transportation corridors that respect and enhance the character of the places they serve. This principle, known as context-sensitive design, emphasizes tailoring street design to its surrounding environment rather than applying a uniform standard everywhere. A context-sensitive approach considers land use, community identity, safety, and quality of life alongside mobility needs. It seeks to balance transportation efficiency with social, economic, and environmental priorities, ensuring that streets function as public spaces as well as travel routes.
Street Types build on this philosophy by providing a framework for classifying and designing streets in a way that reflects both their role in the transportation network and their relationship to adjacent land uses. Instead of focusing solely on vehicle movement, Street Types define how a street should look, feel, and operate within its context. This includes design elements such as lane widths, sidewalks, bicycle facilities, landscaping, lighting, and transit accommodations. By integrating context-sensitive principles, Street Types help create streets that are safe, efficient, and aligned with community character, supporting mobility while reinforcing a sense of place.
Street Types are a way of classifying and designing streets that looks beyond simply moving vehicles from one place to another. They categorize streets based on their design, intended use, and role in the transportation network, while also considering how the street fits into its surrounding environment. Each Street Type describes how a street should look, feel, and function. This includes elements such as lane widths, medians, sidewalks, bicycle facilities, landscaping, lighting, and transit accommodations. For example, a Regional Boulevard may be designed with multiple lanes, wide medians, and shared-use paths to serve commuters and freight, while a Neighborhood Avenue emphasizes walkability, slower speeds, and pedestrian-scale lighting.
Functional classification is the foundation for understanding how streets operate within the overall transportation network. It traditionally groups streets into categories such as arterials, collectors, and local streets based on their role in moving traffic. Arterials carry high volumes over longer distances, collectors connect neighborhoods to arterials, and local streets provide direct access to properties. While this system is useful for defining connectivity and traffic flow, it does not address how a street should look or feel, nor how it interacts with surrounding land uses.
Street Types incorporate functional classification as one component of their framework but go further by specifying design elements and considering the character of adjacent areas. For example, two streets classified as collectors may function similarly in the network, but one in a suburban commercial area will have different design features than one in a residential neighborhood. Functional classification explains the street’s role in mobility, while Street Types translate that role into a contextsensitive design that balances transportation efficiency with community priorities like safety, aesthetics, and economic vitality.
While Street Types describe the physical design and operational role of the street, Placetypes describe the land use context that surrounds it. The Comprehensive Plan established a Placetype framework to guide future development patterns, intensity, and character across the city. That same framework is used here to ensure transportation decisions align with the land use vision adopted in the Comprehensive Plan.
Placetypes tell us: What kind of place does the street run through?
Used together, they ensure streets and land uses complement one another. This combined approach creates streets that reflect their environment, making them safer, more efficient, and more recognizable to the people who use them every day.
The Street Types framework provides a structured way to align design, mobility, and community character. Each type includes:
• Functional classification: The role of the street within the larger network, such as arterial, collector, or local.
• Design elements: The physical components of the street, such as lanes, medians, sidewalks, bicycle facilities, and transit accommodations.
• Context features: The character-defining elements that connect the street to its surroundings, such as signage, lighting, landscaping, and other placemaking cues.
This framework creates predictability and clarity for engineers, planners, and developers. At the same time, it allows flexibility so that streets can be adapted to fit their context rather than forcing a one-size-fits-all solution. Street Types also play an important role in shaping community identity. By using consistent design elements such as crosswalk patterns, lighting styles, landscaping, and signage, streets can visually reinforce the brand of a city or neighborhood. Coordinated wayfinding, branded street furniture, or distinctive street trees signal to residents and visitors that they are in Westfield rather than a neighboring community. Over time, these details build a sense of place and create streetscapes that are both memorable and recognizable. In this way, Street Types are not only technical classifications. They are also placemaking tools that contribute to neighborhood pride and help define how a community presents itself to the outside world.
Although Street Types are valuable for integrating transportation and community character, they do have limitations:
• Oversimplification: Rigid application can miss the nuances of complex urban environments.
• Equity gaps: If not applied thoughtfully, designs may overlook accessibility or the needs of vulnerable populations.
• Changing conditions: New mobility options, emerging technologies, and future growth may not always fit neatly into existing Street Type categories.
• Misalignment with Placetypes: If applied inconsistently, Street Types may conflict with surrounding land uses, creating tension between how the street functions and how adjacent properties are used.
For these reasons, Street Types should be viewed as a flexible framework rather than a rigid standard. They provide a starting point for contextsensitive design that can evolve as community needs and technologies change. The Street Types Plan Map offers an illustrative example of how the Street Types Plan may be applied across the network, but it is not intended to strictly define outcomes.
While Street Types provide a comprehensive framework for most streets in Westfield, not all roadway categories are represented. US 31 functions as a limited-access freeway under INDOT jurisdiction and is therefore treated as its own distinct facility type. Because its design, access management, and operations are controlled entirely by INDOT, and differ substantially from other streets, it is not detailed within the Street Types framework. Nonetheless, its role as a regional mobility corridor is recognized and considered in broader transportation planning for Westfield.
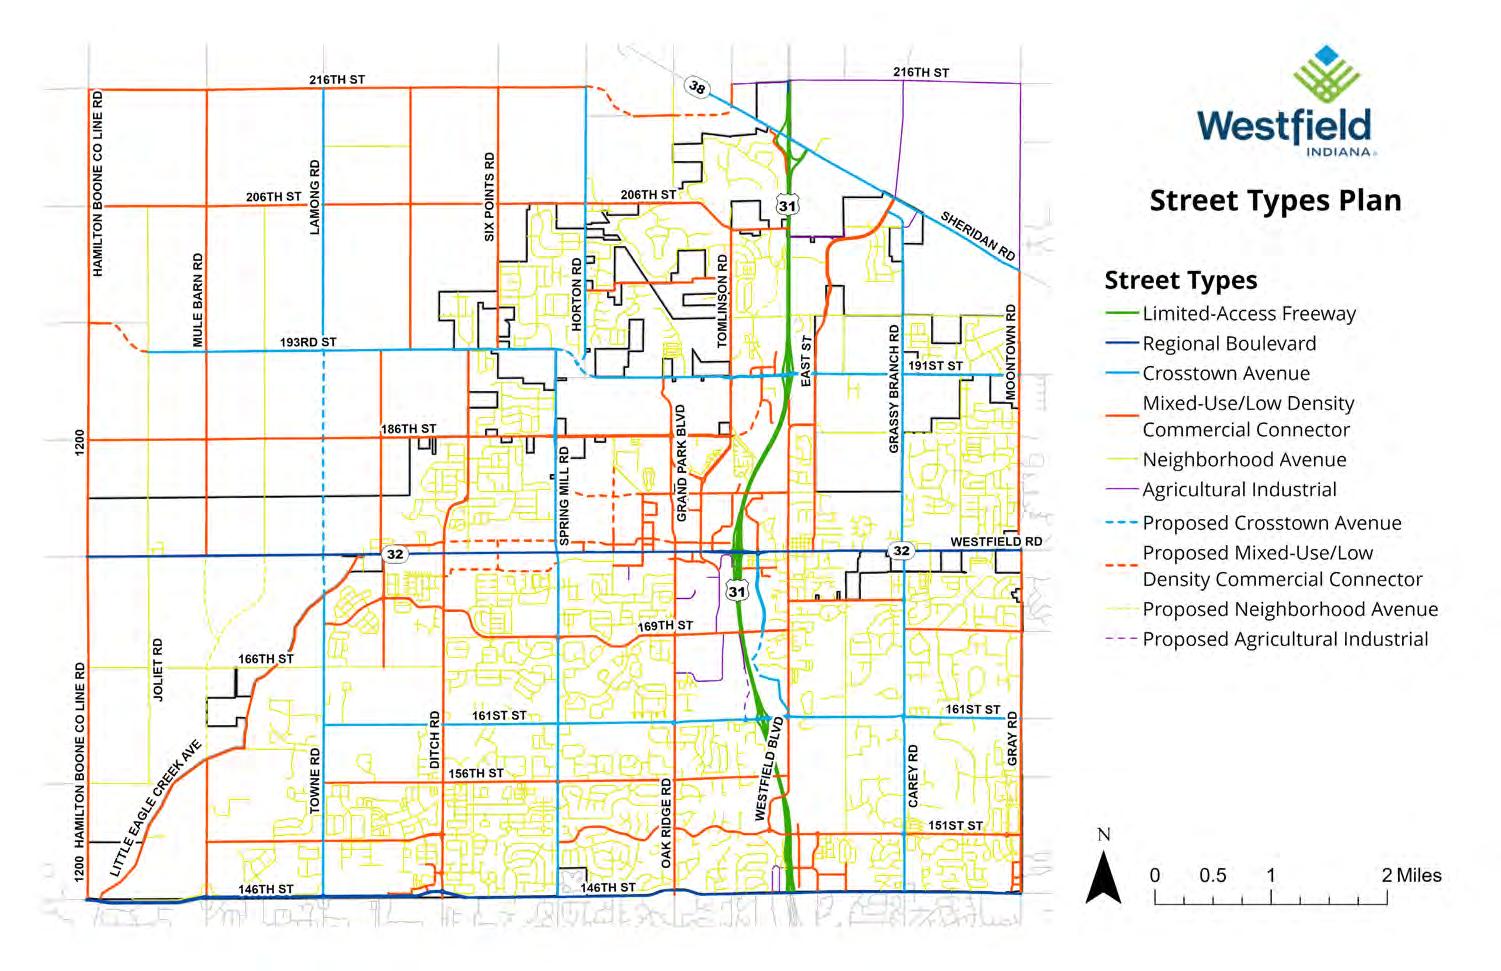
# Width
Regional Boulevard 4+ 10’-12’ Medians with turning lanes.
Crosstown Avenue
2-4 10’-12’ Medians with turning lanes.
Minimal to none.
Loading zones and short-term parking near transit stops. Protected or separated shared-use paths.
Limited onstreet parking near commercial areas as needed. Off street, rear-of-building parking encouraged.
Separated/ buffered bicycle lanes or shareduse paths with buffers.
Advanced crossings (flashing signals, refuge islands).
Roundabouts or signalized. Vehicle scale.
Wide sidewalks 8’ in both directions.
Pedestrian refuge islands when 4 lanes.
Wide sidewalks 8’ in both directions or 10’ shared-use path.
Mixed Use/ Low Density Commercial Connector
2-3 10’-11’
None. May have center turn lanes.
Neighborhood Avenue 2 10’-11’ None.
Limited onstreet parking provided where retail or offices present as needed. Rear-ofbuilding parking encouraged.
Bicycle lanes or shared-use paths where appropriate. Wide shoulders are a possibility.
Wide sidewalks 8’ in both directions or 10’ shared-use path.
Roundabouts or signalized.
Bus turnouts and transit stops. None.
Agricultural Industrial 2 12’+ None.
On-street on one or both sides. Off-street driveways.
Shared lanes
Minimal. Off-street parking/loading at industrial sites. Limited.
Shared paths possible. Wide shoulders.
Shared use path recommended. or sidewalks both sides.
Traffic calming features (trees, curves, and visual narrowing).
Roundabouts or stop controlled.
Balanced pedestrian & vehicle scale.
Bus shelters, turnouts.
On shared-use paths only. Include golf cart crossings where trails cross roadway. Cart allowed at 25mph or less.
Balanced pedestrian & vehicle scale.
Bus stops and shelters integrated as needed.
Stop controlled. Pedestrian scale. None.
On shared-use paths only. Include golf cart crossings where trails cross roadway. Cart allowed at 25mph or less.
Shared lanes. Cart allowed at 25mph or less.
Wide shoulders. Stop controlled or yield. Vehicle scale. None. None.
Regional Boulevard
Regional Boulevards are designed to serve as the City’s primary corridors for regional connectivity and high-volume traffic movement. These streets are built to handle significant commuter and freight activity, often functioning as the main arteries that link Westfield to surrounding communities and employment centers. Their design emphasizes vehicle throughput, with wide travel lanes and medians that facilitate turning movements and reduce conflict points. While their primary role is to move vehicles efficiently, Regional Boulevards also incorporate features that support multimodal travel, including protected shared-use paths and wide sidewalks. These corridors typically include signalized intersections or roundabouts to manage traffic flow and improve safety. Lighting is scaled for vehicles and often includes integrated transit stop infrastructure. Although parking is minimal, loading zones near transit stops or business entrances help support commercial activity. These streets are also capable of accommodating high volumes of trucks and buses, and in some cases, may include golf cart paths if adjacent neighborhoods support their use.
• Travel Lanes: 4+ (10’-12’)
• Medians: Medians with turning lanes
• Parking: Minimal; loading zones near transit stops or business entrances
• Bicycle Facilities: Protected/shared-use paths
• Pedestrian Infrastructure: Advanced crossings, wide sidewalks
• Intersection Controls: Roundabouts or signalized intersections as needed
• Lighting: Vehicle scale; bus turnouts and transit stop integrations
Other Considerations:
• Accommodates high volumes of trucks and buses
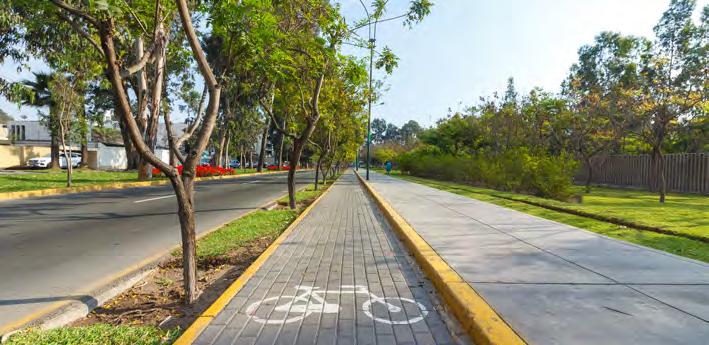
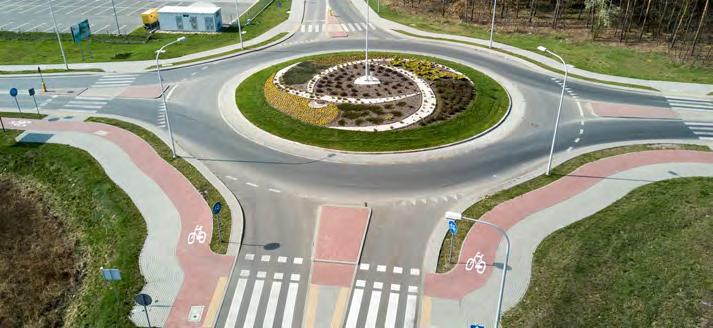
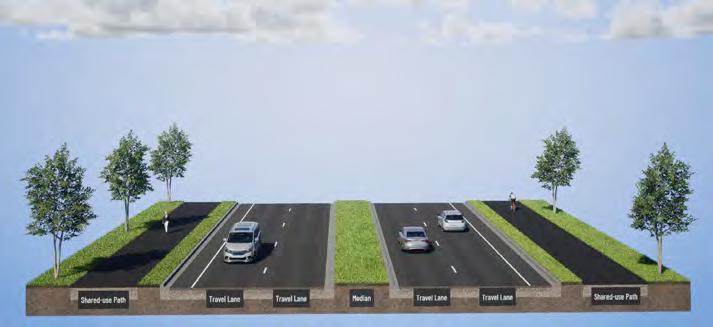
Crosstown Avenues are essential connectors within Westfield’s transportation network, linking residential neighborhoods to commercial centers and arterial roads. These streets are designed to balance moderate vehicle flow with strong support for pedestrian, bicycle, and transit access. Their lane configurations are flexible, typically ranging from two to four lanes depending on context and demand. Crosstown Avenues often feature buffered or separated bicycle lanes and wide sidewalks on both sides, making them comfortable and safe for non-motorized users. On-street parking is available near commercial areas, and intersections are managed with roundabouts or signals that include marked crosswalks. Lighting is scaled to both vehicles and pedestrians and is often integrated with street trees to enhance the corridor’s character. These streets are suitable for mixed traffic, including moderate freight movement, and may include golf cart accommodations where appropriate. Their design supports both mobility and placemaking, making them vital for connecting people to destinations across the city.
• Travel Lanes: 2-4 (10-12 feet)
• Medians: Medians with turning lanes
• Parking: On-street parallel parking
• Bicycle Facilities: Separated/buffered bicycle lanes
• Pedestrian Infrastructure: 8’ sidewalks on both sides
• Intersection Controls: Roundabouts/signalized with marked crosswalks
• Lighting: Street tree canopy and pedestrian-scale lighting
Other Considerations:
• Suitable for mixed traffic including moderate freight
• Conditional golf cart facilities integrated with street/network design
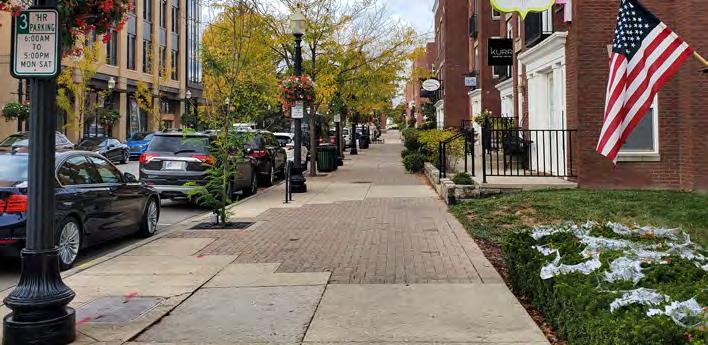
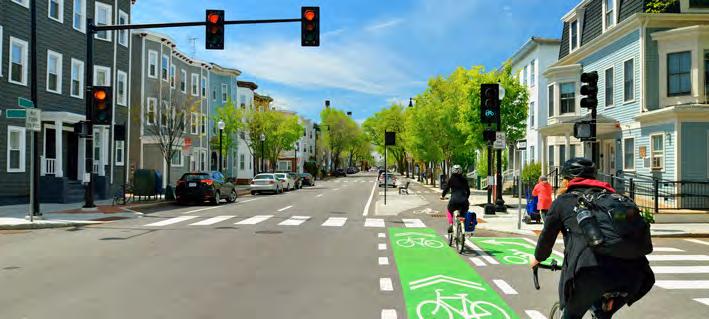
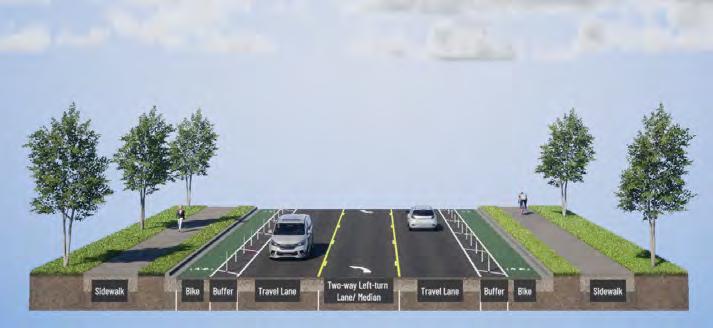
Mixed Use and Low-Density Commercial Connectors are tailored to areas where residential, commercial, and office uses are integrated. These streets are designed to support a balanced flow of vehicular traffic while prioritizing pedestrian and bicycle access. Their configuration typically includes two to three travel lanes, with center turn lanes where needed to facilitate access to adjacent properties. On-street parking is provided in areas with retail or office uses, and rear-of-building parking is encouraged to support walkability and reduce visual clutter. Bicycle facilities may include buffered lanes or shared-use paths, and sidewalks are wide enough to accommodate pedestrian activity comfortably. Intersections are managed with roundabouts or stop controls, depending on traffic volumes and surrounding land use. Lighting is designed to provide adequate illumination for both vehicles and pedestrians. These connectors play a key role in supporting vibrant mixed use environments and encouraging active transportation within Westfield’s growing commercial districts.
• Travel Lanes: 2-3 (10’-12’)
• Medians: None, turning lane if needed
• Parking: On-street parallel parking when retail or offices are present
• Bicycle Facilities: Buffered bike lanes preferred
• Pedestrian Infrastructure: Wide sidewalks
• Intersection Controls: Roundabouts or signalized
• Lighting: Adequate roadway illumination
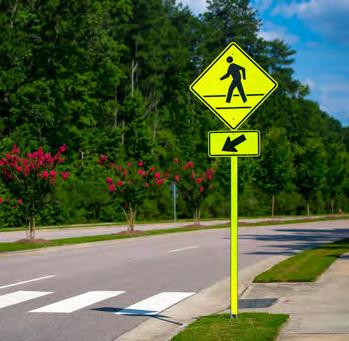
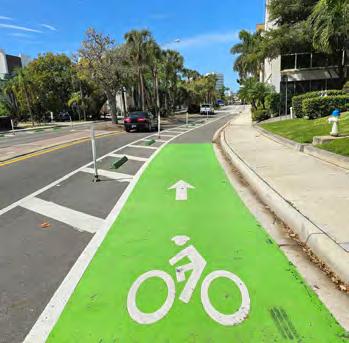

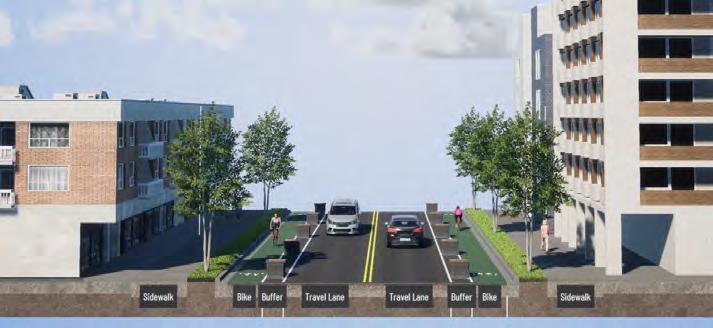
Neighborhood Avenues are the primary streets within Westfield’s residential and mixed use neighborhoods. These streets are designed to support local travel and provide safe, comfortable access to schools, parks, and community destinations. With two travel lanes and a narrower cross-section, Neighborhood Avenues promote slower vehicle speeds and a more pedestrian-friendly environment. On-street parking is typically available, and bicycle facilities may include shared lanes or off-street shared-use paths. Sidewalks are provided on both sides of the street, often accompanied by traffic calming features such as street trees, curves, and visual narrowing. Intersections are stop-controlled to reinforce neighborhood-scale traffic patterns, and lighting is pedestrian-scale with lower mounting heights to support visibility and safety. These streets may also include golf cart accommodations and additional traffic calming elements based on community preferences. Neighborhood Avenues are central to creating safe, livable, and connected residential areas.
• Travel Lanes: 2 (10-11 feet)
• Medians: None
• Parking: On street
• Bicycle Facilities: Shared lanes; off-street shared-use paths
• Pedestrian Infrastructure: Sidewalks on both sides; traffic calming features
• Intersection Controls: Stop controlled
• Lighting: Pedestrian scale; lower mounting height
Other Considerations:
• Conditional add-ons for golf carts and traffic calming features encouraged
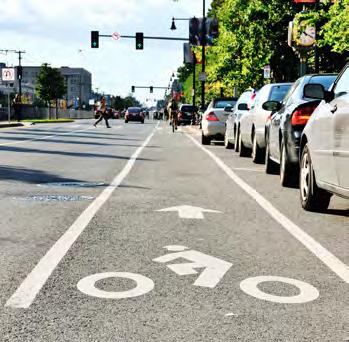
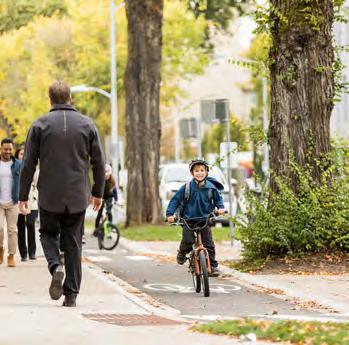
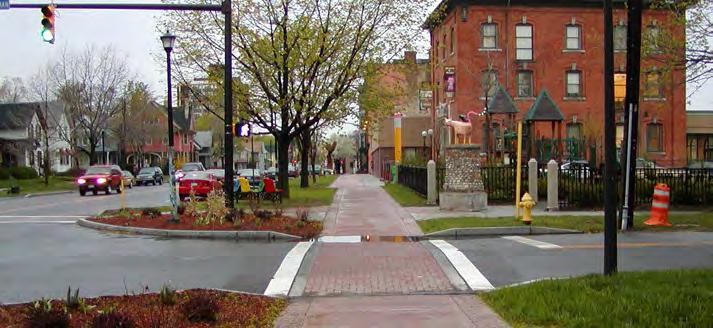
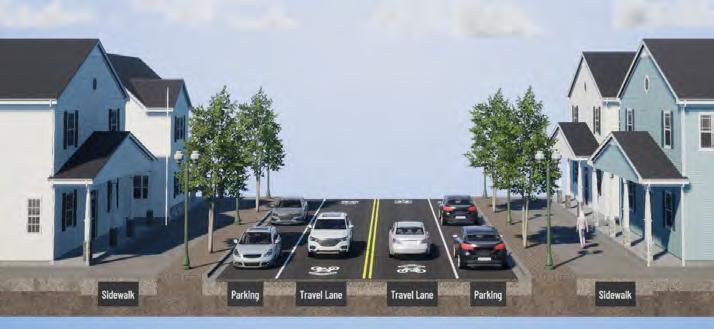
Agricultural and Industrial streets are designed to support the heavy vehicle traffic associated with farming operations and industrial facilities. These roads feature very wide travel lanes to accommodate large trucks, equipment, and farm machinery, with a design that prioritizes durability and operational efficiency. Medians are not included, and on-street parking is minimal, with loading and parking typically provided on site.
Bicycle and pedestrian facilities are limited; however, wide shoulder or shared paths may be considered appropriate to support rural connectivity or informal walking and biking. Pedestrian infrastructure is generally minimal, consistent with the low-density and industrial context. Intersections are typically stop-controlled or include caution signage, and lighting is functional and focused on safety at key locations rather than continuous illumination.
These streets play a critical role in facilitating freight movement, industrial access, and agricultural operations. Their simple, flexible design ensures safe, efficient travel in environments where traffic volumes are low, but vehicles are large and operational impacts are high.
• Travel Lanes: 2 (12 feet or wider)
• Medians: None
• Parking: Minimal on-street; off-street parking provided
• Bicycle Facilities: Limited; shared paths or wide shoulders where appropriate
• Pedestrian Infrastructure: Minimal, shoulders may serve as walking space
• Intersection Controls: Stop controlled, caution or yield signage
• Lighting: Functional lighting prioritizing operational needs
Other Considerations:
• Supports freight and industrial vehicle movement and accommodates farm equipment
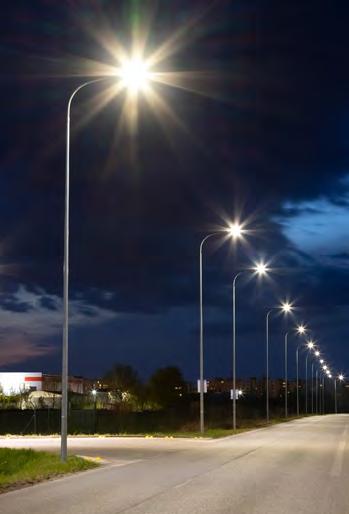
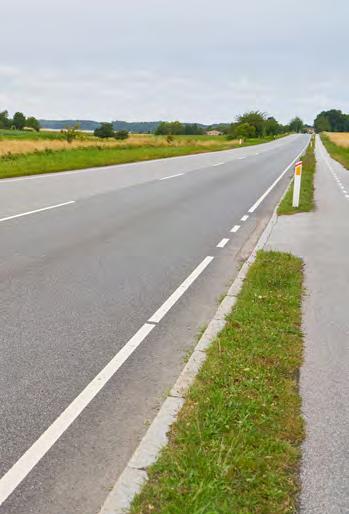
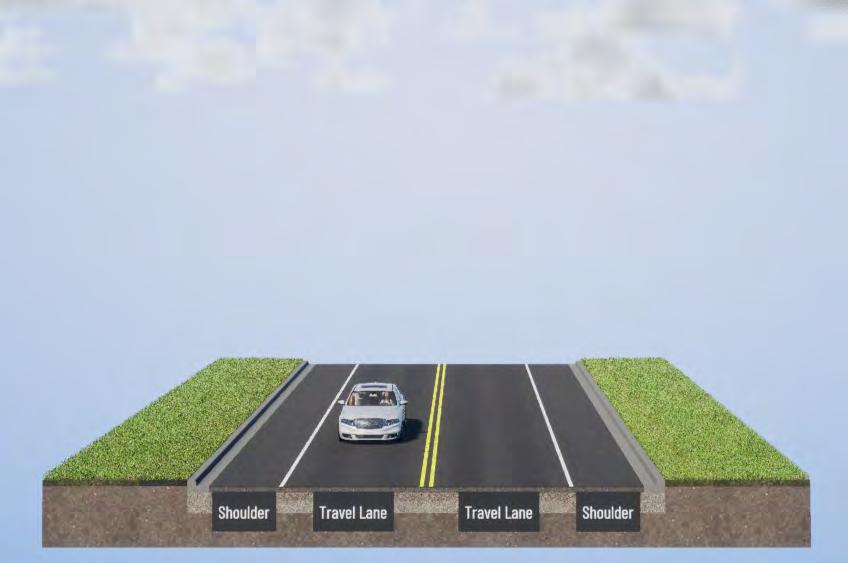
Westfield’s transportation strategy is built around the goal of modernizing the City’s street network to support safe, efficient, and multimodal travel. The Plan aims to reduce car dependency, improve infrastructure for pedestrians and cyclists, expand transit options, and integrate transportation with land use patterns that support housing, employment, retail, and services.
Implementation begins with a recommendation for adoption by the Advisory Plan Commission, followed by ordinance adoption by the City Council. After adoption, the city should update local ordinances as needed to fully align with the transportation plan. Continued coordination with The Indianapolis Metropolitan Planning Organization and the Indiana Department of Transportation will help ensure that regional planning efforts reflect Westfield’s priorities and that any recommended functional classification updates are reviewed appropriately.
The city should continue regularly evaluating changes in land use, traffic patterns, and regional growth. This ongoing monitoring will allow Westfield to maintain the effectiveness of the transportation network and to update the Plan as needed to address evolving mobility needs. The following objectives and action steps outline how this vision will be achieved.
Westfield’s transportation strategy focuses on the modernization of the street network, ensuring the safe and efficient flow of traffic for all modes, reducing car dependency and supporting higher density housing types through improved pedestrian and bicycle infrastructure, enhanced transit service, and mixed use development patterns that integrate with housing, employment, retail, and service opportunities.
Objective 1: Maintain and modernize the street network to provide for current and future transportation needs that ensure safety for all modes of transportation.
As Westfield grows, its street network must evolve to meet increasing demand and change land use patterns. The City’s grid of arterial and collector roads provides a strong foundation, but targeted improvements are needed to ensure that all modes of transportation are accommodated safely and efficiently. This includes addressing congestion at key intersections, improving connectivity across the city, and preparing for future growth.
Action Steps:
1. Right-size roadways based on the density and intensity of users, ensuring that truck routes and residential streets are appropriately scaled.
2. Expand the road network to include more east-west connections and additional north-south corridors on the west side of the city.
3. Add electric vehicle (EV) charging station standards to the zoning ordinance to support sustainable transportation.
Objective 2: Establish street design standards including traffic calming tools, landscaping, and lighting standards to enhance safety and the user experience.
Design plays a critical role in shaping how streets function and how safe they feel for all users. Westfield will adopt street design standards that incorporate traffic calming, landscaping, lighting, and wayfinding to enhance both safety and the user experience. These standards will help reinforce the character of different neighborhoods and support placemaking goals.
Action Steps:
1. Develop gateway branding and wayfinding signage to create a sense of arrival and improve navigation.
2. Use design tools such as curving streets and chicanes to slow traffic speeds in residential areas.
3. Implement pedestrian safety features through traffic calming methods, such as curb extensions or crossing islands.
4. Install pedestrian-activated signals at mid-block crossings to improve safety and visibility.
5. Replace traditional four-way stops with roundabouts at appropriate intersections to improve traffic flow and reduce crash severity.
6. Apply visibility standards for landscaping and signage at intersections to ensure clear sightlines.
7. Use dark sky lighting standards to balance safety with low light levels in residential areas.
Objective 3: Create a comprehensive trails plan for trail development and design.
Westfield’s trail system is a key component of its multimodal transportation network. With over 80 miles of trails and 278 miles of sidewalks, the city has made significant progress in supporting active transportation. The next step is to develop a comprehensive plan that closes gaps, improves connectivity, and enhances the quality of trail infrastructure.
1. Inventory and map all existing trails in GIS including year built, width, material, condition, ownership, and maintenance plans.
2. Update the township-wide trails master plan that identifies priorities for expansion and improvement.
3. Fund and build out missing segments in the named trail and perimeter trail network.
4. Update trail design standards that support safe use by pedestrians, cyclists, golf carts, and other micro-mobility options.
5. Increase the use of user-friendly wayfinding signage that provides directional information and distance markers.
6. Incorporate interactive elements, public art, and unique lighting features to enhance the trail experience.
7. Educate the public about safe trail use and trail etiquette to promote shared responsibility and enjoyment.
While Westfield does not currently operate a fixed-route transit system, there is growing interest in expanding mobility options beyond personal vehicles. Public transportation can help reduce congestion, improve access to destinations, and support equitable mobility for residents of all ages and abilities.
1. Conduct a feasibility study for a shuttle or trolley service between Grand Park and downtown Westfield during major events to reduce parking demand and support tourism.
2. Install bike share stations at key destinations including downtown, Grand Park, the YMCA, and the library to support short-distance travel and active transportation.
3. Participate in regional planning efforts to explore future public transportation options that connect Westfield to neighboring communities.
In general, Chapter 2’s Vision and Values and Chapter 3’s Themes and Goals set the direction for Westfield’s future. Chapter 4’s placetypes show a new method for the community to think about how to utilize land in the future. This approach integrates land use with mobility, economic activity, and development character to direct future land use growth. Chapter 6, “Connecting It All Together,” is about the policy and recommendations that help create and define the many parts of the city. These are the most important aspects of building blocks of how the city evolves, how different sorts of places feel and work, and how different portions of the city are linked and related to each other. In essence, these chapters together form the overall connective fiber for the future development of Westfield.
There are many levels of connectivity that forms the physical city. Streets, sidewalks, open space, drainage systems, and utilities connect all the various places of the city. People who live and work in Westfield need a safe and easy way to get around. Businesses also need a good transportation system to move people and goods. Shared resources such as parks, public safety, recreation facilities, libraries, public art, events, and programs, help strengthen the city’s sense of connection.
The local economy connects to all of Westfield’s neighborhoods throughout the city and to the rest of the region. When private companies invest, they often look at many factors beyond the property itself. When deciding where to put their operations, employers consider such factors as the availability of a skilled workforce in the area, easy access to the region’s transportation network, nice neighborhoods for their employees to live, and active mixed use areas where they may put their facilities. While no single placetype can achieve all these objectives, together they form a cohesive and resilient local economy.
This section provides a high-level analysis of foundational plans, studies, and initiatives that inform Westfield’s development strategy. This review synthesizes insights from previously adopted documents, comprehensive plans, thoroughfare plan, downtown plan, parks and recreation plan and stormwater strategy, to establish a framework for understanding current opportunities and challenges.
By evaluating the alignment of key projects, such as trail and roadway expansions and the Grand Park development, with overarching community goals, this section identifies how past planning efforts and policies continue to shape Westfield’s landscape. The analysis aims to ensure continuity, avoid duplication, and prioritize strategic investments that resonate with the city’s growth and quality-of-life aspirations.
For a full summary of the plans and their addendums, please see the Appendix.


While the overall planning jurisdiction of Westfield-Washington Township hasn’t changed, the City has grown not only in population, but also geographically, annexing additional property from Hamilton County.
The land use pattern has changed significantly over the years. This requires specialized subarea plans due to the transformative change based on some of these initiatives. These specialized subarea plans have led to several amendments to the existing comprehensive plan, resulting in subarea plans completed for many different areas within Westfield including Family Sports Capital, Grand Junction, Family Sports Capital 2, Grand Junction Implementation Plan, Spring Mill Station, Grand Junction Sub-district, and Village Farms. Each of these subarea plans support the development of different aspects of the city and provide more depth and detail than is normally found in a comprehensive plan.
The comprehensive plan is a strategic document aimed at guiding growth and development while maintaining the area’s character and livability. It highlights themes such as promoting contiguous development, preserving rural and small-town atmospheres, and encouraging connectivity through enhanced transportation and pedestrian networks. The plan emphasizes land use diversity, balancing residential, commercial, and recreational spaces to meet the needs of a growing population. Key objectives include preserving natural areas, ensuring fiscal responsibility in new developments, and using innovative planning tools like conservation subdivisions to blend growth with environmental preservation.
The plan comprises four chapters: an introduction framing the vision and themes, a detailed land-use strategy, a specific focus on revitalizing the downtown area, and an implementation framework. Policies are aimed at managing growth sustainably, fostering connectivity between neighborhoods, and ensuring development aligns with the township’s infrastructure capacity. The document incorporates extensive public input and serves as a guide for zoning, subdivision regulations, and infrastructure planning to support a thriving, balanced community.
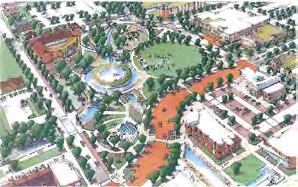
This addendum establishes a longterm vision for the Grand Junction project including Grand Junction Plaza, landmark-quality civic facilities, an extended trail system, an extended street network, enhanced stormwater facilities, signature gateway development, and sustainable design and development. It is structured for short-term improvements, intermediate-term improvements, and long-term improvements. These addendums provided the foundation to help redevelop Grand Junction into what it is today.
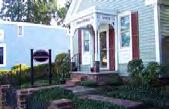
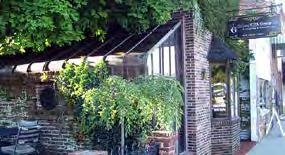
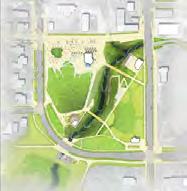


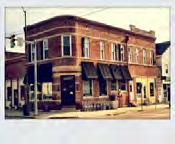
This plan establishes sub-districts including the Gateway, Junction, Union, Kendall, and Neighborhood sub-districts. Each sub-district includes a distinct vision, land uses, and development standards. This addendum established the foundation for coordinating city-wide decision making.
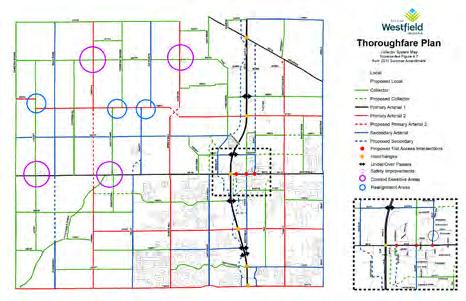
(2006, 2009, 2010, 2011, 2013)
The road network in Westfield has changed significantly over the years to support the development pattern. The greatest impact came from the upgrade of US 31 into a limited access freeway which also contributed to additional growth in the jurisdiction. Amendments were made to further enhance connectivity between developments and to accommodate the amount of traffic generated from large land uses such as Grand Park. The amendments also take a more complete streets approach to transportation and accommodate bicycle and pedestrian facilities within City-led and developer-led projects.
The 2006 Thoroughfare Plan for Westfield-Washington Township establishes a strategic framework for managing transportation infrastructure to support anticipated growth and regional connectivity. It emphasizes a functional classification system for roadways, which includes primary and secondary arterials, collectors, and local roads, aimed at balancing mobility with accessibility. The plan identifies critical projects such as:
• Upgrading to US 31 to freeway standards
• Enhancing east-west traffic flow
• Incorporating alternative transportation routes like trails and bicycle paths to improve multi-modal connectivity
The plan also integrates right-of-way preservation standards to accommodate future infrastructure needs and emphasizes collaboration with regional stakeholders, including INDOT and neighboring jurisdictions, to ensure cohesive development. Bicycle and pedestrian enhancements, including the Monon Trail and Midland Trace Trail extensions, align with broader regional initiatives to promote walkability and recreational opportunities. The recommendations aim to ensure sustainable, efficient, and safe transportation solutions that align with the area’s land-use patterns and growth projections.
The 5-Year Parks and Recreation plan is a guide for the Parks Board and Parks Department established in 2024. Prior to then the parks operated under Public Works. The purpose of the plan is to chart a path forward for the department and the board, document the initial state of Westfield Parks and set a near-term plan. The mission is to enhance the quality of life by connecting residents and visitors of Westfield to each other, the natural environment, and unique recreation amenities. Maintenance of the parks has historically been contracted to vendors and 70 percent of the park’s operating budget is for maintenance. The budget of $3.44 million in 2025 was funded through the general fund, local income tax, and one-time impact fees. The impact fee is $3,458.34 per new residential unit. There are nine parks’ departments in Hamilton County and three have overlapping jurisdiction in Westfield: the city, the township, and the county. The survey found residents aren’t concerned with “ownership” of the parks and consider jurisdictional boundaries, even with other communities, to be permeable when it comes to park access. Priorities established in the plan were: land acquisition (identified as the most significant challenge), completing Simon Moon Park, developing Armstrong and Osborne Parks, completing Grand Park, accommodating increased demand for splash pads and shelters, and stewardship of tax dollars. An observation was made that the department’s staffing is low relative to other similar jurisdictions.
The downtown redevelopment plan is a vision for the growth of downtown Westfield over the next two decades. It establishes a vision that downtown will…
• Be a walkable community that connects memorable places
• Capitalize on the green investments and amenities
• Shift the center of development to create identity, places, and experiences.
The plan creates core opportunities from challenges that include a walkable community, attachment to place, a unique downtown identity, capitalizing on the green investment, connecting ‘here’ to ‘there,’ and shifting the center of development. It addresses walkability, in part, though a downtown loop of linked multi-use trails that act as a bicycle and pedestrian ring road around downtown. Development plan areas include the downtown core, State Road 32/Main Street, residential/general infill, Creekside residential, and the legacy and historic core. The plan proposes catalyst projects of the Carnegie Plaza block, the bank block, parking garage integration, and public space enhancements. It establishes design guidelines for downtown development.
Storm Water Quality Management Plan (2023)
The Water Quality Characterization Report (WQCR) and Stormwater Quality Management Plan (SWQMP) were developed for the City of Westfield as part of compliance with the NPDES Phase II MS4 General Permit requirements. The purpose of the study is to access water quality and potential pollutant sources, develop management plans for reducing stormwater pollution, and to align with regulatory updates under the MS4 general permit. The report documents existing conditions, land use and watersheds, water quality findings, identifies sensitive areas and potential pollution sources, and identifies potential stormwater management measures. The plan is designed to:


• Mitigate development impacts
• Improve water quality in impaired streams
• Ensure compliance with state and federal standards.
Strategies include increased inspections, targeted education, and systematic updates to infrastructure and policies.
Hamilton County Tourism and the City of Westfield partnered to complete an area-wide master plan for future destination development in Westfield. The study included a market supply and demand analysis that revealed there is strong demand for residential/multifamily housing, hotels, unique retail, traditional retail and restaurants, corporate flex/research and development space, and parks, trails, and natural/destination assets in the area. There were three phases of work presented, Phase 1 being years 1-3, Phase 2 being years 3-7, and Phase 3 being years 7-10. It indicated full build out of retail at 250,000 sq.ft., office at 224,000 sq.ft., residential at 920 units, and 200-300 keys of hotel rooms. These concepts will be incorporated into the placetypes within this updated comprehensive plan.
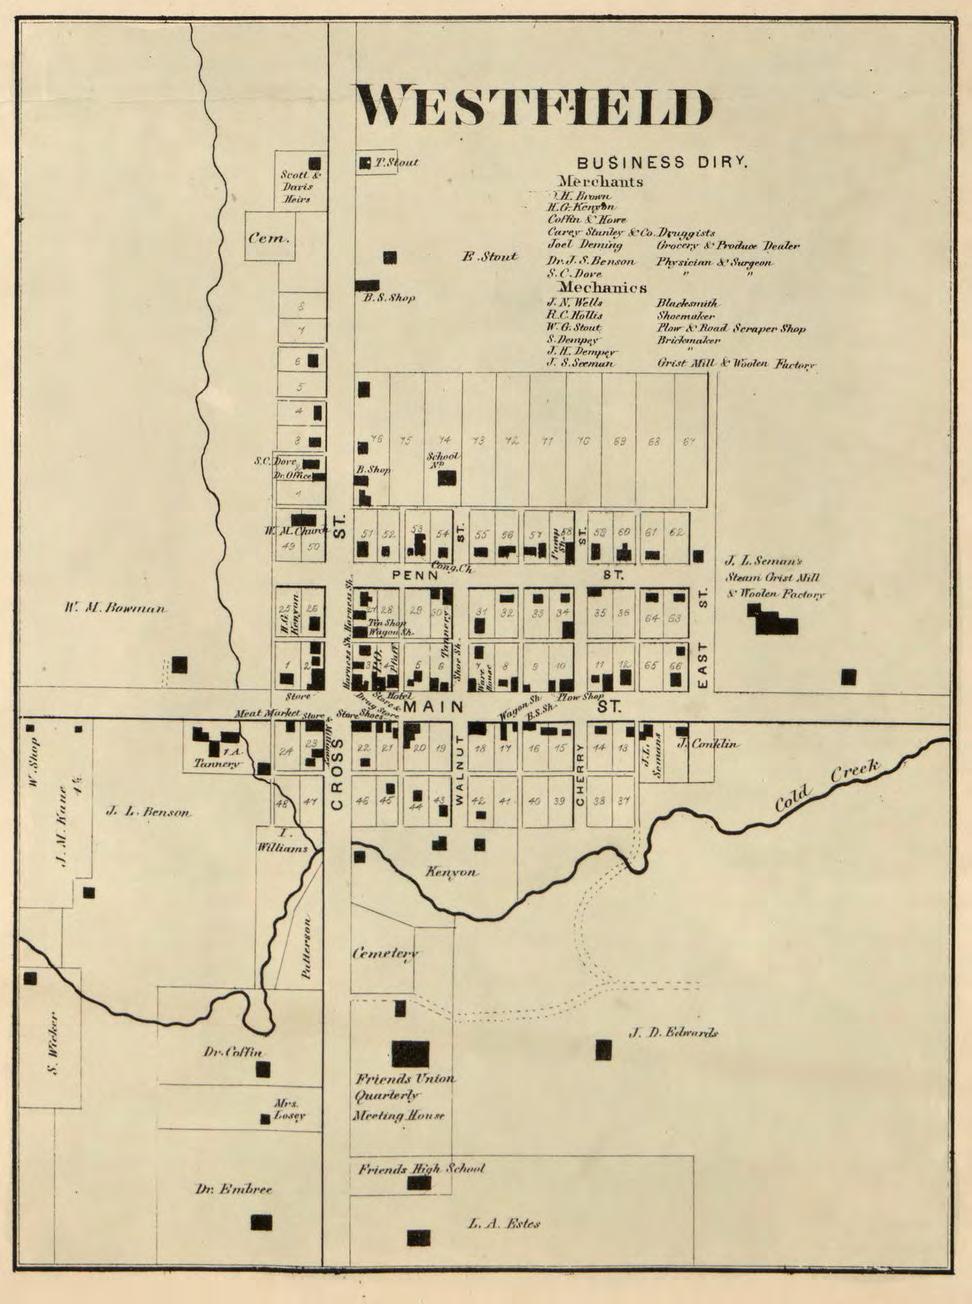
Westfield began as a small agricultural community in Hamilton County, distinct from nearby Noblesville, Carmel, Fishers, and Sheridan.
Westfield had a small downtown located at State Road 32 and Union Street with a few businesses and a post office. Growth began at a significant rate in the late 1990s. The city had 2.4 square miles of land with a total population of 3,304 (1,337 people per square mile). By 2000, the land area had grown to 7.6 square miles with a population that had close to triple with 9.293 residents (1,220 people per square mile). This growth was primarily residential growth as families were looking for newer and larger homes in a desirable school district and convenient access to Indianapolis. Westfield’s growth started later than Carmel and Fishers as they were closer to Indianapolis and I-465.
In reviewing the historic annexation of the city, the growth started south of the city, down US 31, and to the west along State Road 32. In the next decade, Westfield annexed over 19 square miles, to the west, south, and east. Unlike other communities where subdivisions are built under traditional zoning classifications, developers in Westfield were encouraged to use the Planned Unit Development (PUD) zoning to increase the quality of housing, develop amenities for residents, along with much needed infrastructure improvements. Each PUD was approved with its own set of governing regulations as the city aimed to promote development that reflected unique character rather than uniformity. This is what shaped Westfield today.
Westfield geographically expanded through annexation and changed the form of government from a town to a city in 2008.
Knowing that the city needed to diversify its economy to support its growing residential base, the mid 2000s brought the vision of the youth sports capital that became Grand Park. The focus of the community and the city’s investment was the development of the Grand Park Sports Campus. Grand Park shifted some of the development pressure westward across US 31 with a significant node developing along State Road 32 at the southern edge of Grand Park. The investment brought millions of visitors to the community
for sports league play and tournaments. Partnerships with the Indiana Pacers, Indy Eleven, and Indianapolis Colts created another set of visitors to the area. This new vision and facilities necessitated the development of hotels and restaurants, and the Westfield economic development strategy became linked to tourism. As housing growth continued and regional demographics shifted there was a need for multifamily housing and housing for older adults who wanted to be close to their grandchildren and participate in their sports activities.
With the investment in the Grand Plaza area, and that vision continuously evolving, Westfield strategically prioritized investment in its downtown area, beginning with Grand Junction Plaza. Park Street became restaurant row, the expansion of the Westfield Washington Public Library, street and pedestrian improvements, and private investment (e.g. the Union at Grand Junction, Ambrose on Main, The Grand on Main, and Park + Poplar) are reinventing downtown. It is also shifting the area to a mixed use walkable community that emphasizes urban design and increased density and intensity of uses.
Washington Township Villages
In the township, there are existing unincorporated villages in Washington Township – Eagletown, Hortonville, Jolietville, and Lamong which have histories of their own and are facing development pressure as Westfield grows. Over the years, there has been little growth and
development in these areas. However, with the continued expansion of the city westward, these communities need to be carefully planned to preserve the history that remains and ensure that new development blends with the old.
Westfield has an opportunity to be different than its neighbors with thoughtful decisions about the character of the development, its intensity, and how neighborhoods develop. This includes how neighborhoods develop and connect. Where and how business and services growth occur in the community is also an opportunity.
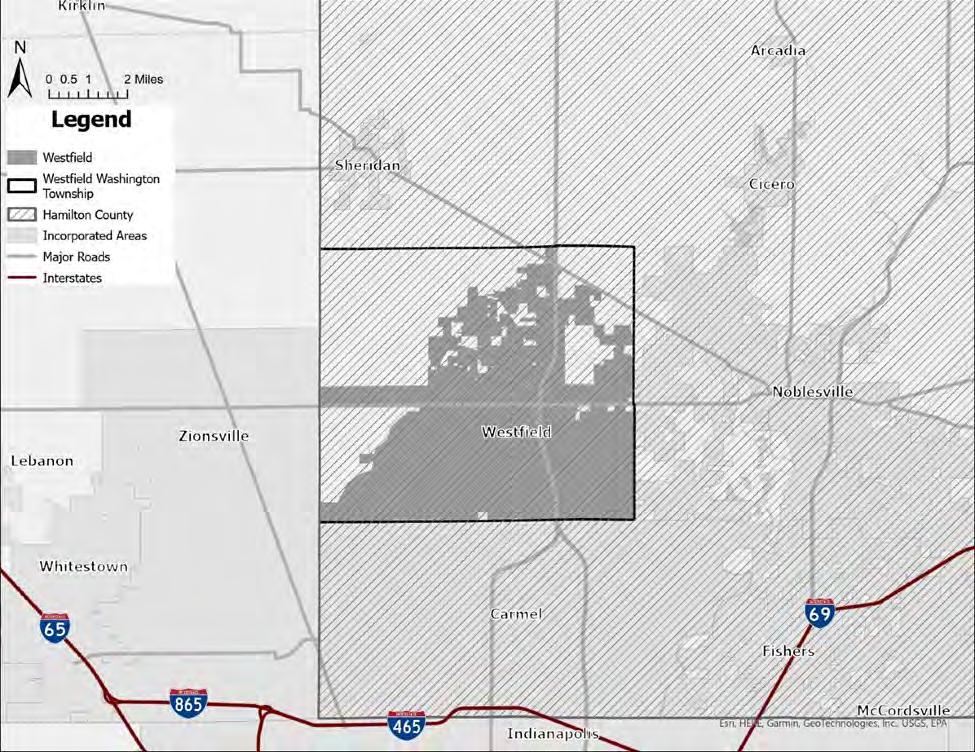
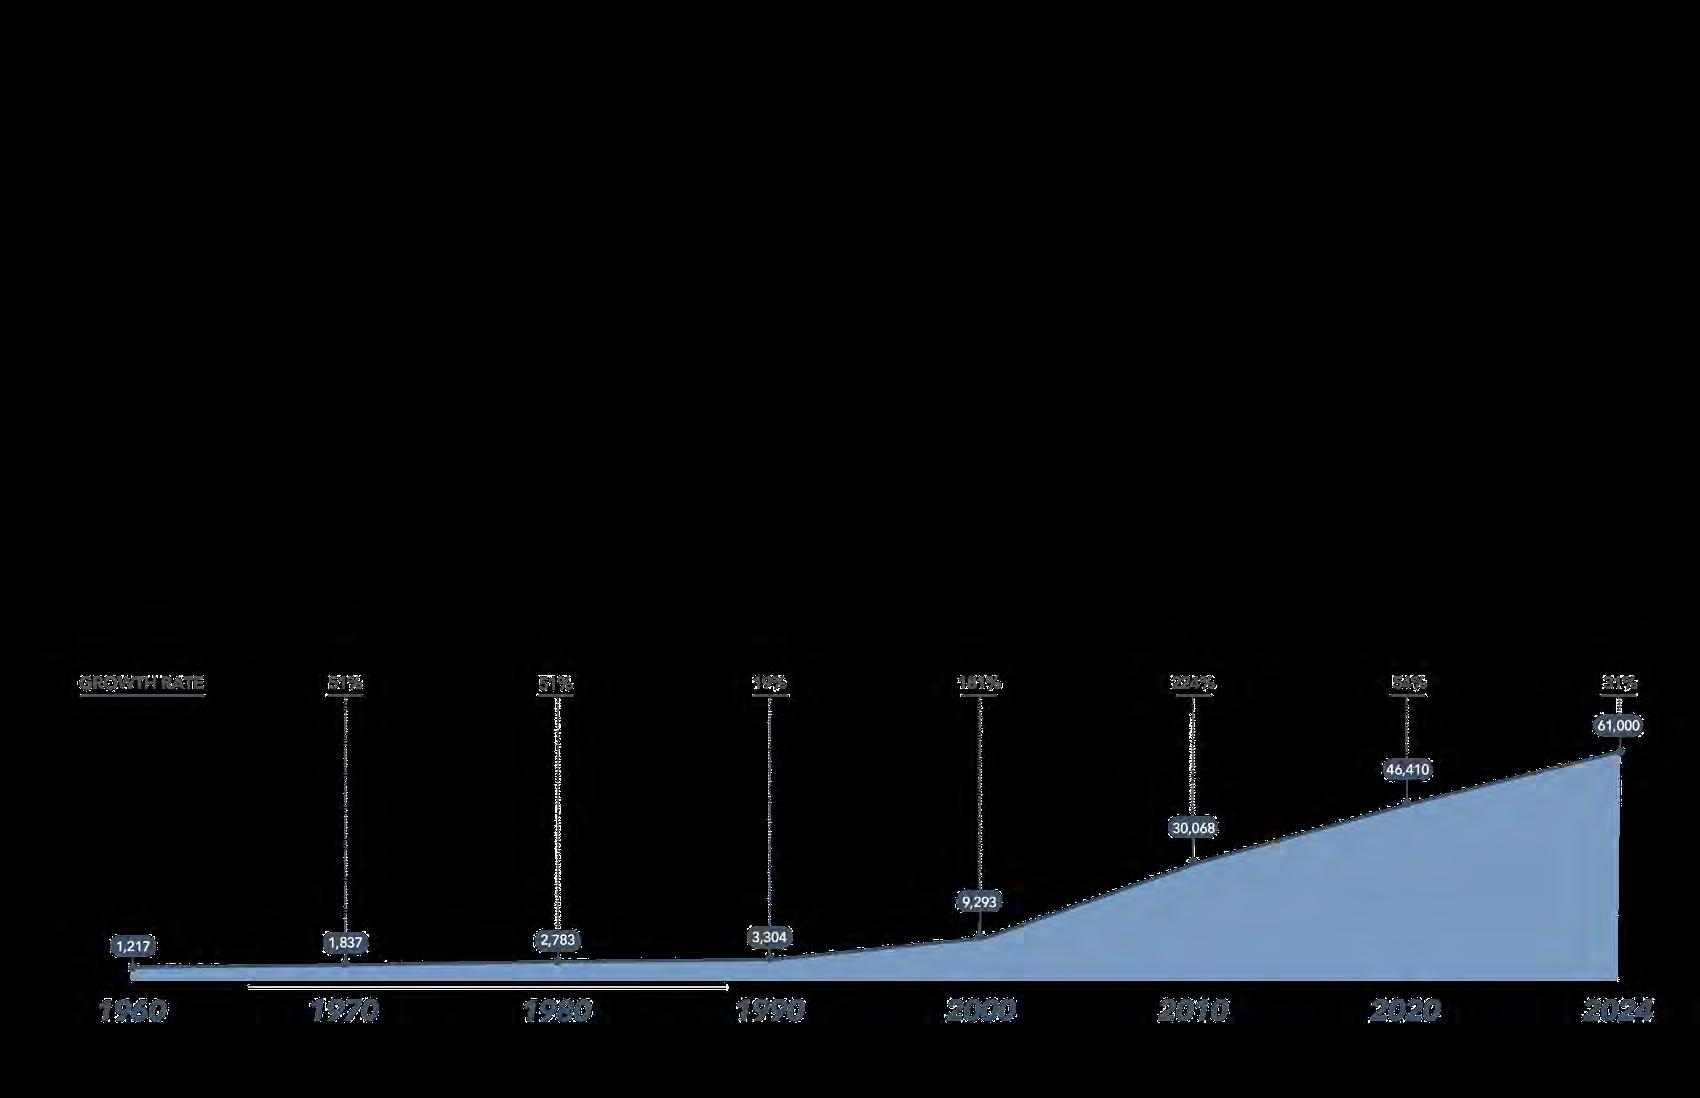
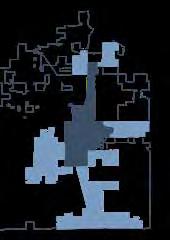
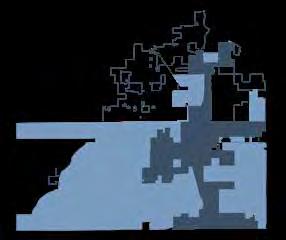
Over the past 50 years, Westfield has grown in land area and population from a small town in the 1960’s to the second-class city it is today. Growth was slow and steady between 1960 and 1990, but in the 1990’s, the city began rapidly expanding along major transportation corridors US 31, State Road 32, State Road 38, and 146th Street, nearly tripling in size and population by year 2000. Continued annexation in the 2000’s and 2010’s tripled the population again, expanding city limits southwest and along State Road 32 up to Boone County. Though city boundary growth slowed in the early 2020’s, the population continued to increase by another 15,000 residents for a total of 57,065 residents in 2024.
In 1977, Westfield took charge of planning and zoning activities in Washington Township through a joinder agreement that provides Westfield will have jurisdiction over planning and zoning in the township until such time that the community has annexed the entirety of the township or the agreement is terminated. This was done to be proactive about managing growth. There are still parts of Washington Township that are surrounded by the City of Westfield but not part of the city. Changes to Indiana’s annexation statute over the past few decades have limited annexation to voluntary annexation that occurs primarily with proposed development, excluding the ability to annex land in which the property owner does not want to be annexed.
The city has long maintained a sense of cooperation and coordination as regional growth and development has evolved over the decades including strong participation in the Indianapolis Metropolitan Planning Organization (IMPO), the Central Indiana Regional Transportation Authority (CIRTA), and, more recently, the Central Indiana Regional Development Authority (CIRDA). Many of the adjacent communities have experienced similar growth. Each has approached growth management and land developments bit differently.
While rapid population growth can impact local services, transportation and nontransportation infrastructure, and housing, it also presents opportunities for collaboration and choice regarding a diversity of jobs, neighborhoods, and shopping experiences for residents and visitors. Westfield’s planning perspective has been one that examines the larger picture to determine what improvements are needed that would not only benefit Westfield but the region. Most of this strategic thinking has occurred with transportation and trail systems, utility systems, recreation systems, and economic initiatives. Through this plan, Westfield will continue to add to the region, achieving regional goals, and being rewarded with the benefits. Additionally, compared to its adjacent communities, Westfield’s opportunities lie in the fact that it still has a lot of land area to be developed. Westfield has shifted to building density at its core and creating more urbanized, mixed use village centers to meet the needs of its residents and future population growth.
Westfield has committed to creating more compact development footprints to enhance walkability of areas within its community. This means vertical mixed use development to efficiently use public infrastructure and support walkability. It also means ensuring that trails and sidewalks are connected to a larger system and providing other mobility opportunities than just the car. Westfield will need to rely on private development that creatively and appropriately increases density to support parking garage facilities within a development mix, while the city finds ways that residents and visitors can park once and navigate certain areas of the city like the Grand Park Sports Campus and Downtown among other areas within the city.
Economic development is a shared endeavor between the City of Westfield and key partnerships with organizations and businesses to create and maintain jobs, increase the tax base, and provide an overall standard of living. Economic development focuses on more than just economic output—it also focuses on qualitative improvements for better social, governmental, and environmental conditions.
Westfield demonstrates exceptional growth momentum with $1.5 billion in economic development investment (GrandPark.org) from 2007-2025, and population growth to 57,065 residents (2025, westfieldecdev.com), creating a strong foundation for continued development success. The community’s unique competitive advantages include Grand Park Sports Campus, educational excellence (98.59% graduation rate), pro-business climate, and strategic location providing access to Indianapolis while maintaining a distinct community character. Westfield represents one of the most compelling market development opportunities in the Indianapolis metropolitan region, with exceptional potential for continued growth and development success.
Westfield’s major development opportunities are in mixed use development, tourism, healthcare, technology, manufacturing, biotechnology, commercial and retail development, and residential diversification. The expansion of Grand Park Sports Campus provides sports and recreation tourism with a regional and national impact. Community Health Network has expanded their campus and specialty medical services. Westfield is becoming a technology and innovation hub, leveraging the educated workforce and pro-business climate to attract emerging high-value market sectors. Westfield is expanding manufacturing uses, building upon the success of Abbott Labs, Aptiv, IMMI, and
Isotopia, and similar businesses. New retail and commercial growth are supported by a robust consumer base. There are also opportunities for residential development and diversification to expand the housing supply to include multiple price points and housing types.
Westfield has some development challenges that should be addressed in the comprehensive plan. Workforce development is important to ensure that workers have the skills for variety of industries, including manufacturing, healthcare, technology, and other service sectors. Home values are rapidly appreciating, but this creates challenges in the market for workforce and affordable housing. Westfield is also largely car-dependent and has very few public transportation options, which also affects cost of living and commuting for essential workers and young professionals. Westfield has recently had several simultaneous construction projects, which can create challenges with road access, parking limitations, and business disruptions. There is also limited land available for nonresidential development, which can create cost pressures that affect project feasibility. Challenges should be managed through strategic planning and proactive management with infrastructure investment, public-private partnerships, and regional coordination, providing pathways for sustainable growth. The city must be thoughtful in their decision making in how they use the remaining non-residential land as developments come before the elected and appointed bodies.
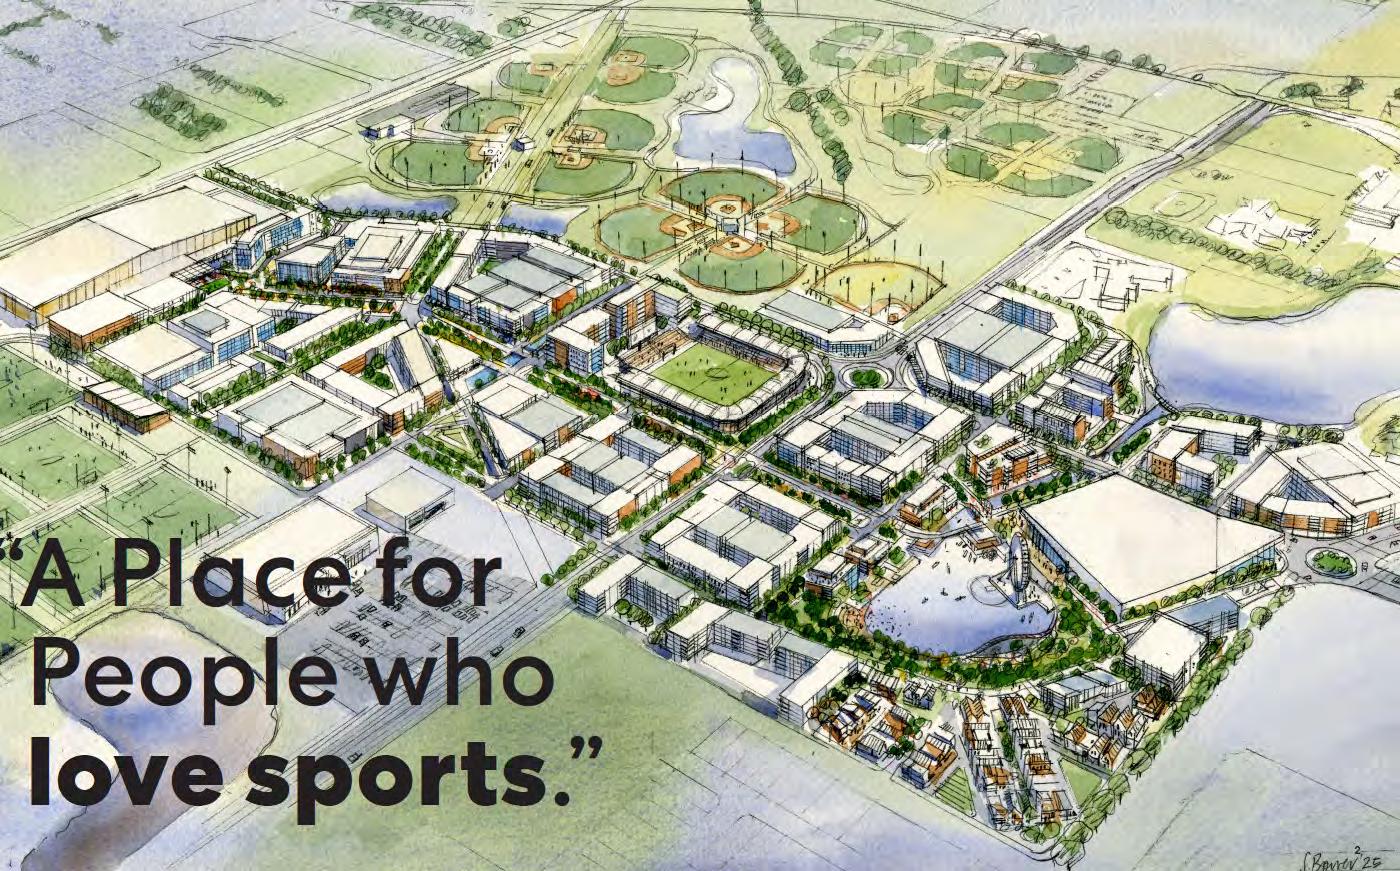
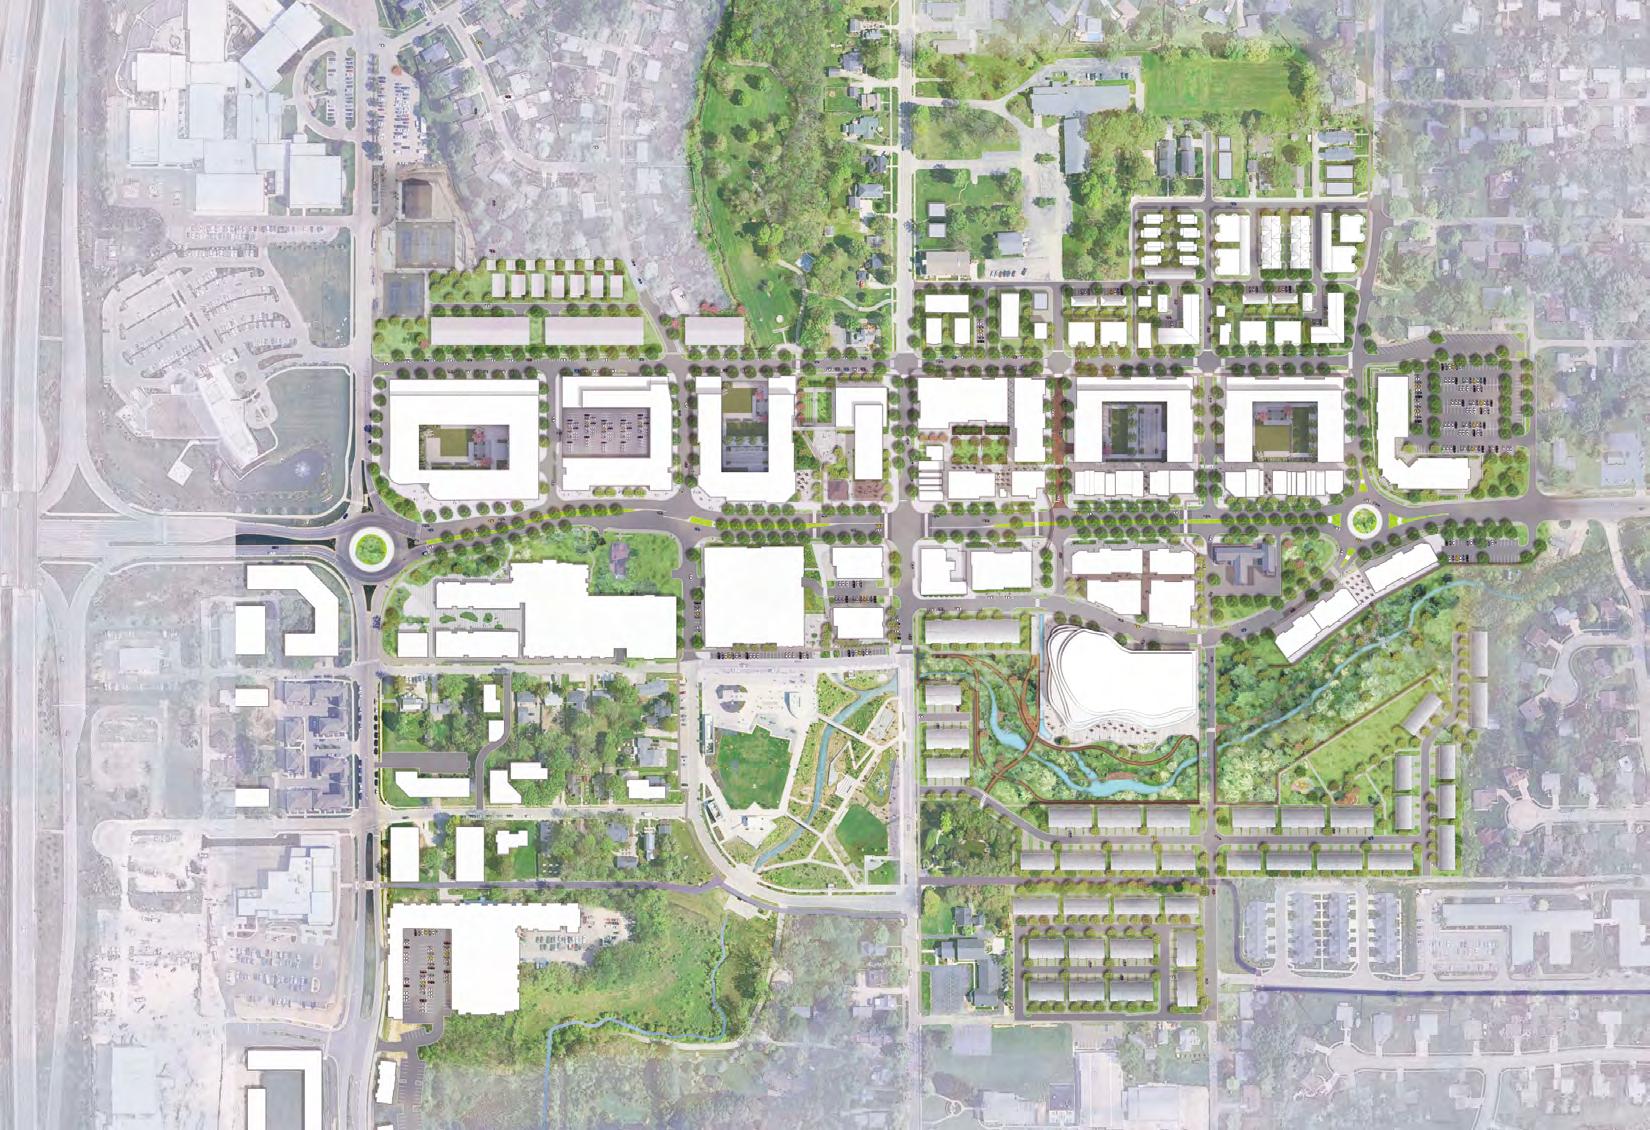

Five strategic development areas have been identified. Some, like the Grand Park Sports Campus & District and downtown, have plans that have been developed prior or concurrent to the comprehensive plan. Others are placetypes that are for planning and implementation of new development types to support the city’s vision.
The Grand Park Sports Campus is the most visited youth sports destination in the United States as well as the 16th most visited stadium, arena, convention center, or sports complex nationally according to Placer.ai in 2023. The popularity of Grand Park has increased demand for a range of development opportunities, such as new residential, hospitality, retail, office, and recreation use. The comprehensive plan identifies this area as a strategic development area that needs a more detailed subarea plan to guide growth and development. A detailed subarea plan was created in 2024 entitled Grand Park District Master Plan. The master plan recommends office, mixed use with retail and apartments, hotels, and entertainment development, including a three-sheet ice rink facility with the option to add a 4th. Over a 30-year period, phase one is expected to generate $4.7 billion in net new spending, $2.9 billion in net new earnings, 1,600 or more net new jobs, and $109.9 million in local taxes (food and beverage taxes and property taxes). While the placetypes map identifies the large areas for the Grand Park Sports Campus and Grand Park District, this detailed subarea master plan should be used to make future land use and development decisions.
The downtown area is the second strategic area for development and redevelopment. The Downtown Redevelopment Plan identifies three key elements for the future of Westfield’s historic city center: transportation, open space and connectivity, and development. Several road extensions and improvements are recommended to reduce traffic congestion on State Road 32/Main Street and provide more north-south connectivity. Recommended upgrades to State Road 32/Main Street should include enhanced streetscapes, medians for fewer four-way intersections, and improved pedestrian safety. The open space and connectivity element recommends a trail and linear park following the Grassy Branch stream. This park and greenway would pass through Grand Junction Plaza and provide a connection to the Midland Trace Trail.
The development recommendations for the Downtown Redevelopment Plan suggest sub-districts within the downtown area that focus on different design and land use characteristics. The primary focus areas of this plan are the Junction sub-district, which includes the Grand Junction Plaza, the State Road 32/Main Street corridor, and other character areas, the Gateway sub-district at the US 31 & State Road 32/Main Street intersection, and the Kendall sub-district south of Park Street and Westfield Boulevard. This plan envisions increased residential density with new apartments, townhomes, and mixed use buildings, and new office and retail developments. Revenue estimations based on the proposed development would result in an estimated $418 million to $477 million in assessed value and TIF increment revenue of $9.9 million to $11.6 million for reinvestment into the downtown.
Like the Grand Park Sports Campus & District, the city recently completed a detailed downtown subarea plan in late 2025. While the placetypes map identify the downtown area limits, the Downtown Redevelopment Plan should be used to guide decisions about land use, development form and character, and other transportation and non-transportation improvements.
The Innovation Districts are another strategic area of focus for the city. The parcels identified are geographically concentrated areas where leading companies, research institutions, startups, and entrepreneurs cluster together in a compact, mixed use environment. These districts are characterized by dense networks of collaboration, state-of-the-art infrastructure, and a vibrant live-work-learn-play culture. They serve as powerful engines of economic growth, job creation, and community vitality. Successful examples include Kendall Square in Cambridge, Massachusetts; the MaRS Discovery District in Toronto; and 39 North AgTech Innovation District in St. Louis.
Westfield possesses a rare combination of assets that position it to attract global industries to the city:
• Grand Park Sports Campus is the most visited youth sports campus in the nation. This provides an unparalleled “living laboratory” for sports technology innovation and a built-in customer base that no other innovation district can match.
• Indianapolis Executive Airport offers direct executive access for corporate leaders, investors, and partners—a critical advantage for attracting and retaining high-value companies operating on a national or global scale.
• US 31 Corridor provides exceptional logistics and transportation connectivity, essential for advanced manufacturing and life sciences companies that rely on efficient supply chains.
• Westfield-Washington Community School Corporation consistently ranks among the best in the state and nation, providing a pipeline of STEM-educated talent and making Westfield highly attractive to knowledge workers and their families.
• Grand Park District Master Plan provides 152+ acres of developable land already designated for mixed use development, offering the physical canvas upon which the innovation district can be built.
To be strategic in its approach, Westfield should focus on six interconnected industry clusters where it has demonstrated competitive advantages:
1. Sports Technology – Leveraging Grand Park as a testing ground and showcase venue
2. Agri-Tech – Building on Indiana’s agricultural heritage and central US location
3. Bio-Tech & Life Sciences – Capitalizing on recent wins (Portal Diabetes, Isotopia NA) and the region’s insulin manufacturing legacy
4. Healthcare – Proximity to Indianapolis medical corridor, Community and IU Health systems
5. Advanced Manufacturing – US 31 corridor logistics and Industry 4.0 focus. Industry 4.0 is reshaping industries by merging physical and digital worlds, leading to smarter operations and enhanced decisionmaking capabilities. This includes industries, such as aerospace, machinery, artificial intelligence, smart manufacturing, and food and beverage manufacturing.
6. Technology & Information Services – Horizontal enabler supporting all other sectors
The convergence of these industries—such as sports tech and healthcare creating “performance medicine,” or ag-tech and biotech enabling precision agriculture—will generate powerful synergies and sustainable competitive advantages.
Westfield should focus on two key areas within the placetypes map. One is in close proximity to Indianapolis Airport, right off State Road 32 and the Hamilton County/Boone County line. With the creation of the LEAP District in Lebanon, opportunities exist for key businesses to be located closer to an airport and still within a few miles of a major logistics corridor (US 31).
The second area is along US 31 North of E 191st Street. The area is adjacent to Northpoint and Northpoint II as well as the new Community Health Network Hospital being constructed at 193rd Street. The synergy created by the clustering of these uses provides a prime location that can be developed as a mixed use campus.
The innovation district placetypes directly supports key objectives of the plan and economic development strategy:
• Economic Diversification: Reduces reliance on residential property taxes by creating a robust commercial tax base
• Job Creation: Generates thousands of high-wage, high-skill employment opportunities
• Quality of Life: Creates vibrant mixed use environment with amenities benefiting all residents
• Regional Leadership: Positions Westfield as an innovative leader in Central Indiana
• Sustainable Growth: Accommodates growth in compact, mixed use and walkable form
The innovation district concept is a natural evolution from the Grand Park District Master Plan, providing the economic development strategy to guide tenant selection, design standards, and programming.
Flex industrial space is dynamic and adaptable and integrates various business functions (e.g. office, conference rooms, and laboratory space) within a single facility. Typically housed in single-story buildings, these spaces offer a combination of office or showroom areas with attached warehouse, distribution, or light manufacturing components. Key characteristics include high ceilings (14-24 feet), grade-level or dock-high loading doors, and customizable floor plans that can be configured to meet the specific needs of diverse tenants. This inherent versatility makes flex industrial a highly attractive option for a wide range of businesses, from e-commerce startups and logistics companies to advanced manufacturing and biotechnology firms.
As the modern economy evolves, the demand for adaptable, multifunctional commercial space is rapidly increasing. The rise of e-commerce, the decentralization of work, and the growth of small and medium-sized enterprises have created a perfect storm of demand for flex industrial properties. For Westfield, which is strategically located and experiencing rapid growth, embracing the flex industrial placetype is not just an opportunity but a necessity for sustainable economic prosperity.
Westfield has identified six strategic target sectors for economic development. Flex industrial development provides the ideal physical environment for several of these key industries:
• Medical Device Manufacturing: Flex spaces provide the clean, controlled environments necessary for medical device assembly, with integrated office space for administrative and R&D functions.
• Biopharmaceutical Manufacturing: The combination of lab, office, and light manufacturing space in a single facility is ideal for biotechnology research, development, and small-scale production.
• Information Technology: Flex buildings can accommodate a range of IT uses, from hardware development and assembly to data centers and hybrid office/technical support centers.
• Agribusiness: Modern agribusinesses require space for processing, packaging, and distribution, often with attached administrative offices, making flex space a perfect fit.
• Sports Technology: Development of sensors, safety equipment, and software to support sport performance requires office space and space to develop and test innovations.
• Professional Services: Services like environmental consulting, landscape architecture, and physical therapy (among others) require office space and large workspaces.
Westfield’s significant commitment to infrastructure, including a $186 million 8-year investment program, creates a highly attractive environment for industrial development. These investments in road reconstruction (such as the $21.7 million State Road 32 project), trail expansion, and utility upgrades provide the necessary foundation for successful industrial parks and business campuses. Flex industrial development allows the city to capitalize on these investments by attracting businesses that rely on efficient transportation and robust utility services.
A strategic focus on the flex industrial placetype offers a multitude of benefits for the City of Westfield, ranging from significant fiscal advantages to the creation of a robust and diverse employment base.
One of the most compelling arguments for prioritizing flex industrial development is its overwhelmingly positive fiscal impact. Unlike residential development, which often consumes more in public services than it generates in tax revenue, industrial and commercial properties are net fiscal positives for a community.
Flex industrial properties generate significantly more property tax revenue per acre than single-family residential or large-format retail developments. The dense and productive use of land, combined with the high value of commercial buildings and equipment, results in a more efficient and sustainable tax base. Studies have shown that mixed use and smart growth
developments, which share characteristics with well-planned flex industrial parks, can generate 5 to 10 times more tax revenue per acre than conventional suburban development.
By attracting a mix of tenants across various industries, flex industrial development diversifies the city’s revenue sources, making it more resilient to economic shifts. The typical longterm leases associated with industrial tenants (often 5-10 years or more) provide a stable and predictable stream of property tax revenue, which can be used to fund essential public services and amenities.
Flex industrial development places significantly lower demands on municipal services compared to residential development. These properties do not require schools, and their demand for services like parks, libraries, and social programs is minimal. While they do require police and fire protection, the cost of these services is spread across a much higher tax base, resulting in a more efficient use of public resources.
Flex industrial development is a powerful engine for job creation, providing a wide range of employment opportunities for residents of Westfield and the surrounding region. The jobs created in flex industrial facilities are often higherpaying and offer better benefits than those in the retail or service sectors.
Flex industrial facilities house a diverse array of businesses, creating jobs across the skills spectrum. From entry-level positions in logistics and light assembly to highly skilled roles in engineering, research and development, and management, these developments provide career pathways for individuals with varying levels of education and experience. This diversity of employment strengthens the local labor market and provides opportunities for upward economic mobility.
The target sectors that are well-suited for flex industrial spaces, such as medical device manufacturing, biotechnology, and advanced manufacturing, are known for paying competitive wages. By providing the necessary facilities for these industries to thrive, Westfield can attract and retain high-quality employers, boosting the average income of its residents and strengthening the local economy.
The presence of a growing industrial base creates opportunities for collaboration between employers, educational institutions, and workforce development organizations. This can lead to the creation of customized training programs, apprenticeships, and internships that align with the needs of local businesses, ensuring a steady pipeline of skilled talent for years to come.
Flex industrial development can be tailored to attract specific types of businesses, allowing Westfield to strategically target light/clean industrial sectors. By understanding the unique needs of these sectors, the city can create specialized development zones and incentive packages to maximize its economic development success.
Light/clean industrial uses are characterized by their minimal environmental impact, low noise levels, and professional appearance. These businesses are often compatible with mixed use environments and can be in closer proximity to residential areas without causing significant conflicts. For Westfield, target light/clean industrial sectors include:
• Medical Device Assembly and Packaging
• Biotechnology Research and Labs
• Electronics Assembly and Testing
• 3D Printing and Additive Manufacturing
• Research and Development (R&D) Facilities
• E-commerce Fulfillment Centers
By strategically zoning land for both light/clean industrial uses, Westfield can create a balanced and diversified industrial base that capitalizes on its location and infrastructure advantages.
The Destination development placetype offers a strategic framework to capitalize on Westfields assets and successes by creating specialized districts designed to attract shoppers and visitors from a broad geographic area. These districts serve as major economic anchors, contributing significantly to local tax revenue, job creation, and tourism. By combining high-quality, experiential-driven retail with entertainment, dining, hospitality, and residential uses, destination development districts can transform Westfield from a fast-growing suburb into a balanced and thriving city.
The adoption of a destination development strategy is the next strategic step for the City of Westfield. The city has already demonstrated its capacity for creating a major destination with the phenomenal success of the Grand Park Sports Campus. Grand Park serves as a powerful proof-of-concept for Westfield’s ability to execute large-scale, destinationfocused projects that drive tourism and economic growth. The Grand Park District Master Plan, with its vision to blend sports, recreation, business, and community, provides a natural springboard for the creation of complementary destination development districts.
Furthermore, Westfield’s demographic and economic profile make it an ideal location for such developments. The city boasts a high median household income, a highly educated population, and a strategic location within a day’s drive of 50% of the US population. These factors, combined with the city’s rapid population growth, create a strong market for the high-quality retail, dining, and entertainment experiences that characterize destination development districts. By leveraging its existing assets and strong market fundamentals, Westfield can create unique, experientialdriven environments that capture a significant share of the regional retail and tourism market, further diversifying its economy and solidifying its reputation as a premier place to live, work, shop, recreate, and visit.
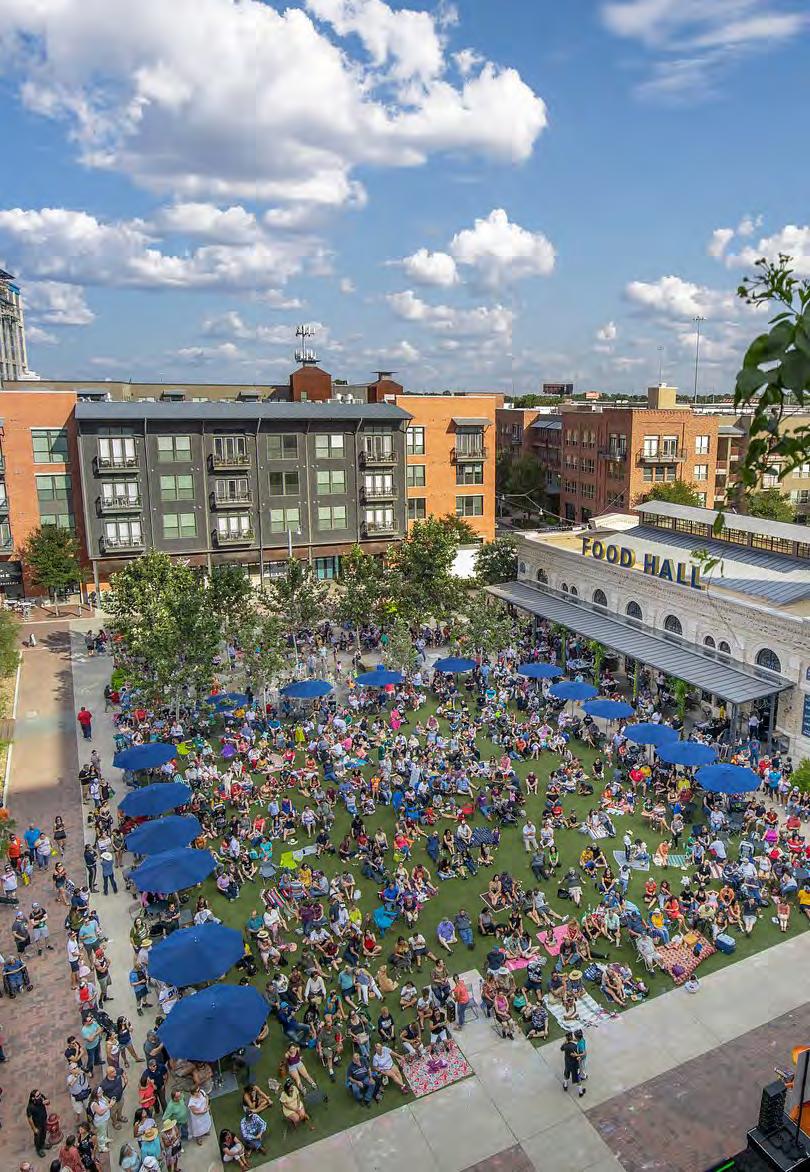
To ensure the success of its destination development districts, the City of Westfield should adopt a set of best practices that have been proven effective in similar developments across the country. These best practices, drawn from the Urban Land Institute’s “Ten Principles for Rebuilding Neighborhood Retail” and other leading sources, provide a comprehensive framework for creating vibrant, economically successful, and sustainable destinations.
The Urban Land Institute (ULI) has identified ten key principles that are critical for the success of neighborhood retail districts. These principles are directly applicable to the development of destination development district in Westfield:
Great Streets Need Great Champions: Successful districts require dedicated leadership from both the public and private sectors to champion the vision and drive implementation.
Merchandise and Lease Proactively: The city and its partners should actively recruit a diverse mix of tenants that align with the district’s vision, rather than passively waiting for tenants to come to them.
It Takes a Vision: A clear, compelling, and shared vision for the district’s future is essential to guide development and attract investment.
Make It Happen: An action-oriented approach is necessary to overcome obstacles and ensure that the vision is translated into reality.
Think Residential: The integration of residential uses is crucial for creating a 24/7 environment and providing a built-in customer base for retail and dining establishments.
Honor the Pedestrian: A focus on pedestrianoriented design, with wide sidewalks, safe street crossings, and engaging storefronts, is paramount for creating a comfortable and enjoyable experience.
Be Clean, Safe, and Friendly: A clean, safe, and welcoming environment is fundamental to attracting and retaining visitors.
Extend Day into Night: The district should be programmed with a mix of uses that attract visitors throughout the day and into the evening.
Parking is Power: Easy accessibility, high visibility, a sense of personal security, and convenient parking are all conditions for successful retail. Without them retail likely will fail, regardless of the shopping environment or the quality of the tenants.
Manage for Change: The district should be managed in a way that is adaptable and responsive to changing market conditions and consumer preferences.
In today’s competitive retail landscape, creating a compelling experience is essential for attracting and retaining customers. Experiential retail, as defined by McKinsey & Company, is a key component of successful destination development districts. It involves creating immersive environments that allow customers to interact with products and brands in a meaningful way. Key elements of experiential retail include:
McKinsey & Company has identified four key principles that are necessary for Experiential Retail. These principles are directly applicable to development within the Destination Development placetype in Westfield:
Interactive and Engaging Storefronts: Retailers should be encouraged to create storefronts that are not just places to display merchandise but also places for customers to engage with the brand through interactive displays, in-store events, and product demonstrations.
A Curated Mix of Tenants: The tenant mix should be carefully curated to create a unique and compelling shopping and dining experience. This includes a mix of national brands, local boutiques, and innovative new concepts.
High-Quality Public Spaces: The design of public spaces, including plazas, parks, and streetscapes, is critical for creating a sense of place and providing opportunities for community gathering and events.
Seamless Integration of Uses: The integration of retail, dining, entertainment, hospitality, and residential uses should be seamless, creating a vibrant and walkable environment where people can live, work, and play.
By incorporating these best practices into the planning and development of its destination development district, the City of Westfield can create unique and successful destinations that will enhance the city’s economic vitality and quality of life for years to come.
Create a robust, diversified economic base that can withstand market fluctuations and provide sustainable growth opportunities.
• Target specific sectors for economic diversification ensuring that not one single industry is more than 25% of the employment.
• Targeted Industries:
• Advanced manufacturing (aerospace, machinery, food and beverage manufacturing)
• Healthcare and biotechnology
• Technology and information services
• Professional and financial services
• Sports technology
• Agri-tech and biopharmaceutical manufacturing
• Align economic placetypes map with related zoning districts throughout the city to implement the plan.
• Identify and reserve ideal locations for significant and strategic commercial and employment uses.
• Capitalize on Westfield’s strategic location adjacent to Indianapolis Executive Airport for new economic opportunities. Focus on job creation and clean manufacturing and research and development.
• Foster a culture where Westfield has a comprehensive business ecosystem.
• Focus on the development of business incubation and acceleration.
• Assist small businesses with regulatory and administrative support.
• Assist with developing market access and networking.
• Focus on economic resilience building to withstand market fluctuations.
• Complete an industry concentration analysis.
• Maintain a healthy mix of large branches and small businesses.
• Develop supply chain resilience.
• Focus on economic shock preparedness.
• Ensure the city provides opportunities for Class A office space.
• Ensure existing businesses have the support they need to expand.
Cultivate a thriving innovation ecosystem that supports startup creation, business scaling, and technology adoption across all sectors.
• Increase power and fiber infrastructure to strategically drive economic development in key areas of the city.
• Designate specific geographic areas for innovation activities.
• Develop mixed use spaces combining office, retail, and residential.
• Ensure high-speed broadband and advance telecommunications.
• Create flexible spaces that can adapt to changing business needs.
• Remove land use and zoning barriers that hinder small business development.
• Support private and nonprofit organizations in the creation of maker spaces and fabrication labs.
• Support the development of community maker spaces with 3D printing and prototyping equipment.
• Provide access to advanced manufacturing tools for entrepreneurs.
• Connect talent and businesses to training programs on new technologies and fabrication methods.
• Support product development and rapid prototyping capabilities.
• Collaborate with partners to support entrepreneurship programs and business technology advancements.
• Collaborate with educational institutions to develop entrepreneurship education and training.
• Connect existing businesses with digital transformation consulting.
• Identify technology adoption incentives for major anchors.
• Support cybersecurity training and support.
• Support the creative economy.
• Connect entrepreneurs with angel and mezzanine financing.
Build a skilled, adaptable workforce that meets current and future business needs while attracting and retaining top talent.
• Continue to develop a comprehensive workforce development system in partnership with regional and local organizations
• Identify industry aligned training programs.
• Promote continuous learning infrastructure.
• Foster education-industry partnerships.
• Ensure talent attraction and retention strategies align with targeted industries but also have a greater focus on attracting young professionals.
• Continue to build quality of life enhancements in Westfield.
• Identify professional development and networking opportunities to connect with young professionals.
• Continue to expand Westfield Welcome as the community engagement platform in Westfield.
• Support, expand, and align efforts with WestfieldWashington School’s Life Ready pathways.
• Increase workforce resilience and adaptability as new technology emerges and changes
• Identify resources to set businesses up for AI adaptation.
• Connect businesses to training programs focusing on soft skills development.
Create world-class infrastructure and quality of place amenities that support business operations and attract residents and visitors.
• Identify strategic infrastructure investments that support economic development projects through the Capital Improvement Plan
• Identify the key productivity-enhancing infrastructure that will drive business growth.
• Develop financing strategy for infrastructure projects.
• Focus on infrastructure investment priorities such as shovelready project development, network effect maximization, long-term maintenance planning, and regional coordination.
• Create TrOD (Trail Oriented Development) area to provide greater access to neighborhoods, commercial areas, and destinations.
• Support quality urban design through capital improvement projects and special districts to create stronger and more attractive business environments.
• Implement a quality of place strategy that enhances traditional economic development initiatives.
• Ensure the basic needs for health and safety are more than adequately provided.
• Ensure the city has jobs that will foster wealth creation.
• Bring housing to market faster to support all levels of the workforce.
• Creating a multi-modal and safe transportation system.
• Using natural terrain and buffering to minimize impacts of business and industrial uses located directly adjacent to residential.
• Ensure a healthy environment with public space and green space.
• Ensure Westfield offers life-long opportunities.
• Promote civic engagement.
• Focus on development and redevelopment in strategic areas of the city to create robust community centers.
• Encourage construction of high-quality office space in innovation district, flex industrial, and Grand Park District .
• Initiate detailed subarea planning/master planning of commercial corridors and centers identified through Looking to the Horizon.
• Develop and redevelop village nodes, neighborhood nodes, and commercial corridors as mixed use places that offer retail, services, offices, and entertainment.
• Continue to focus on downtown revitalization.
• Implement the Grand Park Development District.
• Continue to support Westfield Welcome to focus on event programming.
• Incorporate Westfield’s history in placemaking and programming.
• Incorporate streetscape enhancements and amenities throughout Grand Park.
Maximize economic development impact through strategic partnerships, regional collaboration, and multi-sector engagement.
• Focus on public-private partnership relationships with existing and future investors.
• Foster regional collaborations on key economic development initiatives that help Westfield reach its economic objectives.
• Identify what economic development initiatives should be coordinated.
• Support resource sharing and efficiency.
• Document of competitive advantages.
• Create a multi-sector partnership engagement strategy nationally and globally around key business sectors.
• Continue to work with local businesses and the state to foster national and international relationships that lead to the location of new businesses in Westfield.
• Work with strategic partners to continue to engage with the private sector to support supply chain business development.
• Continue to develop relationships with multiple educational institutions to foster local partnerships with businesses and schools to support the development of talent and targeted industries.
• Ensure there is nonprofit and community organization integration to help implement the plan.
Housing variety is important for attracting and retaining a diverse, resilient workforce. The availability of housing for a wide range of incomes helps to attract and retain workers for the city’s businesses. The ability to live and work in Westfield helps to increase the tax base through income and property taxes. Residents also patronize local businesses and services. Housing development in downtown and villages with newer housing types can create opportunities for young workers to afford to choose Westfield.
Housing policies and developments shape a city’s environment. Housing location and density determine infrastructure needs; compact developments help to reduce urban sprawl, making utilities more efficient and preserving natural habitats. Compact developments also reduce car dependency, thereby reducing traffic congestion and improving air quality. Compact housing and transportation options will influence Westfield’s sustainability.
Housing is the primary use for the residential-oriented placetypes and a secondary use for several of the economic-oriented placetypes, especially where mixed uses are recommended, such as downtown and village center placetypes. The placetypes descriptions and map recommend locations for differing housing densities and their built forms. Housing policies and placetypes should balance preserving established character areas and promoting new and infill developments that support positive change. Approaches like form-based elements in zoning can support missing middle and infill housing in a manner that is compatible with existing neighborhoods.
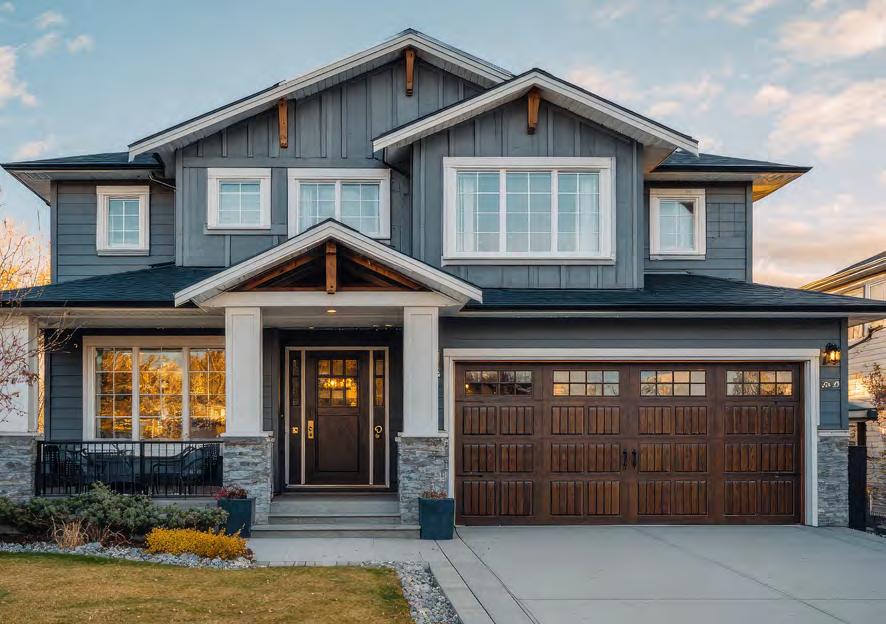
Westfield-Washington Township’s housing stock is largely made up of detached single-family homes - nearly 80 percent of housing, per the 2022 American Community Survey 5-Year Estimates. However, newer developments have increased the number of single-family attached houses, duplexes, and multi-family housing. Around 80 percent of housing is owner-occupied, meaning there are limited rental units available for residents who prefer or need rental housing, such as young professionals, temporary residents, or those unable to afford homeownership in the current market. Higher interest rates and housing costs have also constrained mobility in the housing market with few homeowners moving along the housing ladder.
Westfield’s overall (owner and renter) vacancy rate in 2022 was only 4.6 percent. A vacancy rate of 8-10 percent is generally considered healthy for market flexibility. This means that Westfield has a smaller supply of available housing for new residents or for existing residents to move within the community, which also contributes to a highly competitive housing market.
Around 65 percent of housing in Westfield-Washington Township was built after 2000, which coincides with a large increase in the number of residents and annexation of nearly 20 square miles between 2000 and 2010. This also means that home values tend to be higher. The Westfield median home value in 2022 was $365,700 compared to the median home value of $223,300 for the Indianapolis Metropolitan Area where only 25.5 percent of housing was built after 2000.
Housing affordability relative to income in Westfield has the following distribution:
Since Westfield generally has higher home prices, this limits the number of essential workers and young professionals who can afford to purchase or rent in Westfield, who are important contributors to the local economy. This also means that what is considered “affordable housing” has a much higher income threshold than may be expected in less affluent communities.
Around 79 percent of housing units have four or more bedrooms despite only 26 percent of households having four or more people. Around 58 percent of households are one or two people, meaning many dwellings are larger than needed. According to TalkToTucker.com, the average home for sale in Westfield in 2025 was around 3,000 square feet, the largest being around 12,000 square feet and the smallest being around 1,100 square feet. Around 15 percent of housing units are multi-unit dwellings or apartments. According to RentCafe.com, the average apartment is around 960 square feet.
The City of Westfield prepared a housing stock analysis in July of 2024, including all existing, under construction, and approved to be built housing.
• 4,262 single-unit dwellings were under construction and another 1,204 had received approvals but had not yet started construction.
• This brings the anticipated total of singleunit dwellings in the City of Westfield to 24,171 units.
• 1,040 apartment/multi-unit developments were under construction, and another 2,681 apartment units were approved but had not yet started construction.
• This brings the anticipated total apartments/ multi-unit developments for the City of Westfield to 9,138 units.
• With a total of 33,309 dwelling units, the city could support around 83,272 people based on an occupancy of 2.5 people per unit.
Owner-occupied housing accounts for 80 percent of housing units in Westfield. Research by the American Planning Association suggest housing tenure ratios around 65 to 70 percent owneroccupied and 30 to 35 percent rentals for established suburban communities. The rental housing stock should be even larger for communities with urban, mixed use development, around 50 to 60 percent owner-occupied and 40 to 50 percent rental housing units. These ratios provide more housing flexibility and opportunities to attract young professionals and essential workers, who are less likely to be able to afford homeownership in the current market. Permitting and incentivizing housing types that are intended for rental and increasing development of rental housing shifts the balance and reduces pressure on rents because of adequate supply.
Young adults and essential workers, such as teachers, construction workers, food service workers, and healthcare workers, are less likely to have the income needed to afford home ownership. In 2022, the median home value in Westfield-Washington Township was $365,700. Assuming a five percent down payment and a 30-year mortgage at 7.5 percent interest, not including taxes and other expenses, one would need an income of at least $110,000 to afford to buy a home at that price. Around 61 percent of households under 25 years of age had incomes less than $75,000. Many essential workers had median individual income of less than $80,000 (the median individual income for all industries in Westfield). This data shows that Westfield should support policies that allow for less expensive types of housing, which may include expanding rental options and supporting more affordable construction methods.
The zoning ordinance should be updated to allow for greater housing variety by allowing greater density in certain zoning districts. Missing middle housing options, such as duplexes, triplexes, quadplexes, and small apartment buildings should be allowed in certain zoning districts to reflect the placetype recommendations. This could be achieved by reducing the minimum floor area or lot size requirements or adopting form-based standards (e.g. setbacks or building to lines, lot coverage, building height, and parking maximums) based on the type of housing. Westfield should also consider expanding their options for affordable housing by partnering with community organizations and developers for innovative solutions.
Focus on regulatory and zoning modernization to provide housing opportunities in Westfield.
• Allow accessory dwelling units (ADUs) as special exceptions in appropriate residential zones in the Unified Development Ordinance (UDO).
• Review and redefine the planned unit development (PUD) process.
• Collect and analyze local housing data on an annual basis, including building forms, lot sizes, and architectural styles.
• Develop a comprehensive system of development incentives that align private sector activity with community housing goals while maintaining fiscal responsibility and development quality.
Develop village master plans for Lamong, Eagletown, Jolietville, Hortonville, and other applicable neighborhoods.
• Identify villages and other neighborhoods that require master plans and develop a process for creation of those master plans.
• Conduct baseline studies for each village, including land use, infrastructure, transportation, and community amenities.
• Incentivize the preservation of existing historic or community identifying structures, where possible.
• Emphasize the unique character or theme of focus of each place while also keeping the scale of development consistent with the village node.
Align the placetypes map with regulatory standards to reflect the development patterns in the residential placetypes.
• Revise residential zoning districts to align with the placetypes map to allow the targeted densities, lot sizes, and building forms.
• Eliminate zoning barriers that prevent missing middle housing types and mixed use development formats.
• Incorporate form-based elements into regulatory standards to ensure compatibility in scale, setbacks, and streetscape design.
• Promote compact, multi-modal oriented, connected, and walkable neighborhoods that maximize infrastructure, preserves open space, and reduces per-capita municipal service costs.
• Embrace innovative housing types, construction methods, and financing mechanisms that respond to changing demographics, climate considerations, and technological advances while maintaining community character and supporting aging in place.
Plan for mixed use trail-oriented development (TrOD) nodes along the Monon and Midland Trace Trails.
• Integrate missing middle housing types into the TrOD nodes around named trails.
• Prioritize development projects that include more traditional urban form features into development such as front-facing pedestrian entrances, short setbacks, rear or side loaded garages, access to bike amenities, etc.
• Require new developments within a certain distance of a trail to have bike and pedestrian infrastructure to support trail access and use.
• TrOD Nodes should be spaced to encourage walkable connectivity between them and to preserve natural areas.
• Ensure housing development is closely coordinated with infrastructure planning to ensure the growth is supported by adequate public facilities while maximizing efficiency and minimizing per-capita costs.
6
Focus on regulatory and zoning modernization to provide housing opportunities in Westfield.
• Partner with and support Hamilton County as they develop the land trust to advance housing supply.
• Coordinate housing strategies with regional partners, employers, and neighboring communities to address housing needs on a metropolitan scale while supporting local economic development, workforce retention, and fiscal sustainability.
Support diversification of the housing types and integration of neighborhood supporting uses into neighborhoods.
• Allow daily living uses in residential areas, particularly at key intersections. Daily living uses include grocery, gas, institutional uses, coffee shops, services, etc.
• Encourage integration and ensure the UDO supports multiple housing types, densities, and price points in a single development.
• Encourage smaller scale, creative and innovative developments, not just large-scale traditional subdivisions.
Quality of Place is a broad term to describe the amenities, destinations, and experiences that make people enjoy being in the community and feel positive about it, sharing their experiences with their family, friends, and networks. Common elements of quality of place are parks, trails, and recreation; schools, childcare, and youth activities; shopping, dining, arts, cultural resources, and tourism; and social support. Other elements are related to how well the community serves people of all ages and abilities. The American Association of Retired Persons (AARP) has resources on agefriendly communities and describes eight domains:
Outdoor Spaces and Buildings
Transportation
Civic Participation and Employment
Communication and Information
Respect and Social Inclusion
Social Participation
Health Services and Community Supports
Housing
Outdoor spaces and buildings, transportation, civic participation, social inclusion, social participation, and health services and community supports are directly related to quality of place.
Quality of place answers the questions “Why Westfield?” and “What is there to do in Westfield?”
According to AARP, “people need public places to gather — indoors and out. Green spaces, seating and accessible buildings (elevators, zero-step entrances, staircases with railings) can be used and enjoyed by people of all ages. Nearly three-quarters of adults (73%) [in their 2021 survey] say it is important to have safe, well-lit parks that give residents places to gather and interact with friends.”
The named trails in Westfield are the Monon, Midland Trace, Cool Creek, and Natalie Wheeler. Monon and Midland Trace are part of the regional trail system as they connect to other communities in Central Indiana. The Cool Creek Trail connects Cool Creek Park south to the city limits at 146th Street and can be easily navigated to the Hagan Burke Trail in Carmel. The Natalie Wheeler Trail runs north from Cool Creek Park parallel to Westfield Boulevard and connects downtown at Grand Junction Plaza.
Generally, “well-marked, extensive bike lanes help create an environment in which people find it safe and easy to bicycle to work or school” and “there is some understanding that policies aimed at reducing environmental barriers may have the potential to increase physical activity more than policies aimed at influencing individual behavior.” The benefits of both recreational and utilitarian physical activity benefit particularly the young and older adults in building and maintaining muscle strength, bone mass, and joint function in addition to supporting mental health. (Health and Community Design)
The City of Westfield has 13 parks and acquired land for a 14th park in 2025. Some of the parks have internal trail networks that extend the city’s total distance of trails, along with the perimeter paths in and adjacent to development areas. The parks also have amenities like shelters (available for rent), picnic tables, benches, playground equipment, disc golf, sports fields, skate parks, basketball courts, and similar features.
The National Parks and Recreation Association publishes NRPA Park Metrics, the most comprehensive source of benchmarks and insights for park and recreation agencies. It provides tools for communities to collect their data and benchmark against others but encourages understanding that each community has different recreation needs. NPRA benchmarks shared from national data and averages recommend that:
• Each park serves 2,411 residents
• There are 10.2 acres of park land per 1,000 residents
• Staff for parks is 8.6 full time equivalents per 10,000 residents
• 46% of park staff time is on operations and maintenance
• $103.13 per resident in park spending
Programming in parks, both indoors and outdoors, is generally available for youth, adults, and seniors. Some programming has fees associated with it. Programming makes possible social participation and inclusion. It can also create employment opportunities for teens and older adults as lifeguards, recreation instructors, trainers, and rangers.
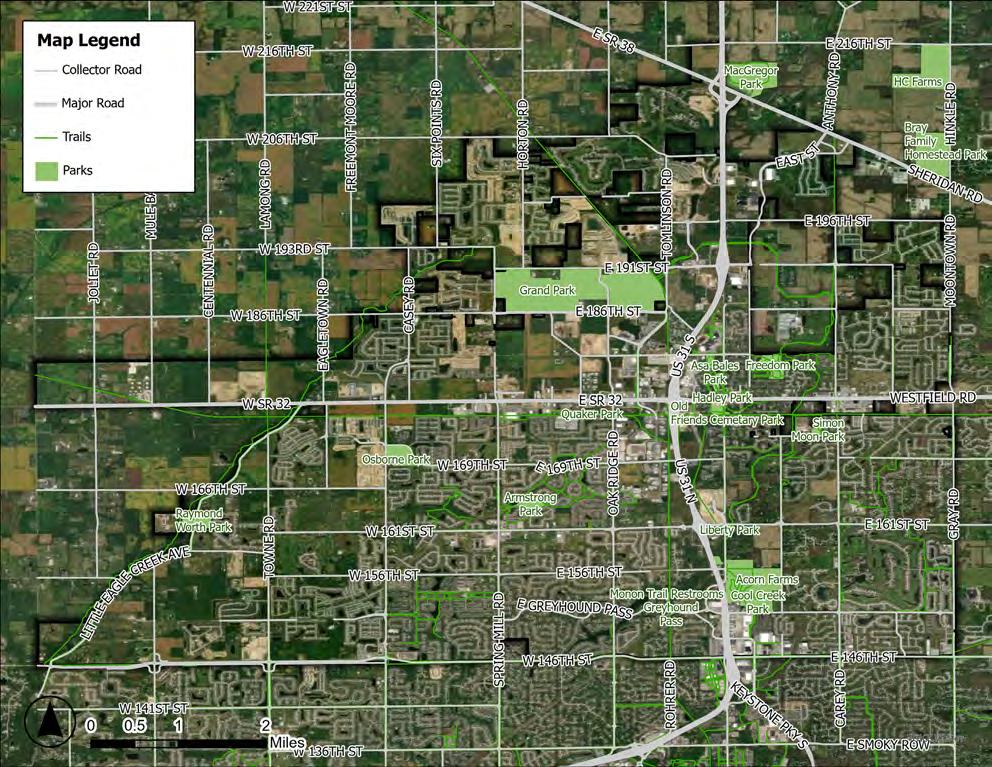
Westfield is served by Westfield Washington Township Schools and has an early learning center, six elementary schools, an intermediate school, a middle school, and a high school. Fifth and sixth grade students attend the intermediate school, while seventh and eighth grade students attend the middle school. There are more than 10,000 students in the district. In the 2026–2027 school year, the district will open two new elementary schools and a new middle school. These new facilities will help serve students and families as the district grows in population.
The high school Career Pathways program connects what students learn in class to real-world jobs, with options in fields like manufacturing, engineering, finance, and health sciences. In the intermediate and middle school there are clubs and programs for almost every interest: choir, band, theater, STEM, robotics, student council, and more, so students can explore and discover new passions alongside strong academics. These clubs and programs, and more, are available at the high school level to allow students to continue to grow and learn.
School-age children are one of the primary beneficiary groups of investments in parks and recreation. According to Heath and Community Design, “because recreational exercise occurs in or on parks, playgrounds, baseball diamonds, basketball courts, and biking trails…the spatial allocation of these facilities is important.” Further, “there appear to be two primary barriers facing children in the contemporary environment: distance between destinations and traffic safety.” Compact neighborhood development, connected neighborhoods, and schools connected to neighborhoods provide opportunities for recreation and utilitarian movement that can improve physical and mental health outcomes for children.
The Virginia F. Wood Early Learning Center offers a place for families with little ones for childcare, developmental preschool, and speech services. The district is growing here too, with more classrooms opening to support over 570 children with a team ready to help children grow and learn.
There are 11 licensed childcare centers in Westfield, more are adjacent to the community in Carmel and Noblesville. These centers provide care for infants through a maximum age of 12. The centers have a capacity between 130 and 300 children of different ages like toddlers, and age two and above. There is a total of 1,879 childcare spaces available in Westfield that are in licensed childcare centers. Some are open 6:00 AM to 6:00 PM Monday through Friday. Others open at 6:30 or 7:00 AM and close at 6:00 or 6:30 PM. Only three of the centers are qualified for On My Way Pre-K. In the State of Indiana Paths to Quality program there are four levels: Level 1 meets health and safety standards, Level 2 also includes learning environments, Level 3 adds a planned curriculum, and Level 4 has national accreditation. Of the licensed childcare centers in Westfield the Paths to Quality levels are:
There is other childcare options available including licensed childcare homes, unlicensed centers, schools, and homes, and unlicensed childcare ministries. The state has a childcare finder tool available to assist in choosing an appropriate type of care and location.
Westfield Youth Sports offers basketball, field hockey, tennis, baseball, football, volleyball, cheer, lacrosse, track and field, cross country, and softball to youth. Baseball, football, cheer, and softball have both inhouse and travel programs. The programs are based at Grand Park and supported by a board of directors, sponsors, and volunteers.
Twelve local sports organizations have a presence in Westfield in addition to Westfield Youth Sports:
• Pacers Athletic Center
• Bullpen Tournaments is the contact for the ball diamonds at Grand Park
• Indiana Mustangs is a baseball and softball league
• Indiana Prospects helps create exposure for high school and college baseball
• Indiana Soccer Academy is for youth soccer
• Indy Eleven Academy is a soccer club for all ages
• Pro X Athletic Development is a multi-sport training and rehabilitation center
• RoundTripper Sports Academy is a baseball training facility that covers all year play
• The Academy Monon Select is volleyball for all ages
• The Jungle Fitness has a collegiate size basketball court and practice turf
• Westfield Aquatics is the USA Swimming competitive swimming team based at the YMCA of Westfield
• Wrights 360* Movement Academy is a gymnastics and ninja training academy for ages 1-12
• White River Rugby Club has a rugby partnership at Freedom Trail
The Westfield Washington Schools and the YMCA of Central Indiana partnered to build an aquatic center as a shared facility and has recently completed the build out of the YMCA. The Ascension St. Vincent YMCA at Westfield is a member of the YMCA of Central Indiana with memberships available in addition to the pool for the high school and Westfield Aquatics.

Suburbs have been “a continuous experiment, evolving in response to the interplay of fundamental demographic, economic, and technological changes” and Westfield is at the cusp of their next evolution as a suburban community (Suburban Remix). The next evolution of suburbs will be more urban, but less “gritty” than traditional urban cities. They will have downtowns and expand their demographic as the “traditional suburban demographic base – households with children – continues to represent a declining share of suburban housing markets” nationally. The process of creating these downtowns requires civic leadership, planning, and in-depth community-wide engagement.” The core principles for this type of development are walkability, connected communities, a multilayered public realm, diverse housing choices, and being authentic. These principles are embedded in the comprehensive plan.
Evolving in this way is important because while drivable suburbanism in high income areas will do fine, it will foster weaker economic growth than urbanizing suburbs (Suburban Remix).
Shopping and dining options are increasing in Westfield, both downtown and in the State Road 32 corridor near Grand Park. The suburban shopping center located on the northwest quadrant of 146th Street and adjacent to US 31 has a mix of uses including a theater, restaurants, big box retailers, and smaller out lot and strip center mostly national brand restaurants and shops. The visibility of this area from US 31 changed with the reconstruction of US 31, but it continues to have high occupancy. The changed shopping patterns with online shopping, food delivery for both fast food and fast casual dining, and grocery delivery service as well as a host of mobile services emerging will change the viability of this drivable suburban development. Assets like the Cool Creek Trail and Hamilton County Parks Cool Creek Park are adjacent to the development and there are apartments and other more intense housing choices adjacent to the commercial development. This area could be well-suited for mixed used redevelopment over time as the market viability of the existing development decreases.
Art is a component of a viable community. Visual and performing arts contribute to social connections, engagement in the lives of the community, and a sense of place that is unique to the area. Visual arts can be incorporated in the community through building murals, sculpture in public places, trail murals and shelters, and playgrounds. Performing arts can be integrated into events like the farmers’ market, community events, downtown life, and as part of events at Grand Park, city parks, or along the named trails. Music, dance, spoken word performance, and similar forms of performing art bring a richness to places that encourage people to gather and socialize.
As Westfield continues to grow, maintaining and celebrating the history and culture of the original town has become an important community conversation. This has been done in other communities by “drawing freely on local history, geography, ecology, culture, and values through placemaking seeks to reinforce a sense of character and to give a building or the public spaces of new development.” Westfield will continue to incorporate local history in Grand Park, in the community gateway on US 31, along the Midland Trace at the Union Street trail head. The Quaker cemeteries, agricultural landmarks, and storytelling of the Underground Railroad are important elements of local history and culture to incorporate as the community grows and evolves.
Most of Westfield’s tourism is firmly grounded in youth sports. Grand Park was a vision to make Westfield a national destination for youth sports, and that vision has generated success for the community. Building out the housing, hotels, restaurants, shopping, family entertainment, and related commercial development is underway to increase the ongoing tourism draw of Grand Park and the city’s investments.
Social support is something that becomes more of a community’s life as the community grows. It pertains to people of all ages, from young children to older adults, and across demographic groups. Children and adults may require support for a range of mental health issues, which may be school counseling or private counseling. With changes in the economy during recessions, people may find themselves in need of temporary support for food, medical needs, or housing. Non-profits organizations, places of worship, community members, and at times government programs help fill their needs. People may struggle with substance abuse disorder and need treatment for themselves and support for their family members. While they are in crisis they may require intervention of services like EMS, police, and hospitals. People experiencing domestic violence may require police intervention and emergency shelter as well as longer term social supports to rebuild their lives. People who have lost their housing, or for whom housing has become unattainable, may be staying with friends or looking for very short-term low-cost housing to stay off the streets. Older adults may need in-house hospice care, care workers, or social workers to assist with daily lives and end of life.
Social services affect budgets on the personnel side and the capital side as different training and resources are needed, or simply more qualified staff are needed, to serve the area appropriately. Many of the “last resort” options for people in crisis fall to government and public funding.
Public safety and firefighting/emergency services are priorities for the City of Westfield. Two fire stations are being added to the community presently, with an understood need for at least three more. The city and the Westfield-Washington Township Schools are co-investing in school resource officers for each school.
Several non-profits serve Westfield and Hamilton County in a variety of social services capacities.
Communicate and celebrate local history by continually developing public art and placemaking initiatives
• Develop a public art program aligned with the arts master plan.
• Continue to support public art at Grand Park that communicates local sports history in outdoor installations.
• Coordinate the work of local organizations and the schools for youth engagement in agriculture and underground railroad history.
• Feature the local history in interactive public art along a named trail.
• Integrate the celebration of Westfield history and assets (food, art, sports) into city celebrations (e.g. Founding Day, Culture Fest, Rock the 4th).
• Develop music and performing arts programming aligned with the arts master plan.
Invest in local recreation facilities and programming for residents of all ages, abilities, and interests.
• Plan, fund, and open a community recreation center.
• Build out programming for each of the local parks.
• Add additional park land in developing areas.
• Include accessible play structures in park development.
• Develop programming related to natural resources.
• Connect existing perimeter trails and parks into a bicycle and pedestrian network.
Encourage developments and industries that integrate agriculture, including agri-tourism, and agri-neighborhoods and parks.
• Establish development standards for agri-neighborhoods.
• Work with large landowners west of Little Eagle Creek to plan development that includes agricultural elements.
• Support continued operation and expansion of agribusinesses (e.g. Urban Apples, Urban Vines, Stuckey’s) in the community.
• Develop and support farm-inspired activities for all seasons.
Establish quality tree standards and natural riparian corridors to preserve, maintain, and enhance the natural environment.
• Require riparian corridor preservation in development standards.
• Encourage preservation and maintain high-quality tree stands in development standards.
• Create a position of urban forester within the city administration.
• Encourage planting new tree stands for future generations of Westfield residents.
Maintain and improve passive green spaces that provide valuable connections to nature.
• Include passive spaces in park design.
• Support development of a rural historic district where there are Indiana State Department of Agriculture Hoosier Homesteads.
• Adopt a local right-to-farm ordinance to protect existing farmers (crop and livestock) from complaints related to urbanization.
• Develop a natural trail or equestrian trail network in the rural southwestern and western portions of Washington Township.
Drinking Water and Wastewater systems are essential for preserving public health in a community. Customers rely on the delivery of safe and reliable drinking water. Collection and treatment of wastewater protects the environment and prevents the release of contaminants into local waterways. It is vital that these systems expand with the community to ensure growth is supported.
The drinking water and wastewater systems in Westfield are owned by Citizens Energy Group (Citizens). Developers may apply to Citizens to expand the systems through water main extension, service line construction, sanitary main extension, or sewer lateral construction. Citizens may also spearhead their own projects to expand, modify, or improve the systems. In any case, it is crucial for the City of Westfield to keep Citizens apprised of all growth plans and projections during the planning process.
As Westfield grows, the drinking water distribution system and wastewater collection system must expand to reach new customers. Water demand will increase as the number of customers increases, and additional flows will be sent to the wastewater treatment plant (WWTP). The existing infrastructure may need to be upsized to handle higher flow rates. Regular communication between the City of Westfield and Citizens to discuss drinking water and wastewater infrastructure conditions and capacities, demand projections, and potential improvement projects is critical.
Citizens should be consulted when any industrial or potential high consumption users express interest in moving to Westfield. Industrial customers must comply with pretreatment standards. Even if supply is available, existing watermains are limited in the demands they can meet. Accommodation of a high consumption user may require substantial system modifications.
For developers, Citizens has fact sheets available regarding the process for plan review and permitting for water main extensions, water service lines, sanitary main extensions, and sanitary sewer laterals. Developers should follow the procedures and requirements outlined in the most recent version of the Citizens Energy Group Water Standards Manual for water main and service line design and construction, as well as the most recent version of the Citizens Energy Group Sanitary Standards Manual for sanitary main and sewer lateral design and construction.
• Coordinate with Citizens on the following items:
• Ensure there is sufficient drinking water storage within the distribution system, typically equal to the average daily consumption.
• Ensure existing force mains have capacity to supply areas of new development.
• Verifying new development complies with Citizens’ Wellhead Protection Plan.
• Discuss proactive expansion of the WWTP to accommodate increased flows from future development prior to reaching 90% capacity (4.5 MGD).
• Ensure existing trunklines have capacity to accept flows from areas of new development.
• Verifying drinking water needs of potential high consumption users can be met while maintaining sufficient pressure and quality throughout the rest of the system.
• Establish whether potential industrial users will be subject to pretreatment requirements.
• Highlight and amplify water conservation tips and practices published by Citizens to preserve capacity within the treatment and distribution systems.
• Direct developers to Citizens’ fact sheets: https://info.citizensenergygroup.com/permits-and-forms
through regular inspection and maintenance.
A close partnership between the City of Westfield and Citizens is important to ensure customers’ needs are met. Citizens is responsible for the maintenance of the drinking water and wastewater systems in Westfield. Maintenance of older infrastructures where right-of-way or easements are not established can be difficult and, potentially, neglected. Citizens’ Real Estate office should be made aware of any such cases where a maintenance easement may be required.
• Notify Citizens of water and wastewater infrastructure maintenance needs. Contact the Real Estate office if a maintenance easement is required.
A culture of water conservation promotes sustainability while saving both the customers and utility money. Conserving water helps customers reduce their water and electricity bills. Water conservation also preserves capacity in the drinking water and wastewater systems by reducing per capita water demand and wastewater contributions. This allows for the delay of some capital projects such as treatment plant expansion or upsizing mains or sewers due to a slower increase in demand, even as a community continues to grow. Citizens has conservation tips available at https://info. citizensenergygroup.com/conservation.
Effective stormwater management protects infrastructure, improves water quality, and recharges groundwater supply. Stormwater management is crucial to protect city infrastructure such as Grand Junction Plaza, a favorite place of the community, as well as roadways and building foundations which can be damaged by flooding. Innovative stormwater management systems promote infiltration of stormwater to recharge groundwater supply, Westfield’s source of drinking water. Treatment of runoff protects waterways from pollutants which can have detrimental effects on aquatic life.
The City of Westfield updated their Stormwater Ordinance and Technical Standards Manual in 2019 establishing policies relating to stormwater management, stormwater quality practices, flood control, submittal requirements and procedures for issuance of a stormwater permit, and procedures for inspection, testing and final acceptance of stormwater facilities. Updates to the Stormwater Master Plan (SWMP) and Stormwater Quality Management Plan (SWQMP) were completed in 2022 and 2023, respectively. The SWMP and SWQMP identify problem areas and evaluate potential solutions including both capital project and policy-based solutions.
Westfield’s stormwater management strategy emphasizes the need for maintenance of existing infrastructure to ensure continued, successful operation and implementation of innovative and sustainable solutions for new development and areas of need.
infrastructure through regular inspection and maintenance.
The City of Westfield is responsible for maintenance of its stormwater infrastructure. SWMP section 5.1 describes the need for improved long-term maintenance procedures for stormwater BMPs, especially when privately-owned. BMP inspection and maintenance costs are incorporated in the City of Westfield Stormwater program costs through 2027. Based on inspection results and maintenance needs, the program may need to be adapted to include more frequent checks. It is important that privately-owned BMPs are also inspected to ensure private owners comply with their maintenance agreements.
In areas where maintenance of older infrastructure is difficult or impossible due to a lack of right-of-way or easements, coordination with the city attorney may be needed to establish maintenance easements.
Key Action Steps:
• Continuing development and implementation of a long-term maintenance plan for stormwater infrastructure including regular inspections to confirm condition and performance are adequate.
• Coordinate with the city attorney to establish any necessary maintenance easements for existing stormwater infrastructure.
Stormwater best management practices (BMPs) refer to the devices, practices, or methods that are used to manage stormwater runoff by controlling peak runoff rate, improving water quality, and managing runoff volume. BMPs can be structural or non-structural.
Structural BMPs are physical structures that control and treat stormwater. Examples of structural BMPs include:
• Constructed wetland
• Planter boxes (pictured)
• Water quality device
Nonstructural BMPs are policies and strategies that aim to preserve natural features and reduce runoff. Examples of non-structural BMPs include:
• Riparian/vegetative buffer (pictured)
• Minimization of total disturbed area
• Protection of natural flow paths
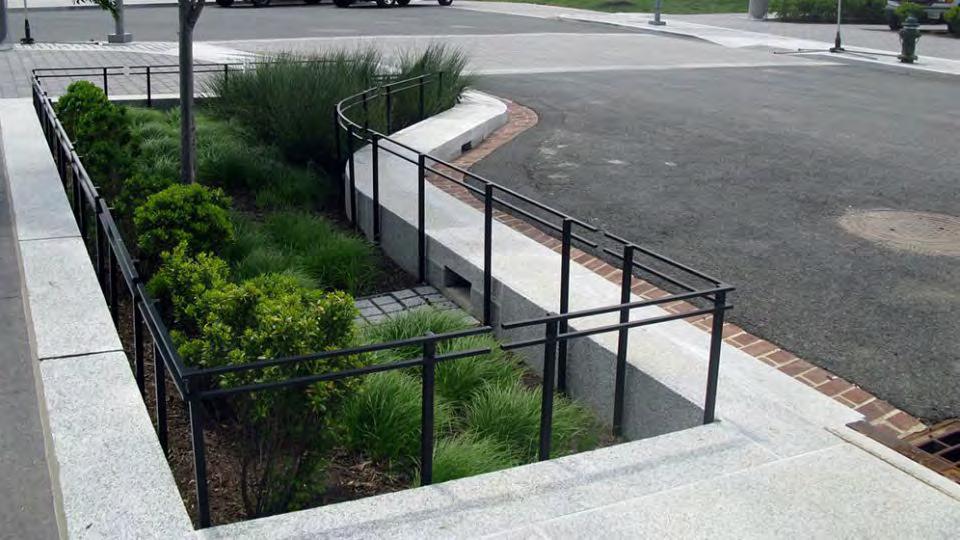
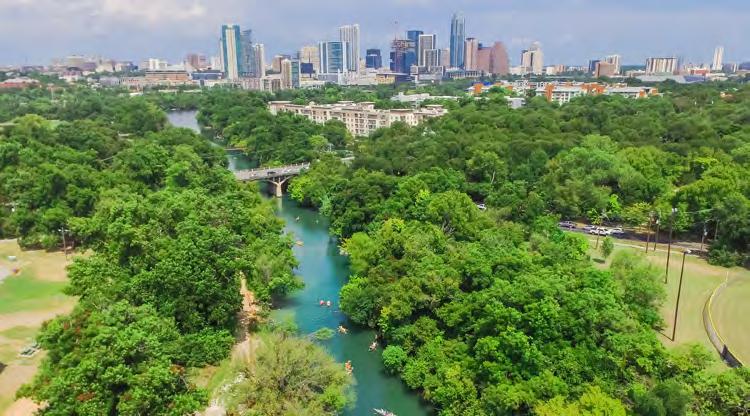
illicit discharges and address problem areas identified in the SWMP and SWQMP to reduce flooding and improve water quality.
The City of Westfield is implementing an Illicit Discharge Detection and Elimination (IDDE) program as is required for MS4s. Signs are posted along the road near major waterways, informing the public of what number to call to Report-A-Polluter. Stream sampling can further help to identify pollutant sources. A potential pollutant source is failing septic systems. While there are few septic systems in Westfield, it is important that customers on septic are aware of the maintenance requirements and potential signs of malfunction.
The SWMP identifies specific areas of known drainage, flooding, and water quality issues. As Westfield grows, it is vital for the community that attention is paid to longer-established neighborhoods as well as new developments. Drainage and flooding complaints should be addressed in a timely manner. Repeat complaints should trigger a discussion of potential infrastructure improvements or modifications to prevent future issues. The SWMP also identifies strategies for addressing these issues including swales and culverts, additional storm inlets, and rain gardens.
• Continue implementation of IDDE program, utilizing Westfield City Code 54.13 to access facilities and verify compliance.
• Where sewer is not available for new or existing development, ensure customers are informed of septic system maintenance requirements and potential signs of malfunction.
• Address flooding and drainage problems in older neighborhoods utilizing strategies identified in the SWMP.
The popularity of Westfield’s trails and parks indicates that residents appreciate the natural features of the area. Preservation of these features during development also reduces stormwater runoff and improves stormwater quality. This is a design approach known as low impact development (LID). The LID approach to stormwater management is described in the city’s Utility and Infrastructure Construction Standards and Specifications Manual. Currently, stormwater fees are based on impervious area which incentivizes development that minimizes conversion of pervious surfaces, such as grass and soil, to impervious surfaces, such as concrete or asphalt. Additional incentives could be provided to encourage developers to utilize the LID approach such as:
• Additional stormwater fee discounts or credits,
• Expedited permit processing,
• Waiving or reducing permitting fees,
• Awards or recognition programs.
Where construction of impervious surfaces is unavoidable, such as roadway projects, green infrastructure may be incorporated to capture and treat runoff at the source. When stormwater runoff flows over streets or parking lots, it picks up pollutants that have been deposited on these surfaces. Green infrastructure is a subsect of stormwater BMPs that uses plants, soils, and other media to capture and treat stormwater and promote infiltration and evapotranspiration. This results in a smaller volume of stormwater that is sent to storm sewers and surrounding waterways during and after rain events, reducing the risk of surcharging or flooding the system. The use of native plants and trees for green infrastructure systems benefits environmental sustainability and local wildlife.
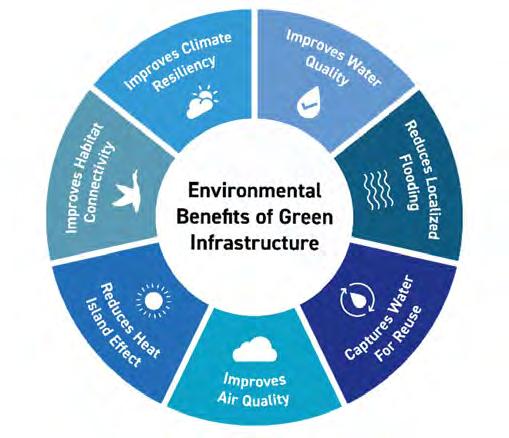
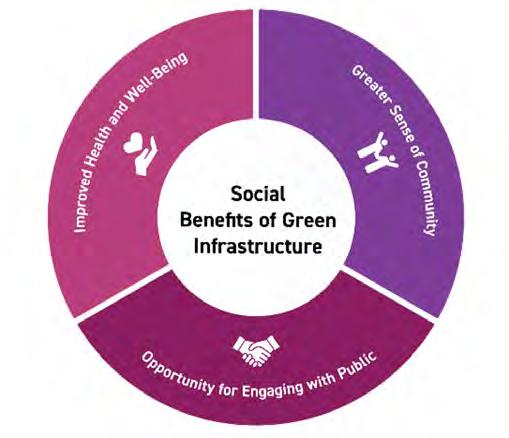
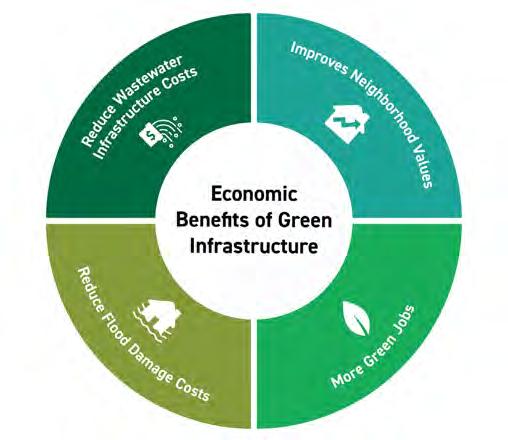
Note that an INDOT permit must be obtained for any work within INDOT right-of-way, such as US 31 and State Road 32, including work outside of the roadway. Right-of-way limits vary by location. Generally, within city limits INDOT right-of-way is full width of sidewalk to full width of sidewalk. INDOT is also an MS4, and they are required to manage stormwater within their right-of-way accordingly. Close coordination with INDOT will be required for any projects that convey stormwater into or out of INDOT right-of-way.
Key Action Steps:
• Incentivize LID stormwater management design approaches and incorporation of green infrastructure in new development.
• Incorporate green infrastructure into roadway and other public works projects to capture and treat runoff at the source.
• Utilize stormwater BMPs to preserve a natural aesthetic in new development and increase flood resilience.
• Prioritize native plants and trees.
• Coordinate with INDOT during the planning, design, and construction of any project that conveys stormwater into or out of INDOT right-of-way.
Promote safe and reliable water service by fostering strong partnerships with Citizens Energy Group, ensuring that infrastructure investments, service delivery, and long-term planning align with the city’s growth.
• Maintain and modernize the street network to provide for current and future transportation needs that ensure safety for all modes of transportation.
• Follow the application procedures outlined in the most recent version of the Citizens Energy Group Water Standards Manual for water main and service line construction.
• Coordinate with Citizens Westfield to ensure there is sufficient drinking water storage within the distribution system, typically equal to the average daily consumption.
• Verifying new development complies with Citizens Westfield’s Wellhead Protection Plan.
• Highlight and amplify water conservation tips and practices published by Citizens.
• Work with Citizens to establish maintenance easements for existing infrastructure with clear stipulations on allowable development to allow access for repairs and rehabilitation.
Ensure reliable, affordable, and environmentally responsible wastewater treatment services through proactive coordination with Citizens Energy Group, safeguarding public health and water quality while aligning infrastructure investments with the city’s long-term growth.
• Follow the requirements and procedures outlined in the most recent version of the Citizens Energy Group Sanitary Standards Manual for issuance of approvals and permits and acceptance of sanitary sewer facilities.
• Where sewer is not available for new or existing development, ensure customers are informed of septic system maintenance requirements and potential signs of malfunction.
• Coordinate with Citizens Westfield to proactively upgrade the wastewater treatment plant to accommodate increased flows from future development prior to reaching 90% capacity.
• Coordinate with Citizens Westfield to ensure existing trunklines have capacity to accept flows from areas of new development.
• Work with Citizens to establish maintenance easements for existing infrastructure with clear stipulations on allowable development to allow access for repairs and rehabilitation.
Develop and maintain a resilient, efficient, and sustainable stormwater infrastructure system that protects public safety, improves water quality, reduces flooding risks, and supports community growth while enhancing natural ecosystems.
• Utilize stormwater BMPs as landscaping, prioritizing native plants and trees, to provide a natural aesthetic in new development and increase flood resilience.
• Establish a long-term maintenance plan for stormwater infrastructure.
• Incentivize incorporation of green infrastructure in new development.
• Address flooding and drainage problems in older neighborhoods utilizing strategies identified in the Stormwater Master Plan.
• Establish maintenance easements for existing infrastructure with clear stipulations on allowable development to allow access for repairs and rehabilitation.
Certain changes in the economy and the built environment are driven by technological change. In many ways the global pandemic of 2020 accelerated these trends and, or of necessity at the time, made them common practice. How we shop, eat, move, and work were all transformed by technology during the pandemic and many of these changes are here to stay. Other changes may be needed in the next twenty years to be resilient as we experience further changes in the global economy, climate and weather, and political environment.
Shared mobility started tentatively and primarily in large cities, but uptake was slow in places like Central Indiana. Car share programs didn’t last more than a few years here, while thriving in places where people only use a car to escape the city for vacation. Bike and scooter share programs had varying levels of success in the region, with relatively high demand and growth in the Indianapolis Pacers Bikeshare system, while other communities had limited success early on including Westfield and Carmel. Carmel has re-launched their bike share program and other suburban communities are launching programs as their trail network becomes more connected. Most of the bike sharing programs are docked bikeshares, where the bikes need to be returned to a specific location with a hard dock. The private scooter shares in Indianapolis are not docked systems. The companies pay independent contractors to charge and distribute the scooters. Other cities have used geofencing to manage where bikes and scooters are returned. These programs create transportation opportunities for people who are unable to drive (especially younger people) and who can’t afford a car.
Another type of shared system is co-working locations. These may be operated by public, private, or non-profit entities and offer shared office essentials and equipment as well as conference rooms and workspaces for a membership fee or day use fee. These locations offer collaboration efforts for small business owners and the opportunity for remote workers to have an “office” space that is in a professional setting and can be quiet for focused work. Makerspaces are a type of co-working location where there is equipment like laser engraving, 3-D printing, sewing machines available for start-up businesses to make their products without investing in the means of production. Some have member fees. They may be public or non-profit spaces like in libraries. Westfield has a small makerspace in the Westfield Washington Township Public Library. Carmel Clay Township built a sound studio into their library, and it is available to residents for recording highquality podcasts and other audio products.
Shared commercial kitchens are used by small businesses to have commercial health and safety graded cooking spaces available to produce food for sale to the public. Several small bakeries and specialty food businesses use this type of space on a rental basis to produce their food for sale. Churches and non-profits are typically the owners/managers of shared commercial kitchens.
Smart City is connecting technology to infrastructure for better informed management and maintenance. On highways this can include Intelligent Transportation Systems like message boards that alert drivers to lane or road closures, or truckers to the number of parking spaces available at a rest area. In cities it can include connected infrastructure and applications to alert drivers when there is a train, how long the train is and will take to clear an intersection, and available detour routes for at-grade railroad crossings. It can also be light fixtures that send an alert when a lightbulb dies or a fixture is broken, sensors that report full trash cans, and similar situations.
Some communities have been investigating autonomous vehicles for certain municipal services, using drones for law enforcement, emergency services, and code enforcement, and similar applications. There are still legal and ethical issues surrounding this technology and its use by government, and the applications will evolve over time.
Delivery services of all types accelerated their market absorption quickly during the COVID 19 Pandemic. Amazon was already delivering packages to many homes and businesses daily, but they expanded, and other services became used on a regular basis. Grocery ordering and delivery has become standard in many households. Door Dash, Uber Eats, and similar services have changed carry out food service. These services increase vehicle miles traveled for the delivery drivers but increase accessibility to choices for people who can’t drive or don’t have access to a car.Drive thru, rather than dining in, has also become more common.
These changes in how we do business have implications for the built environment, specifically:
• Parking/standing space for delivery vehicles during the transactional steps (pick up, drop off)
• Vehicle idle in drive-thru lines and when standing during deliveries
• Long drive through lines that spill into adjacent parking lots and streets
• Smaller building footprints for chain restaurants as fewer people drive in
• Delivery vehicles blocking turn lanes or travel lanes when making deliveries to homes or businesses in walkable areas
• Delivery vehicles blocking sidewalks, curb ramps, bike lanes, or other similar facilities during pick up/drop off
• Fewer businesses need or want a brick and sticks presence in the community, can lead to high retail vacancy rates and reduce property tax opportunities for communities
• Security issues for package drop-offs, particularly where homes don’t have individual porches
• Policy decisions regarding autonomous delivery vehicles (cooler robots) on public infrastructure
• National level policy choices for commercial drones doing delivery, especially adjacent to airports or sensitive land uses
• Increased need for warehousing, distribution, and logistics centers
• Increased truck traffic
Autonomous vehicles are under development and have a wide range of applications from the cooler delivery robots to transit to trucking to passenger vehicles. The technology, legal framework, and insurance standards are still being developed and tested. Some vehicles have a degree of autonomous driving capability but require a legal driver in the vehicle. Some imagine a future with autonomous transit service and shuttles around employment centers and campuses, autonomous trash and recycling vehicles, driverless delivery services, and the availability for people who are unable to drive themselves to have or rent car services that can drive them without having to be able to intervene with the vehicle.
While early plans for an autonomous transportation network depending on in-road technology that has shifted to the Internet of Things and communication between integrated computers in vehicles and in phones. Many of the crash avoidance technologies in newer cars are the early stages of technologies needed for autonomous vehicles to share the road safely without human intervention. There are challenges to overcome as technology is still not as good as humans at identifying children, people with darker skin tones or darker clothes, and people using bicycles, scooters, or walking.
As fully autonomous vehicles become reality there will be increased demand for curb space for pickup and drop-off and standby parking for the vehicles while waiting for a request from an owner or a user of an application-based car share. There may be reduced need for on-site parking at retail and entertainment venues, hotels, restaurants, and offices as the cars leave the premises between rides. This can allow for more dense and intense development patterns and increased land value.
Electric vehicles will reach market absorption ahead of autonomous vehicles. Homes will need vehicle capacity electric service in garages for overnight charging, parking garages for apartment buildings and workplaces will need the same. Municipal lots, private commercial parking lots, and similar places will need vehicle charging infrastructure. Conventional gas stations may convert to rapid charging stations.
The Central Indiana Transit Plan is a multi-county, multi-year vision for transit throughout the region, informed by more than a decade of planning and public input. More than a decade ago, a group of Central Indiana elected officials and business leaders called the Central Indiana Transit Task Force (CITTF) recognized that transit investment would provide more economic return for the region than any other type of transportation improvement. The task force recommended a significant expansion of the regional transit system and the adoption of new transit funding sources. The Central Indiana Transit Plan recommends establishing new local transit services in counties and townships adjacent to Marion County that have studied their needs. This means providing the right services to fit the goals and the needs of each individual area and community.
Indiana state law requires that transit be funded locally, but best practices indicate that transit investments are most effective and efficient when coordinated regionally. In 2014, the Indiana General Assembly passed legislation (IC 8-25) to enable a stable, dedicated funding source for transit investments, provided via a public referendum process. It allows certain Central Indiana counties and townships to ask for voter approval of a local income tax to fund transit within the community. These funds would supplement, not replace, existing local, state, and federal funding sources.
Marion County voters authorized a local option income tax for transit in 2016, and IndyGo now receives approximately $60 million per year to improve local transit service and implement new rapid transit lines.
Other surrounding counties and townships are now eligible to add dedicated income tax funding for transit through their own referenda. State code allows an eligible township or county to implement a local option income tax to fund transit at a rate of up to 0.25 percent, if approved by referendum. A proposed tax rate of 0.25 percent of a resident’s income equates to 25 cents for every $100 earned. Hamilton County is eligible for a referendum at this time, Washington Township, without the entire county, would need Clay Township to pass a referendum.
The Central Indiana Transportation Authority (CIRTA) is a regional governmental organization focused on improving transportation options within Marion and surrounding counties. Hamilton County Express operates a response public transit system with more than 50,000 trips annually. Prime Life Enrichment offers human service transportation in Hamilton County. CIRTA operates a registered vanpool/carpool program in Hamilton County.
BRT is recommended on all proposed rapid transit routes in the Central Indiana Transit Plan because of its high level of service, reliability, comfort, convenience, its ability to generate transit-oriented development (TOD) where markets are ripe because of affordability compared to vehicle types that require more expensive infrastructure, like light or commuter rail systems.
A complete and fully automated transit system is still years in the future, but numerous tests and pilot projects are currently in progress throughout the US, including in Central Indiana.
There are opportunities for transit studies to connect to the regional transit system as well as opportunities to develop partnerships with other providers or develop local circulator programs.
Public Law 68, more commonly known as Senate Enrolled Act 1 or Senate Bill 1 in 2025), changes the funding mechanisms for local government in Indiana.
Residential property taxes, a mainstay of local government finance, are reduced under the law. The reductions will be limited or modest for most homeowners, and largest for the wealthiest homeowners but still relatively small. The collective losses from residential property taxes to units of government will be significant. The property tax deductions are phased over a period of six years. It also phases out the standard homestead deduction and phases in an increase in the supplemental homestead deduction to two-thirds of the assessed value.
The maximum growth levy is restricted to four percent in 2026 under the law. This affects communities that have been growing at greater than four percent as their levy will not be able to reflect the same growth rate as growth in assessed value.
The law changes the structure of Local Income Tax (LIT) beginning in 2028 with communities having a population of more than 3,500 being permitted to adopt a local income tax of up to 1.2 percent for municipal services. The county may adopt a LIT of up to 1.2 percent for county services and allocation to non-qualifying municipalities, but those entities must petition the county for funds each year beginning in 2027 for distribution the following year.
The law also raises the minimum threshold for businesses filing personal property taxes from $80,000 to $2 million. This will exempt many businesses from personal property tax and reduce the tax liability of the businesses with over $2 million in personal property. It further eliminates the 30 percent depreciation floor. Businesses used to have to pay taxes on a minimum of 30 percent of the value of personal property as long as it was owned even after the 30-year depreciation. The 30 percent floor is eliminated for personal property purchases made after the beginning of 2025. Oil refineries, petrochemical plants, and property in tax increment finance (TIF) districts or connected to municipal bonds are exempt.
There are weather and climate events that affect communities, sometimes as disasters that are devastating to communities. Planning for resilience and sustainability can lessen the impacts of these events like tornadoes, flooding, fires, ice storms, and high winds by designing to minimize the impact to people and property. Some of the other ways to plan for resilience aren’t about disaster mitigation as much as making places more comfortable for people with changes in weather extremes. These measures include building shade into the environment through trees or shade structures (or shade sails), ensuring people have access to potable water for outdoor activities, especially in parks, along trails, and at outdoor venues or downtown. The spacing and maturity of trees along corridors can significantly lower the ground and human height temperature. Ground temperature reduction also benefits pets, whose paws can burn quickly on hot pavement.
Policy can also impact design choices that can promote more sustainable and resilient places. The Unified Development Ordinance and homeowner association covenants can allow for ground cover that is drought resistant and doesn’t require watering. These landscapes also require fewer chemicals to maintain their appearance and can reduce contamination in runoff, improving local water quality.
Beyond the recreation and quality of like benefits that sidewalks, perimeter trails, and named trails there are sustainability reasons for this infrastructure. When people feel comfortable walking and biking and there is infrastructure connecting them to destinations, they are more likely to replace short car trips with biking or walking. This reduces the need for fuel (including electricity) and on-site parking at destinations, creating less impervious surface.
Some public entities have prioritized using the US Green Building Council Leadership in Energy and Environmental Design criteria in their site planning and buildings, as have some significant businesses as they make new investment. These standards support reduced energy consumption, reduction of reliance on non-renewable materials, and efficiency in building systems.
Newer homes are generally built with energy efficiency in mind, but older homes may be past the lifecycle of some efficiency measures or need upgrades. Some homeowners may need assistance to modernize their windows, heating/cooling systems, roofing, insulation, or plumbing to be efficient, which increases affordability in the long run through lower utility costs. Homeowner improvement grants are tools communities use to assist lower income people in older homes. Reducing energy consumption for homeowners with inefficient systems maintains capacity in the network for the whole community.
Development density and intensity are also sustainability measures because they limit the land consumed for development and the distance that utilities like streets and water/sewer lines need to be extended to support the same amount of development that is lower density or intensity.
Utility infrastructure can play a significant role in resilience for disasters and non-disaster situations. Buried electrical lines are less vulnerable to ice and high winds. This results in fewer power outages and mitigates multi-day outages that affect travel, emergency response, food security, and care for vulnerable populations. Buried communication likes (phone, cable, internet) provide the same resilience for communication, a critical component of disaster response and coordination.
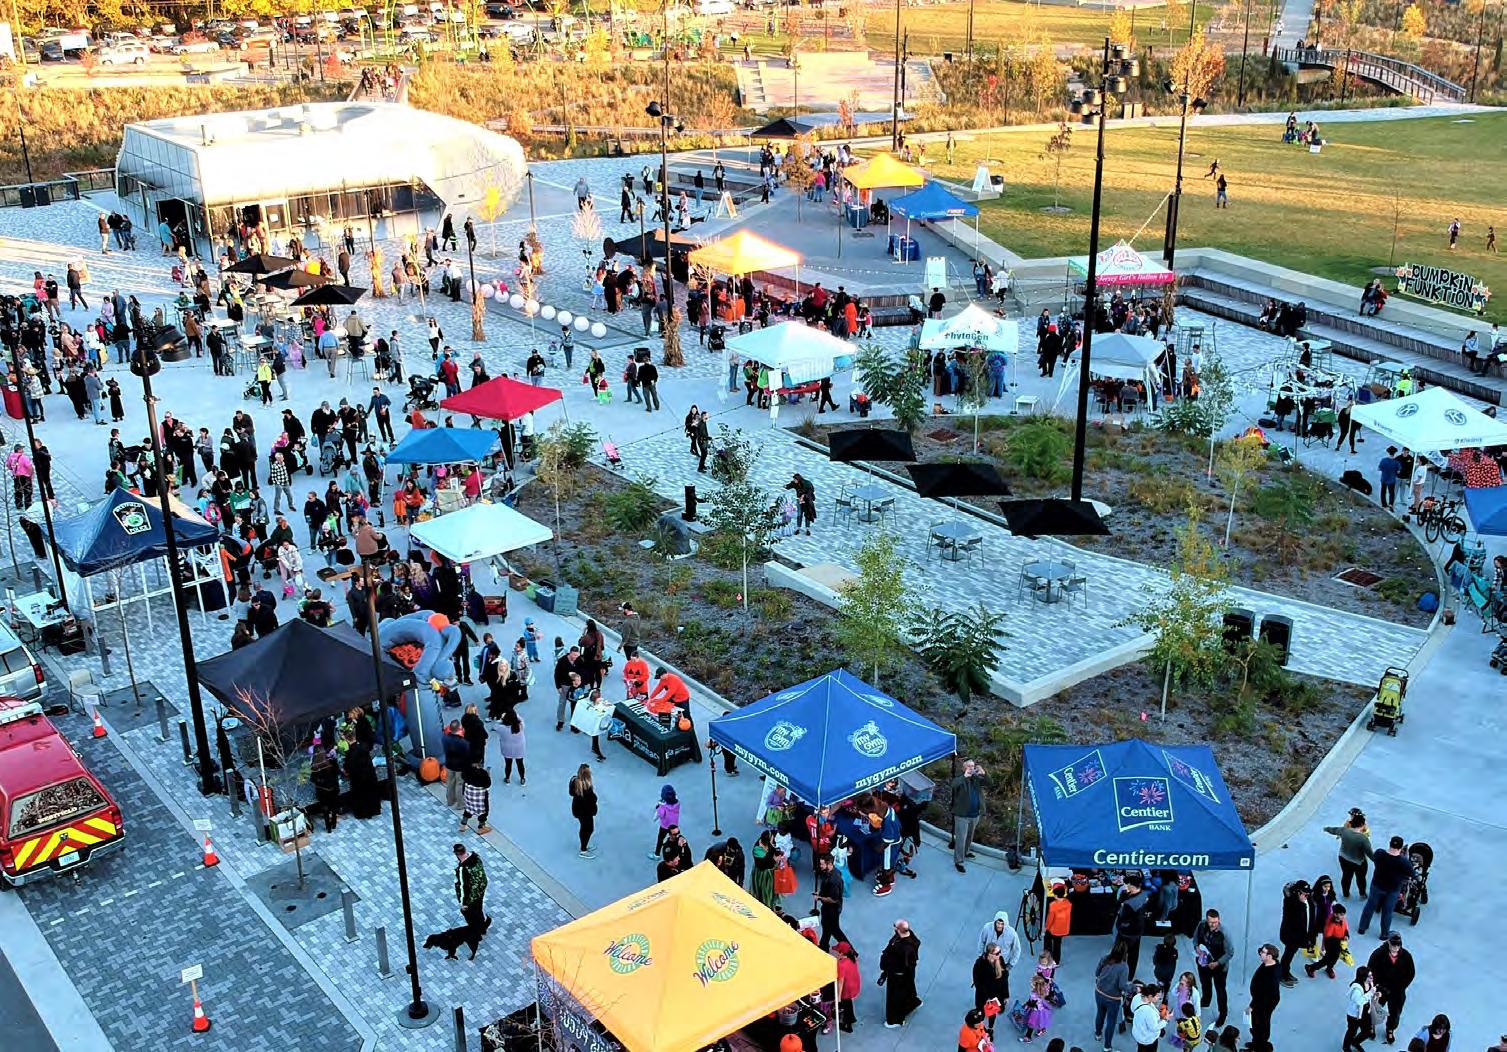
The comprehensive plan, by nature, is a future-oriented document that lays out the policy, design parameters, and action steps to advance plan goals. The planning process does not end with the adoption of the comprehensive plan. Chapter 7, the implementation chapter, provides directions on how to accomplish all the different policies and recommendations within the plan. Overall, implementation means using the Plan as a guide for zoning decisions, prioritizing projects, progress reporting, and more.
Implementation translates the visions and goals into meaningful change within the city. For each goal and associated objectives, action steps were created. These action steps vary and include:
• Regulatory changes
• Process updates
• Infrastructure improvements
• Studies and plans
• Policy changes
• Coordination with outside entities
Within this chapter is the implementation matrix, which takes each action step and assigns timing, priority, level of difficulty, lead agency, key partners, and relationship to other themes. While goals and objectives are organized by individual themes, they are all interconnected to each other. The implementation of the plan relies on treating each goal, objective, and action step as a piece of a whole, to ultimately achieve the city’s vision.
Extensive discussion occurred with city staff, the steering committee, focus groups, elected and appointed officials, and the community, to ensure the plan reflects the desired development pattern for the planning area. Based on the input from these groups, the plan identifies objectives for the entire planning area. The 20-year lifespan of this plan allows for ample time to implement the goals, objectives, and action steps, and to achieve desired land use patterns. It will take that 20-year lifespan to continuously implement tools such as Capital Improvement Planning, developing community partnerships, performing subarea and master planning, Unified Development Ordinance changes, integrating technology and data, streamlining development review, and more.
Looking to the Horizon does not make the decision for the city council, advisory plan commission (APC), or city staff. Instead, the plan serves as a guide and resource for decision-making by providing valuable data and establishing the city’s collective vision for where, and how much development should occur over time. In making decisions, staff, elected officials, and appointed officials should reflect on the city’s values, and make decisions that align with the intent and spirit of the plan.
The plan should inform day-to-day decisions concerning specific petitions that staff review. Staff should use the Placetypes Map, goals, and recommendations to help determine how best to implement the plan in both short-term and long-term planning. The recommendations and implementation strategies in this plan should not be the only guidance document for the city to make decisions. The plan cannot account for unknown future development projects that may arise over the next five to 20 years. The plan is intentionally written with a vision and broad goals to give the elected and appointed officials the latitude to make the best decisions in approving or denying future development projects based on changing conditions and values of the City of Westfield.
Although the city intends to administer this plan with available financial resources, additional funds may be needed to carry out some recommendations. Additionally, the city should seek funding from federal, state, or local grants, loans, or other mechanisms.
Several partners came together to provide input during this process. The implementation of this plan requires on-going relationships between stakeholders, property owners, business owners, community leaders, the city, private utilities, adjacent communities, and state. Strong partnerships are needed to foster good communication, provide other alliances in implementing some recommendations, and explore funding opportunities.
This plan was created to represent the community’s vision for Westfield’s future, and it is unlikely that this Plan has accounted for all types of development that may arise over the next 20 years. City staff, the APC, and city council must apply sound judgment to determine whether new proposals align with community goals.
The city is responsible for implementing the recommendations, reviewing, updating, and accomplishing the vision and goals in this plan. As the needs of the community change, the plan should be reviewed and updated regularly to align with those changing needs. It is recommended that this plan is reviewed on an annual basis to ensure that the vision, goals, and action steps are still applicable.
Planning is a dynamic process that responds as conditions change. Looking to the Horizon will need to be revised periodically to ensure it stays consistent and relevant.
Minor updates, such as revising or adding goals, or making minor updates to the Placetypes Map, should occur every three to five years or as necessary. These may include revisions to one or more sections of the plan due to changes within the market, infrastructure, a specific issue/policy change, or change in state law. A minor update may include small updates such as text corrections or map revisions.
Major rewrites should occur every 10 to 20 years or as necessary. This process should include a thorough review and evaluation of the vision and development policies contained within the plan. Policies that have been implemented or are no longer relevant should be changed or removed from the plan. New policies should be developed, if necessary, to accommodate any changes in conditions and ensure the plan is still effective. A plan rewrite should also provide opportunities for public involvement.
An annual review of the plan, as discussed under primary initiatives later in this chapter, aids in plan implementation. During the annual review process, it’s important to note areas of success to help build support for future planning activities. Identifying less successful components may suggest a need for an update or rewrite of a chapter.
Interpreting the plan requires professional judgment, consistency, and a shared understanding of community values. Looking to the Horizon serves as Westfield’s guide for land use and development policies to promote orderly growth and development within city and township. The long-range goals, objectives, and action steps, along with the supporting maps, are intended to guide development decisions towards the community’s collective vision of the future.
City staff, the APC, and city council should interpret the goals and objectives as long-term and deliberately broad. City officials cannot anticipate all circumstances. However, the spirit of this plan should be met to ensure that the community’s values are maintained. Members of the APC and city council should interpret the plan policy and action steps by saying, “given our long-term goals and changing community conditions, these are the projects and programs that we want to complete in the shortterm and long-term, and this is how we plan to accomplish them.”
Interpreting the plan in this way will enable the members of both the APC and city council to justify their approval or denial of any proposed development or redevelopment in Westfield and Washington Township. When a new annexation, rezoning, or subdivision request is filed with the city, staff should review and evaluate the application against the plan as well as the subarea plans and the city’s other ordinances. Staff should provide a staff report with a formal recommendation that includes an evaluation of the development and the degree to which the proposed project conforms to the plan’s goals, objectives, strategies, and Placetypes Map. If the APC recommends approval to the city council for numerous rezoning requests inconsistent with the Placetypes Map, the plan should be updated, as this is an indication that the city’s conditions, issues, or priorities are changing.
Looking to the Horizon does not contain the actual decisions that should be made; however, it serves as a reference and provides guidance in the community’s collective vision for the future growth and development of the area and should be interpreted as such.
Zoning protects the rights of individual property owners while promoting the general welfare of the community. The purpose of zoning is to locate specific land uses where they are most appropriate and ensure the built environment implements the building form designated by each placetype. In determining the most appropriate zoning designation, the city must consider such things as public utilities, road access, and the existing or established development patterns of the area in which development is proposed. From a policy standpoint, the plan provides guidance specifically for changes in land use through rezonings or future land use amendments. The city council and APC should consider the relevant section(s) of the plan when reviewing applications and desired changes.
If the application is supported by the relevant sections of the plan, as well as the statutory considerations in IC 36-7-4-603, then the rezoning/ amendment should be carefully considered. If the application is not supported by the relevant sections of the plan, then the city council and APC should either deny the application or approve the application with specific written commitments that would make it consistent with the intent of the plan. In general, the APC and city council should support a rezone under the following circumstances:
• When the requested rezoning is consistent with long-range plans adopted by the city council.
• When there was an error or oversight in the original zoning of the property.
• When changes have occurred to conditions in the vicinity of the property which prevent the reasonable use of the property as currently zoned.
• When the requested rezoning benefits the community at large.
• To implement adopted subarea plans or corridor plans.
Considering the needs of the city, current conditions data, and ideas discussed throughout the planning process, several initiatives have been identified as priority projects. These primary initiatives and their associated action steps should be used as the first set of work plan items to be prioritized and should be initiated within two years of the plan’s adoption.
Looking to the Horizon is a statement of policy, not a regulatory document. The most common tool for implementing the plan is through the UDO, as these ordinances regulate land use and development. The UDO defines the permissible uses, size, density, and character of development. Additionally, subdivision regulations within the UDO help control the construction of infrastructure and utilities that will be dedicated to the city upon completion. Throughout the plan, various goals, policies, and action steps directly reference or allude to changes in policy that could be accomplished by updating the UDO. Prioritizing updates to the UDO helps ensure that development and land use are in line with the vision of the plan.
The existing conditions analysis identified the desire for more pedestrian, bicycle, and other mobility facilities. While this plan contains several recommendations for sidewalks, trails, and street enhancements, the city should develop a more detailed and long-term program to identify, fund, maintain, and construct these quality-of-life projects. The Active Transportation Plan should identify infrastructure gaps, improve nonmotorized access to key destinations and integrate green infrastructure into areas to mitigate flooding and heat, while identifying the city’s priorities based on user data, emerging technologies, and evolving policy frameworks.
Capital Improvements Plans (CIP) are documents that cover a time frame of three to five years and are updated annually. CIPs aid in plan implementation by identifying and providing the necessary funding sources for short-range infrastructure and capital improvement projects. The CIP provides guidance and planning for capital improvements throughout the city and allocates financial resources to various community needs. The CIP states the city council’s prioritization of available financial resources for capital projects by identifying which projects should be included, when they should be constructed, and how they will be financed.
A CIP represents the city’s tentative commitment to comply with the plan unless circumstances or priorities change in the future. The commitment is more certain in the first year of the CIP and becomes increasingly more tenuous in subsequent years. Nevertheless, the CIP should be used as the city’s present plan and priority over the next three to five years. While the CIP is a planning document, it should not be an automatic authorization of the construction of projects, given the procurement process and the allocation of resources.
An annual report ensures ongoing engagement among city staff, officials, and residents. It should present new data and development trends that may necessitate an update to the plan to keep it relevant to desired planning outcomes. Additionally, it provides an opportunity to evaluate implemented strategies and incorporate new feedback from the public and elected officials that may have evolved since the plan’s adoption. By completing this report, the city staff will take a proactive and adaptive approach to planning, effectively responding to emerging trends, and ensuring that future development aligns with Westfield’s vision.
The following matrix serves as a framework for the city to partner with organizations and implement the goals, action steps, and objectives. Reporting on the implementation matrix should be completed as part of the annual report process. The matrix includes:
The priority level helps the city determine how to prioritize action steps based on the estimated level of impact to the community.
High Priority action steps should be some of the first steps to be started, resources allowing, as they significantly move the community vision along the path to achievement. These are typically completed within 1 to 5 years of plan adoption.
Medium Priority action steps may greatly impact certain areas within, but not the entire city. They may be highly interconnected with the success of other action steps. Medium priority action steps should be completed within 5 to 10 years of adoption of the plan.
Low Priority action steps are not immediately urgent and could, where possible, be delegated to a willing partner. Low priority action steps are typically completed beyond 10 years of adoption of the plan and should be reviewed at regular intervals to see if the priority has changed.
Ongoing action steps are the day-to-day operations performed by city staff that support the plan’s goals and objectives.
Level 1 has no or minimal challenges or constraints, and in some cases may be completed entirely by partnerships.
Level 2 has moderate logistical challenges or constraints such as staff availability or the availability of other organizations to collaborate.
Level 3 has moderate challenges or constraints, such as seeking a grant for funding or coordinating long-term planning efforts between multiple parties.
Level 4 has multiple and significant challenges or constraints, such as financial, but are oftentimes also the most important action steps to achieve the community vision. Level 4 difficulty may require multi-year funding or external partnerships.
Many parties will be identified on the following pages. City boards, departments, and officials are most likely to be identified, but community organizations are included as well. State and local government entities, non-profits, private consultants, and public-private partnerships may also be identified. The identification of responsibilities allows the city to know who should be involved in order to complete the action step. Parties are noted in alphabetical order. The order does not indicate primary responsibility by a party or parties.
The matrix is organized by theme in order of appearance in the comprehensive plan, starting with economic development and ending with utilities. Each goal, objective, and action step has a unique identifier for easier reference, using the identification system below: [Theme Initials] [Objective #]. [Action Step #]


OG.1
OG.3
Develop and monitor a system of community indicators concerning changes in demographics, the economy, transportation, the environment and other issues described in Looking to the Horizon. Use the indicators to measure overall success and to refine strategies when necessary. Include this information in the annual report.
Continue to develop subarea plans for areas that are undeveloped or changing. Develop studies, analysis and plans for neighborhoods, commercial corridors, employment centers and other subareas of the city where plans do not currently exist. Existing area plans should be updated to account for changes in conditions and opportunities. Each plan will identify and prioritize target areas for future planning and development based on agreed upon criteria.
Continue to make modifications and amendments to the city's UDO based on the Placetypes Map and as development needs change. Incorporate the 10 Principles for Successful Retail Districts into appropriate areas of the UDO.
Maintain a fiscal impact analyses tool for use by City Council to evaluate requests for annexation, zoning changes, development incentives or other development proposals.
Maintain and update Capital Improvements Plan to define priority capital projects and to leverage financial resources more efficiently.
Implement Arts Master Plan that identifies opportunities to further integrate public art into the city’s design and planning processes to help support the development of high-quality urban design and great places in Westfield.
Develop and maintain an alternative transportation plan that identifies gaps and points of connection for all forms of multimodal transportation including bike, pedestrian, e-bikes, scooters, golf carts, and trolleys. Ensure plan identifies primary and secondary routes, appropriate facility design standards, and street crossing treatments. Work with the community to prioritize needed connections and align improvements with the Capital Improvements Plan.
Community Development
Mayor, Economic Development Dept., Engineering, Stormwater, Parks & Recreation
Community Development
Economic Development Dept., Engineering, Parks & Recreation
Community Development
Economic Development Dept., Engineering, Parks & Recreation, Emergency Services
Economic Development, Housing, Quality of Place, Transportation, Utilities, Emerging Technologies
Economic Development, Housing, Quality of Place, Transportation, Utilities, Emerging Technologies
Economic Development, Housing, Quality of Place, Transportation, Utilities, Emerging Technologies
Development, Economic Development Dept., Mayor, City Council
Community Development, Mayor, Economic Development Dept., Noblesville Creates, Westfield Welcome
Development, Transportation, Utilities
Development, Quality of Place, Transportation
Goal: Position Westfield as a dynamic and resilient economic hub by fostering a diversified business base, cultivating innovation and entrepreneurship, strengthening workforce talent, and leveraging strategic investments in infrastructure, quality of place, and partnerships — ensuring the city’s sustained competitiveness, prosperity, and leadership within the regional economy.
Objective ED1: Create a robust, diversified economic base that can withstand market fluctuations and provide sustainable growth opportunities.
ED1.1
Target specific sectors for economic diversification ensuring that not one single industry is more than 25% of the employment.
ED1.2
Foster a culture where Westfield has a comprehensive business ecosystem.
ED1.3
Focus on economic resilience building to withstand market fluctuations.
ED1.4 Ensure the city provides opportunities for Class A office space.
ED1.5
Ensure existing businesses have the support they need to expand.
Economic Development Dept.
IEDC, Hamilton County, Indy Partnership, Indiana Sports Corp, International Center, Invest Hamilton County Economic Development
Economic Development Dept.
Economic Development Dept.
Economic Development Dept., Community Development.
Economic Development Dept.
Mayor, Invest Hamilton County, Westfield-Washington Schools, Chamber of Commerce, Indy Partnership, IEDC, Utilities
IEDC, Invest Hamilton County, Hamilton County Tourism, Indy Partnership
Community Development, Private Investors/Developers
Mayor, Community Development, Chamber of Commerce, WestfieldWashington Schools, Invest Hamilton County, IEDC, Utilities
Objective ED2: Cultivate a thriving innovation ecosystem that supports startup creation, business scaling, and technology adoption across all sectors.
ED2.1 Increase water, wastewater, power and fiber infrastructure to strategically drive economic development in key areas of the city.
ED2.2 Support private and nonprofit organizations in the creation of maker spaces and fabrication labs.
ED2.3 Collaborate with partners to support entrepreneurship programs and business technology advancements.
ED2.4 Connect entrepreneurs with angel and mezzanine financing.
7.3: Economic Development Matrix.
Economic Development Dept.
Economic Development Dept.
Economic Development Dept.
Economic Development Dept.
Engineering, Informatics, Hamilton County, Citizens Energy, Utilities, Developers
Development
Development
Development
Development
Economic Development, Utilities
Chamber of Commerce, WestfieldWashington Public Library, Universities, Westfield-Washington Schools, Local Arts Organizations, Central Indiana Corporate Partnership, IEDC Economic Development, Quality of Place
Westfield-Washington Schools, Business Community, Chamber of Commerce, PATTERN, Westfield Creative Collective
Economic Development, Quality of Place
IEDC, Invest Hamilton County, Chamber of Commerce, Indy Chamber, Local Banks Economic Development
Objective ED3: Build a skilled, adaptable workforce that meets current and future business needs while attracting and retaining top talent.
ED3.1
Continue to develop a comprehensive workforce development system in partnership with regional and local organizations.
ED3.2
Ensure talent attraction and retention strategies align with targeted industries but also have a greater focus on attracting young professionals.
ED3.3
Increase workforce resilience and adaptability as new technology emerges and changes.
Invest Hamilton County Economic Development Dept., Chamber of Commerce Economic Development, Quality of Place
Economic Development Dept. Businesses, Chamber of Commerce, Indy Chamber Housing, Quality of Place
Economic Development Dept.
Informatics, Universities, Library, Westfield-Washington Schools Economic Development, Quality of Place
Objective ED4: Create world-class infrastructure and quality of place amenities that support business operations and attract residents and visitors.
ED4.1
Identify strategic infrastructure investments that support economic development projects through the Capital Improvement Plan.
ED4.2 Implement a quality of place strategy that enhances traditional economic development initiatives.
ED4.3
Focus on development and redevelopment in strategic areas of the city to create robust community centers.
ED4.4 Incorporate streetscape enhancements and amenities throughout the city.
ED5.1
Economic Development Dept., Engineering MPO, Hamilton County, INDOT Transportation, Quality of Place
Economic Development Dept., Community Development, Welcome Westfield
Economic Development Dept., Community Development
Engineering
Public-Private Partnerships, Community Development, Parks & Recreation Quality of Place
Public-Private Partnerships, Community Development, Parks & Recreation Transportation, Quality of Place
Public-Private Partnerships, GPSE, Economic Development Dept., Community Development, Parks & Recreation Transportation, Quality of Place
Maximize economic development impact through strategic partnerships, regional collaboration, and multi-sector engagement.
Focus on public-private partnership relationships with existing and future investors.
ED5.2
Foster regional collaborations on key economic development initiatives that help Westfield reach its economic objectives.
ED5.3
Create a multi-sector partnership engagement strategy nationally and globally around key business sectors.

7.4: Economic Development Matrix continued.
Economic Development Dept. Public-Private Partnerships Quality of Place
Economic Development Dept., Community Development, Mayors Office
Economic Development Dept., Mayors Office
CIRDA, MPO, Indy Chamber, Invest Hamilton County Quality of Place
IEDC, Universities, International Center, Indy Chamber Quality of Place
Goal: Westfield will be a model community that provides diverse and accessible housing opportunities for residents across all income levels, life stages, and household compositions, while maintaining its distinctive character and quality of life through innovative planning, strategic partnerships, and equitable development practices that support long-term economic vitality and environmental stewardship.
Objective H1: Focus on regulatory and zoning modernization to provide housing opportunities in Westfield.
H1.1
H1.2
H1.3
H1.4
Allow accessory dwelling units (ADUs) as special exceptions in appropriate residential zoning districts in the Unified Development Ordinance (UDO).
Review and redefine the planned unit development (PUD) process.
Collect and analyze local housing data on an annual basis, including building forms, lot sizes, and architectural styles.
Develop a menu of development incentives that align private sector activity with community housing goals while maintaining fiscal responsibility and development quality.
Community Development Plan Commission, Board of Zoning Appeals, City Council Quality of Place
Community Development Plan Commission, City Council, Economic Development Dept. Quality of Place
Community Development Developers, MIBOR, BAGI Quality of Place
Economic Development Dept.
Community Development, City Council, Mayor Quality of Place
Objective H2: Develop village master plans for Lamong, Eagletown, Jolietville, Hortonville, and other applicable neighborhoods.
H2.1 Identify villages and other neighborhoods that require master plans and develop a process for creation of those master plans.
H2.2 Conduct baseline studies for each village, including land use, infrastructure, transportation, and community amenities.
H2.3
H2.4
Incentivize the preservation of existing historic or community identifying structures, where possible.
Emphasize the unique character or theme of focus of each place while also keeping the scale of development consistent with the village node.
Development
Development
Development
Development
H3: Align the placetypes map with regulatory standards to reflect the development patterns in the residential placetypes.
H3.1 Revise residential zoning districts to align with the placetypes map to allow the targeted densities, lot sizes, and building forms.
H3.2 Eliminate zoning barriers that prevent missing middle housing types and mixed use development formats.
H3.3 Incorporate form-based elements into regulatory standards to ensure compatibility in scale, setbacks, and streetscape design.
H3.4
of
H3.5
Development
Development
Development
Promote compact, multi-modal oriented, connected, and walkable neighborhoods that maximize infrastructure, preserves open space, and reduces per-capita municipal service costs. Community Development Engineering, Plan Commission, City Council, Economic Development Dept.
Embrace innovative housing types, construction methods, and financing mechanisms that respond to changing demographics, climate considerations, and technological advances while maintaining community character and supporting aging in place.
7.5: Housing Matrix.
Development, Quality of Place, Transportation
Development
Development, Quality of Place
Objective H4: Plan for mixed use trail-oriented development (TrOD) nodes along the Monon and Midland Trace Trails.
H4.1
H4.2
H4.3
Integrate missing middle housing types into the TrOD nodes around named trails.
Prioritize development projects that include more traditional urban form features into development such as front-facing pedestrian entrances, short setbacks, rear or side loaded garages, access to bike amenities, etc.
Require new developments within a certain distance of a trail to have bike and pedestrian infrastructure to support trail access and use.
H4.4 TrOD Nodes should be spaced to encourage walkable connectivity between them and to preserve natural areas.
H4.5
Ensure housing development is closely coordinated with infrastructure planning to ensure the growth is supported by adequate public facilities while maximizing efficiency and minimizing per-capita costs.
Objective H5: Support community land trust and related tools to increase the housing supply.
H5.1
H5.2
Partner with and support Hamilton County as they develop the land trust to advance housing supply.
Coordinate housing strategies with regional partners, employers, and neighboring communities to address housing needs on a metropolitan scale while supporting local economic development, workforce retention, and fiscal sustainability.
Community Development Plan Commission, City Council, Economic Development Dept. Economic Development, Quality of Place, Transportation
Community Development Plan Commission, City Council, Economic Development Dept.
Community Development
Community Development
Engineering
Engineering, Plan Commission, City Council, Parks & Recreation, Economic Development Dept.
Economic Development, Quality of Place, Transportation
Quality of Place, Transportation
Developers, Plan Commission, City Council, Parks & Recreation, Economic Development Dept. Economic Development, Quality of Place, Transportation
Developers, Plan Commission, City Council, Community Development, Economic Development Dept. Transportation, Utilities
Community Development Hamilton County Economic Development
Community Development HAND, MPO, CIRDA
Objective H6: Support diversification of the housing types and integration of neighborhood supporting uses into neighborhoods.
H6.1
H6.2
H6.3
Allow daily living uses in residential areas, particularly at key intersections. Daily living uses include grocery, gas, institutional uses, coffee shops, services, etc.
Encourage integration and ensure the UDO supports multiple housing types, densities, and price points in a single development.
Encourage creative and innovative developments, not just traditional subdivisions.
Figure 7.6: Housing Matrix continued.
Community Development Plan Commission, City Council
Economic Development
Economic Development, Quality of Place
Community Development Plan Commission, City Council Economic Development, Quality of Place
Community Development Plan Commission, City Council Economic Development, Quality of Place
Goal: People recognize the quality of place in Westfield that make it a choice community. It is a place where the local history and natural features are ingrained through public art and initiatives. Events, programming, and recreation for people of all ages is a focus of the Westfield community.
Objective QP1: Communicate and celebrate local history by continually developing public art and placemaking initiatives
QP1.1
Develop a public art implementation program aligned with the arts master plan.
QP1.2
Continue to support public art at Grand Park that highlights local sports history.
QP1.3
Coordinate the work of local organizations and schools for youth engagement in agriculture and underground railroad history.
QP1.4
Feature the local history in interactive public art along a named trail.
QP1.5
Integrate the celebration of Westfield history and assets (food, art, sports) into city celebrations (e.g. Westfield International Festival, Rock the 4th, Westfield in Lights).
QP1.6
Develop music and performing arts programming aligned with the arts master plan.
Parks & Recreation
Economic Development Dept.
Parks & Recreation
Parks & Recreation
Facilities & Events
Parks & Recreation
Objective QP2: Invest in local recreation facilities and programming for residents of all ages, abilities, and interests.
QP2.1 Plan, fund, and open a community recreation center.
QP2.2 Build out programming for each of the local parks.
QP2.3 Add additional park land in developing areas.
QP2.4 Include accessible play structures in park development.
QP2.5 Develop programming related to natural resources.
Parks & Recreation
Parks & Recreation
Parks & Recreation
Westfield-Washington Schools, Local Artists, Indiana Artisan, Westfield Creative Collective, Economic Development Dept. Economic Development
Hamilton County Tourism, Westfield Historical Society, GPSE, Visit Indiana Economic Development
Westfield Historical Society, National Underground Railroad Society & Museum, Conner Prairie, Stuckey's, Westfield-Washington Schools Quality of Place
Hamilton County, Westfield Historical Society Transportation
Private-Public Partnership, Westfield Historical Society Economic Development
Basil Playhouse, Westfield-Washington Schools, Facilities & Events, Chamber of Commerce Economic Development
Facilities & Events, Washington Township, Chamber of Commerce Economic Development
Township Parks, Hamilton County, YMCA, Facilities & Events Housing
Community Development, Township Parks, Developers Housing
Parks & Recreation Disability Council, Township Parks Quality of Place
Parks & Recreation
Township Parks, Hamilton County, YMCA, Facilities & Events Quality of Place
QP2.6 Connect existing perimeter trails and parks into a bicycle and pedestrian network. Engineering
Figure 7.7: Quality of Place Matrix.
Parks & Recreation, Neighborhood Associations/ HOAs Transportation, Quality of Place
Objective QP3: Encourage developments and industries that integrate conservation and restoration efforts for agriculture, including agri-tourism, and agri-neighborhoods and parks.
QP3.1 Establish development standards for agri-neighborhoods.
QP3.2
Work to develop plans that include agricultural elements west of Little Eagle Creek.
QP3.3 Support continued operation and expansion of agri-businesses (e.g. Urban Apples, Urban Vines, Stuckey’s) in the community.
QP3.4 Develop and support farm-inspired activities for all seasons.
Community Development Developers, Plan Commission, City Council, Current Farmland Owners Economic Development
Community Development
Economic Development Dept.
Private Owners
Engineering, Economic Development Dept., Plan Commission, City Council, Landowners, Developers, Agriculture Partners Economic Development
Current Business Owners, Purdue, Westfield-Washington Schools Economic Development
Community Development, Economic Development Dept., Facilities & Events Economic Development
Objective QP4: Establish quality tree standards and natural riparian corridors to preserve, maintain, and enhance the natural environment.
QP4.1 Require riparian corridor preservation in development standards.
QP4.2 Encourage preservation and maintain high-quality tree stands in development standards.
QP4.3 Explore a position of urban forester within the city administration.
QP4.4 Encourage planting new tree stands for future generations of Westfield residents.
Engineering, Community Development Plan Commission, City Council, Watershed Council, Hamilton County Sewer Committee, DNR Utilities
Community Development Plan Commission, City Council, Developers Quality of Place
Parks & Recreation Mayor, Hamilton County Forestry Quality of Place
Parks & Recreation
Objective QP5: Maintain and improve passive green spaces that provide valuable connections to nature.
QP5.1 Include passive spaces in park design.
QP5.2 Support development of a rural historic district where there are Indiana State Department of Agriculture Hoosier Homesteads.
QP5.3 Adopt a local right-to-farm ordinance to protect existing farmers (crop and livestock) from complaints related to urbanization.
QP5.4 Develop a natural trail or equestrian trail network in the rural southwestern and western portions of Washington Township.
Figure 7.8: Quality of Place Matrix continued.
Community Development, Hamilton County Forestry Quality of Place
Parks & Recreation Developers, Community Development Quality of Place
Community Development Landowners Quality of Place
Community Development Plan Commission, City Council, Legal Economic Development
Parks & Recreation
Equestrian Society, Engineering, Landowners Transportation
Goal: Westfield’s transportation strategy focuses on the modernization of the street network, ensuring the safe and efficient flow of traffic for all modes, reducing car dependency and supporting higher density housing types through improved pedestrian and bicycle infrastructure, enhanced transit service, and mixed use development patterns that integrate with housing, employment, retail, and service opportunities.
Objective T1: Maintain and modernize the street network to provide for current and future transportation needs that ensure safety for all modes of transportation.
T1.1
T1.2
T1.3
Right-size roadways based on density and intensity of users (ex: truck vs. car).
Expand the road network to include more east–west connections and more north–south connections on the west side of the city.
Add electric vehicle (EV) charging stations standards to the Unified Development Ordinance.
Engineering, Public Works
Engineering, Capital Projects
Community Development, Zoning
Community Development, Police, Fire/ EMS; Developers, Board of Public Works & Safety, Hamilton County Highway Dept., INDOT Transportation
Community Development, MPO, Utilities, Developers, Property Owners (ROW), Board of Public Works & Safety, Hamilton County Highway Dept., INDOT
Transportation
Legal, Building/Permitting, Sustainability, Electric Utility, Developers, Dept. of Public Works, Board of Public Works & Safety Quality of Place
Objective T2: Establish Street design standards including traffic calming tools, landscaping, and lighting standards to enhance safety and the user experience.
T2.1 Develop gateway branding and wayfinding.
T2.2
Use design tools such as curving streets and chicanes to slow traffic speeds in residential areas.
T2.3
T2.4
Implement pedestrian safety features through traffic calming methods, such as curb extensions or crossing islands.
Install pedestrian-activated signals at mid-block crossings to improve safety and visibility.
T2.5
Community Development, Communications, Economic Development Dept.
Community Development (Subdivision Standards),
Engineering
Engineering (Traffic), Public Works
Public Works, Parks & Recreation, Grand Park/Tourism, Chamber/Business Associations, Board of Public Works & Safety
Quality of Place
Developers, Fire/EMS (access), Police (education/enforcement), Board of Public Works & Safety Quality of Place
Community Development, WestfieldWashington Schools, Police, Neighborhoods/HOAs, Board of Public Works & Safety, Hamilton County Highway Dept., INDOT Quality of Place
Engineering (Signals/Traffic)
Westfield-Washington Schools, Parks & Recreation, ADA/Accessibility Advisors, Board of Public Works & Safety, INDOT Quality of Place
Replace traditional four-way stops with roundabouts at appropriate intersections to improve traffic flow and reduce crash severity.
Engineering, Capital Projects
Utilities, Police/EMS, WestfieldWashington Schools, Transit (if applicable), Board of Public Works & Safety, Hamilton County Highway Dept., INDOT Quality of Place
T2.6
Apply visibility standards for landscaping and signage at intersections to ensure clear sightlines.
7.9: Transportation Matrix.
Community Development (Ordinance), Code Enforcement
Public Works, Developers, HOAs, Landscape Architects, Board of Public Works & Safety Quality of Place
T2.7
Use dark sky lighting standards to balance safety with low light levels in residential areas.
Objective T3: Create a comprehensive trails plan for trail development and design.
T3.1
T3.2
T3.3
Inventory and map all existing trails in GIS including year built, width, material, condition, and maintenance/ownership.
Update the township-wide trails master plan that identifies priorities for expansion and improvement.
Fund and build out the gaps in the named trail and perimeter trail network.
T3.4 Update trail design standards that support safe use by pedestrians, cyclists, golf carts, and other micro-mobility options.
T3.5
T3.6
Increase the use of user-friendly wayfinding signage that provides directional information and distance markers.
Incorporate interactive elements, public art, and unique lighting features to enhance the trail experience.
T3.7
Community Development (Ordinance), Building/Permitting
Informatics (GIS)
Parks & Recreation, Community Development
Parks & Recreation, Capital Projects
Community Development, Parks & Recreation
Electric Utility, HOAs/Developers, Police, Dept. of Public Works, Board of Public Works & Safety Quality of Place
Engineering, Community Development, Parks & Recreation Transportation
Engineering, Westfield-Washington Schools, MPO, County Parks, Trail/User Groups, Dept. of Public Works, Board of Public Works & Safety Transportation
MPO/Grantors, Developers, Landowners, Utilities, Dept. of Public Works, Board of Public Works & Safety, Hamilton County Highway Dept., INDOT Quality of Place
Police (golf cart rules), Legal, Accessibility Advocates, Dept. of Public Works, Board of Public Works & Safety
Parks & Recreation
Parks & Recreation, Arts Commission
Communications, Tourism/Grand Park, Public Works, Board of Public Works & Safety
Arts & Culture Groups, Donors/ Sponsors; Utilities, Board of Public Works & Safety
Quality of Place
Quality of Place
Quality of Place
Educate the public about safe trail use and trail user etiquette to promote shared responsibility and enjoyment.
Parks & Recreation, Communications
Objective T4: Provide public transportation between important destinations in and around Westfield.
T4.1
Conduct a feasibility study for a shuttle or trolley service between Grand Park and downtown Westfield during major events to reduce parking demand and support tourism.
T4.2
Install bike share stations at key destinations including downtown, Grand Park, the YMCA, and the library to support short-distance travel and active transportation.
Economic Development Dept., Grand Park Authority, Transportation
Community Development, Parks & Recreation, Economic Development Dept.
Westfield-Washington Schools, Police, Community Groups, Trail Ambassadors, Board of Public Works & Safety Quality of Place
Event Organizers, Parks & Recreation, Police (traffic control), Downtown Businesses, Vendor/Operator, Dept. of Public Works, Board of Public Works & Safety Economic Development, Quality of Place
Bike Share Vendor, YMCA, Library, Sponsors/Advertisers, Property Owners, Dept. of Public Works, Board of Public Works & Safety
Economic Development, Quality of Place
T4.3
Participate in regional planning efforts to explore future public transportation options that connect Westfield to neighboring communities.
Figure 7.10: Transportation Matrix continued.
Community Development, City Administration
Indy MPO, Hamilton County, Transit Providers, INDOT, Board of Public Works & Safety
Transportation, Economic Development, Quality of Place
Goal: Ensure utility infrastructure accommodates growth through proactive coordination with utility owners and developers, protection and maintenance of existing assets, and prioritization of green infrastructure.
Objective U1: Promote safe and reliable water service by fostering strong partnerships with Citizens Energy Group, ensuring that infrastructure investments, service delivery, and long-term planning align with the city’s growth.
U1.1
U1.2
U1.3
U1.4
U1.5
Follow the application procedures outlined in the most recent version of the Citizens Energy Group Water Standards Manual for water main and service line construction.
Coordinate with Citizens Westfield to ensure there is sufficient drinking water storage within the distribution system, typically equal to the average daily consumption.
Verify new development complies with Citizens Westfield’s Wellhead Protection Plan.
Sustainability
Engineering
Engineering Community Development, Hamilton County Surveyor
Highlight and amplify water conservation tips and practices published by Citizens Westfield. Communications
Work with Citizens to establish maintenance easements for existing infrastructure with clear stipulations on allowable development to allow access for repairs and rehabilitation. Engineering
Sustainability
Community Development, Hamilton County Surveyor
Objective U2: Ensure reliable, affordable, and environmentally responsible wastewater treatment services through proactive coordination with Citizens Energy Group, safeguarding public health and water quality while aligning infrastructure investments with the city’s long-term growth.
U2.1
U2.2
U2.3
U2.4
Follow the requirements and procedures outlined in the most recent version of the Citizens Energy Group Sanitary Standards Manual for issuance of approvals and permits and acceptance of sanitary sewer facilities.
Where sewer is not available for new or existing development, ensure customers are informed of septic system maintenance requirements and potential signs of malfunction. Engineering
Coordinate with Citizens Westfield to proactively upgrade the wastewater treatment plant to accommodate increased flows from future development prior to reaching 90% capacity.
Coordinate with Citizens Westfield to ensure existing trunklines have capacity to accept flows from areas of new development.
U2.5
Development, Economic Development Dept.
Community Development, Hamilton County Surveyor, Hamilton County Health Dept.
Economic Development Dept., Community Development
Work with Citizens to establish maintenance easements for existing infrastructure with clear stipulations on allowable development to allow access for repairs and rehabilitation. Engineering Community Development, Hamilton County Surveyor
7.11: Utilities Matrix.
Sustainability
Sustainability
Objective U3: Develop and maintain a resilient, efficient, and sustainable stormwater infrastructure system that protects public safety, improves water quality, reduces flooding risks, and supports community growth while enhancing natural ecosystems.
U3.1
Utilize stormwater BMPs as landscaping, prioritizing native plants and trees, to provide a natural aesthetic in new development and increase flood resilience.
U3.2
Establish a long-term maintenance plan for stormwater infrastructure.
U3.3 Incentivize incorporation of green infrastructure in new development.
U3.4
U3.5
Address flooding and drainage problems in older neighborhoods utilizing strategies identified in the Stormwater Master Plan.
Establish maintenance easements for existing infrastructure with clear stipulations on allowable development to allow access for repairs and rehabilitation.
Figure 7.12: Utilities Matrix continued.
Stormwater Engineering, Community Development
Stormwater Engineering
Utilities, Quality of Place, Sustainability
Utilities, Sustainability, Emerging Technologies
Stormwater Engineering, Community Development, Economic Development Dept. Utilities, Sustainability, Emerging Technologies
Stormwater Engineering, Community Development
Utilities, Housing, Quality of Place
Stormwater Engineering Utilities

Most of this history was taken from the following books: Our Westfield 1834 – 1984: A History of Westfield and Washington Township; A History of Westfield Indiana: The Promise of the Land, Tom Rumer; and Westfield A Period of Growth and Progress, David K. Muller.
The area now known as Westfield-Washington Township was first inhabited by the Delaware and Miami Native American tribes. A group of Quakers from North Carolina arrived and settled in the area in 1832. Carolinian Quaker’s came to Westfield, in large part to escape the slave economy of the South. Westfield was officially platted on May 6th, 1834, with 48 lots that were 82 ½ feet in width and 156 ¾ feet deep. The plat had two “Main Streets” and Walnut and Cherry Streets, and the alleys Oak, Vine, and Mulberry. The town was incorporated fourteen years later, in June of 1848. The town continued to grow slowly. Union High School, now Union Bible College and Academy, was founded on January 6th, 1861.
When the civil war began, some men from Westfield-Washington Township fought for the Union. There was a significant number of community members in Westfield who contributed to the Underground Railroad, hiding runaway slaves as they came from Madison up towards South Bend. However, there was also a significant amount of opposition to those aiding escaped slaves within the community. The relative lack of documentation regarding Westfield residents’ participation in the Underground Railroad is largely due to the dangers of its exposure within the community itself.
Most growth in Westfield and Washington Township from the 1800’s to the 1940’s was agriculture-related or small farmsteads. Some local shops developed around Union Street and what is known now as SR 32 and at US 31 and SR 32 including Pickett’s Cafeteria, which opened in 1958 at the southeast corner of SR 32 and Union Street.
In the 1960’s, changes began to occur. A sewer interceptor system was constructed at the “extended” South Street. Land began to be cleared for residential, commercial, and industrial growth. A plant producing concrete had recently been built at the edge of the southwest corner of town. The first commercial self-serve laundry opened, with a meeting room for women’s clubs.
In the 1970’s, new construction was continuing all around Westfield with $3.5 million in development; $1 million of that in light industrial initiatives, and the rest in residential construction. The building permit fees were three times that of the previous year. A quarter of a million-dollar sewer project included a new water tower on the west side of US 31. By 1973 the push for growth extended outside of town and into the township where there were few restrictions on land, two miles from the center of town. The county’s zoning was voted out in the 1950’s. In the early 1970’s a group of township residents joined with town residents to create some zoning, but an injunction was filed, and the effort was dropped. Zoning was finally created for North Union Street to allow only single family residential, which would preserve the historic charm of the residences. In 1979, the world’s largest Dairy Queen opened at US 31 and SR 32.
On May 11, 1977, the Town of Westfield joined with Washington Township under the township joiner law IC 18-7-6 (now IC-7-4-1200). This joinder established the Advisory Plan Commission and the planning jurisdiction of the town changed from just the town boundary to the entire township. The township became known as Westfield-Washington Township.
In the 1980’s, change to the town came again in the form of rapid, largescale growth and corporate headquarters instead of smokestacks. In 1981 the Chamber of Commerce was formed. In 1983 a much larger WestfieldWashington Library opened. By this time, there were only remnants of Jolietville left on SR 32, a once thriving village with a dry goods store, a couple of grocery stores, and a bank. One of the grocery stores and a bank were moved to Westfield. In 1984, the former high school on West Main Street was demolished – a large part of it had been destroyed by an immense fire in 1971.
In April of 1992, the town council announced its “Westfield 2000 Plus” initiative to address growth. The council worked with Ball State University students to ask the public “Who are we?” and “Who do we want to be?”. These were important questions as Westfield continued to grow, it needed to remain relevant. The responses students found were that Westfield
has a small-town atmosphere, proximity to a large city, an excellent school system, being near major transportation corridors, friendly people, historic background, and safety and cleanliness. The most significant need of the community was an updated and revised master plan, recreational facilities, solutions to traffic problems, maintaining a competitive downtown, and establishing a mutual relationship between the town and township.
Westfield became a city in 2008, changing its government structure to accommodate the needs of the rapidly growing community, which at the time saw its population grow over 5x its size from 9,293 in 2000 to 46,410 in 2020.
To distinguish itself from other communities and drive strategic economic growth, the city planned and developed Grand Park which opened on June 21, 2014. Grand Park has become the largest youth sports campus in the United States. Over the past decade, the city has continued to grow and change with increased emphasis on quality development and quality of place.
The planning area for this plan is Westfield-Washington Township, including the City of Westfield, which lies completely within the township. Through annexation Westfield has expanded to include most of the township south of SR 32, except for the area west of Little Eagle Creek. The city has also extended along the north side of SR 32 across to the Hamilton-Boone County Line and in areas northwest of US 31, with more limited growth northeast of SR 32 and US 31. The boundaries of the community don’t have “neat” edges as the community has primarily increased its physical footprint through voluntary annexation, as depicted in the image on the next page.
The City of Westfield is in the Indianapolis Metropolitan Area. The Indianapolis Metropolitan Statistical Area (a Census defined area) includes Boone, Brown, Hamilton, Hancock, Hendricks, Johnson, Madison, Marion, Morgan, Putnam, and Shelby counties.
Westfield is a member of the Indianapolis Metropolitan Planning Organization (IMPO). The IMPO convenes, plans, and funds projects in Central Indiana. They primarily fund transportation projects and can distribute funds through a competitive process to communities within their membership. For transit, Westfield is a member of the Central Indiana Regional Transportation Authority (CIRTA), which allocates federal transportation funds for transit outside of providers like IndyGo. Westfield is also a member of the Central Indiana Regional Development Authority (CIRDA), which funds projects in Central Indiana and beyond, primarily through participation in the State of Indiana READI program.
Westfield’s Government consists of an elected administration of a mayor, clerk-treasurer, and a seven-member city council. The change to a mayorcouncil form of government came in 2008 as the Town of Westfield became the City of Westfield.
The city has departments for communications, community development, economic development, parks and recreation, and public works – in addition to human resources, information technology and mapping, legal, police, and fire. Westfield also has a manager for the facilities and events department, which plans events and engagement opportunities for the city. The public works department includes engineering, stormwater management, streets, and bike and pedestrian improvements. Community development includes long-range planning, current planning and zoning, compliance, and building.
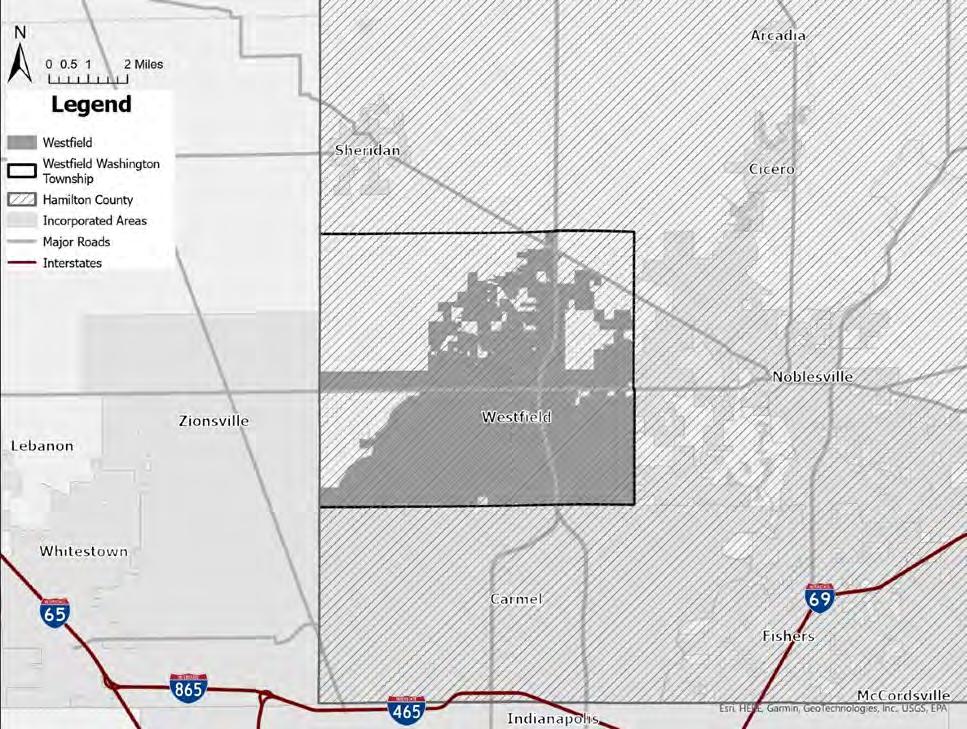
This section provides a high-level analysis of foundational plans, studies, and initiatives that inform Westfield’s development strategy. This review synthesizes insights from previously adopted documents, comprehensive plans, thoroughfare plan, downtown plan, parks and recreation plan and stormwater strategy, to establish a framework for understanding current opportunities and challenges. By evaluating the alignment of key projects, such as trail and roadway expansions and the Grand Park development, with overarching community goals, this section identifies how past planning efforts and policies continue to shape Westfield’s landscape. The analysis aims to ensure continuity, avoid duplication, and prioritize strategic investments that resonate with the city’s growth and quality-oflife aspirations.
While the overall planning jurisdiction of Westfield-Washington Township hasn’t changed, the city has grown not only in population, but also geographically, by annexing additional property from Hamilton County. The land use pattern has changed significantly over the years, requiring specialized subarea plans due to the transformative change based on some of these initiatives. This has led to several amendments to the existing comprehensive plan, completing subarea plans for many different areas within Westfield including Family Sports Capital, Grand Junction, Family Sports Capital 2, Grand Junction Implementation Plan, Spring Mill Station, Grand Junction Sub-district, and Village Farms.
The comprehensive plan is a strategic document aimed at guiding growth and development while maintaining the area’s character and livability. It highlights themes such as promoting contiguous development, preserving rural and small-town atmospheres, and encouraging connectivity through enhanced transportation and pedestrian networks. The plan emphasizes land use diversity; balancing residential, commercial, and recreational spaces to meet the needs of a growing population. Key objectives include preserving natural areas, ensuring fiscal responsibility in new developments, and using innovative planning tools like conservation subdivisions to blend growth with environmental preservation.
The plan comprises four chapters: an introduction and framing the vision and themes, a detailed land-use strategy, a specific focus on revitalizing the downtown area, and an implementation framework. Policies are aimed at managing growth sustainably, fostering connectivity between neighborhoods, and ensuring development aligns with the township’s infrastructure capacity. The document incorporates extensive public input and serves as a guide for zoning, subdivision regulations, and infrastructure planning to support a thriving, balanced community.
This addendum establishes a long-term vision for the Grand Junction project including Grand Junction Plaza, landmark-quality civic facilities, an extended trail system, an extended street network, enhanced stormwater facilities, signature gateway development, and sustainable design and development. It is structured for short, intermediate, and long-term improvements. This plan has been implemented.
This addendum provides a summary of the past planning activities related to what is now known as “The Grand Junction”, Westfield’s historic downtown area, organizes and clarifies the various objectives identified in the planning exercises, identifies the geographic area of the Grand Junction District, and prioritizes specific action items or projects necessary to accomplish the Grand Junction vision. After reviewing all documents created for Grand Junction authored from 1993 to 2013, there were fifty-two distinct planning objectives. After this planning process, there were 10 working items that became key for implementation. Most of these initiatives have been implemented except for Gateway and Junction sub-district standards. These are currently underway in the current 2025 planning document being completed for downtown. The other initiative was transit. While there has been discussion about circulation between Downtown and Grand Park, nothing has been formalized. This idea has been raised in focus groups, meetings with staff, and identified by the public.
This plan, completed and amended to the comprehensive plan in 2016, establishes sub-districts within the “Grand Junction District” and the vision and expectations for each subdistrict. The subdistricts include the Gateway, Junction, Union, Kendall, and Neighborhood sub-districts. At the time, it was anticipated that Planned Unit Development Districts (PUDs) zoning would be used for new development within these districts. Therefore, within the plan, a vision, land uses, development standards, and alternative transportation connections were established for each sub-district and village to guide the development of the PUDs so they were consistent with the vision of the plan.
There were two addenda to the comprehensive plan related to the Family Sports Capital of America. The purpose of these addendums was to provide direction for the development of a regional/national intergeneration sports facility within the City of Westfield. Three goals were identified in the first addendum which included providing intergenerational health, recreation, and sporting opportunities while providing facilities for state, regional, and national tournaments. The second was to cooperate with the Hamilton County Convention and Visitors Bureau (HCCVB) to make Westfield the Family Sports Capital of America. The third was to pursue economic development opportunities to capitalize on Westfield’s already-developing intergenerational sports niche. The sports commission at the time determined in this amendment that the city and the HCCVB should move forward with the planning efforts for the development of such facilities.
The second addendum recommends a location for the sports facility within Westfield – an area generally described as land south of 196th street, east of Spring Mill Road, north of State Road 32, and west of US 31. It also identifies that any sports initially offered within the sports campus be selected based on demand, mission, cost and ability to conduct multiple sports on fields design to accommodate a variety of sports uses. It lists the types of sports the facility should accommodate. These addendums are both completed and have since been superseded by the Grand Park District Master Plan (2024).
The Spring Mill Station addendum identifies the intersection of 161st Street and Spring Mill Road as the general area of Spring Mill Station and identifies several recommendations regarding the public and private realms of development. This addendum recommendation was put forth by the Spring Mill Station task group. Recommendation areas included branding of the area, land uses permitted within the area, architectural and site design standards, development strategy, financial strategy, and economic development initiations. This plan has been implemented and is nearly built out and is currently undergoing roadway enhancements including a roundabout at the intersection of 161st Street and Spring Mill Road.
The Village Farms addendum was a neighborhood plan developed to establish a vision for the future of the Village Farms neighborhood, which included approximately 1,700 residents. This addendum examined areas outside and adjacent to Village Farms to identify recommendations to both the public and private realms of development. The advisory group who oversaw the development of the plan made six key recommendations including upgrading key intersections such as Greyhound Pass and Oak Ridge Road, complete a traffic and pedestrian study, review existing conditions of the amenities throughout Village Farms, especially on the detention/retention ponds and the drainage between them along Greyhound Pass and Adios Pass. Recommendations also included an inventory social activity to prepare a list of best practices among other neighborhoods, creating a revised brand and promotion strategy for Village Farms, and identifying opportunities for Village Farms to participate in activities with the city and Westfield-Washington School Corporation.
The road network in Westfield has developed significantly over the years to support the development pattern. The greatest impact came from the upgrade of US 31 into a limited access freeway which also contributed to additional growth in the jurisdiction. Further amendments were made to enhance connectivity between developments and to accommodate increases in traffic from these developments. The city also incorporates a complete-streets approach into new and upgraded roadways to accommodate bicycle and pedestrian facilities within both city and developer-led projects.
The 2006 Thoroughfare Plan for Westfield-Washington Township establishes a strategic framework for managing transportation infrastructure to support anticipated growth and regional connectivity. It emphasizes a functional classification system for roadways, which includes primary and secondary arterials, collectors, and local roads, aimed at balancing mobility with accessibility. The plan identifies critical projects such as upgrades to US 31 to freeway standards, enhancing east-west traffic flow, and incorporating alternative transportation routes like trails and bicycle paths to improve multi-modal connectivity.
The plan also integrates right-of-way preservation standards to accommodate future infrastructure needs and emphasizes collaboration with regional stakeholders, including INDOT and neighboring jurisdictions, to ensure cohesive development. Bicycle and pedestrian enhancements, including the Monon Trail and Midland Trace Trail extensions, align with broader regional initiatives to promote walkability and recreational opportunities. The recommendations aim to ensure sustainable, efficient, and safe transportation solutions that align with the area’s land-use patterns and growth projections. Overall, many of the thoroughfare plan projects and principles have been implemented, however, as noted through various outreach efforts, the city has not been able to upgrade infrastructure as fast as the city has been growing.
The 5-Year Parks and Recreation plan is a guide for the Parks Board and Parks Department established in 2024. Prior to then the parks operated under Public Works. The purpose of the plan is to chart a path forward for the department and the board, document the initial state of Westfield Parks, and set a near-term plan. The mission is to enhance the quality of life by connecting residents and visitors of Westfield to each other, the natural environment, and unique recreation amenities. Maintenance of the parks has historically been contracted to vendors and 70 percent of the parks’ operating budget is for maintenance. The budget of $3.44 million in 2025 was funded through the general fund, local income tax, and onetime impact fees. The impact fee is $3,458.34 per new residential unit. There are nine parks’ departments in Hamilton County and three have overlapping jurisdiction in Westfield: the city, the township, and the county. The survey found residents aren’t concerned with “ownership” of the parks and consider jurisdictional boundaries, even with other communities, to be permeable when it comes to park access. Priorities established in the plan were: land acquisition (identified as the most significant challenge), completing Simon Moon Park, developing Armstrong and Osborne Parks, completing Grand Park, accommodating increased demand for splash pads and shelters, and stewardship of tax dollars. An observation was made that the department’s staffing is low relative to other similar jurisdictions.
The Downtown Westfield Plan outlines a vision for a vibrant, walkable downtown core that balances growth with historical preservation and community character. The plan emphasizes creating mixed use spaces that support live, work, play, and stay activities, with a focus on connecting residents and visitors to key destinations through improved trails and greenways. A new Grassy Branch Park and Greenway are proposed to integrate recreation with ecological restoration, linking trails and providing scenic, passive spaces. Transportation improvements aim to ease congestion with new road extensions, a redesigned grid, and enhancements to State Road 32, while creating safer, more pedestrianfriendly streetscapes. Development is planned to concentrate higher-
density uses along the US 31 and Main Street corridors while transitioning to more residential-focused areas elsewhere to maintain neighborhood compatibility. Key projects include expanding Park Street as a unique dining and entertainment corridor, adaptive reuse of historic structures, and promoting sustainable growth through mixed use developments. The plan envisions a blend of modern infrastructure and natural spaces that reflect Westfield’s charm, providing amenities to support its growing population while reinforcing its identity as a destination within Hamilton County. This plan was used to create a more detailed strategy for the development of downtown for both the public and private realm. Subdistricts and design standards for these subdistricts were being developed during the creation of the comprehensive plan update. The findings and direction of this plan will be incorporated into the placetypes of this updated comprehensive plan.
The downtown redevelopment plan is a vision for the growth of downtown Westfield over the next two decades. It establishes a vision that downtown will…
• Be a walkable community that connects memorable places
• Capitalize on the green investments and amenities
• Shift the center of development to create identity, places, and experiences.
The plan creates core opportunities from challenges that include a walkable community, attachment to place, a unique downtown identity, capitalizing on the green investment, connecting ‘here’ to ‘there,’ and shifting the center of development. It addresses walkability, in part, though a downtown loop of linked multi-use trails that act as a bicycle and pedestrian ring road around downtown. Development plan areas include the downtown core, Main Street, residential/general infill, Creekside residential, and the legacy and historic core. The plan proposes catalyst projects of the Carnegie Plaza block, the bank block, parking garage integration, and public space enhancements. It establishes design guidelines for downtown development.
Hamilton County Tourism and the City of Westfield partnered to complete an area-wide master plan for future destination development in Westfield. The study included a market supply and demand analysis that revealed there is strong demand for residential/multifamily housing, hotels, unique retail, traditional retail and restaurants, corporate flex/R&D space, and parks, trails, and natural/destination assets in the area. There were three phases of work presented, Phase 1 being 1-3 years, Phase 2 being years 3-7, and Phase 3 being 7-10 years out. It indicated full build out of retail at 250,000 sq.ft., office at 224,000 sq.ft., residential at 920 units, and 200300 keys of hotel rooms. These concepts will be incorporated into the placetypes within this updated comprehensive plan.
The Water Quality Characterization Report (WQCR) and Stormwater Quality Management Plan (SWQMP) were developed for the City of Westfield as part of compliance with the NPDES Phase II MS4 General Permit requirements. The purpose of the study is to access water quality and potential pollutant sources, develop management plans for reducing stormwater pollution, and to align with regulatory updates under the MS4 general permit. The report documents existing conditions, land use, watersheds, and water quality findings, and identifies sensitive areas, potential pollution sources, and potential stormwater management measures. The plan is designed to mitigate development impacts, improve water quality in impaired streams, and ensure compliance with state and federal standards. Strategies include increased inspections, targeted education, and systematic updates to infrastructure and policies.
Westfield-Washington Township often benchmarks against other cities in Hamilton County, including Carmel, Fishers, and Noblesville. All three communities are larger than Westfield and most recently have experienced slower growth. Carmel has a population of approximately 102,150 and grew 0.2 percent between 2022 and 2023. Fishers has a similar population to Carmel, 102,150 and grew at 1.9 percent. Noblesville is the smallest of the other communities, and the county seat. It has a population of 73,092 and grew at 1.1 percent between 2022 and 2023. Westfield grew at 5.6 percent in that timeframe.
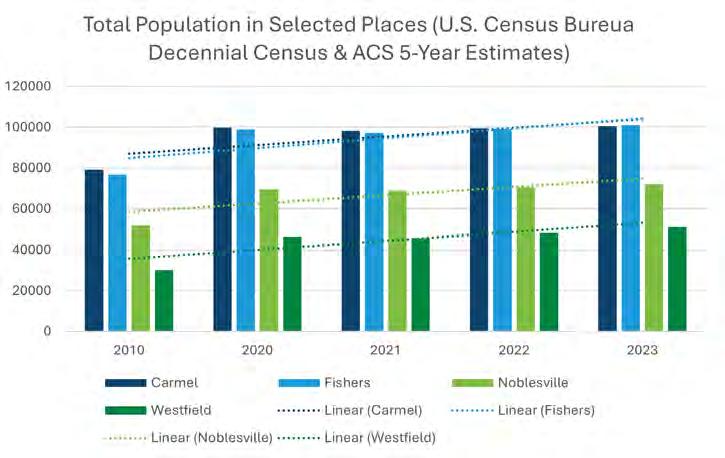
The most significant initiatives of Carmel over the past decade are the development of Midtown Plaza, the Art & Design District, City Center and their connection via the Monon Boulevard. Midtown Plaza is the revitalization of a former industrial area into entertainment, urban lifestyle housing, and commercial activity. Major employers have made their home in Midtown Plaza.
The Art & Design District features work from established and emerging artists and culinary arts, typically with outdoor dining. Art and design focused businesses are in the district, bringing employment and commercial activity through retail and professional offices. Townhomes and condo development is the critical residential component of the district. The Monon Boulevard connects the two with a wide right-of-way that emphasizes bike and pedestrian traffic and community experience over auto movement. The boulevard includes greenspace, public art, and a spray plaza.
Other initiatives include the Waterpark at the Monon Community Center and the Ice at Carter Green, creating year-round activity in the community. The waterpark has amenities like FlowRider and an AquaClimb wall as well as an interactive kiddie pool, concessions, cabanas for rent, events including sensory swims, a separate lap and activity pool, lazy river, and a plunge slide as well as adventure slides. The Ice at Carter Green provides ice skating in the winter months when outdoor ice can be maintained.
Carmel’s land use mix remains heavily residential at 78 percent of their land area (Westfield’s land use mix is discussed beginning on page 20). Six percent of their land area is commercial, industrial, and mixed uses. Parks, recreation, and open space account for two percent of the land area. Only 14 percent of the land is in uses like agriculture, institutional, or vacant land. Carmel is land-locked and will have to consider redevelopment options like encouraging mixed use and increasing density through redevelopment.
Carmel’s vision is “Built for Dreams,” and the city’s policies are focused on transportation investment, particularly roundabouts and trails, parks investment, redevelopment, and implementation of their climate action plan. They use tax increment finance (TIF) as a powerful redevelopment tool in combination with municipal bonds. The city has been successful in securing grant funds from regional, state, and federal sources to bolster their high quality of life.
Fishers is another rapidly growing community on the northeast side of Indianapolis. Their recent initiatives include the Fishers Agri-Park, the Nickel Plate District, Fishers District (The Yard), and Geist Waterfront Park. The Agri-Park is a barn and nature-themed playground with classrooms and programming space. It will be home to a market store and u-pick produce. Walking trails and animal encounters round out the experience.
The Nickel Plate District is a trail-oriented development along the Nickel Plate trail and adjacent to the city’s civic buildings and amphitheater. It is a downtown cultural district with restaurants, offices, and residences. The Fishers District, and the Yard at Fishers District, has stores, dining, movies, and luxury apartments in a compact development area that also enjoys regular programming like happy hour, fitness activities, and family game nights.
Geist Waterfront Park is a public 70-acre waterfront park with a beach and water access, dock and boat access, and traditional park features like picnic tables and shelters, playgrounds, and walking trails.
The land use mix in Fishers is more diverse than Carmel or Westfield, with 65 percent of the land area in residential uses with nine percent commercial and office uses. Parks, recreation, and open space occupy seven percent of land in Fishers. Only 15 percent of the land area is in other uses including agriculture.
Fishers is known as a smart, vibrant, and entrepreneurial city. The city’s policy agenda is focused on neighborhood development, supporting high-growth companies, and innovative city processes. The 2040 comprehensive plan has topical areas of land use, housing and neighborhoods, transportation, and parks. The city has initiatives focused on being age-friendly and sustainable.
Federal Hill and the Innovation Mile are two significant Noblesville initiatives. Federal Hill is adjacent to the historic downtown on the banks of the White River. It has a commons, apartments, mixed use buildings, offices and commercial spaces, and a parking garage. The district is being developed as a public-private partnership and is connected to Forest Park via a trail. The Innovation Mile is 600 acres adjacent to I-69 building out as a live, work, play, learn destination and business and technology hub. It has been designated as a Smart District including the street furniture, lighting, and EV parking.
Completed in 2020, the Noblesville comprehensive plan has desired outcomes of smart growth, complete communities, economic mobility, physical connectivity, vibrant downtown, strong sense of place, and smalltown charm.
Other communities with similar population and growth include Redmond, WA; Little Elm, TX; Eagle Mountain, UT; and, Beaumont, CA. Redmond, WA has a population of 80,280 and grew 4.7 percent. It is approximately 15 miles east of Seattle and has large employers like Microsoft and Nintendo of America. Little Elm, TX has a population of 58,496 and is in the DallasFort Worth Metro area. Eagle Mountain, UT has a population of 56,932 and grew 5.2 percent between 2022 and 2023. It is part of the Provo metro area and was incorporated in 1996. Beaumont, CA has a population of 58,463 and is located between the San Bernadino Mountains and the San Jacinto Mountains. It is not in a metro area, though it is located near Riverside and San Bernardino.
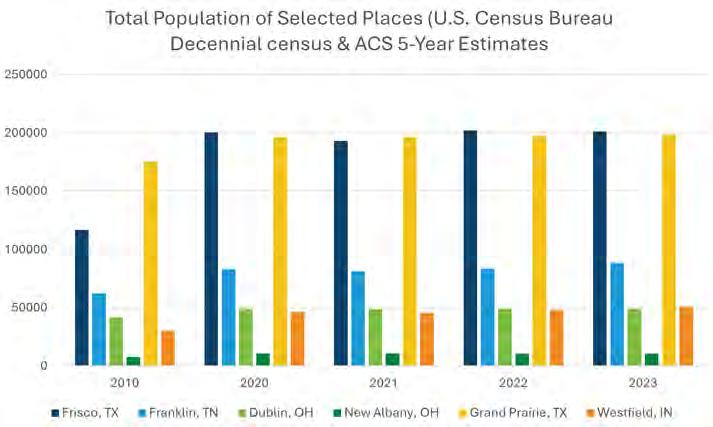
Frisco had a 2023 population of 201,238 which has grown 72 percent since 2010.
Frisco is the home of PGA America, which includes the corporate headquarters in a 600-acre mixed use development that hosts two championship PGA courses and a retail village. Riders Field is the baseball venue for an AA league affiliate. It has a 63,000-gallon lazy river. The stadium is part of a $300M public-private partnership in 2002 that includes the Dallas Star headquarters and practice facility, a gymnastics center, a hotel and convention center, as well as retail, residential, and office uses. The Ford Center at the Star includes a 510,000 sq.ft. indoor athletic facility and is the Dallas Cowboys corporate headquarters.
The aspirational outcomes of the 2025 comprehensive plan are growing together wisely, creating economic opportunity and world-class destinations, fostering human experiences and connections, reinvesting
in people and infrastructure, and promoting quality of life including parks and open space. The guiding principles are around people and culture, development and design, housing and community, jobs and finance, and regional influence.
Sixty percent of the land area of Frisco is in residential uses, and 14 percent in parks, recreation, and open space. Only eight percent of the land area is in other uses including agriculture, institutional, and vacant land.
Franklin had a 2023 population of 88,558 and growth of nearly 42 percent since 2010.
Franklin has invested in parks and recreation through Bicentennial Park, the Horlinsdale Barn event space, Liberty Park, and Robinson Lake Dam and Park. Bicentennial Park has trails, picnic areas, and a stage in a 10acre park. Liberty Park has pickleball facilities, restrooms, batting cages, a mountain bike trail, a pump track, and is home to the farmers’ market. Robinson Lake Dam and Park provide water recreation with a boat launch, canoe launches, and trails to enjoy lake views.
The guiding principles for development in Franklin are managed growth, economic vitality, vibrant neighborhoods, housing choices, historic preservation, natural beauty, exceptional design, connected community, and context-responsive infill development. These are expressed though investment priorities in connectivity and parks. They encourage missingmiddle housing and allow for ADUs and senior housing. There is an urban growth boundary to help manage growth and impact fees support development of needed assets. Conservation subdivisions are also used to manage growth and protect natural beauty.
Franklin has 34 percent of land area in residential use, 10 percent in parks, recreation, and open space, and four percent in commercial and office space. Nearly half of the land area is in other uses including agriculture.
New Albany is a suburb of Columbus, Ohio with a population of 11,770 and a median household income of approximately $200,000. Their attributes include proximity to the nearest metropolitan area, average commute times, high median household income, low crime rates, and favorable public-school ratings. They have 81 miles of trails and 9,000 acres of parks. Their land use is 57.5 percent commercial, 24 percent residential, 10 percent right-of-way and government uses, and 8.5 percent parks and open space.
Their strategic plan principles include a compelling environment, an exciting destination, a place where people take precedence, a connected community, carefully considered design, commitment to quality, recognizable community, comprehensive sustainability, collaborative growth, and accessible participation.
Dublin, Ohio is a suburb of Columbus with a population of approximately 50,000. They pride themselves on responsive services, attractive housing, superior public schools, direct regional highway access, abundant public space, and a dynamic community life. The comprehensive plan, Envision Dublin set forth the bold vision of the community as the most sustainable, connected, and resilient global city of choice. This is supported by values of respect, integrity, communication, teamwork, accountability, positive attitude, and dedication to service. The framework for the plan is sustainability, connectedness, and resilience. Growth areas are divided into development intensification, minimal change, new growth, and unincorporated. The city is home to 20 corporate headquarters, worldclass events, and the walkable urban Bridge Street District.
They have several projects underway including updates to more than 60 parks and 100+ miles of trails. They are burying utilities on High Street and constructing needed roundabouts. They launched a scooter and bikeshare program that includes e-scooters and e-bikes, and they use a geofencing system and no ride zones to manage conflicts. They also have a webpage for new residents to learn about services and amenities.
As an aspirational peer, Westfield looks to Grand Prairie, TX, had a population of 198,564 and grew 13 percent between 2010 and 2023. They have a growth rate like what Westfield has experienced though they are now a significantly larger community. Their investment in recreation and mixed land uses is an example of opportunity for Westfield.
The city’s initiatives include the Fish Creek Trail Enhancements, murals and public art, and Epic Central. Enhancements to the Fish Creek Trail provided pedestrian lighting. Epic Central is a 172-acre entertainment district with dining, attractions, water activities, pickleball courts, and family entertainment. The district features water projection and a light show like Las Vegas. There is an indoor adventure park as well as TOP Golf, walking paths, and a hotel and convention center. Epic Waters is an 80,000 sq.ft. year-round facility with FlowRider, a lazy river, and an arcade. It is home to Andretti Indoor Karting, Prairie Lakes and Tangle Ridge golf courses, pools, and a splash factory with age-specific play areas. The Kirby Creek Natatorium is open year-round as well.
The city has an online Government 101 FAQs page that answers many of the questions that residents and visitors ask about the community. Their comprehensive plan pillars include being a healthy community, a smart community, and sustainable. The housing policies are developed around the idea that no one type of housing is dominant in the community with specific policies by zone. The community’s economic development agreements are online. Downtown and corridor plans support the community’s development objectives.
Less than 40 percent of the land in Grand Prairie is in residential use, 10 percent is in commercial and office with another six percent in mixed use development, and 14 percent in industrial use. 23 percent of the land area is in park, recreation, or open space use and only 10 percent is in other uses.
Land use is the basis for comprehensive planning of communities. It is also critical to recognize and address the bidirectional relationship between land use and transportation systems – in other words, how people use land in a community and how people get around in that community both cause and affect each other. In Westfield and many of its peer communities, the historical basis of this relationship is how residents have commuted to their workplace in downtown Indianapolis. In the past 20 years, however, the prevalence of remote work among residents has trended upwards, with a significant spike during and after the COVID-19 pandemic. Due to the evolution of retail, the advancement of technology and acceptance for remote work, the change in office and industrial space, the patterns and style of development are being reimagined. The following Development Profile will inventory and analyze the current state of urban development in Westfield-Washington Township, and how the study area has changed in recent decades in the face of shifting attitudes and demands in the housing, commercial, and industrial real estate markets.
The land area growth graphic illustrates how quickly Westfield has changed over the decades, except for 2020 to 2024, both in land area as well as in population growth and density. The dark blue shows the existing city limits, where the light blue shows what was annexed during that ten-year time frame. The greatest land growth was in 2010 when the city went from 7.62 square miles to tripling its size to 26.84 square miles in 2010. The population growth has been just as explosive. In 2000, Westfield had a population of approximately 9,300 people and by 2010 it had grown 3 times its size in population with over approximately 30,000 people. It also doubled its population again from 2010 to 2024, just under 14 years from approximately 30,000 people to approximately 61,000 people.
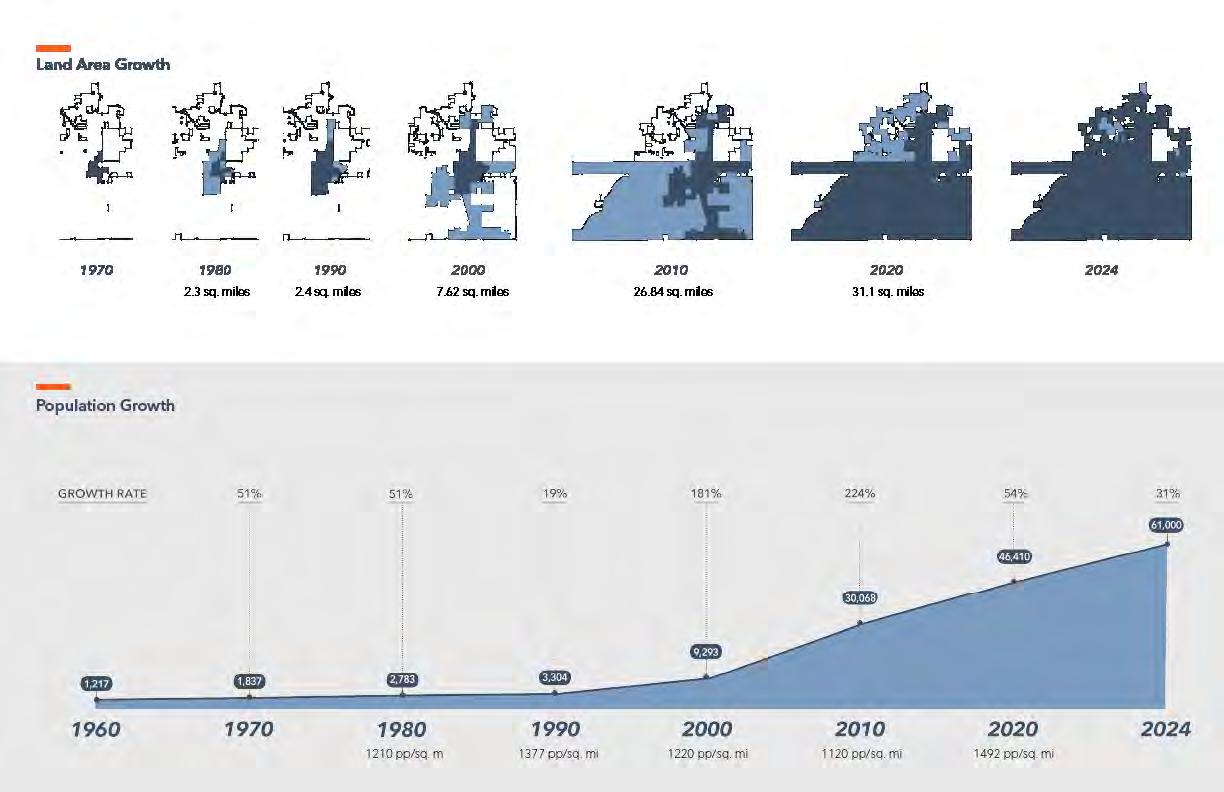
Agricultural Uses: Land and/or buildings associated with agricultural activities such as growing crops, storing farm equipment/produce, and other agricultural activities.
Land use is simply what activity, or activities, occur on a piece of land. Parcels boundaries have been used as the base geometry for this analysis. Guidance from the American Planning Association’s Land-Based Classification System (LBCS) is referenced to determine how to differentiate and classify land uses based on five characteristics of the land within a parcel:
1. The type(s) of activity,
2. Types of buildings on the land,
3. Economic function,
4. Whether the land is developed or vacant, and
5. Ownership (i.e. public/private/nonprofit).
These characteristics are then summarized into the following land use categories and assigned to each of the 27,000+ parcels in WestfieldWashington Township:
Recreational Uses: Land and/or buildings that provide outdoor or indoor spaces for recreation, gathering, and/or leisure, such as sports fields, parks, pools, or clubhouses. This excludes cemeteries (which are sometimes used for recreational activities like walking or running).
Residential Uses: Land and/or buildings associated that offer shelter from the outdoors and any of their associated spaces, including assisted living facilities, common areas, and single- and multi-family residences, but excluding higher-intensity businesses like hotels or bed-and-breakfast accommodations.
Institutional Uses: Land and/or buildings associated with the provision of public services, local government, education, hospitals, nonprofit organizations, places of worship, and similar community services. This includes cemeteries.
Commercial Uses: Land and/or buildings associated with shopping and private services like retail sales, restaurants, offices, professional services, personal storage, and more. This includes hotels.
Industrial Uses: Land and/or buildings associated with manufacturing and wholesale trade, including distribution and warehousing.
Vacant Property: Land, and sometimes buildings, that do not have any observable activities taking place on the premises. This includes land that has been stripped of all topsoil, trees, or other vegetation to make way for new development but has not yet begun construction.
Agricultural uses dominate the unincorporated township, while residential uses account for most of the land within the city. The third largest land use category is recreational, including public parks, golf courses, outdoor sports, and some indoor facilities like gyms or indoor sports fields. WestfieldWashington Township’s village areas including Jolietville, Eagletown, Lamong, and Hortonville, generally have a more mixed land use pattern than the rest of the township and the city. This is, in part, due to their historical development patterns, that organically produced businesses near residences for convenience and sometimes out of necessity because other services were too far away. An overview for each land use category can be found in the following pages.
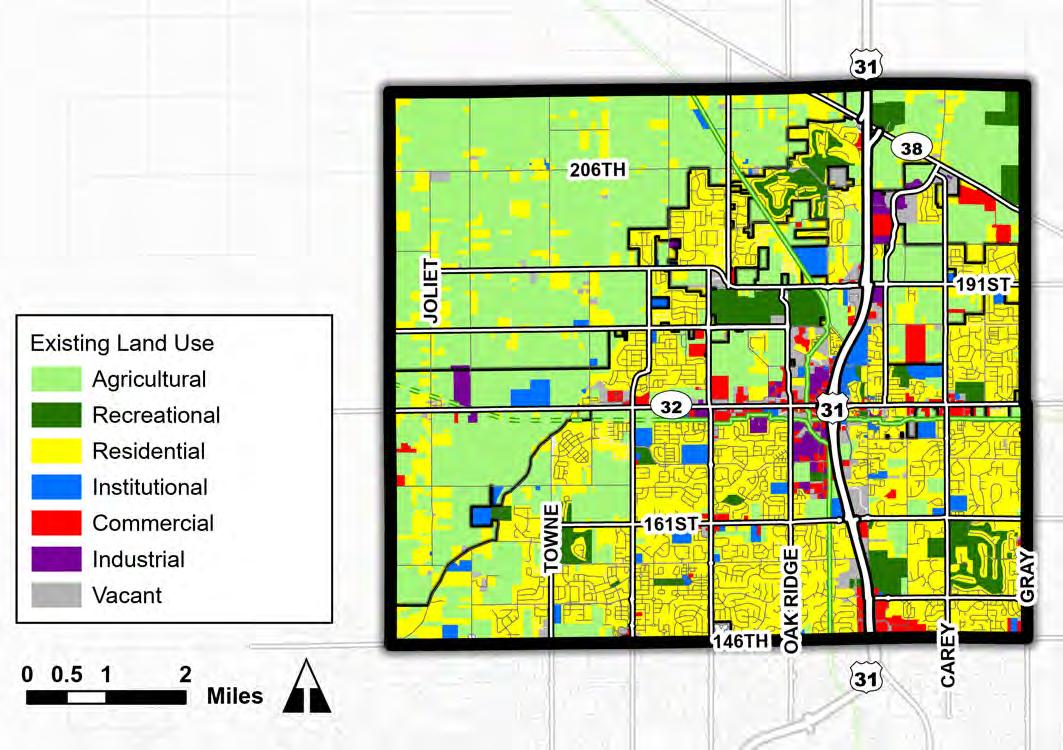

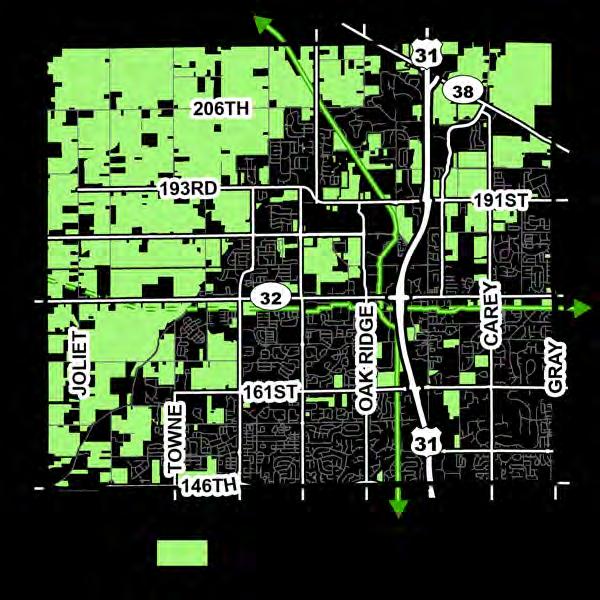
Recreational uses comprise 1,640 acres or 5.1 percent of total acres. Most recreational uses are either public parks, owned by either the city, township, or county government, or golf courses (public or private) and other recreational facilities, such as Grand Park. There are three golf courses in the city, which are wrapped by residential subdivisions: Chatham Hills, Wood Wind, and Bridgewater. Some homeowners’ associations manage assets that are active recreation like sports fields and clubhouses, which are included in this category. Passive recreation or open spaces, such as common areas and trails, are not included here.
Agricultural uses are 44.15 percent or 14,264 acres in Westfield, Washington Township. Most agricultural uses are situated east of Little Eagle Creek in the western half of Westfield-Washington Township. Any agricultural uses within city limits are surrounded by developed land. Some agricultural areas within the city are expected to be developed, such as the south of Grand Park and around East Street near the intersection of Carey Rd and SR 38.
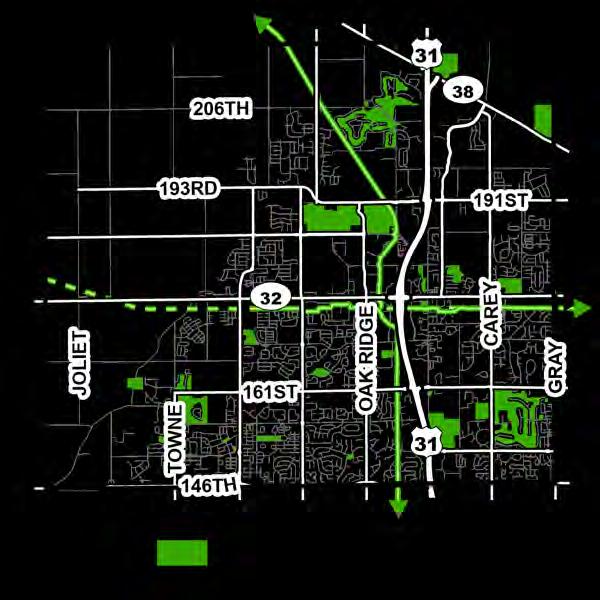
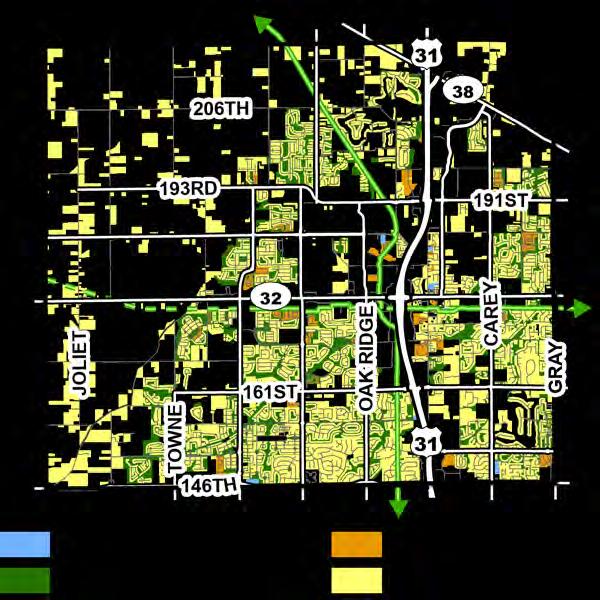
Residential uses make up almost 40 percent (12,800 acres) of the land uses in Westfield and Washington Township. Most residential uses are single-unit homes, or subdivisions that include common areas managed by homeowners’ associations. In the past, the common areas were not interconnected, but it was a primary focus area in the last plan update and that has changed as new subdivisions were built. Multi-unit homes (542 acres/1.6%) and assisted/senior living facilities (58 acres/0.5%) are identified differently than single-unit developments. As shown on the adjacent map, there are few areas that are assisted/senior living or multi-family units.

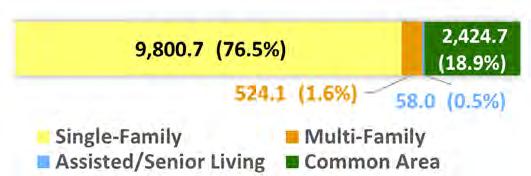
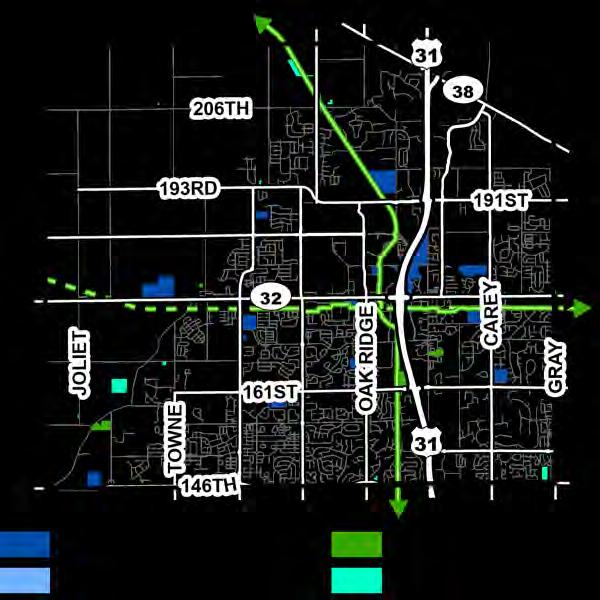
About 1,025 acres or 3.2 percent of land is devoted to institutional uses. Institutional uses include government buildings, nonprofits, utilities, and public services, specifically educational facilities, account for most institutional uses. These uses can be seen primarily along US 31 and State Road 32.
Not-for-profit institutional uses include places of worship and community service organizations like food banks. Like commercial uses, not-for-profits typically look for highly visible or easily accessible sites on which to develop and therefore are usually near commercial hubs.
Cemeteries and utilities have developed around the township as necessary, without an easily identifiable pattern.

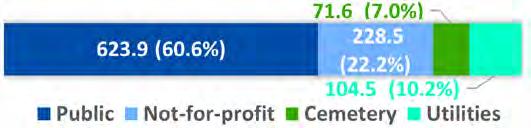
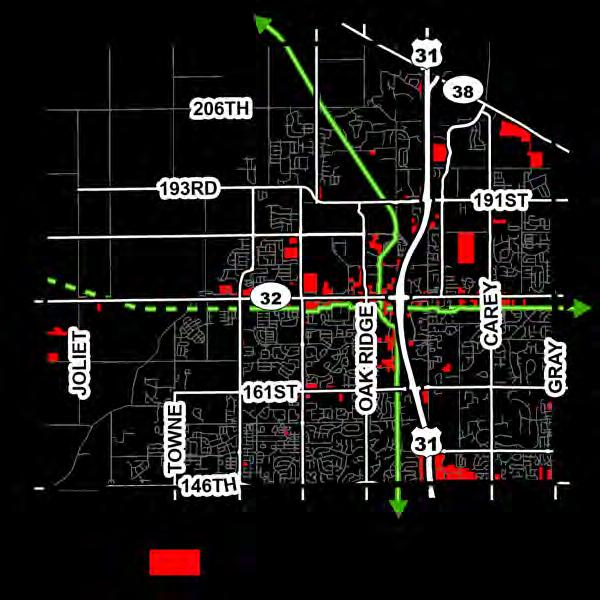
Approximately 438 acres or 1.4 percent of land area is devoted to industrial uses. There are two central industrial hubs in the township: (1) near the intersection of US 31/SR 32 (South Park) and (2) north of 196th Street and along East St (Northpoint I). The East Street industrial area (Northpoint II) is newer, with sites for flex industrial, manufacturing, and corporate offices currently under construction. South Park is an older industrial area, contains smaller business footprints, has many material suppliers and some manufacturing facilities.
Commercial uses comprise approximately 1,145 acres or 3.5 percent of the total land use. Most commercial uses are either retail stores, services, or restaurants. The number of commercial offices, however small, have grown in recent years, especially along US 31.
The main commercial hubs in the community are at US 31/146th Street, the State Road 32 corridor west of US 31, and Carey Rd/SR 32. Some small-scale commercial developments have developed near the intersections of collector roads, such as along 161st Street.
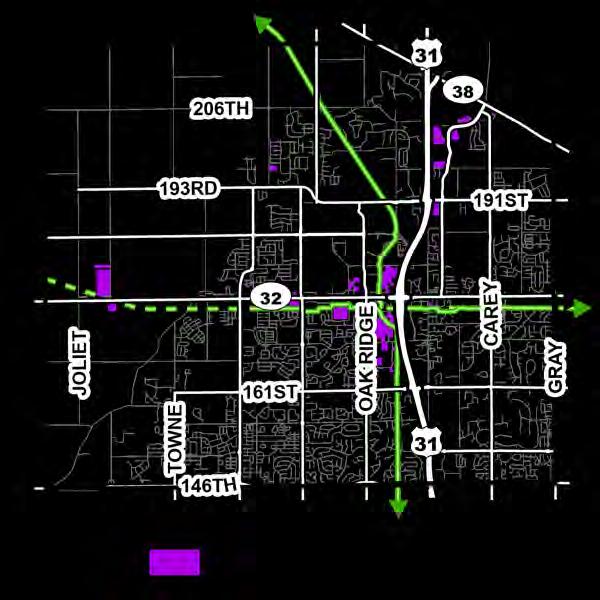
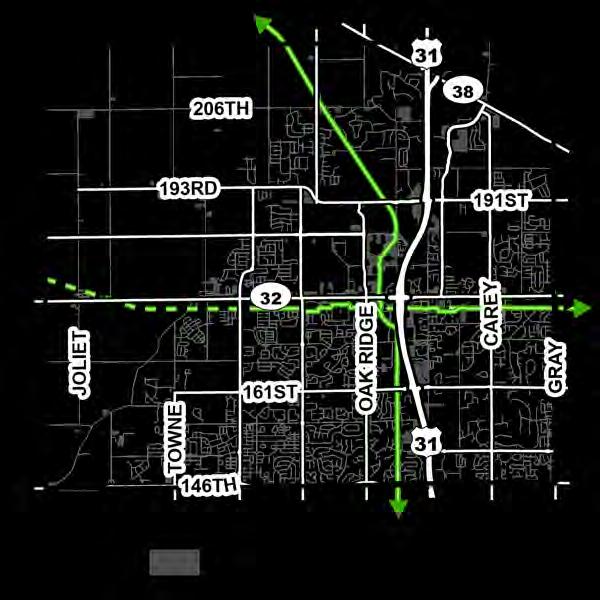
There are approximately 1,040 acres or 3.2 percent of land area devoted to vacant properties. Vacant properties are dispersed primarily along US 31, State Road 32, and Wheeler Rd. Most vacant properties near Westfield’s historic downtown are owned by the City of Westfield, specifically its Redevelopment Commission.
There are a few clusters of vacant properties outside of the primary areas, including Eagletown, 191st/US 31, and along East Street north of 191st Street.
Unincorporated areas west of Little Eagle Creek are slowly transitioning into residential uses through minor subdivisions.
Subdivisions are large parcels that are split into several smaller parcels. A minor subdivision is a larger parcel that has been split into five or fewer new parcels. In the agricultural areas of the township, predominately to the northwest and southwest, minor subdivisions often happen when a landowner wants to sell off and/or develop a part of their farmland for a single-unit home. Minor subdivisions are permitted under the city’s Unified Development Ordinance (UDO), which also allow single-unit residences to be developed by-right in the city’s agricultural zoning district (AG-SF1). These regulations have resulted in many one-off or unplanned, residential developments in rural areas, which are generally not well-equipped to deal with increased traffic or have city utilities to support higher density growth.
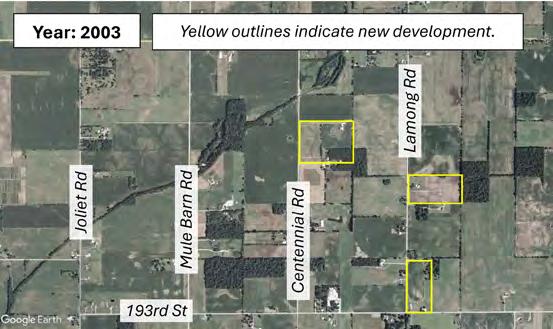
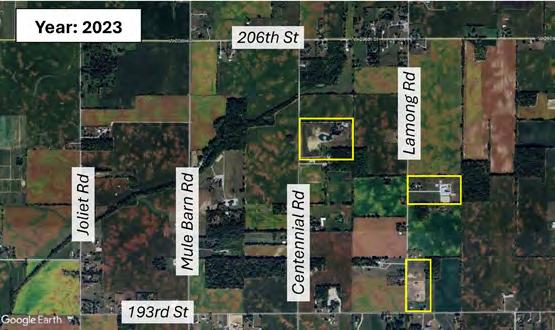
Neighborhoods that have the highest return on investment for the city typically have a mix of housing types, mixed land uses, or more units per acre.
In urban planning, the term “missing middle” is a planning term to describe a range of multi-unit, low-rise housing types that fall between singleunit homes and high-rise apartments, addressing the need for diverse and affordable housing options in walkable neighborhoods. As noted from the above land use analysis, single unit housing has dominated Westfield’s landscape with little other options for individuals or family units. An analysis was conducted of assessed value per acre for single unit residential in Westfield. The results show that the greater the mix of housing or increased density has a higher assessed value per acre than single unit subdivisions.
On average single unit homes generate about $1.6 million residential value per acre, whereas the missing middle housing (duplex, triplex, quadplex, townhouse, and small apartment buildings) generate approximately $2.1 million residential value per acres, while multi-unit housing (large apartment buildings) generates less than single units at $1.3 million residential value per acre, as shown in the figure below.
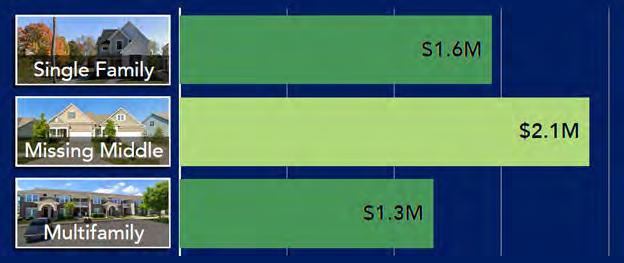
When comparing the townhomes and single unit homes in Countryside, as depicted in the figure below, the townhomes show a $3.7 million per unit average value per acre versus the $1.5 million per unit average value per acre.
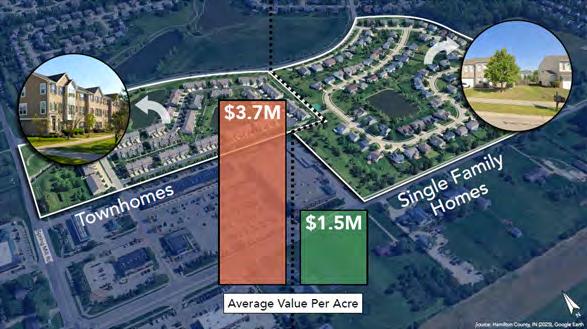
The City of Westfield has several Planned Unit Developments (PUD) that dominated the creation of the city’s residential landscape. In reviewing those PUDs there are four that rise to the top as the five greatest PUD’s by assessed value (AV). The project with the greatest AV for a PUD is Midland South. This development has 56 townhomes on 3.37 acres (16.6 dwelling units per acre). The next greatest AV is Poplar Street Townhomes which contains 24 townhomes on 1.26 acres (19 dwelling units per acre) with an AV of approximately $10,235,700. Number three is Harmony Subdivision with 669 single units and 270 apartments on approximately 240.5 acres (3.9 dwelling units per acre). There are also approximately 14 acres of commercial uses for a total of approximately 254.8 acres. Last, Cottages on East, with four single units on 0.5 acres, have the fourth greatest AV with $1,956,621 (8 dwelling units per acre).
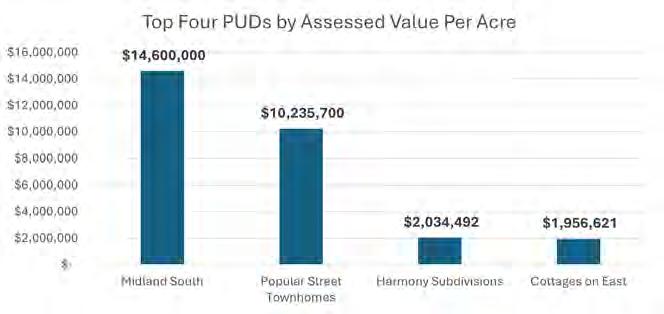
Newer neighborhoods have a greater mix of land uses, including residential, commercial, and recreational uses like swimming pools, parks, trails, and outdoor courts.
Most of these newer, but traditional neighborhoods, such as Centennial, have land uses that are horizontally mixed rather than vertically mixed. “Horizontally mixed” means that many different types of land uses are located within the same development and are interconnected with each other – through sidewalks, streets, trails, etc.
Located southwest of the 156th Street and Spring Mill Rd intersection, the Centennial Neighborhood is a local example of mixed use development and how it creates convenience, encourages active lifestyles, and provides opportunities for community gatherings. The neighborhood is a collection of subdivisions under the same name, which began construction in 1999, and was completed between 2010 and 2012.
At the center of the neighborhood sits Central Park, a green space with pathways, baseball and soccer fields, and other open spaces. Near the east end of the park is a church, daycare, and a small office – these uses form a neighborhood ‘node,’ or activity center. The neighborhood homeowners’ association (HOA) has hosted several events here, including a bike parade on the Fourth of July, food vendors, and a kid’s carnival with bounce houses. There are several other gathering spaces across the neighborhood, including a community garden, pavilions, clubhouse, and playground. Unlike more recent neighborhoods though, Centennial has a relatively small, internal trail system, and it is not well-connected to the citywide trail network.
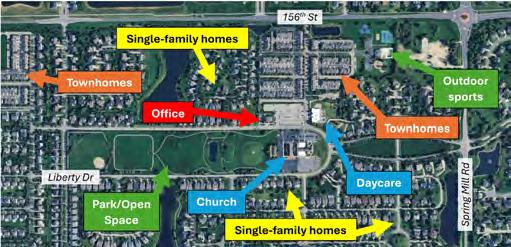
Many businesses are clustered along US 31 and State Road 32, with other smaller hubs developing around key intersections.
Business usually cluster along major roads for higher visibility, higher traffic volumes, and access to a broader customer base that includes commuters in addition to residents. Most commercial developments are oriented towards automobiles, meaning many developments have large, often overbuilt parking areas in the front of the building without many connections for pedestrians or bicyclists. This is changing with more recent developments, however.
Key business intersections are located along the following corridors: SR 32/Spring Mill Rd, US 31/146th Street. These intersections have highintensity commercial uses that attract many people, such as grocery stores. Along US 31, the key intersection is SR 32 and 191st Street, which is a small but notably expanding commercial node.
Conceptual Diagram of Existing
Commercial and Industrial Land Use Patterns
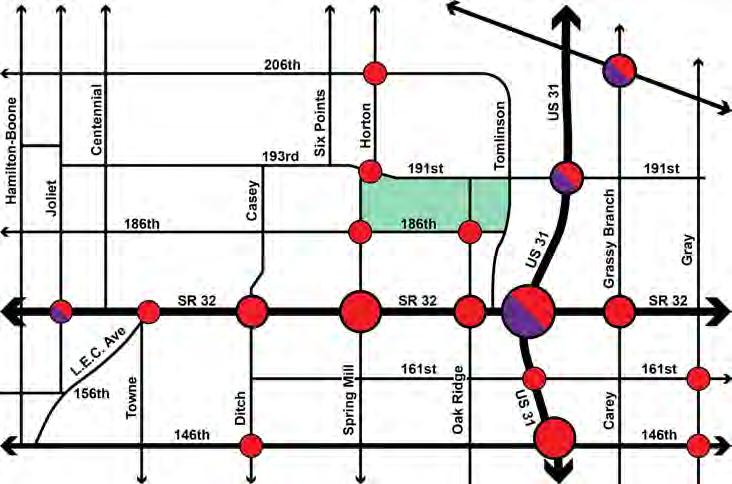
Most places in Westfield are within half a mile of a trail or multi-use pathway, but destinations in the community, such as schools, public parks, and businesses, are not within convenient walking distances for many residents.
High quality amenities, such as parks and schools, are an important aspect of Westfield that has attracted thousands of families in the past two decades. Increasingly, however, regional and national trends show a growing preference for both high quality amenities and access to those amenities, especially by foot or bike. This preference is a part of a key development trend toward “walkability,” or more walkable communities, which is discussed in the next section.
Walkability is a difficult topic to assess, as its meaning can differ from person to person. There are, however, three important aspects of walkability that planning, urban design, and transportation professionals generally refer to (Jeff Speck, Walkable City, 2022):
• There should be a reason to walk (i.e. convenient),
• The walk should be safe,
• The walk should be comfortable, and
• The walk must be interesting.
The following maps offer a walkability study, which focuses on access to attractive, well-known amenities throughout Westfield-Washington Township. These maps show the estimated time it takes to walk to trails, schools, parks, and businesses.
Most developments and neighborhoods in the City of Westfield are well within a half mile of a trail, a half mile generally equates to a 15-minute walk, or of a planned trail, according to Hamilton County’s GIS trail inventory. Fewer neighborhoods are within convenient (i.e. less than 30 minutes) walking distance of businesses, parks, and schools.
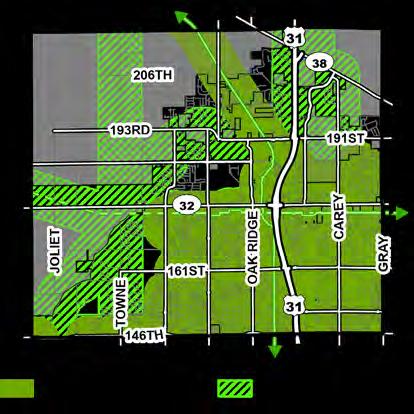
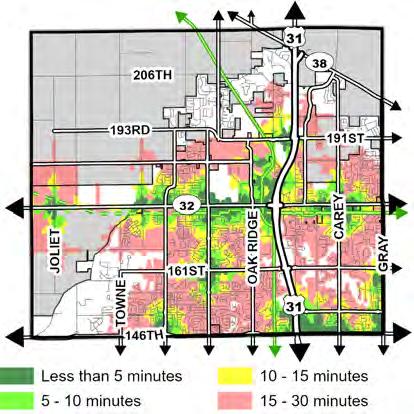
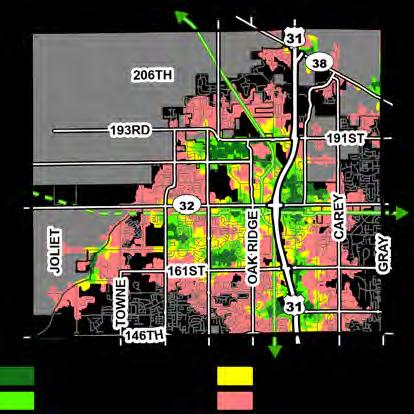
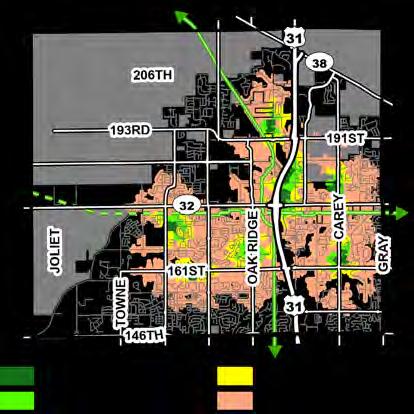
According to data from the city, about 72 percent of its residential inventory (both single-unit and multi-unit structures) is built, while 3,315 additional acres are expected to be or currently under construction.
The chart below illustrates the amount of residential that is both existing and approved for development within Westfield and Washington Township. There are approximately 11,239 acres devoted to existing or approved residential uses. Of those 11,239 acres, approximately 72 percent of it has been built with either single unit or multiple unit structures. That leaves roughly 3,315 acres approved for construction. Of those 3,315 acres, 8 percent of the units have been approved and most of have been built, but there are still some unfinished subdivisions that have availability to be 100 percent completely built out. For example, at the time of this report this would include West Rail Subdivision, which was approved for 236 units, 155 units have been built, and 81 units remain to be built in the subdivision.
Expected units completing construction amount to 10 percent of the 3,315 acres, or 1,149 acres. These units are in subdivisions that are already partially completed and the units being completed will finish out the subdivision.
Expected units where construction has not started. These units are approved units, roughly 1,091 acres, or 10 percent of the units that have not been built. For example, Somerset PUD was approved in 2021, and it was approved for 152 units. At the time of the report (2024) those units have not been built.
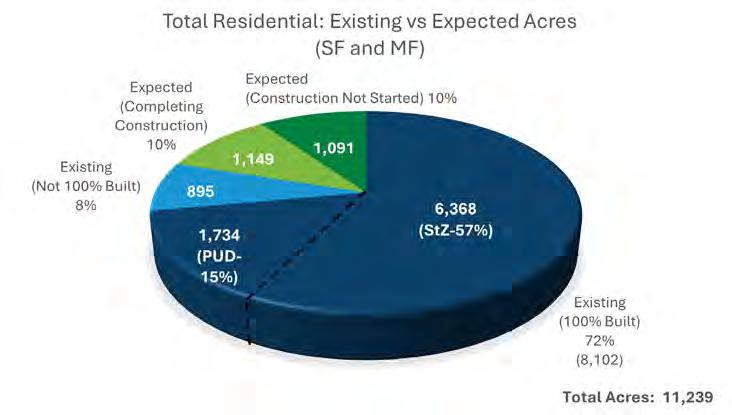
Only 28 percent of the city’s multi-family residential inventory has completed construction compared to 78 percent of the single-family residential inventory.
This next section breaks down the residential inventory into single unit and multiple unit structures. There are currently 1,369 acres of built and approved multiple unit structures currently on the books as of 2024. For single unit structures there were approximately 9,870 acres that were existing/approved.
Regarding multiple unit structures, approximately 28 percent or 377 acres have been built. That leaves roughly 991 acres approved but not yet built. Approximately 61 acres are located within developments that were not finished. 285 acres will finish developments that were partially completed and 645 or 47 percent of acres are approved but have not started construction.
For single unit structures, of the 9,870 acres approved for single unit residential, approximately 7,724 acres have been built. Approximately 833 acres or 8 percent are in subdivisions that were not finished. Approximately 864 acres or 9 percent are being constructed to finish out a partial subdivision. And there are 446 acres or 5% that have been approved but not yet constructed.
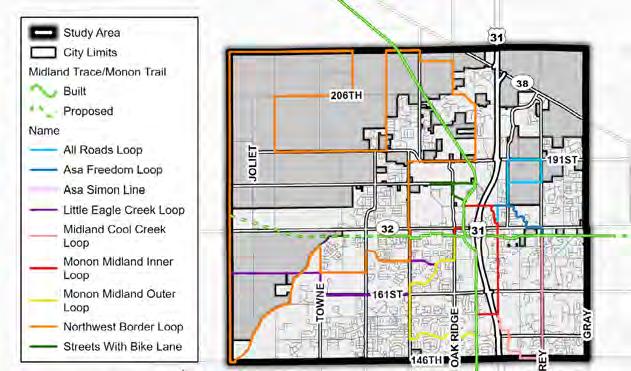
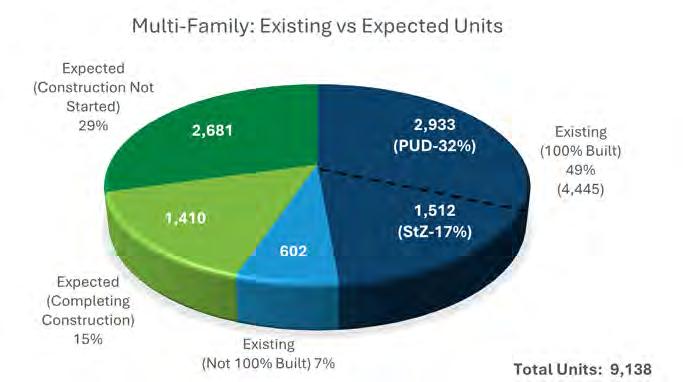
Almost half of the city’s multi-family residential inventory consists of apartments, while the remaining half is a mix of townhomes, duplexes, and other types of multi-family housing.
As of April 2024, there are 9,138 multi-unit structures either constructed or expected to be constructed. Apartments are the largest type of multiunit housing, consisting of about 48 percent of units, while townhomes account for 2,094 units (23%). Duplexes account for 1,621 units (18%). What is missing from this list is cottage courts, small apartment buildings of five to eight unit dwellings, triplexes, and quadplexes to round out the missing middle housing.
Townhomes, which are called single-unit attached structures, are still considered multi-unit structures because they are typically built in groups of four or more units. Duplexes are separate from single-family detached units and townhomes because of the state’s building code, which has additional regulations for any structure with more than two units. Duplexes can be designed in several ways, including stacked on top of each other, next to each other, or one in front and one in back. All other multi-unit structures account for 11 percent of the city’s multi-unit inventory, or 980 units. When a PUD ordinance did not define the type of multi-family that was allowed those units were included in “undefined.”
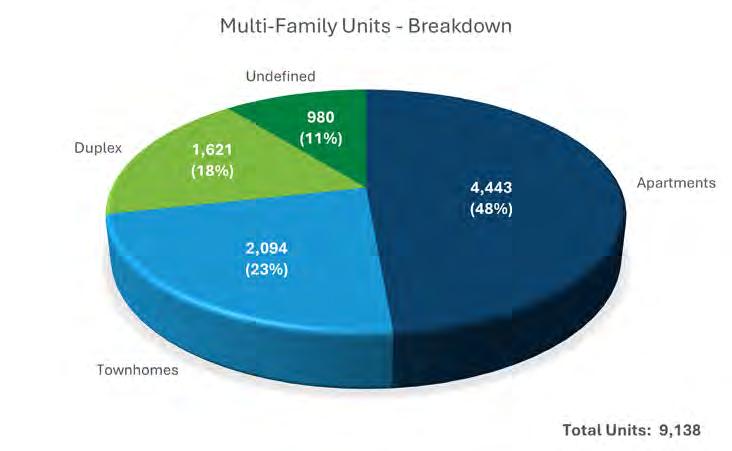
Newer subdivisions often include an internal trail system, recreational amenities, and pathways to nearby businesses.
Amenities such as trails, open spaces, and easy access to shops and services are a recent and growing part of Westfield’s new developments. These amenities enhance residents’ quality of life and provide gathering spaces that encourage social interaction between people, which can promote a sense of community. These amenities also encourage outdoor activity with safe and convenient spaces for walking, jogging, and cycling.
While the city uses its comprehensive plan to direct and manage growth and increase quality of life, developers are investing in Westfield’s vision. Developers are increasingly recognizing the value that access to green spaces, businesses, and recreation, enhances the marketability of their development. Integrating pathways to nearby businesses supports local economies and fosters walkability, aligning with contemporary urban planning trends that prioritize connectivity, health, and sustainability as desired by the city.
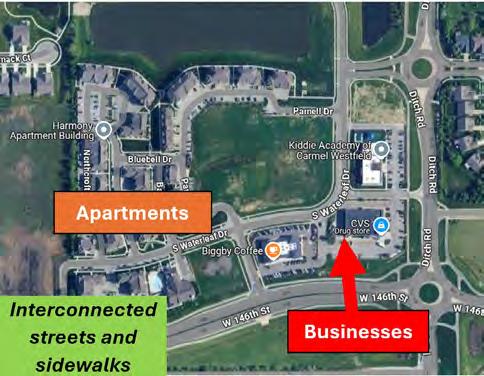
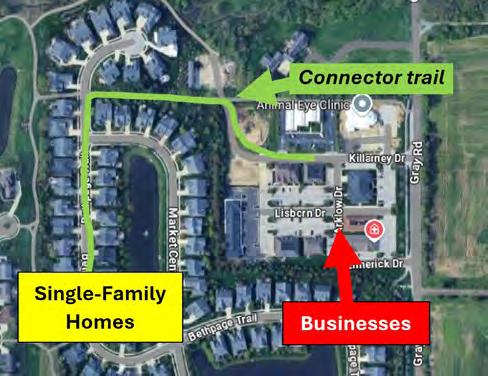
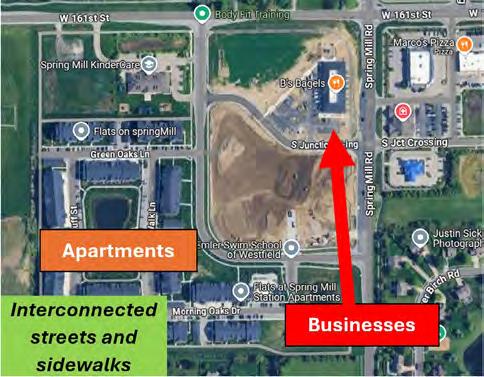
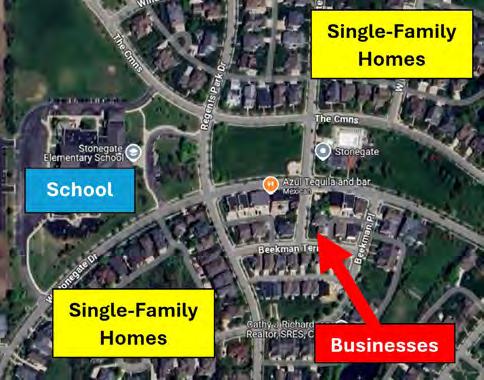
Most residential neighborhoods have garages located at the front of the home in Westfield, but recent trends in the region have shifted toward alley-loaded or side-loaded garages.
By placing garages at the rear of homes, these developments create more visually appealing streetscapes with uninterrupted sidewalks, green spaces, and front porches that encourage social interaction. This design reduces the dominance of vehicles in residential areas, making neighborhoods safer for pedestrians and fostering a stronger sense of community. Additionally, alley-loaded layouts allow for narrower lots, promoting higher-density development that maximizes land use and can improve housing affordability.
Alley-loaded housing also improves traffic flow and safety by minimizing curb cuts and reducing the number of driveways directly connected to main streets, whereas front-loaded housing often requires a curb cut for every home, increasing the likelihood of an accident between people walking and people backing into/out of their driveway.
This setup also allows for more efficient waste collection and utility access while keeping service functions hidden from view. By preserving the front of homes for landscaping and architectural features rather than parking, alley-loaded designs contribute to a more attractive and pedestrianfriendly environment, making them a preferred choice in modern urban and suburban planning.
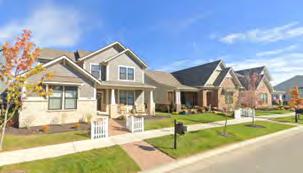
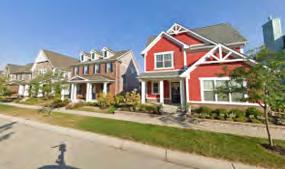
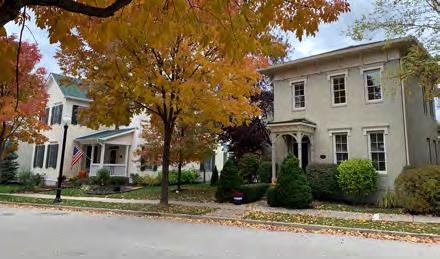
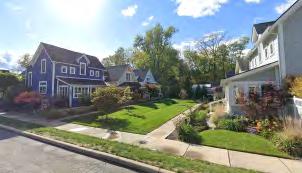
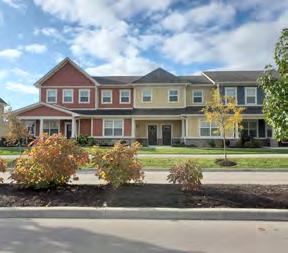
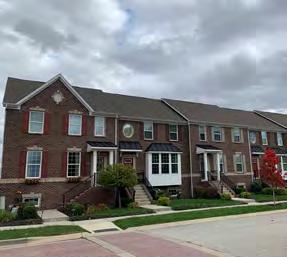
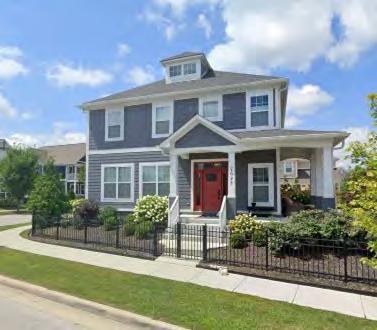
Trail-oriented development, or development that is integrated with trails and multi-use pathways, has given rise to highly desirable and multi-modal centers and corridors around the Indianapolis region.
The transportation network is the most significant component of walkability along with land use. Generally, people can better access places when the street network is interconnected. This also allows people to take multiple routes to their destination, instead of concentrating on a few roads, which distributes traffic and can reduce delays.
The Indianapolis Metropolitan Planning Organization (Indy MPO) has published several memos and guidelines for trail-oriented development. Some exemplary development projects around the Indianapolis region include:
• Midtown and City Center (Carmel),
• Nickel Plate District (Fishers), and
• Depot Street Park (Greenfield).
There are two regional trails in Westfield (i.e. they connect to distant communities in the same region): the Monon Trail and Midland Trace Trail. The Monon Trail provides a north-south connection to Carmel and Indianapolis, while the Midland Trace Trail provides an east-west connection to Noblesville. The maps on the next page show the existing development patterns that lie within a 10-minute walk of a trail access point, such as at an intersection or a spur that connects a nearby neighborhood. These trails are a high value recreational asset to Westfield but also provide an opportunity to think about how to plan around these key intersection nodes to maximize that value and development potential.
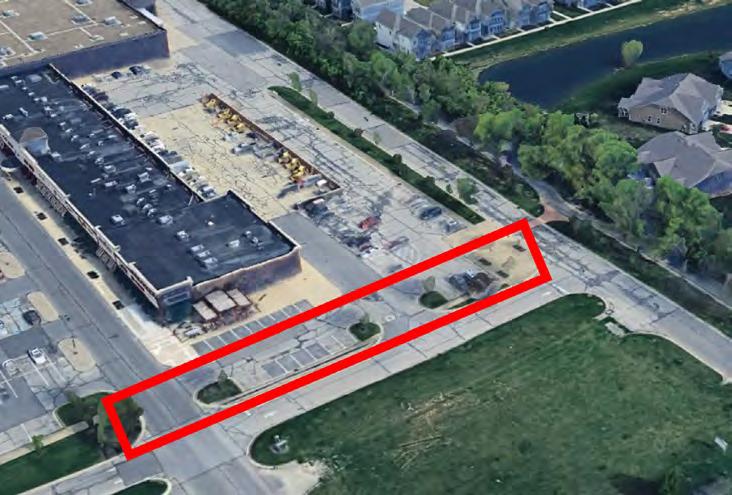
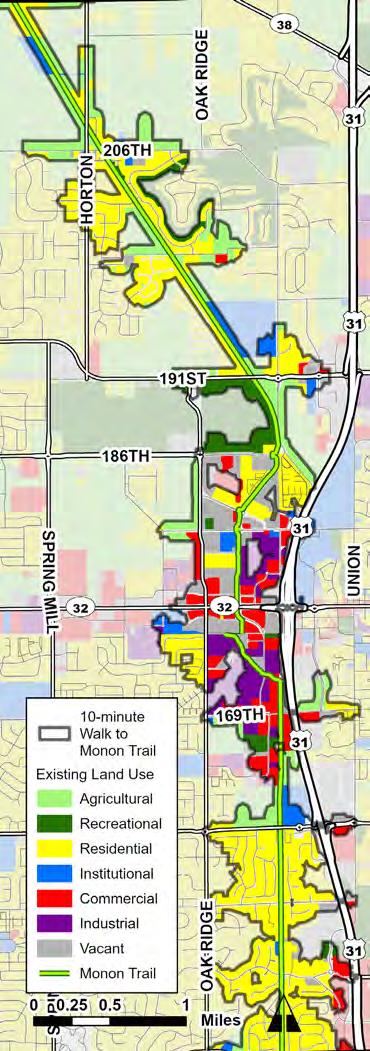
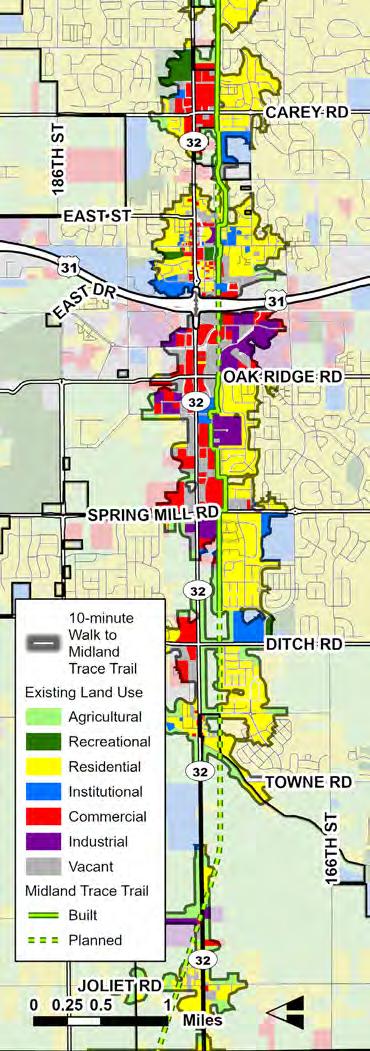
Different development types such as trailoriented development, mixed use, and master-planned developments are rising in popularity in Westfield.
Mixed use developments are becoming increasingly popular in the Indianapolis Metropolitan Area as towns and cities seek to create more efficient, sustainable, and high-quality places to live and work. These developments integrate a mix of uses in one area to promote walkability. With growing concerns over urban sprawl and environmental impact, mixed use projects maximize land use while fostering a sense of community, encouraging social interaction, and fostering economic activity, making neighborhoods more dynamic and resilient.
Another key factor driving the rise of mixed use developments is the shift in lifestyle preferences, particularly among younger generations. Many people now prioritize convenience, preferring to live in areas where they can easily access work, shopping, dining, and leisure activities without relying on cars. Urban planners and developers are responding by designing spaces that promote a balance of life, work, and play (i.e. recreation), incorporating green spaces, public transit access, and smart city technologies (i.e. street lighting, water monitors, utility meters connected to the Internet of Things). This trend not only enhances quality of life but also supports local businesses, increases property values, and attracts investment, reinforcing the long-term sustainability of urban centers.
Local governments can regulate what can be built and how through zoning. Generally, zoning regulations are established by creating different zoning districts which allow or prohibit certain land uses, and define development standards such as building design, placement, height, and more. If a zoning ordinance is combined with a subdivision ordinance (which regulates the division of property), it is often called a Unified Development Ordinance (UDO). A comprehensive plan involving public engagement is required by Indiana state law to have a zoning or unified development ordinance. The City of Westfield has a unique opportunity to plan and zone comprehensively, as it administers zoning both within its city boundary and the unincorporated areas of Westfield-Washington Township.
Zoning laws ensure that land is used according to an established land use plan, mitigating conflicts between incompatible uses (e.g., a factory adjacent to a residential neighborhood). Additionally, while land uses are often broadly classified, zoning regulations can be as general or detailed as necessary. Zoning regulations also cover a variety of topics in addition to land use, such as dimensional standards like building heights, setbacks, lot coverage, and other design standards such as landscaping, parking, noise, lighting, fencing, etc. In short, a comprehensive plan lays the foundation for how and what land can be used for and zoning is the regulatory mechanism that has the details to implement the comprehensive plan.
The City of Westfield’s Unified Development Ordinance has 23 zoning districts. There are two agricultural districts, five single-family districts, three multi-family districts, eight commercial districts, four industrial districts, and 70+ planned unit developments. For the following analysis, the zoning districts have been generalized based on their primary land use purpose (see the table below). The area for each zoning district was calculated using geographic information systems (GIS) after combining the spatial data for zoning with spatial data for parcel boundaries. Some parcels did not overlap with a zoning district, which is represented by the “Unknown” category in the table – this does not mean that a parcel is un-zoned, rather that the city’s GIS data is missing a classification. Additionally, while some zoning districts are established in the UDO, they are not being actively used in the community, resulting in zero acres/properties in the table on the next page.
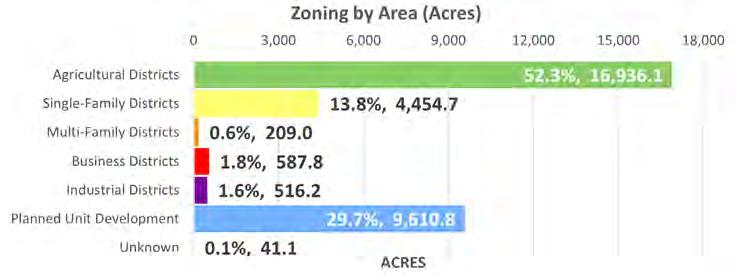
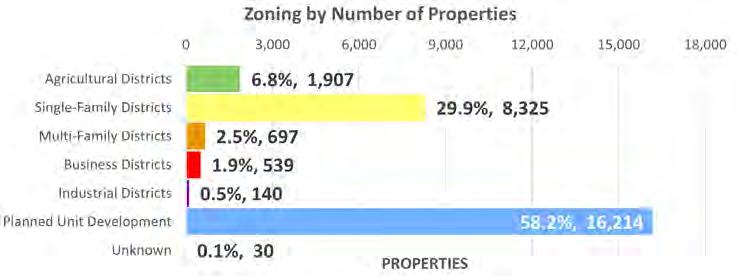
(Agriculture Single-Family Rural)
AG-SF1I (Agriculture Single-Family In-Town)
SF-4 (Single-Family
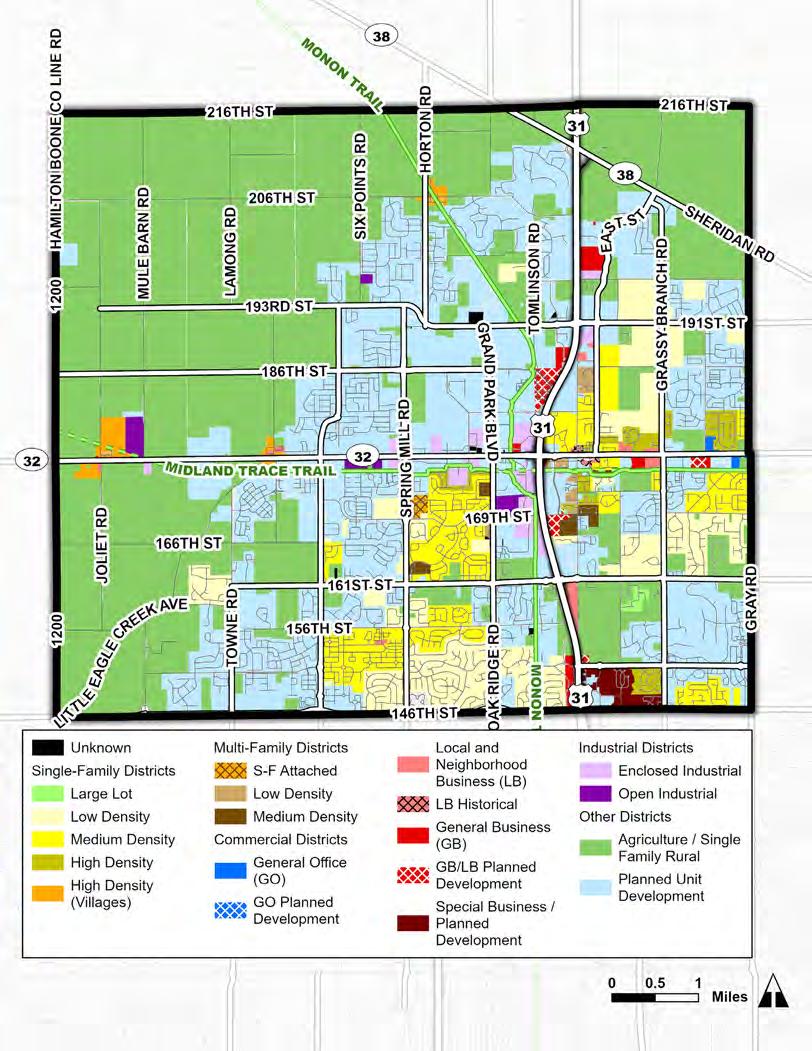
The city relies heavily on planned unit developments (PUD), rather than standardized zoning districts, suggesting that the UDO is not conducive to current real estate market demand.
A PUD is a master-planned development treated as a standalone zoning district with its own regulatory framework created, in most cases, by a third party or developer. Currently, there are 98 approved PUDs within the city’s regulatory framework. Furthermore, as of August 2024, according to data from the city, PUDs account for 71.2 percent (26,121) of approved building permits compared to 28.8 percent (10,581) for straight-zoned units/lots.
There are positives and constraints to using PUDs as a regulatory tool. PUDs have customized regulations, which can result in unique places, such as Bridgewater, Northpoint, and Chatham Hills. This tool also allows for mixed use developments and planned out green spaces. However, PUDs create additional administrative work, are a negotiation process between the city and developer, and often take longer for approval, which results in
a more expensive process for both the city and developers. Additionally, redevelopment efforts in the future or new development can become more difficult within PUDs due to non-standardized and more complex regulations. Most PUDs also come with homeowner’s associations (HOAs) who are responsible for maintaining common areas in the PUD and are funded by fee(s) from member property owners.
The development of PUDs is a more expensive and time-intensive process but should result in higher quality, well designed, unique places to live and work. However, an important part of this comprehensive plan should address the long-term viability of these PUDs as market demands shift overtime.
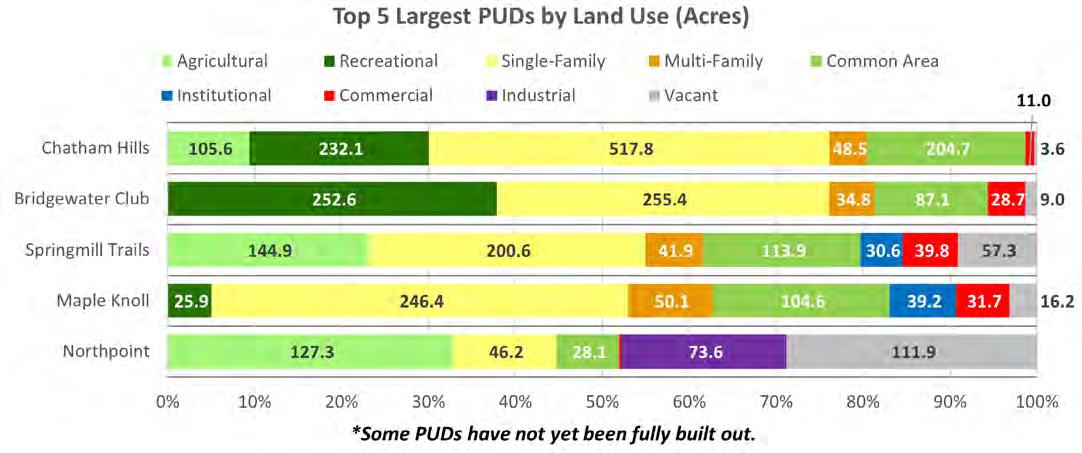
About a quarter of agriculturally zoned land is used for residential purposes, highlighting the increasingly urban farmland as the city grows.
The city’s two agricultural zoning districts (AG-SF1 and AG-SF1I) encompass 52.3 percent of all land, or approximately 16,936 acres of land.
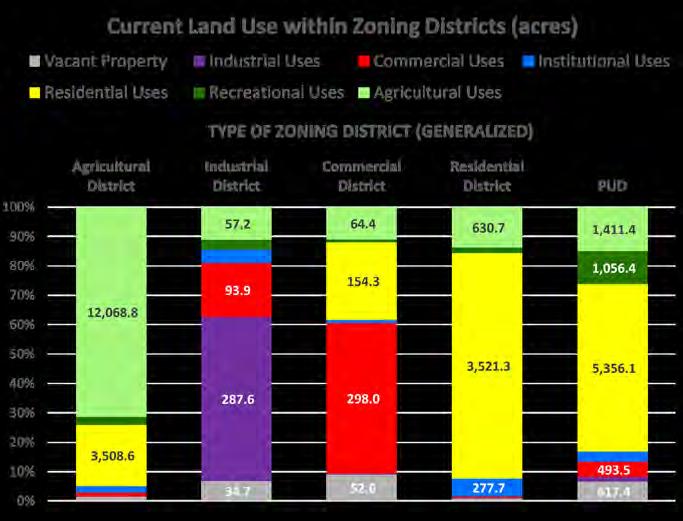
Most vacant property is zoned as an agricultural district or a planned unit development that is not yet fully built out.
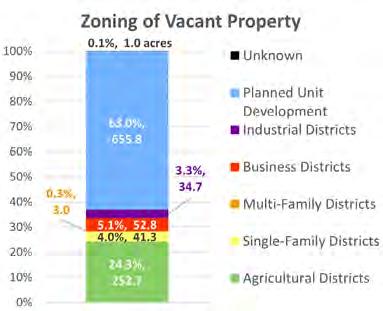
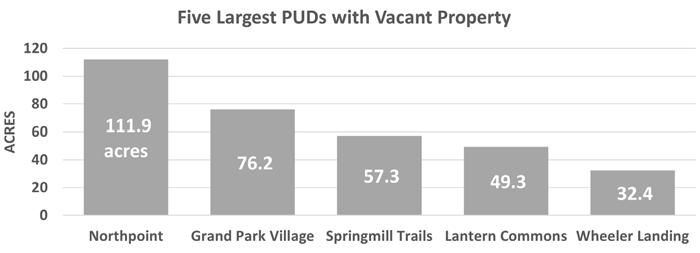
Westfield’s environment is an integral aspect of the community’s identity, shaping its natural beauty and influencing agriculture, recreation, transportation, and development. However, as the city continues to expand, understanding and managing its environmental characteristics will be important to ensure long-term sustainability and resilience. Unique aspects of Westfield’s environment, such as its elevated terrain, fertile soils, and natural floodways, offer growth opportunities while presenting challenges that will require strategic planning efforts. Westfield can make decisions that balance growth and environmental preservation by understanding key environmental features, including its climate, topography, water resources, soils, and pollution risks.
Key Points:
• Climate Trends: Westfield is experiencing warming temperatures and reduced precipitation, highlighting the need for adaptive infrastructure and outdoor recreational planning.
• Flood Zones: Managing the acres of floodprone areas within the city and the larger flood zones is vital to protecting homes and infrastructure.
• Pollution Challenges: Leaking underground storage tanks and brownfield sites pose environmental and redevelopment challenges.
• Biodiversity Threats: The presence of invasive species in local parks and natural areas threatens the health of native ecosystems.
Located in Central Indiana, Westfield enjoys four distinct seasons. However, in 2023, the city’s climate showed variations from historical norms:
• Temperature: The average annual temperature was 56.1°F, 2.4°F warmer than the historical average of 53.7°F (1991–2020).
• Precipitation: Total rainfall was 34.4 inches, significantly lower than the typical 43.6 inches.
• Snowfall: Only 5.7 inches of snow fell in 2023, below the average of 25.5 inches.
• Temperature Extremes: There were 109 days with highs of 80°F or more and 78 days with lows at or below freezing, suggesting warmer and less snowy winters.
Annual Climate Statistics for Indianapolis (January – December 2023)
Rank (1872-2023)
Highest* 32nd Driest
Least Snowy*
*Above snowfall data is also for the calendar year period, January − December 2023
Source: National Oceanic and Atmospheric Administration, 2023
These changing climate patterns influence different aspects of life. Milder winters may reduce the need for snow removal, while warmer weather encourages outdoor activity and greater use of trails, sidewalks, and bike paths. Additionally, decreased precipitation and snowfall could impact water supply and plant growth. Adapting to these evolving trends is essential for maintaining resilient infrastructure, planning for year-round livability, and supporting Westfield’s growth.
Westfield is located on an elevated terrain, with a mean elevation of 888.3 feet, a high of 957 feet, and a low of 808 feet. This places Westfield higher than much of its surroundings in Hamilton County, where elevations dip as low as 656 feet. Despite its higher elevation, Westfield’s landscape is largely characteristic of Central Indiana’s plains, defined by gently rolling plains with minimal steep slopes.
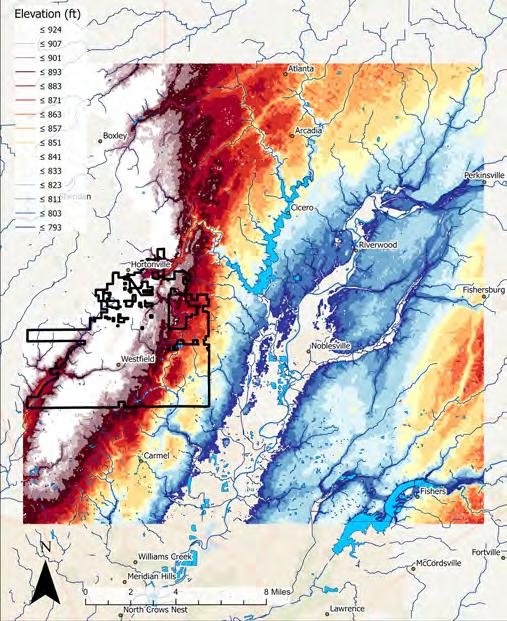
The city’s elevation plays an important role in stormwater management and flood prevention efforts. While Westfield’s higher ground is less prone to flooding, its proximity to lower-lying areas requires careful planning to ensure that water runoff is effectively managed. As development continues, preserving natural drainage patterns and investing in flood-resistant infrastructure will help protect residents and properties.
Water resources are vital to Westfield’s environmental profile, shaping development and conservation efforts. One hundred forty (140) parcels covering nearly 40 acres within city limits fall within designated flood zones or naturally occurring wetlands. Though relatively small compared to Westfield’s total area, these areas highlight the need to manage water resources effectively.
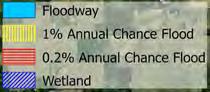
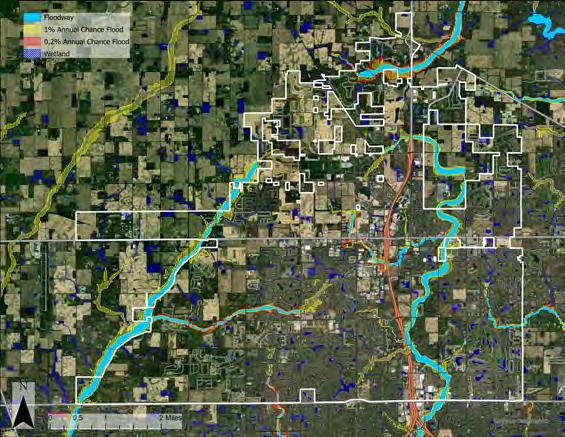
Within a two-mile radius of the city, 107 square miles are designated as flood-prone land, including 4 square miles in the 100-year flood zone (1% annual chance of flooding), 0.3 square miles within the 500-year flood zone (0.2% yearly flood chance), and 3.4 square miles designated as floodways. Flood-prone areas require careful planning to minimize risks to residents, transportation networks, and properties and ensure access during extreme weather events. Despite these challenges, wetlands and flood zones offer opportunities to create parks, nature reserves, greenways, and other open spaces supporting environmental sustainability and community livability.
2008 Forest Coverage
Between 2008 and 2021, forest coverage within the City of Westfield experienced distinct changes. The northern and northeastern parts of the city limits have stayed relatively the same in forest coverage, particularly in areas adjacent to undeveloped or more rural lands. Additionally, forest coverage along some waterways, especially smaller streams, has increased, potentially providing strengthened riparian buffers that support water quality and wildlife.
Southern and western portions of the city and the city’s interior, where urban development has been most pronounced, have experienced significant reductions in forest coverage. These declines are particularly evident in near major roadways and expanding residential and commercial areas. Still, some forested areas near major parks, natural areas, and greenways have been preserved. These shifts in forest coverage highlight the importance of integrating forest conservation efforts with urban planning to ensure the city’s waterways and ecosystems remain resilient and sustainable despite growth and development.
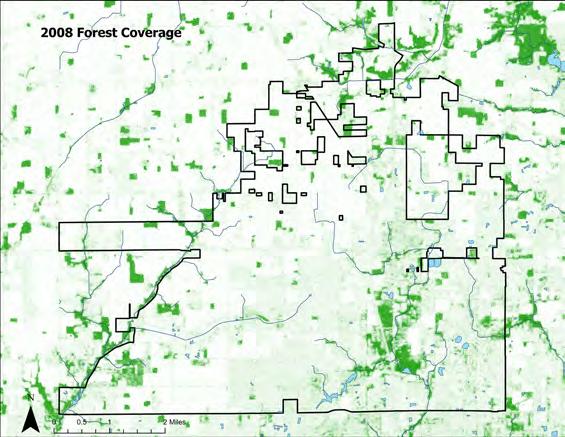
2021 Forest Coverage
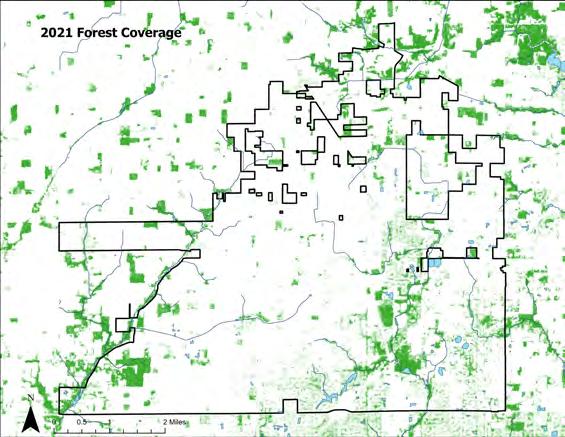
Westfield sits within the Eastern Corn Belt Plains, which is historically well-suited for agriculture. Approximately 1,342 acres (2.1 square miles) of land in the city are classified as “prime farmland,” with much of this concentrated near floodways. These soils are identified as the most productive in the region, supporting high-yield crops and agriculture. Still, nearly half of Westfield’s land is classified as “not prime farmland,” where agricultural potential is limited, particularly in the south and east of the city.
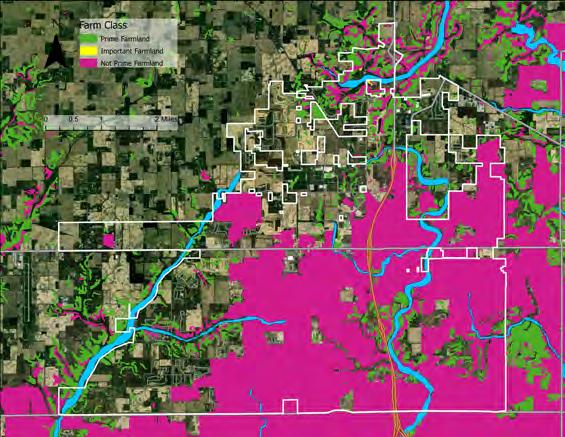
This distribution of soil types offers opportunities for development in areas less suited for agriculture while emphasizing the need to preserve high-quality farmland for future generations. Balancing growth and preservation will ensure that Westfield’s development strategy is aligned with the natural environment.
Prime farmland is of major importance to meeting the nation’s shortand long-range needs for food and fiber and determined by the US Department of Agriculture. In some areas, land that does not meet other definitions (prime or unique) is considered important farmland (or farmland of statewide importance) to produce of food, feed, fiber, forage, or oilseed. This is determined by the Indiana Department of Agriculture.
Pollution in Westfield comes in many forms, ranging from localized issues like soil contamination to regional air quality concerns. In 2023, 23 leaking underground storage tank sites were identified within the city, located primarily at commercial properties. These tanks present risks to groundwater and soil quality, highlighting the need for remediation. Similarly, four brownfield sites near W Main Street and US 31 and one on the southern border near the US 31/Keystone Parkway South intersection will require environmental remediation and monitoring efforts. A site in Hortonville has recently been identified as a brownfield with buried storage tanks.
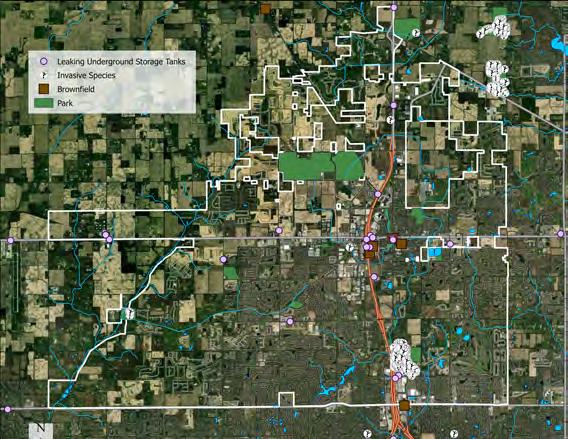
Another form of pollution stems from invasive plant species (i.e. Callery Pear, burning bush), which disrupt local ecosystems. Nearby natural areas that provide valuable environmental and recreational resources, such as Cool Creek Park and Bray Family Homestead Park, have extensive growth of invasive species.
Addressing these diverse environmental concerns requires a robust approach that prioritizes remediation, monitoring, and invasive species management to safeguard the environment and create sustainable growth and ecological preservation opportunities.
Infrastructure and public finance are some of the most influential factors for how cities develop. Access to utilities, transportation, and public services must expand as the population grows. Capacity for water, sewer, electricity, and gas affects how many people can live in a community as well as the types of businesses and industries that can locate there. Transportation infrastructure includes streets, sidewalks, and public transportation. Transportation capacity affects multiple aspects, such as residential populations’ quality of life and cost of living, or businesses deciding where to locate so they have the most traffic visibility, or distribution centers’ distance from railroads or highways. Public finances include a city’s budget and capacity for services and amenities as well as grants and non-profit partnerships. The city budget includes tax revenue from city residents and funds distributed by state and federal taxes.
Westfield Transportation and Park Map
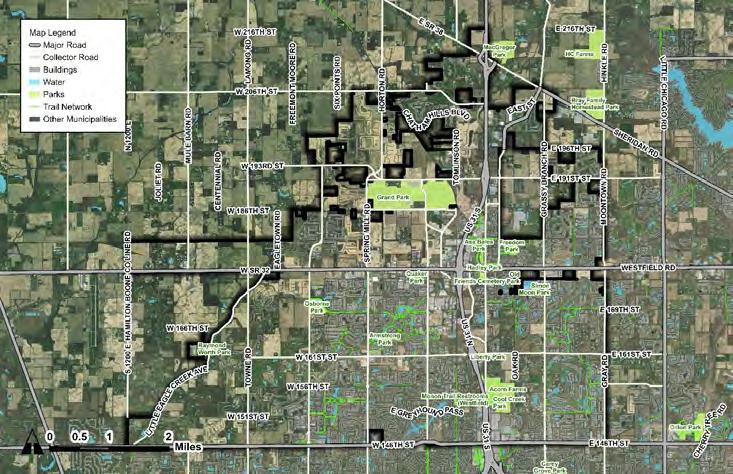
Westfield’s major transportation corridors are US 31 and Indiana State Road 32.
Westfield’s major north-south roadway is US 31; US 31 spans several states from Michigan to Alabama. State Road 32, Westfield’s Main Street, and West 176th Street, is the city’s major east-west roadway, which stretches from Ohio to Illinois. State Road 38 runs diagonally along the city’s northern boundary, crossing the state from Lafayette to Richmond. Although Westfield does not have any interstate access within its boundaries, it is about 25 miles east of the northbound Interstate 65 access near Lebanon, about 21 miles west from the northbound Interstate 69 access in Pendleton, and about 10 miles north of Interstate 465 in Carmel.
Westfield has several city and county roadways that serve the bulk of local traffic. The major east-west connections are 146th Street, 161st Street, 186th Street, and 191st Street. The major north-south connections are Gray Road/Moontown Road, Carey Road/Grassy Branch Road, Westfield Boulevard/Union Street, Oak Ridge Road/Grand Park Boulevard, Spring Mill Road, Ditch Road, and Towne Road. Several north-south connections have different street names on either side of their intersection with SR 32.
The City of Westfield does not operate public transportation, but public transportation is provided by some non-profit and community organizations. For example, Hamilton County Express is a demand-based origin-to-destination public transportation service provided by Janus®.
Westfield is near large Indianapolis suburbs.
Westfield is located north of the capital city of Indianapolis. It is within Hamilton County, which is also home to the popular Indianapolis adjacent cities of Carmel, Fishers, and Noblesville.
Indianapolis Metropolitan Planning Organization Regional Map
Westfield does not have direct rail access, but Hamilton County contains the Hoosier Heritage Port Authority (HHPA) railroad, which runs through Fishers, Noblesville, Cicero, Arcadia, and Atlanta.
Indiana Rail Systems, Hamilton and Adjacent Counties
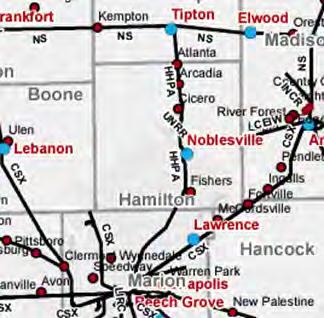
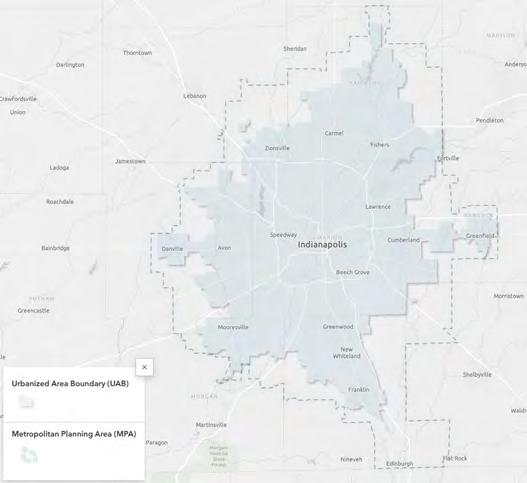
Westfield is home to a variety of pedestrian infrastructure systems, such as trails and bike routes.
Sidewalks exist within most subdivisions in Westfield, but sidewalks are often missing or incomplete along collector roads. Rural areas and older housing are less likely to have sidewalks along their road frontages. These will be important areas for the city to infill sidewalks or require sidewalks as a condition for development.
Westfield has 85.63 miles of trails within corporate limits. Selected trails and their lengths are listed below:
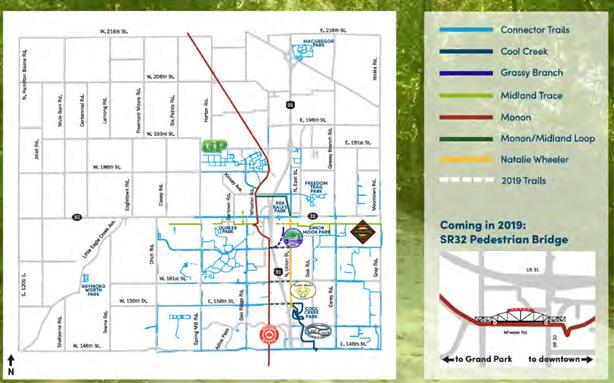
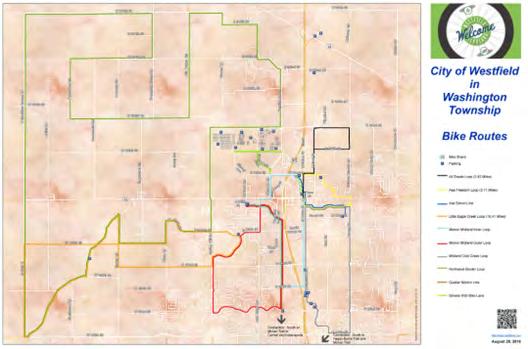
Westfield and Washington Township have several bike loops as shown on the map. The city plans to incorporate bicycle infrastructure along several arterial streets as shown on the Proposed Cycle Corridors Map.
Washington Township Bike Routes (2016)
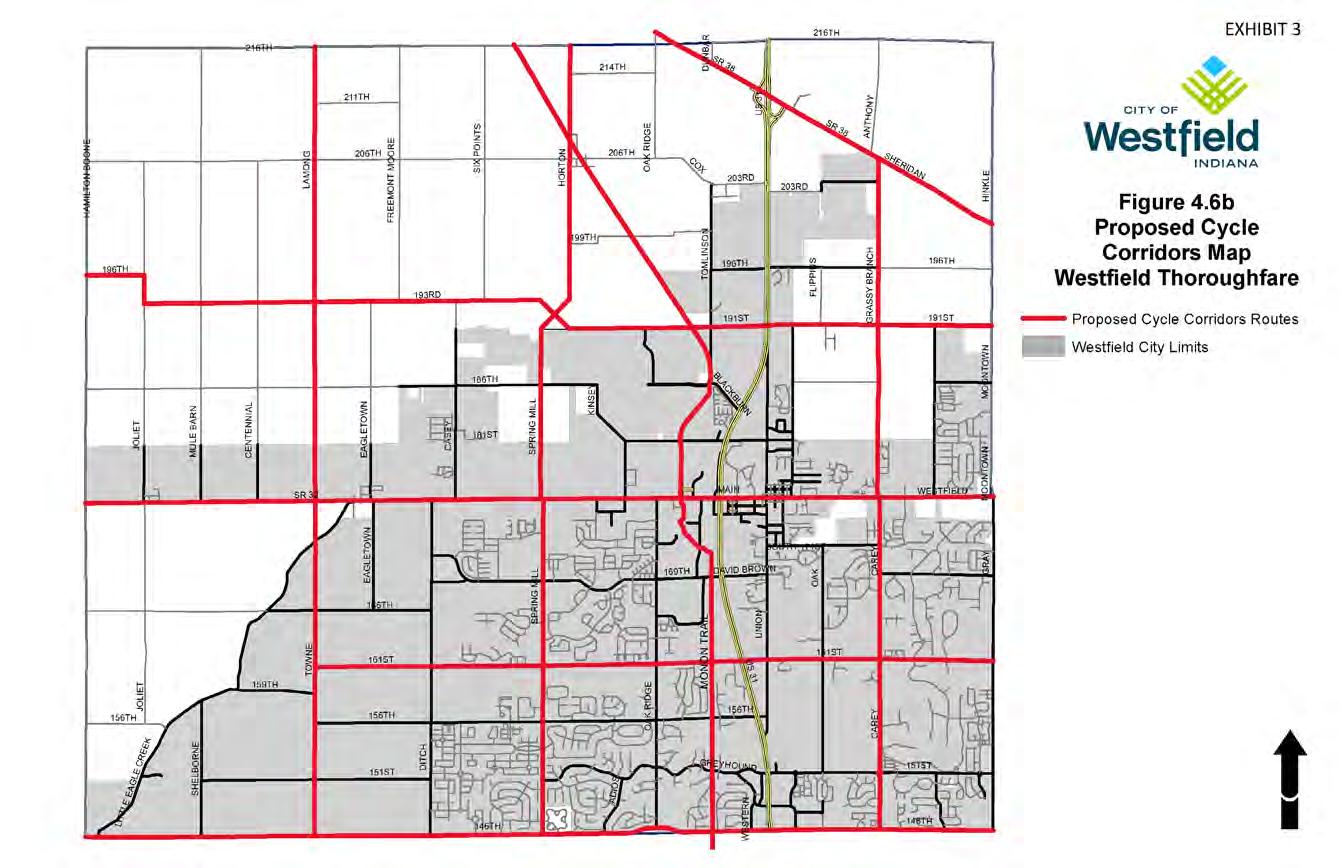
Golf carts are permitted on roads and trails, with restrictions.
The City of Westfield adopted an ordinance to permit the operation of golf carts on city roadways and trails (as amended per Ordinance 25-30). This ordinance permits licensed adults to operate golf carts on streets with speed limits of 25 miles per hour or lower in compliance with Indiana traffic laws. Golf carts must be inspected and approved by the Westfield Police Department.
The Westfield Thoroughfare Plan proposes various connectivity improvements.
The Westfield Thoroughfare Plan (amended in 2013) recommended updating functional classifications and extensions of streets, and prioritizing pedestrian infrastructure by installing sidewalks and multi-use paths. See the following maps for proposed improvements. The amended thoroughfare plan includes complete streets policies to safely accommodate all modes of transportation and the needs of all users.
Westfield Thoroughfare Plan (2011)
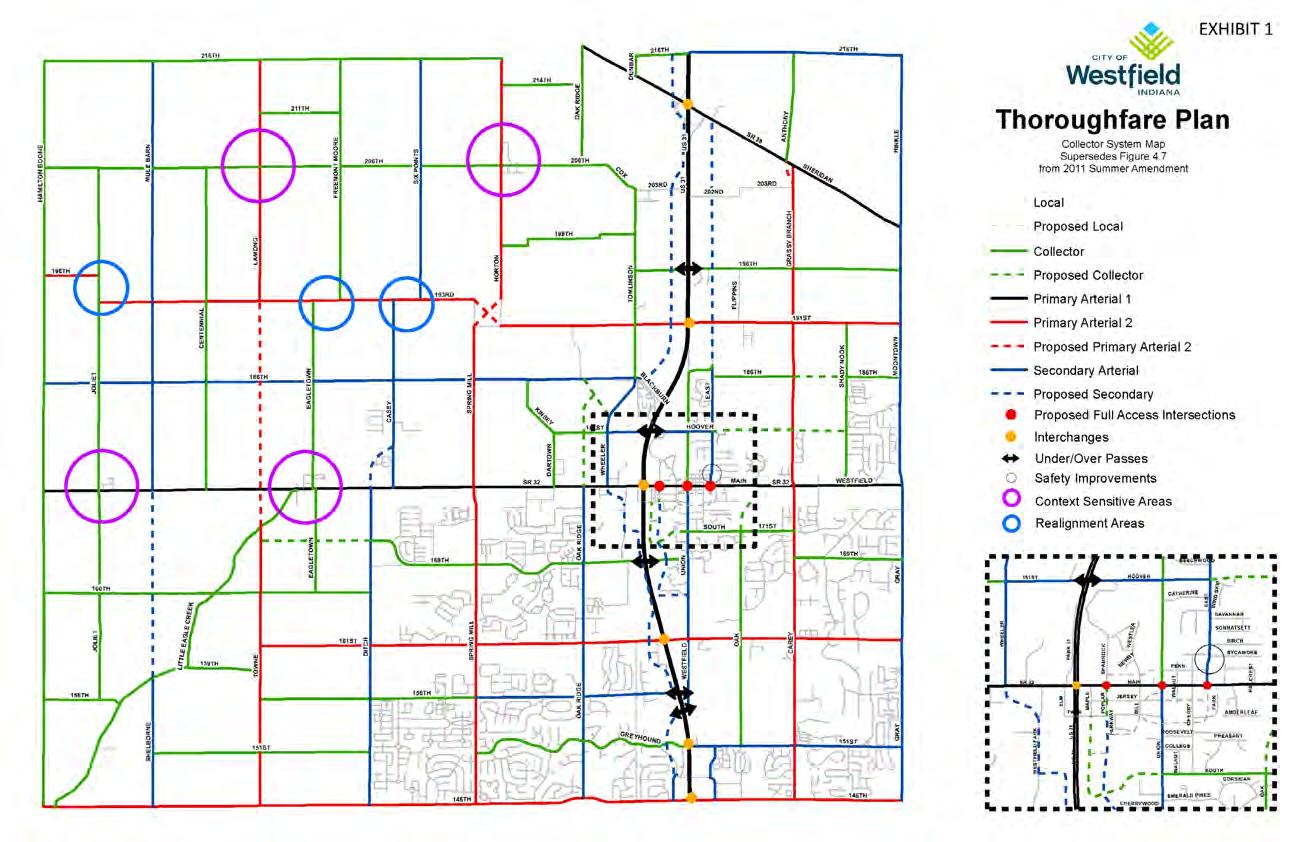
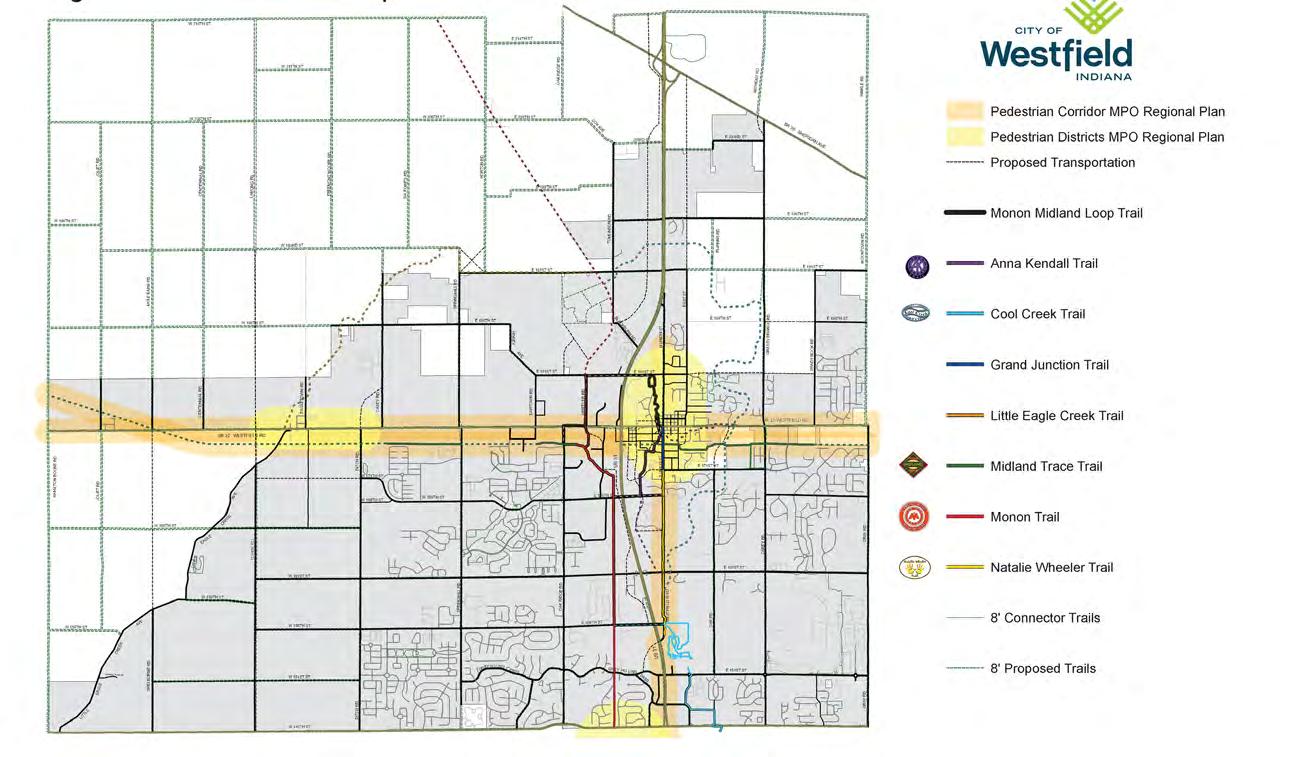
Duke Energy provides electricity in Westfield.
The electricity provider for Westfield is Duke Energy. Duke has a gaspowered station located in Noblesville with a peak capacity of 310 megawatts. Electricity rates are listed below. Duke has proposed a new northern transmission line, which will be about 2.5 miles long from the existing Westfield Northeast Substation to the newly proposed Noblesville West Substation. Much of the route will follow the existing 230 kV Transmission Line. The project timeline should start in 2025 and be completed in 2026.
Proposed Transmission Line
Citizens Westfield provides water and sewage services.
Citizens Westfield (by CEG) is the utility provider for water and sewer services. Water and wastewater lines generally follow the city’s street layouts as shown on the map above. Citizens Westfield’s water tower is located on 146th Street, east of US 31. Citizens Westfield provides 11.8 million gallons per day of drinking water. Water is sourced from multiple locations, including the Harbor Treatment Plant and wellfield and the Citizens Reservoir near Geist. The wastewater treatment plan is located on the far west edge of the city off SR 32. This plant has a current capacity of 3.75 million gallons per day, but a planned expansion should increase treatment to 5 million gallons per day. The City of Westfield also provides collection, disposal and drainage of storm and surface water. Service Rates are listed in the following tables.
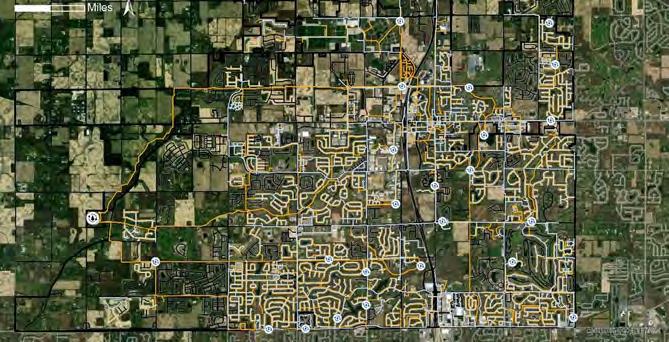
Citizens Energy Group provides natural gas for Westfield.
Citizens Energy Group is the natural gas provider for Westfield. Rates by use are listed in the table below:
Trash and Recycling is provided by the City of Westfield.
Trash and Recycling is provided by the City of Westfield for residential detached housing via WM (Waste Management Trash Service). Service fees are charged monthly. The collection and disposal fee for 2025 is $13.23 plus a $1.00 administrative fee (Ordinance 20-53).
Communications coverage is provided by various sources.
The main cell phone providers with coverage in Westfield are Verizon and T-Mobile at 100% and AT&T at 87.6%. Many telephone services use VoIP (Voice over Internet Protocol) services that connect to high-speed internet. Traditional landline telephone services are available through AT&T, Spectrum, and others.
Westfield has several internet providers, but the fastest and largest available non-satellite provider is Metronet. Satellite Internet is good for rural areas as it has 100% availability but can have lagging issues. Fiber connectivity has the highest upload and download speeds, followed by cable. The table below includes providers’ speeds, connection type(s) and availability in Westfield.
The Parks Department maintains recreational spaces.
The City of Westfield’s Parks and Recreation Department manages and maintains all city parks and trails and their programming and maintenance. The city also has a Parks Board, which has five members.
There are numerous parks with a variety of amenities in Westfield.
The City of Westfield Parks Department manages eleven parks, listed below. These parks are spread throughout the city, the largest park being Grand Junction Park and Plaza located between 186th Street and 191st Street. The most common park amenities include benches, playgrounds, paved trails, greenspace, pet waste stations, and on-site parking. See the amenities guide on page 59.
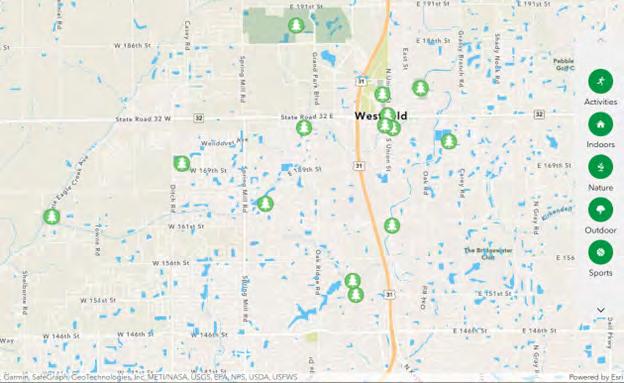
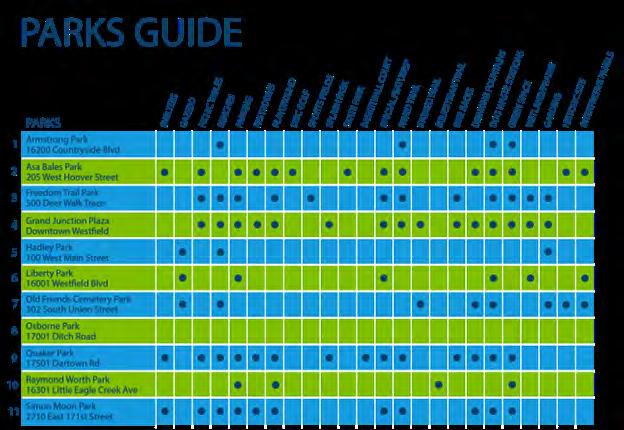
Westfield adopted a Parks and Recreation Plan in 2025.
Civic Services are split between fourteen departments.
The City of Westfield consists of fourteen departments:
(including
These departments are employed by the city to administer municipal services. The mayor, clerk-treasurer, and city council are elected positions. Other positions are non-elected civil servants but may include local government-appointed positions.
The City of Westfield has many commissions and boards:
8. Downtown Westfield Community Development Corporation
9. Economic Development Commission
10. GP Oversight Committee
11. Impact Fee Review Board
12. Mayor’s Westfield Disabilities Council
13. Oversight/Finance Committee
14. Parks Board
15. Plat Committee
16. Preservation Committee
17. Redevelopment Authority
18. Redevelopment Commission
19. Riverfront License Review Committee
20. Technical Advisory Committee
21. Westfield Building Corporation
22. Westfield Park Street Building Corporation
Commissions and boards may consist of a combination of resident volunteers, city employees, and appointed individuals. These commissions and boards are granted authority to make decisions, recommendations, and/or to enforce city codes, ordinances, policies, and resolutions in accordance with Indiana Code.
The Westfield Police Department provides civil support.
The Westfield Police Department is currently made up of six divisions with 75 employees, listed below. Westfield has one police station plus a substation at Westfield Middle School.
1. Criminal Investigations
2. K-9 Unit: 3 police K-9s
3. Patrol: 40 sworn officers, including the 25-member bike patrol
4. Records Division
5. Special Services: Department Training, Fleet Management, and Specialty Programs
6. Support Division: Officers and civilian staff
The Westfield Fire Department provides fire response and support.
The Westfield Fire Department (WFD) is currently made up of 70 employees and multiple divisions, including Fire Operations, Business Operations, Emergency Medical Services, and Training. Westfield has three stations, and a fourth station is currently under construction, and a fifth station was approved in 2025. The Division for Fire and Life Safety handle code enforcement, plan review, and fire protection testing in compliance with the Indiana Fire Code (a subset of the State’s building codes).
Emergency and Medical Services are well trained, and most citizens have health insurance.
Emergency Medical Services (EMS) operates under Westfield’s Fire Department. All Emergency Medical Technicians (EMTs) are certified with 30% of staff being licensed paramedics. WFD has two ambulances.
Westfield has one hospital, Riverview Health Westfield Hospital. In June of 2024, Community Health announced plans to locate a hospital in Westfield. Westfield has four free health clinics: Trinity, Heart and Soul, Hope Family Care Center, and Aspire.
94.5 percent of Westfield’s population has health insurance coverage. For Hamilton County, there are 713 people for every primary care physician, 1,346 people for every dentist, 579 people for every mental health provider, and 922 people for all other primary care providers.
Westfield is home to both public and private education providers from daycare to college.
Westfield’s public schools are operated by the Westfield Washington School District. Westfield has 10 public schools: One high school, two
middle/intermediate schools, six elementary schools, and one preschool. A new elementary school and a second middle school are under construction.
1. Westfield High School
2. Oak Trace Elementary School
3. Shamrock Springs Elementary School
4. Westfield Intermediate School
5. Westfield Middle School
6. Maple Glen Elementary School
7. Carey Ridge Elementary School
8. Washington Woods Elementary School
9. Monon Trail Elementary School
10. Virginia F. Wood Early Learning Center
Westfield is home to five private schools:
1. Union Bible College and Academy
2. St. Maria Goretti School
3. Montessori School of Westfield
4. Children’s Montessori House
5. Options Charter School
Westfield has several private daycares and pre-schools. Some examples are Kinder Care Learning Center 1715, Rainbow Child Care CenterWestfield, Centennial KinderCare, Abacus Early Learning Center, Westfield Wesleyan Childcare Center, Primrose School at Bridgewater, and Indiana Montessori Academy.
Westfield has one public library: Westfield-Washington Public Library. Construction of the library was completed and opened in June 2024. The library is over 43,000 square feet and has over 100,000 items in circulation.
Westfield has one college: Union Bible College and Academy (UBC). UBC is a private not-for-profit Christian college. UBC is also home to private Christian K-12 school Union Bible Academy.
City budget and funding has allowed for investments in capital improvements and public safety.
Westfield’s 2025 city tax rate is $0.7175 per $100 assessed value, excluding school referenda.
Civil City Budget: $124.6 million
Operational Budget: $78.2 million
$42.5 million in infrastructure investments, increased $24 million from 2024. Design and construction of several Capital Improvement Plan projects include roundabouts at 161st Street and Spring Mill Road, 181st Street and Wheeler Road, and expansion of 191st Street from Tomlinson Road to Grand Park Boulevard.
Continuing to invest in public safety: hiring new staff for Police and Fire Departments
Grant opportunities allowed Westfield to invest in their neighborhoods.
In 2024, Westfield announced their first-ever investment in neighborhoods through new grant program – the $240,000 Neighborhood Vibrancy Program.
Non-profit partners include community foundations as well as other groups.
Community Foundations: Central Indiana Community Foundation, Hamilton County Community Foundation, Advancing Westfield Foundation
Other Groups: Westfield Education Foundation, Westfield Library Foundation, Downtown Westfield Association
Westfield-Washington Township has seen a pattern of exponential population growth over the past 30 years, starting at the 1990 Decennial Census.
Westfield’s demographic profile reflects a community experiencing remarkable growth and transformation. The current population (2020) of 49,262 residents represents a substantial increase from previous Census data, with an annual growth rate of 5.83 percent that positions Westfield among the fastest-growing communities in Indiana and the broader Midwest region. This growth trajectory has been sustained over multiple years, indicating strong and consistent appeal to new residents and businesses.
Population growth is not merely a statistical phenomenon but reflects fundamental changes in the community’s character and composition. The 54.4 percent increase since the most recent comprehensive Census data (2010) demonstrates the scale of transformation occurring in Westfield, with implications for housing demand, infrastructure capacity, and service delivery that extend far beyond simple numerical changes. This growth rate significantly exceeds the state (5%) and national (7.4%) averages, indicating that Westfield is capturing a disproportionate share of regional population growth (11.8%).
In reviewing population trends specifically for Westfield, from 1990 to 2000, the population almost doubled from 9,272 to 18,358 residents. Then, from 2000 to 2020, the population soared to 49,262 residents. By 2025, the population is now 57,065 people (2025, westfieldecdev.com), which is an increase of 16 percent in five years.
Population and Growth Rate 1940 - 2020
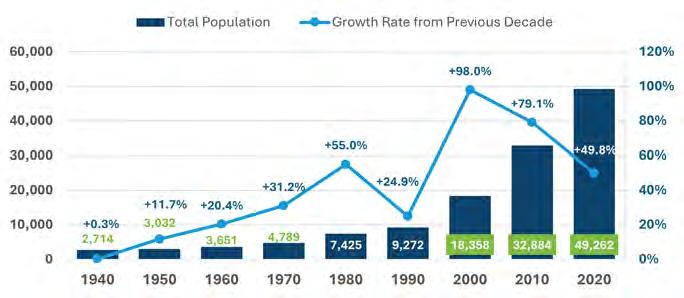
When reviewing land area and people per square mile the picture changes a bit. The chart below depicts the growth in land area from 1980 to 2020 for Westfield’s peer communities. Carmel had tremendous growth in land areas from 1990 to 2010 and then steadier from 2010 to 2020. Today Carmel is completely built out. Their only strategy is building up and increasing density in areas that need redevelopment. In 2020, Carmel had 2032 people per square mile and a total of approximately 49 square miles. Similarly, Noblesville’s land growth has been significant between 1990 and 2020. They are now 34.33 square miles with about 2027 people per square mile. Westfield’s growth has been more dramatic between 2000 and 2020 with its land areas growing from 7.62 square miles to 31.1 square miles by 2020. However, its population density is only 1,492 people per square mile, lower than both Carmel and Noblesville. In comparison, Fishers has seen steady growth from 1980 to 2020. They have seen fast population growth as well. Their land area was 2.2 square miles in 1980 and now it is approximately 36 square miles with a population of 2,779 people per square mile. Zionsville’s population density is low in comparison, with only 455 people per square mile.
Best practices indicate that if a community has greater than 5,000 people per square mile then it is considered a highly dense community that can support transit & walkability, has an efficient use of land, and vibrant public spaces. Communities with population densities ranging from 1,000 to 5,000 people per square mile are considered medium density communities. They generally have a balanced housing mix, with some transit options, and walkable nodes where possible. This is where Fishers, Carmel, Noblesville, and Westfield fit. Low density communities are those with less than 1,000 people per square mile. Communities that are autodependent have a high infrastructure cost per person, and have large lots and a sprawling community.
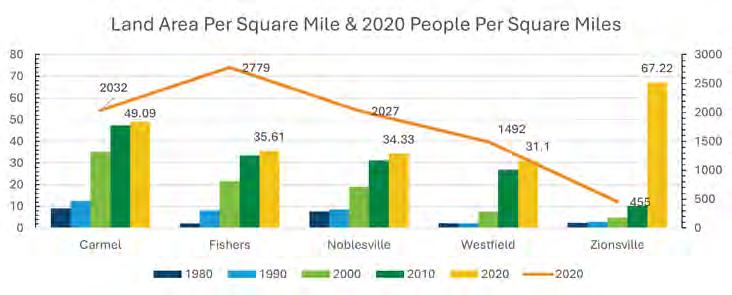
Following state and national trends, Westfield-Washington Township is becoming more diverse in both race and ethnicity.
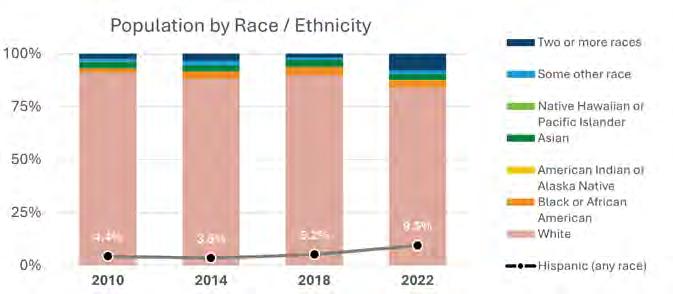
The racial and ethnic composition, while predominantly white at 84.1 percent, includes growing Asian (8.55%) and Hispanic (9.5%) populations that reflect increasing diversity and economic opportunity. This demographic evolution suggests that Westfield is attracting residents from diverse backgrounds, contributing to cultural richness and economic competitiveness while creating needs for different housing policies and community services.
Westfield is still a younger community, but the median age of Westfield- residents has increased quicker than its surrounding communities.
A median is simply the point at which half the population is above or below it. The median age of Westfield residents was 33.2 years old in 2010. This was younger than any of the other communities in Hamilton County. By 2024, Westfield had caught up to its neighbors with a median age of 37.4. Only Carmel has a slightly higher median age of 40.7.
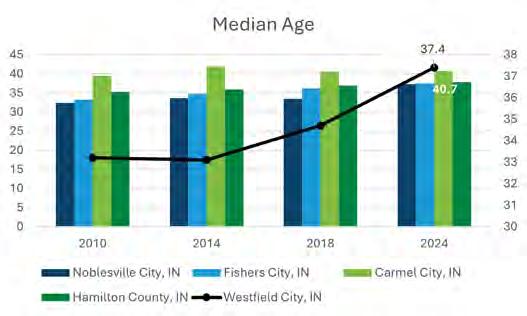
Additionally, Westfield’s population has aged at a faster pace than these other communities, as shown in the chart above. The line for Westfield is more curved, indicating a faster, more geometric growth rate rather than a straight line like the other areas. This can be attributed to the increase in seniors moving into the community to be near grandchildren. A fasteraging population may require, for example, more senior care services, especially as residents retire.
Westfield’s population is aging, with slower growth of children and faster growth of the older adult population.
As noted above, Westfield-Washington Township’s population is aging faster than other communities. The chart below illustrates WestfieldWashington Township’s total population breakdown by gender and age. Why this is important is that it shows us the trend of how Westfield’s population is growing now and how it could shift in the next 10 years.
The population chart illustrates that there are many young adults (25 to 34) to middle-aged adults (45 to 54) who live in Westfield. These age groups are highly qualified, they have worked hard to build their professional reputation or their start up business, have high paying jobs, disposable income, and own their own homes. Household sizes are smaller, averaging around 3.13 people per household. Their median household income is stronger on average, ranging from $72,000 to $138,000. Many commute for their job.
(ESRI Tapestry Segmentation) Because households are smaller in these age groups, we see smaller growth in the birth to 19 years range People in general do not have as many children as in previous decades and this is a trend that we believe will continue. The other end of the pyramid is that the 65 and older age group is increasing. As all tiers move up in the next decade it will be critical for Westfield to have a strategy to attract young professionals and new families to the city. This means looking at the housing choices in the market and determining how to make it attainable for these age groups to move to Westfield.
Westfield Population by Age
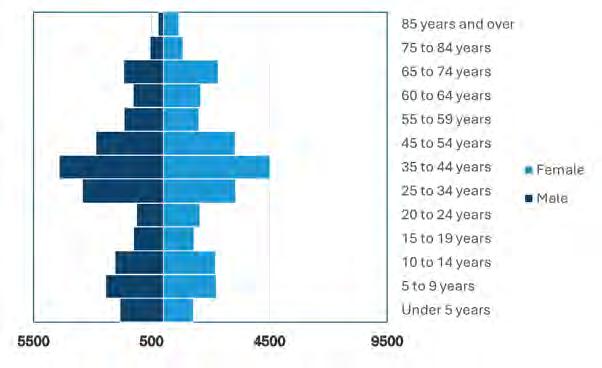
When examining population age further, two trends emerge. First, in the population 18-year-old and under, the growth rate has slowed from 2010 to 2020, whereas children only make up 32.3 percent to 27.5 percent, respectively, of the total population. However, the number of children in the community continues to increase from 9, 898 in 2010 to now over 14,000 children under the age of 18 in 2020. This means that this section of the population is still growing and is strong in terms of longevity of the community, indicating that families are still very much a growing part of Westfield. This also means the Westfield School system will continue to see growth as the city continues to grow. What affects this growth rate is two-fold, one reason is the size of a household. Many young adults are delaying having children until later in life and having less children. The second reason is the availability of housing. Many households want to raise their children in communities that have great schools, community amenities such as parks and trails, and other activities for children to do. But the median closed price for homes in Westfield is nearly $500,000 which can limit who can financially afford to move into the community, which affects the rate of growth.
The second trend that is growing rapidly is the number of people 65 years and older. In 2010, there were only 2,023 people 65 and older in WestfieldWashington Township. That was 6.6 percent of the total population. By 2020, that growth had doubled to 13.3 percent, leading to 6,833 people 65 years and older. Much of the growth is driven by the development of two 55+ active living communities that cater to this age group. Many in this age group have grandchildren who live in the region and play sports at Grand Park and this population wants to be nearby.
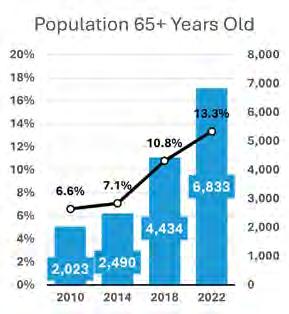
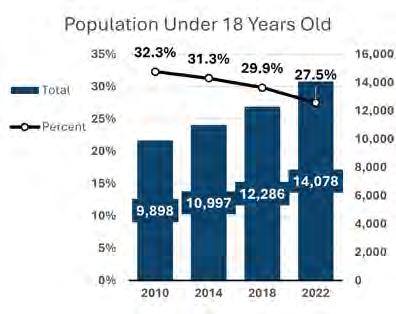
The growth by generation shows something similar. Generation X, whose birth years were 1965-1980, would have been between 30 and 45 years old in 2010. At that point in time, they should be established in their career, housing was much cheaper, resulting in steady growth from that generation from 2010 to 2022. They have been able to move to Westfield and find housing to meet each stage of their life. Comparatively, younger Millennials and Generation Z would have been children of Generation X, so they would be children in 2010, and potentially in 2014 and would naturally also be living in Westfield. However, Millennials peak in 2018 and drop off by 2022. Between those time periods they would have been 22 to 37 and 26 to 40 years of age, respectively. In their younger years, Millennials are just starting their jobs and don’t have the money to purchase a home, especially since home prices started to increase. This is also why there is a decline in 2022. They simply cannot afford to move back into Westfield because of the starting price of a home and there are limited housing options. Gen Zer’s are looking for a different type of quality of life: they want to live where they work, a walkable environment, and prefer renting homes for now. This leads to a different type of place altogether, more of the environment that Westfield is creating downtown.
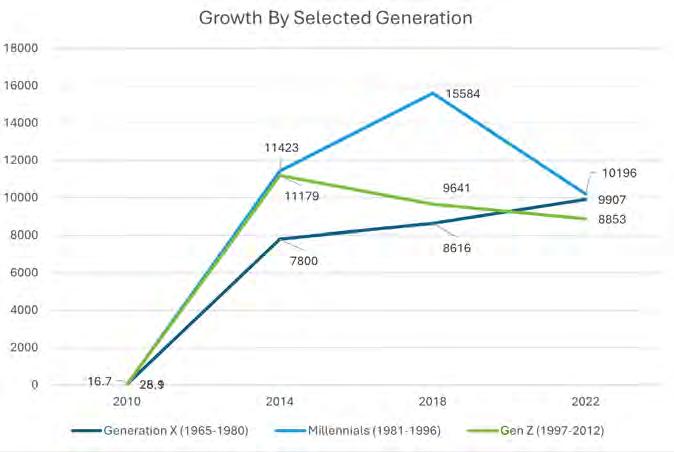
The City of Westfield ranks fifth in the state of the largest degree-holding populations by percent of population.
Westfield-Washington Township’s educational profile represents one of its most significant competitive advantages, with 63.9 percent of adults holding college degrees, including 37.1 percent with bachelor’s degrees and 18.8 percent with graduate degrees. This educational attainment level significantly exceeds state (37.2 percent with a college degree) and national (55.2 percent with a college degree) averages, indicating a highly skilled workforce that attracts knowledge-based industries and professional services.
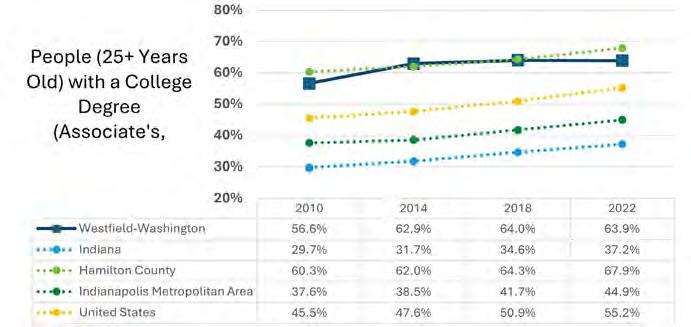
The concentration of college-educated residents reflects Westfield's evolution from a small suburban community to a major regional destination for professionals and families seeking high-quality educational opportunities and community amenities. The presence of highly rated schools, proximity to Indianapolis employment centers, and quality of life factors have created a self-reinforcing cycle that attracts educated residents and supports continued economic development.
However, this educational advantage also contributes to housing market pressures, as college-educated residents typically have higher incomes and greater purchasing power, contributing to upward pressure on housing prices. The concentration of high-income, educated households creates market conditions that may exclude essential workers, service industry employees, and others who contribute to community vitality but may not have college degrees or corresponding income levels.
The educational profile also suggests continued growth potential, as educated residents are more likely to start businesses, attract additional employers, and contribute to economic diversification. This human capital advantage positions Westfield for continued growth and prosperity but requires careful planning to ensure that housing opportunities remain available for workers across the economic spectrum.
Westfield High School has similar rates of enrollment and graduation compared to other high schools in Hamilton County.
Westfield has always been known for its quality education. That is one of the reasons why many families are moving to Westfield. The Westfield School Corporation’s boundaries include not only the City of Westfield but also Washington Township. Growth in the township and demographic changes will affect school enrollment.
In 2023, the high school graduation rate for Westfield High School (WHS) was 97 percent, well above the Indiana state average of 88.8 percent that same year, and comparable to surrounding schools such as Fishers High School and Carmel High School at 98.4 percent and 98.54 percent respectively. Attendance in the 2022-2023 school year was 94.86percent also comparable to Fishers and Carmel high schools. WHS had a reported enrollment of 2,937 high school students in the 2024-2025 school year, up from 2,789 in 2023-2024, according to the Indiana Department of Education. A study of the Westfield-Washington School District forecasting population and enrollment concluded that, “Even if the district continues to have some amount of annual new housing units’ construction over the next 10 years, the rate, magnitude, and price of existing home sales will become the increasingly dominant factor affecting the amount of population and enrollment change.” (Westfield Washington School District Population and Enrollment Forecasts 2024-5 through 2033-34, McKibben Demographic Research, LLC)
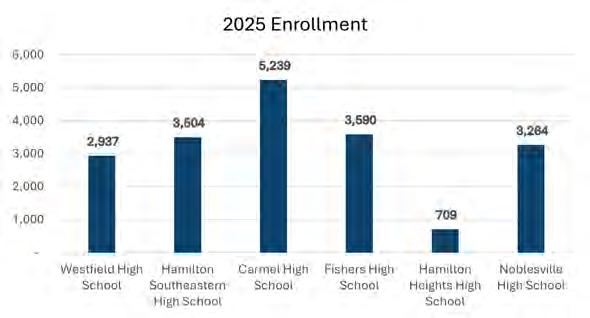
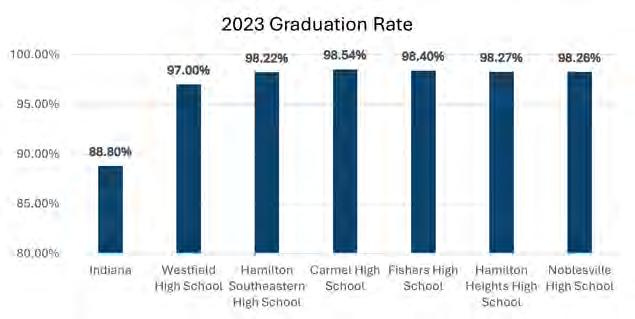
Since 2014, the poverty rate for children (under 18 years old) has continued to increase while the rate for all other age groups has decreased.
Children under 18 years old make up 27.5 percent of WestfieldWashington’s population, a larger proportion than across the state (23.3%) and Indianapolis Metropolitan Area (24.3%). The number of children in poverty in Westfield was 7.5 percent in 2022, up from 5.9 percent in 2014. In raw numbers, this represents an increase from 655 in 2014 to 1,049 children in 2022. Compounded with population growth, the uptick of children in poverty should be noted and tracked over time. This trend is also unique to Westfield-Washington as, conversely, child poverty rates have fallen across the rest of the state, Hamilton County, and Indianapolis Metropolitan Area for the same time period (2014-2022).
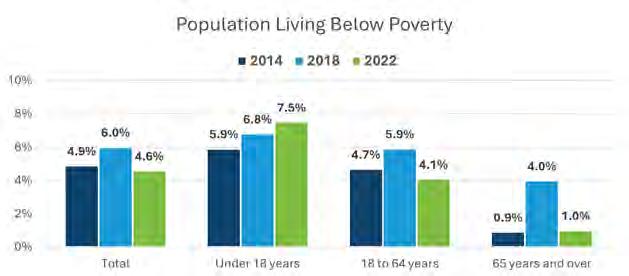
Housing is one of the critical components of a community. A place to live is the most basic need of people to live in the community. Residential land uses are often the most dominant land use in a community. How people move between their homes and places of work, school, shopping destinations, and third places impacts the transportation network. Proximity of the right type of housing can help people choose to walk or bike to destinations instead of driving or can reduce drive time. Without available housing it is challenging to attract new people to a community, and the housing available needs to match the needs of the people the community is attracting.
This section will review the physical characteristics, social/household characteristics, and financial characteristics of housing in Westfield.
Low housing vacancy and a lack of housing diversity persist in the community even with significant housing development over the past decade.
The most recent estimate of housing units for Westfield-Washington Township (2024) is 28,820 units according to the US Census Bureau. This represents a 141 percent increase since 2010 (only 11,969 housing units). Nearly 80 percent of the occupied housing units are owner-occupied.
A little more than 2 percent of housing units are vacant, which is lower than the “natural” vacancy rate of approximately six percent that allows people looking to move in the community available housing choices. Nearly twothirds of the vacant housing units are for rent, rented but not occupied, for sale, or sold but not occupied.
Over 80 percent of housing units are single-family detached homes. Recently there has been more construction of single-family attached homes, duplexes, and multi-family buildings, which diversifies the housing mix and housing choices in Westfield-Washington Township. The largest percentage of housing units have three bedrooms, followed by four bedrooms.
This means 80 percent of the housing units in Westfield-Washington Township are for larger families or people using bedrooms as offices, dens, game rooms, guest rooms, or other uses. A range of housing sizes (bedrooms as a proxy for size) can support people at a variety of life stages and a variety of household structures.
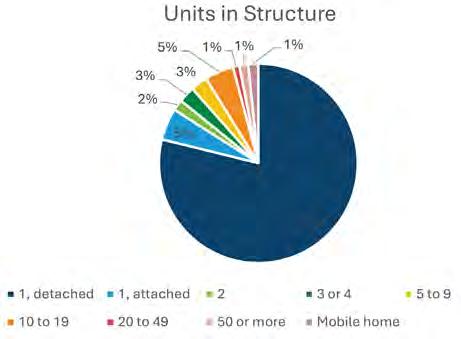
There is continuous housing construction in Westfield-Washington Township, and the actual number of housing units is constantly changing. Sixty-five percent of housing units, or roughly 7,800 housing units, have been built in the past 25 years. Only four percent of Westfield’s housing stock was built before 1950, which is significantly less than in the Indianapolis metropolitan area.
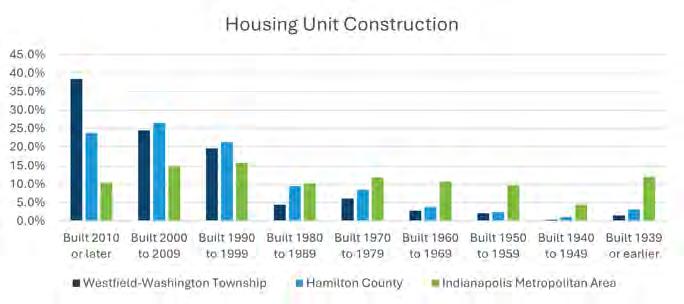
There are more homes with 3-4 or more bedrooms than there are households with three or more people.
There are 19,087 households in Westfield-Washington Township, an increase of more than 8,000 households since 2010. Slightly more than 20 percent of housing units are rented, or approximately 4,000 units.
Nearly 80 percent of households in Westfield-Washington Township are considered “family” household by the Census Bureau. Family households include married-couple households with children under 18 living at home and single-parent households as family households. Single person households, married couples without children under 18 living at home (no children or empty nesters), and people living with non-relatives are considered “non-family” households. Twenty-two percent of households in Westfield-Washington Township are non-family households. Slightly less than half of households have one or two people, with 27 percent having four or more people living in a household. This demonstrates a mismatch between the size of homes available by number of bedrooms and household size. There are more homes with 3-4 or more bedrooms than there are households with three or more people.
There are 5,800 married couple households in Westfield-Washington Township who have children under 18 living at home. Additionally, there are 1,500 single-parent households with children under 18 living at home. The most significant growth since 2010 has been in male headed households with children under 18 living at home.
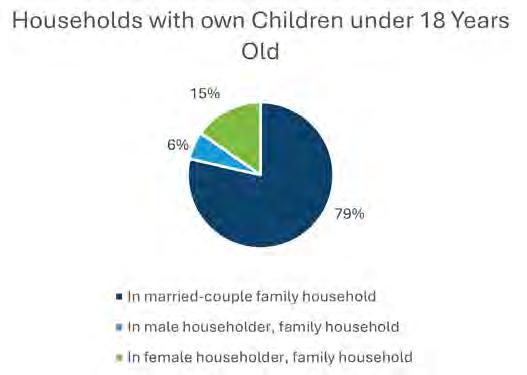
Community assets and housing types that support a variety of household structures are important to the success of Westfield Bedroom Number and Household Size
In rapidly growing communities like Westfield-Washington Township, the desirability of the community and limited housing vacancy can drive housing costs up and reduce the affordability of housing.
The median home value in Westfield-Washington Township in 2024 is $450,000. Eighty-six percent of owner-occupied homes have a value over $300,000. The median home value in the Indianapolis metropolitan area is $223,300 with variation between counties in the metro area. Three and a half percent of homes in WestfieldWashington Township are valued over $1 million. The median home value for Hamilton County is $350,900, which is lower than the median in Westfield-Washington Township.
The median gross rent in Westfield-Washington Township in 2022 was $1,431 per month; by 2024 the median gross rent had increased to $1,791 per month. In 2010 the median gross rent was $822. The median gross rent for Hamilton County is roughly the same as for Westfield-Washington Township, both of which are higher than for the Indianapolis metropolitan area or the state.
Attainable housing is generally housing costs that don’t exceed 30 percent of a household’s gross income, regardless of their income level. However, communities are generally less concerned about the cost burden on high earners, even though they may be spending more than 30 percent of income on housing or more than 45 percent on housing and transportation
costs combined.
More than 32 percent of households in Westfield-Washington Township are spending more than 30 percent of their gross income on housing costs. More than 23 percent of households that have a mortgage are spending more than 30 percent of their income on housing. More than eighteen percent of owner-occupied units without a mortgage have households that are cost burdened. In these cases, the cost burden comes from taxes and insurance or utility costs. Sixty-nine percent of renters in Westfield-Washington Township are cost burdened, spending more than 30 percent of income on housing costs. The percentage of renter households who are cost-burdened has increased significantly since 2010.
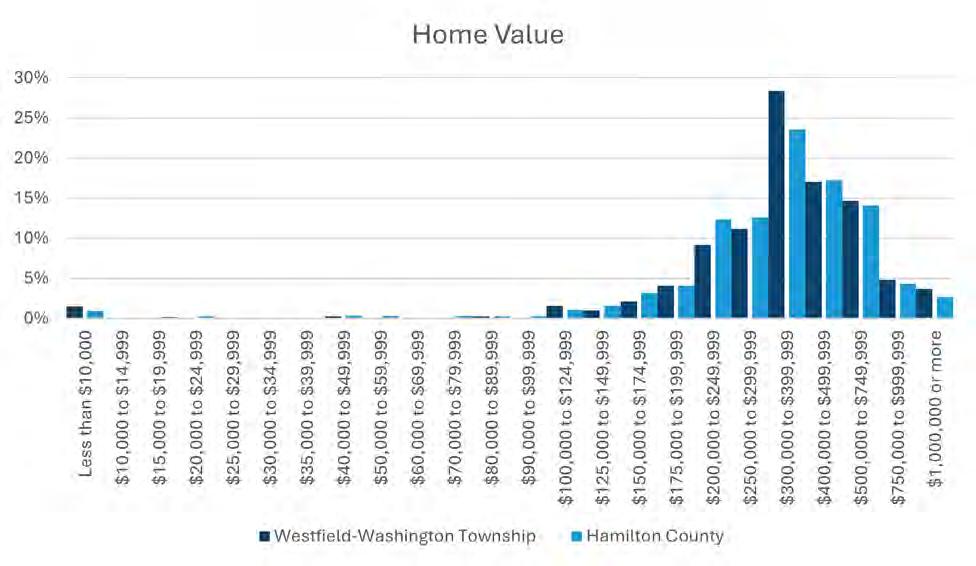
The economic profile provides a comprehensive market analysis for the City of Westfield to inform its economic development strategy. Westfield is a rapidly growing city with a strong economic foundation, a strategic location, and a high quality of life. The analysis identifies key demographic and economic trends, evaluates the city’s target industrial sectors, and provides a development program with recommended acreage requirements to support future growth.
Westfield is well-positioned to attract investment in high-value industries, particularly in biotechnology, medical device manufacturing, information technology, sports technology, and agribusiness. The city’s strong employment growth, high median household income, and educated workforce provide a solid foundation for economic expansion.
To support this growth, the city will need to allocate about 150 to 299 acres of land for the target sectors over the next five years. This program, combined with continued investment in infrastructure and quality of life amenities, will enable Westfield to achieve its economic development goals and secure its position as a leading destination for business and talent in the Indianapolis metropolitan area.
The City of Westfield experienced remarkable growth in recent years, establishing itself as a premier community for families and businesses. This report provides a detailed market analysis to guide the city’s economic development efforts, with a focus on identifying growth opportunities and providing a data-driven development program. The demographic and economic baseline gives an overview of Westfield’s population, income, and employment trends.
Westfield’s demographic and economic profile is characterized by rapid growth, high income levels, and a strong employment base as shown in the chart below looking at 2022 to 2023.
Population Metrics 2022-2023
US Bureau of the Census: American Community Survey
There are 13,862 workers in Westfield-Washington Township (2021). Of these, only 2,005 live in Westfield-Washington Township.
The local workforce is the people who work in the community, regardless of where they live. There are 13,862 workers in Westfield-Washington Township (2021). Of these, only 2,005 live in Westfield-Washington Township. Nearly half of the workers in the area are between 30 and 54 years old, with under 20 percent being over age 55 and one-third being under age 30.
Like statewide, unemployment is low in Westfield-Washington Township generally (2022 5-year Census) at 2.7 percent. However, there are segments of the population that experience higher unemployment including those age 55-59 at 3.1 percent and those age 60-64 at 5.6 percent. People who identify as Black have a high unemployment rate of 17.7 percent in Westfield-Washington Township. Those who identify as Hispanic also have a higher-than-average rate of 4.9 percent. When looking only at the primary working age population (age 20-64) the unemployment rate is 2.6 percent. Women are not experiencing higher unemployment than men, even with children under 18 living at home. However, people with disabilities who are of working age have a high unemployment rate of 11.8 percent. People aged 25-64 who have less than a high school diploma face a higher chance of unemployment (5.9%) as do those with only a high school diploma (5.2%).
Employment by Industry is available by place of work for primary jobs. Of those who work in Westfield/Washington Township 18 percent work in retail, 14 percent work in accommodation and food service, and 10 percent work in education. Many, not all, of the jobs in these sectors are lower paying than in other sectors and these jobs are primarily locally serving the daily needs of people who work in the community.
Employment by occupation, on the other hand, is available for the employed population in the community. This is the larger base in WestfieldWashington Township: people who primarily live in the community but work elsewhere. More than a quarter of the employed population works in management, business, and finance. Thirteen percent work in sales, and 10 percent each work in services (including legal, educational services, community services, arts, and media) and office management/ administration services.
Most workers in Westfield-Washington Township work for what are considered “small businesses” those with under 500 employees.
More than 8,000 workers are in these smaller businesses, and most of those are employed by firms with fewer than 250 employees. Forty-two percent of workers in the area work for businesses with more than 500 employees, which is a smaller percentage than Hamilton County as a whole or the Indianapolis metropolitan area. Smaller businesses are more likely to be locally owned than the larger firms. The smallest firms, with fewer than 20 employees, are likely to be local entrepreneurs. These businesses may be at higher risk during recessions or have a harder time competing for labor when the labor market is tight. However, the market diversification that generally occurs with smaller businesses can make the community less susceptible to economic distress when there is a downturn that affects particular segments of the economy.
Most Westfield-Washington Township residents who work are still commuting outside the township for work.
The percentage of people who live and work in Westfield/Washington Township (73%) has grown more between 2002 and 2021 than the percentage of people who live outside Westfield-Washington Township and work in the township (57%) has, even though that percentage has also grown significantly. In 2021 2,005 people lived and worked in WestfieldWashington Township and 11,857 lived elsewhere but worked in WestfieldWashington Township. This growth is influenced by both new business development and new housing development in the area. Using the township as the area of measure means that annexation isn’t affecting the numbers.
Most Westfield-Washington Township residents who work are still commuting outside the township for work, with 23,487 working elsewhere in Hamilton County or out of the county in 2021. Forty percent of workers who live in Westfield-Washington Township are commuting to Indianapolis, and another 17 percent are commuting to Carmel. Of those working elsewhere, nearly 18 percent are from Indianapolis, 13 percent from Carmel, and the largest group is from either Marion County or the municipalities in southern Hamilton County (Westfield, Noblesville, Carmel, and Fishers).
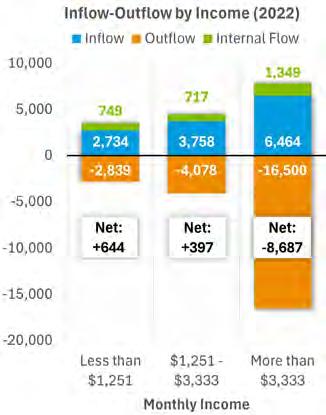
Those with the highest monthly income are those who work outside Westfield-Washington Township. It is important to note that these are private sector jobs and do not include people who work for any unit of government.
Workers who live in Westfield-Washington Township generally have short commutes of less than 10 miles.
Workers who live in Westfield-Washington Township generally have short commutes of less than 10 miles and most of the others have moderate commutes of 10 to 25 miles. The largest group of people who work in Westfield-Washington Township but live elsewhere commute less than 10 miles (40%) but another large group commute 10-25 miles (30%). With both those coming to Westfield-Washington Township to work and those leaving the area to work the commute distances are longer than the average for the Indianapolis metropolitan area.
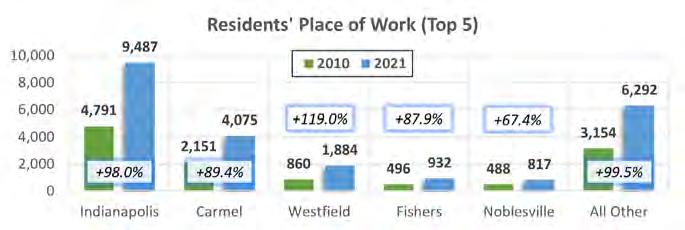
Most commuters in Westfield-Washington Township drove a vehicle to work by themselves. The percentage of people who commute this way has declined since 2010 from 83.8% to 73.4% in 2022. The percentage of people who work from home rose from 6.3% to 16.3% during that period, indicating that people didn’t shift their travel mode as much as they stopped commuting to an office/workplace.
There are substantial differences in median earnings between men and women in Westfield-Washington Township.
Earning data are available from the 2022 Census 5-year American Communities Survey and are presented in 2019 income-adjusted dollars. The average earnings in Westfield-Washington Township for people over 16 with earnings is $46,252. Among full time year-round workers, the median earnings are $66,370. Earnings income is reported per working individual, rather than on a household basis. In Westfield-Washington Township more than one-quarter of people with earnings make over $100,000. Another 16.5 percent make $75,000 to $99,999.
Household income is a measure of the earnings (and non-earning income) that all individuals in a household make. The median household income in Westfield-Washington Township is $123,465 (2025, westfieldecdev.com).
People over the age of 16 in full-time year-round jobs with earnings experience differences in earnings based on industry and occupation as well as their educational attainment and gender. The highest earning industries for people who live in Westfield-Washington Township are agriculture/fishing/forestry/hunting at $107,576 and public administration at $73,087. The lowest earnings are in arts/entertainment/recreation/ accommodations/food service at $13,692 and educational services at $43,169. By occupation those in management/business/science/arts earn $79,531 and those in service earn $31,446.
Earnings for individuals aged 25 and over varied significantly by the highest level of education completed. Those with a HS diploma had median earnings of $29,774, while those with a bachelor’s degree had median earnings of $63,486. Those with a graduate or professional degree had median earnings of $85,652. There are, however, substantial differences in median earnings between men and women in Westfield-Washington Township, even controlling for educational attainment. The median earnings for a man with a bachelor’s degree are $84,645 compared to women with a median of $42,241. At the graduate/professional degree level the median earnings for men are $114,247, but for women they are $54,291.
For those who worked in Westfield in 2022, the sectors with the highest payroll reported (average per employee) was in professional, scientific, and technical services with an average annual payroll of $76,587. Wholesale trade was the second highest payroll with an average annual payroll of $72,922 per employee. The lowest payroll per employee was $19,853 in accommodations and food service.
A measure of income equality used globally is the GINI index. It measures the extent to which income distribution in a place differs from an equal distribution. A perfectly equal distribution would have a GINI index of 0, while a perfectly inequal distribution would have a GINI index of 100. A GINI index of 50 would indicate a normal distribution of income. In the US, the GINI index is .48, or a slightly more equal distribution than normal. Indiana is somewhat more equal distribution with a GINI index of .45 and WestfieldWashington Township has a GINI index of .45 as well.
Sectors with the greatest increase in competitiveness are construction and arts, entertainment, and recreation locally.
A quick, but informative, measure of local economic competitiveness is the location quotient, which considers the strength of a smaller economic area relative to a larger one. In essence, is the local economy only producing enough of a good or service to meet local demand or is it producing more or less than would be needed to meet local demand. In Westfield-Washington township the most competitive industries are agriculture, construction, arts/entertainment, and accommodation and food services. Retail trade also has more jobs in Westfield-Washington Township than one would expect based on the number of jobs in that sector compared to the Indianapolis metropolitan area. Between 2002 and 2021 construction has grown significantly in the township relative to the metropolitan area while information sector jobs have decreased in relative competitiveness. Agriculture is still substantially competitive but has declined significantly. Sectors with the greatest positive change have been construction and arts, entertainment, and recreation. The large-scale construction projects, housing construction since the Great Recession, and opening of land for development with new infrastructure projects explain the growth in construction. The opening of Grand Park and its many events, along with smaller recreation venues like Grand Junction and the Westfield-Washington YMCA have created growth in that sector.
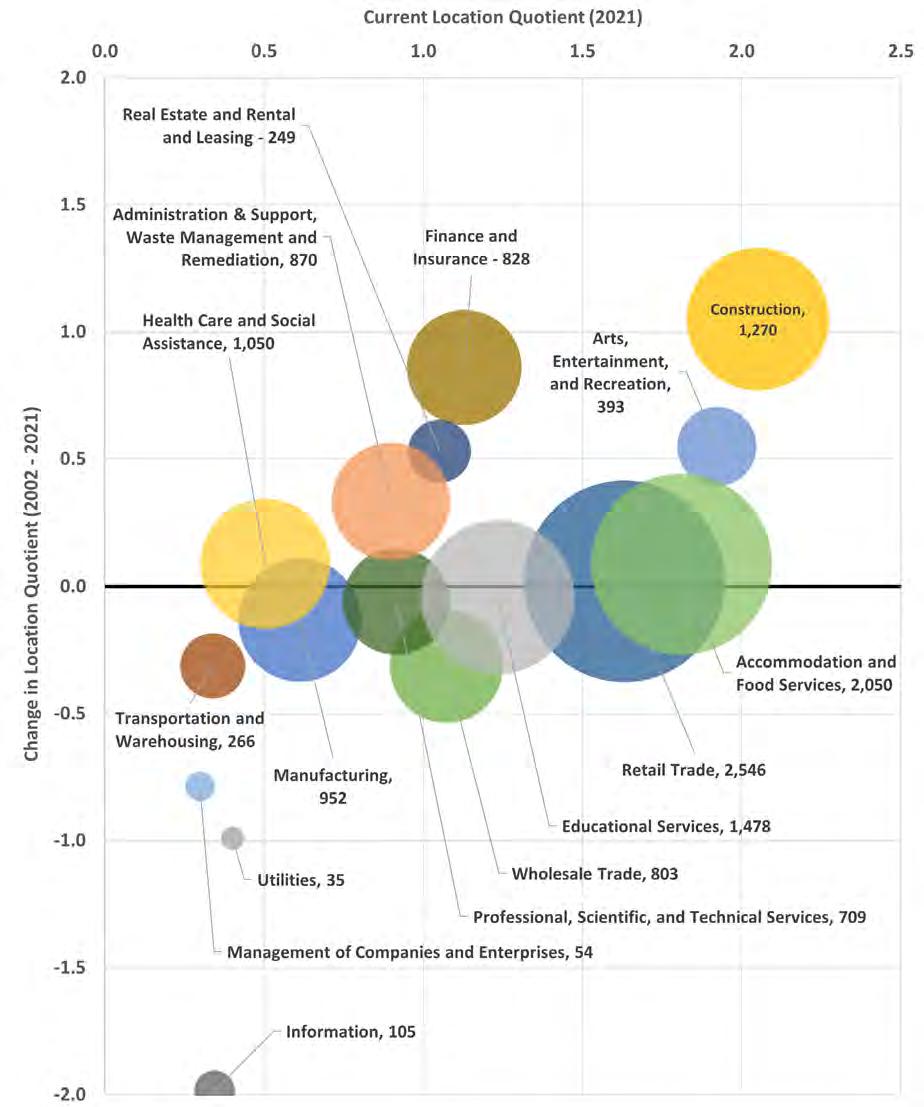
A safe, efficient, and resilient multimodal transportation system does more than just provide for the movement of people and goods from one location to another. It creates opportunities for economic development and private investment, adds character to the public realm, and enhances the quality of life for residents. Westfield’s transportation system consists of an interconnected network of roadways, sidewalks, trails, and on-demand transit services that together serve the daily needs of Westfield residents, visitors, and businesses. The transportation system is documented on the following pages.
1. The city maintains a gridded network of major and minor arterial and collector roads, providing an easy-to-navigate system. US 31 roughly bisects the city and carries the most significant traffic volumes followed by State Road 32 and 146th Street.
2. 2024 baseline year Level of Service (LOS) shows that all the roads operate at LOS D or better except for select segments at intersections which operate at LOS E. These intersections are State Road 32 at Gray Road, 146th Street at Gray Road, and 161st Street at US 31.
3. A 5-year crash analysis found the total number of KSI crashes reached a low in 2020, after peaking in 2019. No fatal crashes occurred from 2020 to 2022. Bicycle and pedestrian crashes are 9.8 percent of all KSI crashes but constitute 28.6 percent of fatal crashes.
4. Westfield has constructed both single and multi-lane roundabouts, like many nearby municipalities. Roundabouts have been utilized in the region as effective intersection treatments for both safety improvements and traffic operational improvements.
5. There are limited on-street bicycle facilities in Westfield, but an increasingly comprehensive shared use path and trail system supports multimodal mobility throughout the city. There are approximately 278 miles of public and private sidewalk, and over 80 miles of trails owned by the City of Westfield.
6. The city has recently adopted a golf cart ordinance that allows for golf carts to be operated on perimeter trails (sidewalks over five feet wide) and on the Midland Trace Trail east of US 31. This expands their use beyond the prior restriction of local streets with speed limits of 25 mph or less under the 2018 ordinance. Golf carts are limited to 15 mph on perimeter trails.
Each roadway in the City of Westfield serves a unique purpose, from moving people and goods through the city to providing access to residences, schools, places of employment, and other destinations within the city itself.
Roadways can best be described in terms of functional classification – how roads are categorized according to their function within the transportation system. Roadways serve two primary travel needs: access and mobility. Mobility is the ability to travel freely to a destination in a given amount of time. Access is the ability to travel to various destinations within a given amount of time. While most roads in the network provide some combination of access and mobility, a roadway’s functional classification indicates its primary purpose.
The Indiana Department of Transportation (INDOT) classifies roadways into the following seven types, from the highest level of functional classification to lowest:
• Interstate
• Freeway/Expressway
• Principal Arterial
• Minor Arterial
• Major Collector
• Minor Collector
• Local
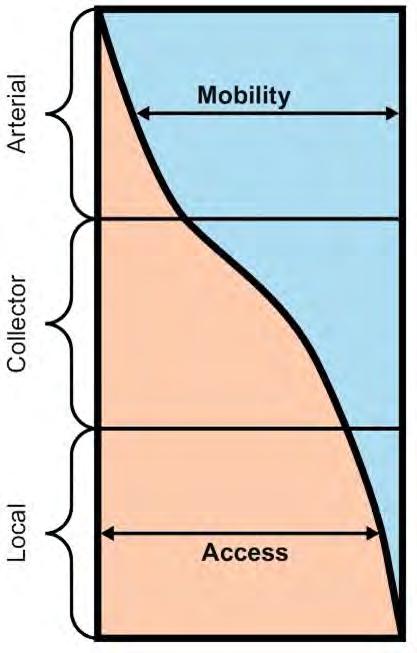
Interstates, freeways, and expressways are characterized by high travel speeds, limited access, and the greatest capacity for traffic volumes. They are divided and have at least two lanes of traffic in each direction. As classified by INDOT, Westfield is served by one freeway/expressway, US 31, which runs north-south through roughly the center of the city. There are no interstates within Westfield, however south of the city I 465 runs eastwest, encircling Indianapolis.
Principal arterials are designed to serve high-volume traffic movements for statewide travel while connecting major destinations within urban areas. Principal arterials should generally be designed to connect to major traffic generators and carry multiple lanes of traffic with minimal access points. There are three principal arterials in the City of Westfield: 146th Street, State Road 32 east of US 31, and US 31 north of 191st Street.
Minor arterials generally connect city to city in rural areas but can serve to connect principal arterials to denser urban road networks within urban areas. These roads are designed to serve trips of moderate length at a slightly lower volume than principal arterials. Minor arterials are characterized by lower travel speeds than interstate highways and principal arterials and are generally two to four lanes wide. There are two minor arterials in Westfield, State Road 32 west of US 31 and State Road 38/ Sheridan Road at the north-eastern city limit.
Collector roads serve a critical role in the transportation network by gathering traffic from local roads and funneling them to the arterial network. In rural areas, collectors provide connections between cities and towns. In urban areas, collectors provide links between neighborhoods and to higher class arterials. Collector roads are characterized by moderate to
low speeds, lower traffic volumes than arterial roadways, and greater access to adjacent parcels and land uses. Examples of major collectors in Westfield include 191st Street, 161st Street, Grassy Branch Road, and Springmill Road. Examples of minor collectors in Westfield are Grand Park Boulevard, 186th Street, and Wheeler Road. Many of the collector roads in Westfield form a gridded roadway network. A gridded network is advantageous for ease of navigation, dispersion of vehicular traffic, and alternative route options.
All other public roads and streets form the local road network. Generally designed for shortdistance travel, local roads are characterized by maximum access to adjacent properties, low travel speeds, and typically one travel lane in each direction. The local roadway network in Westfield, with some notable exceptions, is characterized by subdivisions with circular routing, dead-end cul-de-sacs and limited connectivity to the larger roadway network.
A map of Westfield’s roadway network by functional classification is shown here followed by a map of roadway ownership within the City of Westfield on the next page.
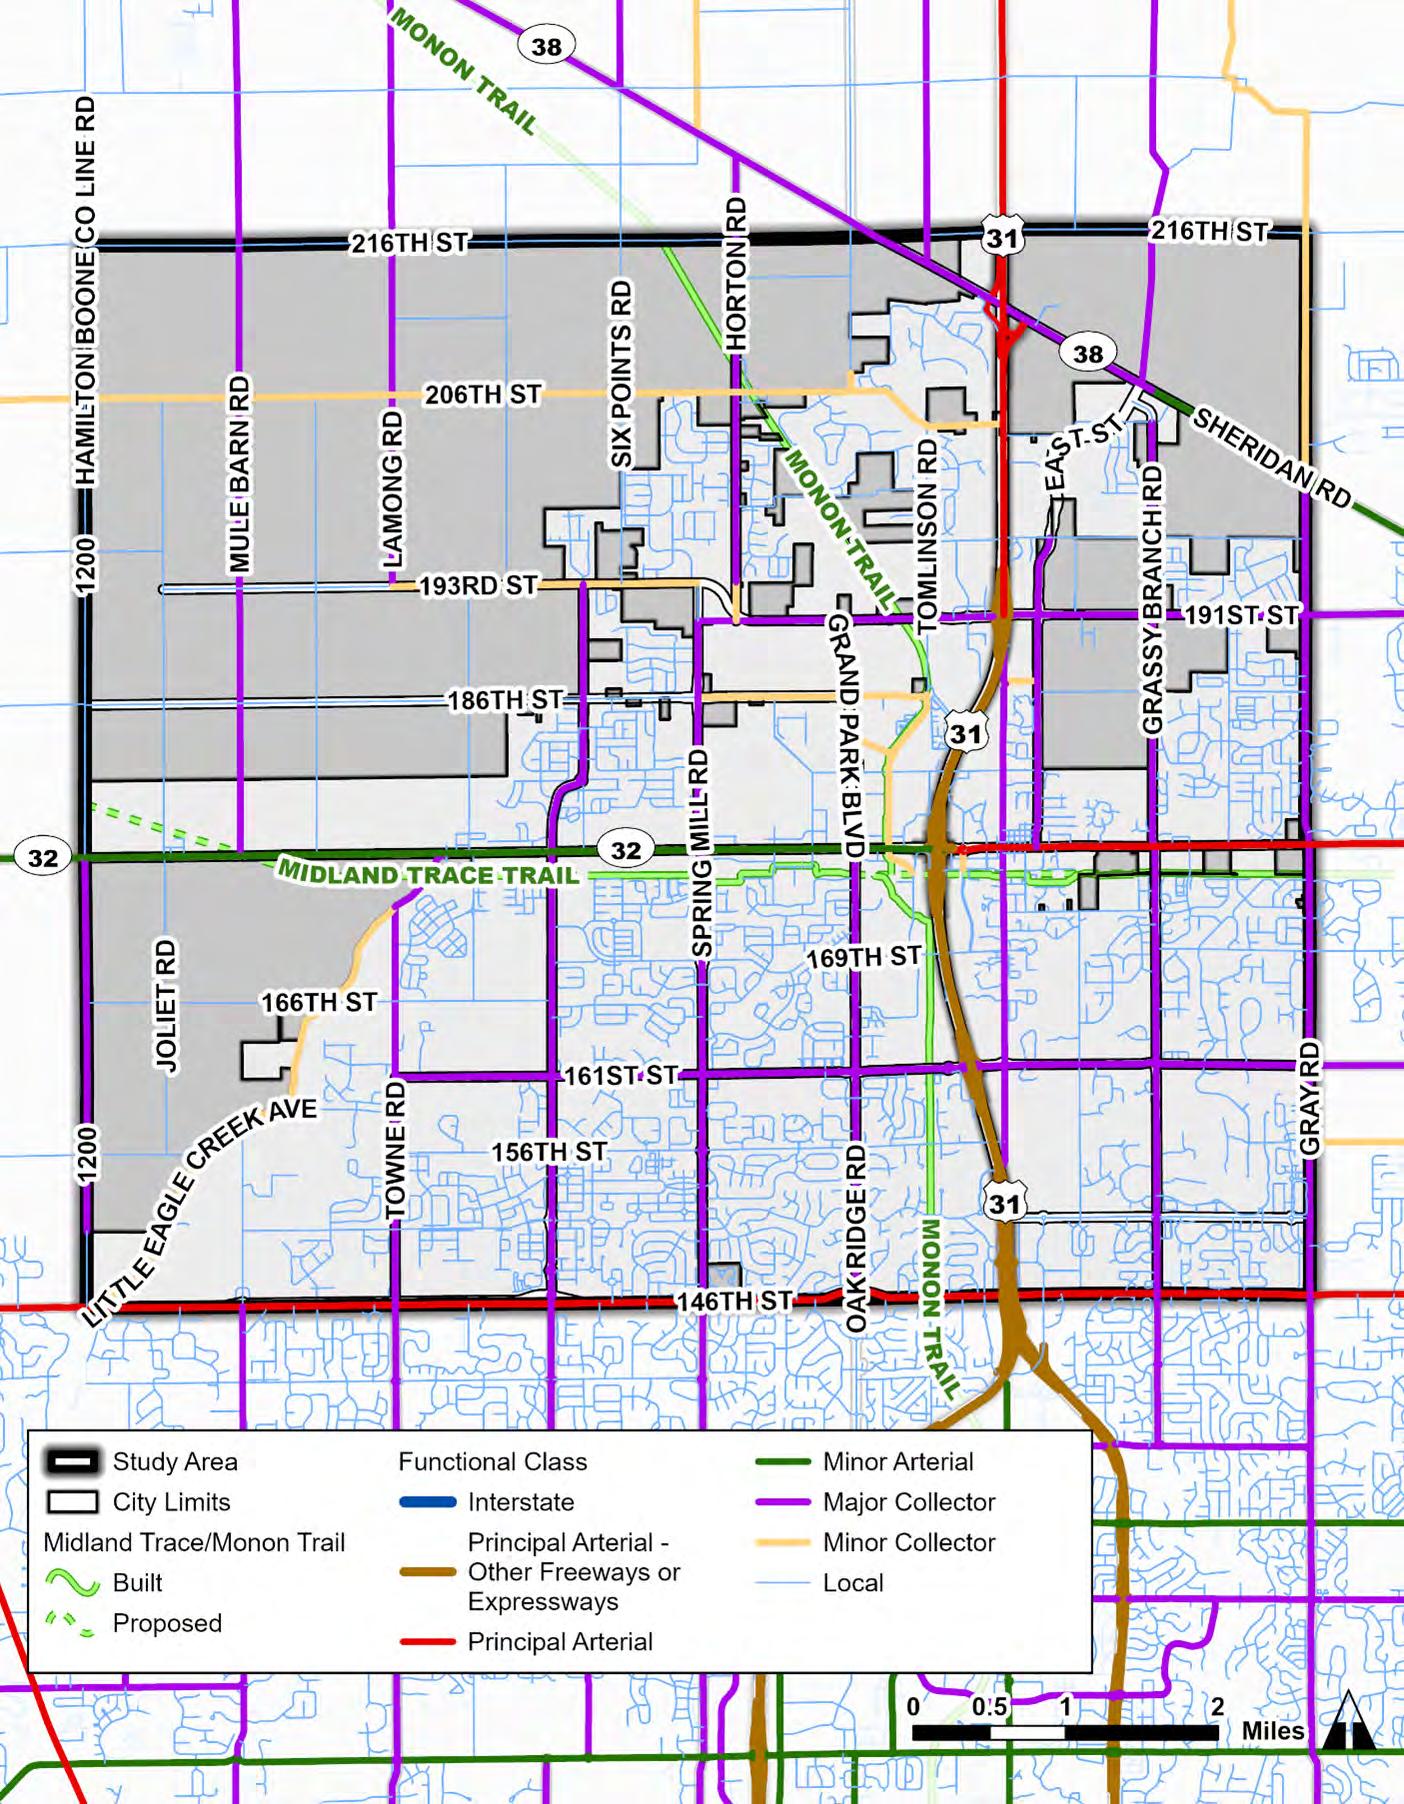
Westfield Road Ownership Map
Westfield is primarily an auto-oriented, auto-dependent community and most people rely on personal vehicles to travel. It is important to consider the volume of traffic that the city’s major roads carry to better understand travel patterns, future roadway capacity, and potential implications for future roadway improvements.
INDOT and other local agencies count traffic volumes as a measure of activity along a given road or at a specific intersection. Traffic volumes are typically measured in annual average daily traffic (AADT), which is the average number of vehicles passing a given location or “screenline” along a roadway. These traffic counts can be used to measure a roadway’s significance within the network; evaluate its level of service; compare historic or year-over-year changes in traffic; project future traffic volumes based on historic growth, planned development, and anticipated future growth; and assess a roadway’s capacity for road diets and other reconfigurations to improve safety and better support pedestrian, bicycle, and transit modes.
According to 2022 INDOT AADT data, the roadway with the highest traffic volume in Westfield is US 31 at its peak near 161st Street with an AADT of 74,702. State Road 32 between Oak Ridge Road and US 31 with an AADT of 27,425, is the only other roadway in the city with an AADT above 25,000. Throughout the rest of Westfield, State Road 32 has an AADT approximately between 14,000 and 23,500. E 146th Street carries the next highest volume of traffic with an AADT of 22,427 VPD near US 31 and an AADT of just under 12,000 near the City’s western edge.
US 31 and State Road 32 are owned and operated by INDOT, while 146th Street is owned and operated by Hamilton County. All three are principal arterials and/or minor arterials that are not owned by the city. Controlling traffic volumes on these roads is not fully within Westfield’s control. A map of 2022 AADT volumes sourced from INDOT is shown on the following page.
Similar to AADT, the Annual Average Daily Truck Traffic (AADTT) identifies the average volume of truck traffic for a one day (24-hour period) during a data reporting year. US 31 carries the largest amount of truck traffic through Westfield, with 146th Street and State Road 32 carrying the next highest amounts. AADTTs sourced from INDOT are displayed on the map following the AADT volume map.
The National Network supports interstate commerce by regulating the size of trucks on its routes. National Network routes in the City of Westfield are shown below. US 31 and State Road 32 are both part of the National Network.
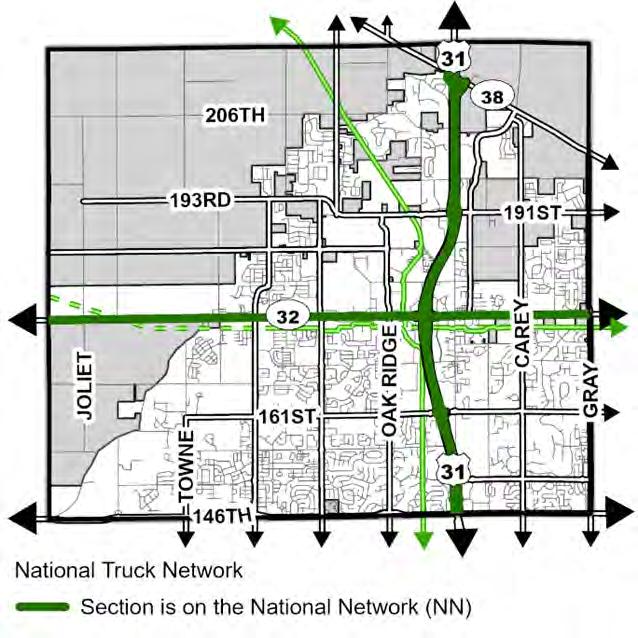
Annual Average Daily Traffic, 2022
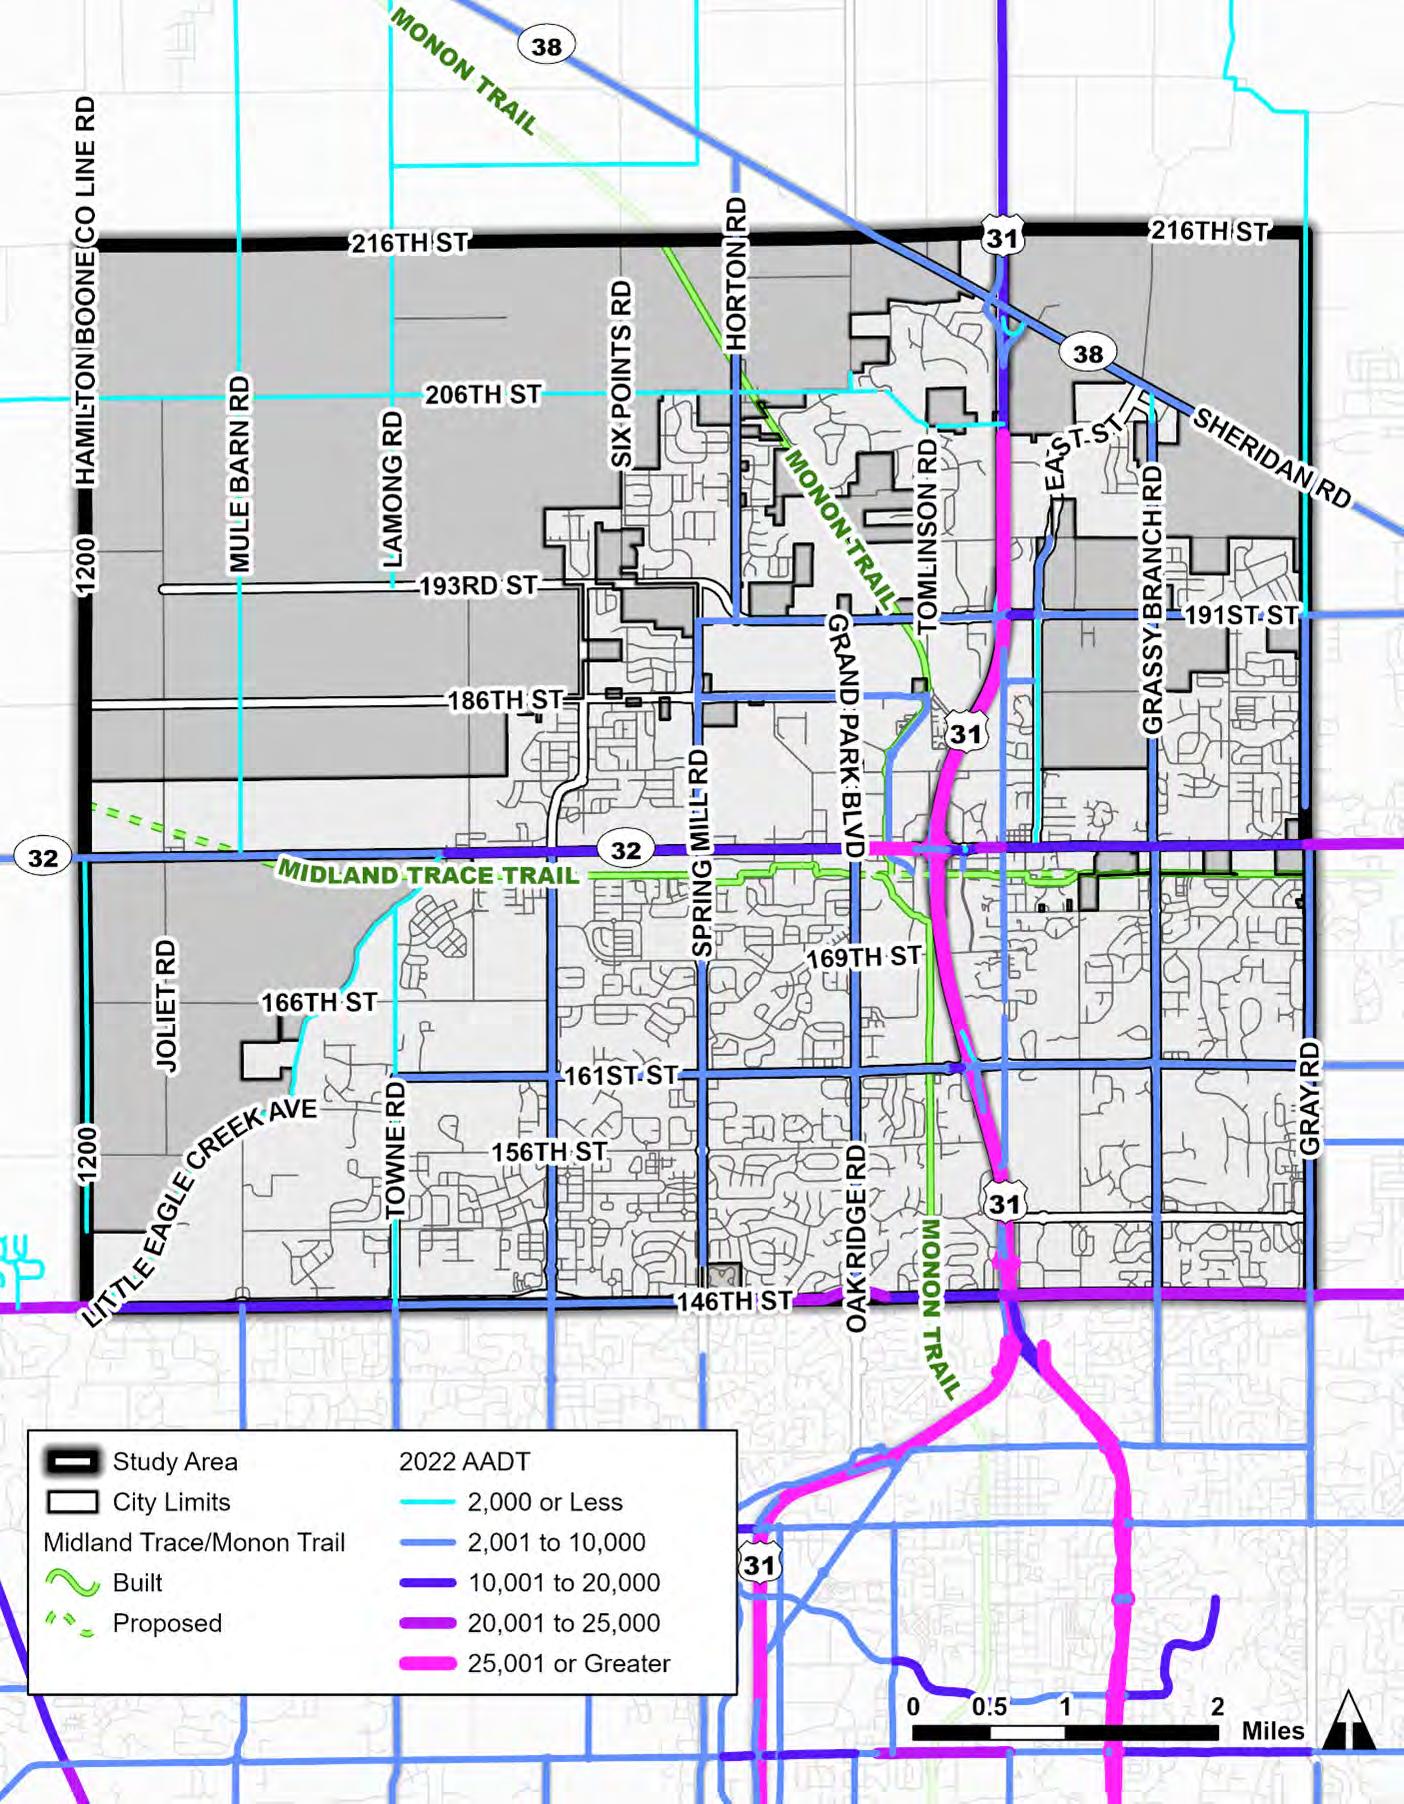
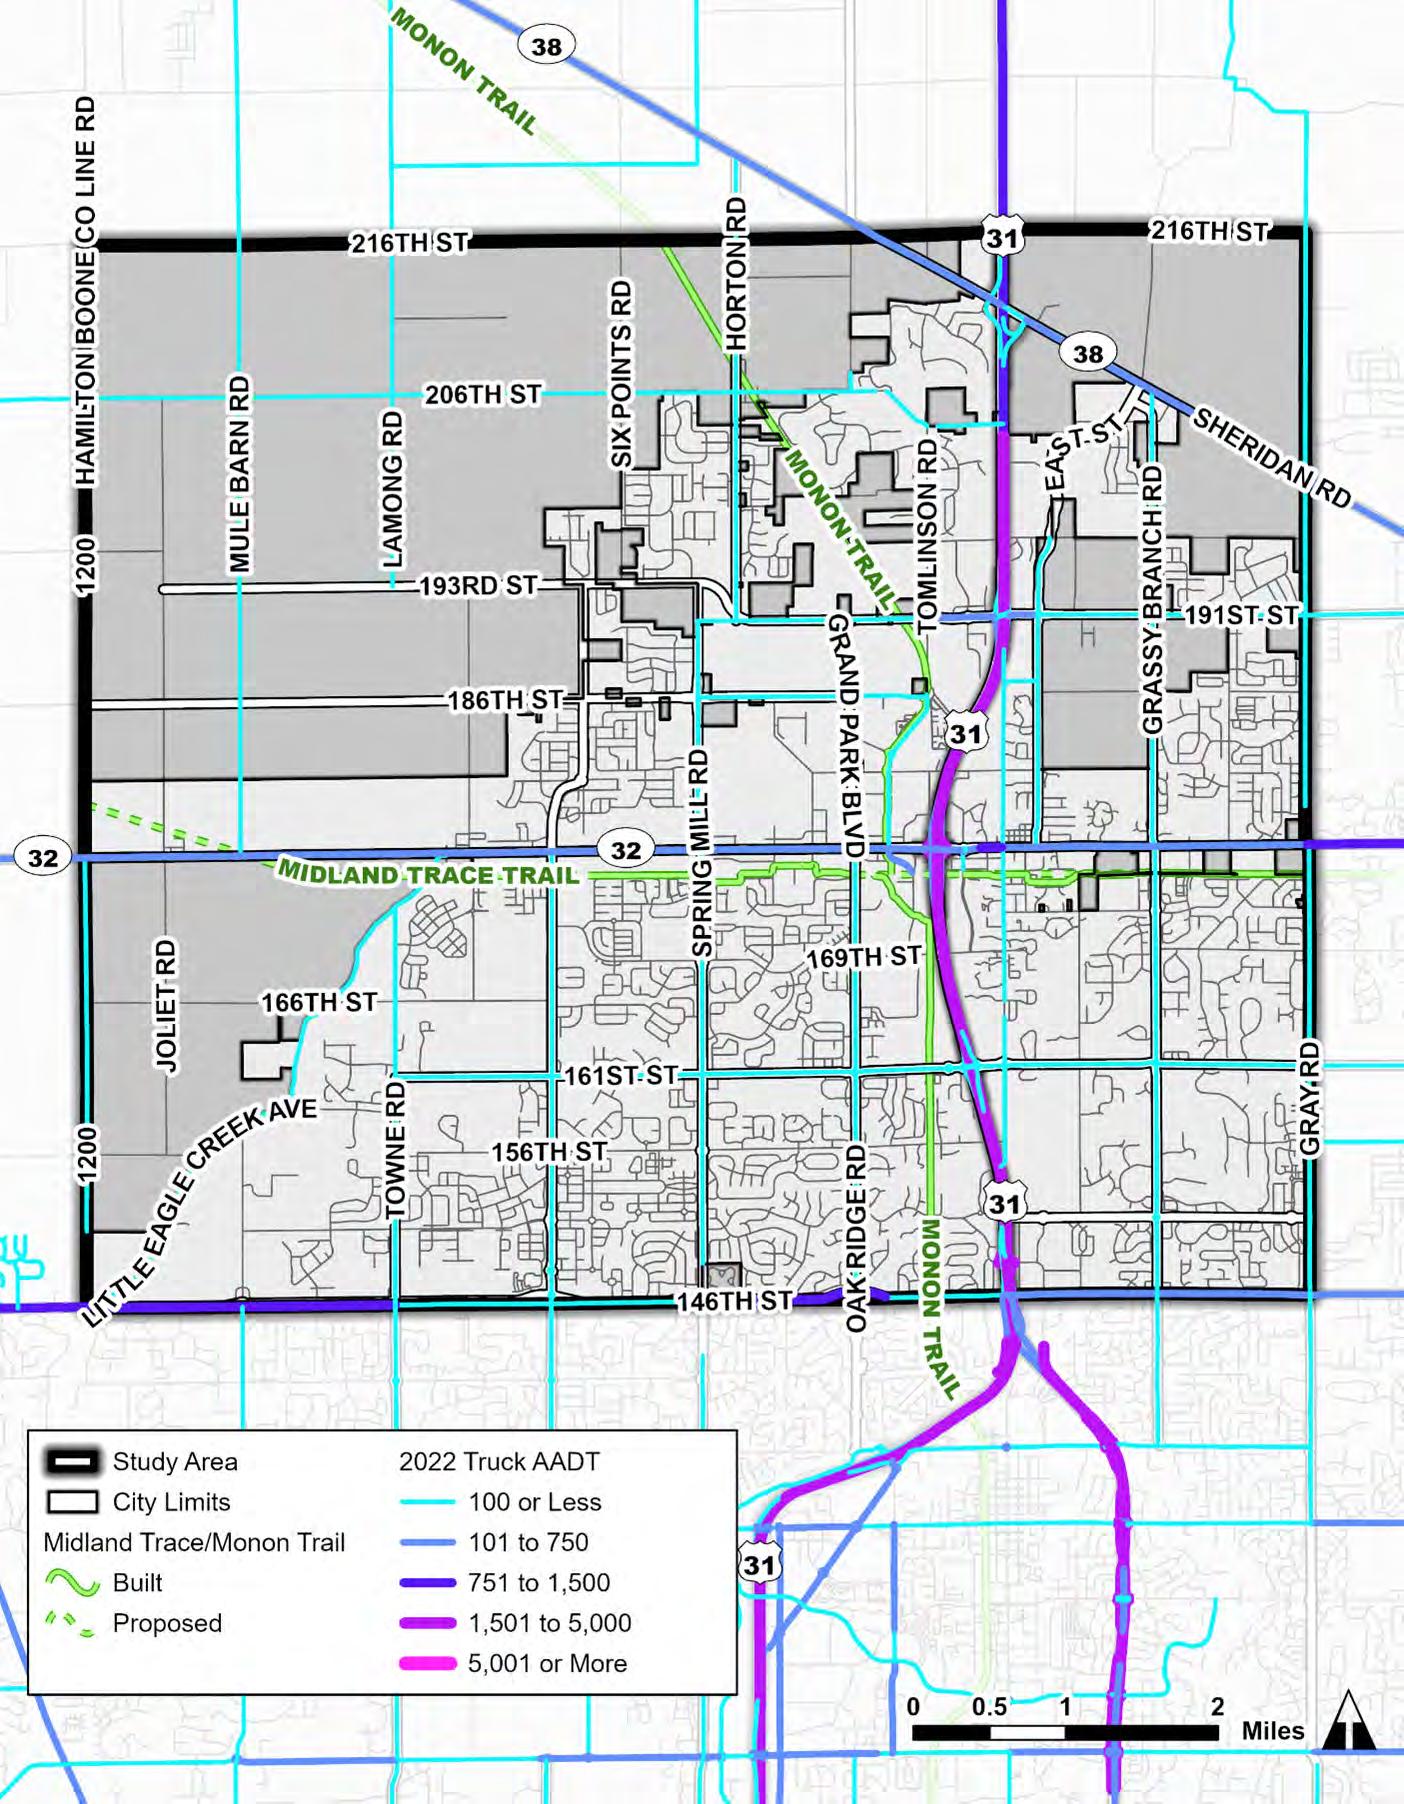
The operations, or success, of a roadway network to operate at free flow speed is measured in terms of Level of Service (LOS). LOS measures the delay experienced by motorists at intersections. LOS is quantified by six Levels of Service (LOS), which range from LOS A (“Free Flow”) to LOS F (“Fully Saturated”). LOS C is normally used for design purposes and represents a roadway with volumes ranging from 70% to 80% of its capacity. LOS D is generally considered acceptable for peak period conditions in urban and suburban areas and would be an appropriate benchmark of acceptable traffic for the study area road system.
In place of intersection LOS, which is beyond the scope of this report, the Indianapolis Metropolitan Planning Organization (IMPO) provided the regional Travel Demand Model (TDM) data for Westfield. This data includes volume to capacity (V/C) ratios for roadway segments which is representative of congestion on a roadway and can be used to illustrate LOS along a roadway segment. Based on the V/C ratios, LOS ranges from level A (less than .3) down to LOS F (more than 1) as shown in the table that follows.
Level of Service, Control Delay Per Vehicle, and Volume to Capacity Ratio
The 2024 baseline year segment LOS for afternoon peak hour traffic in the northbound and eastbound directions is shown on the following page. The afternoon northbound and eastbound directions are shown to visualize afternoon rush hour, typically the worst hour of operation. All segments operate with LOS D or better. However, select segments at intersections operate at LOS E including State Road 32 at Gray Road, 146th Street at Gray Road, and 161st Street at US 31.
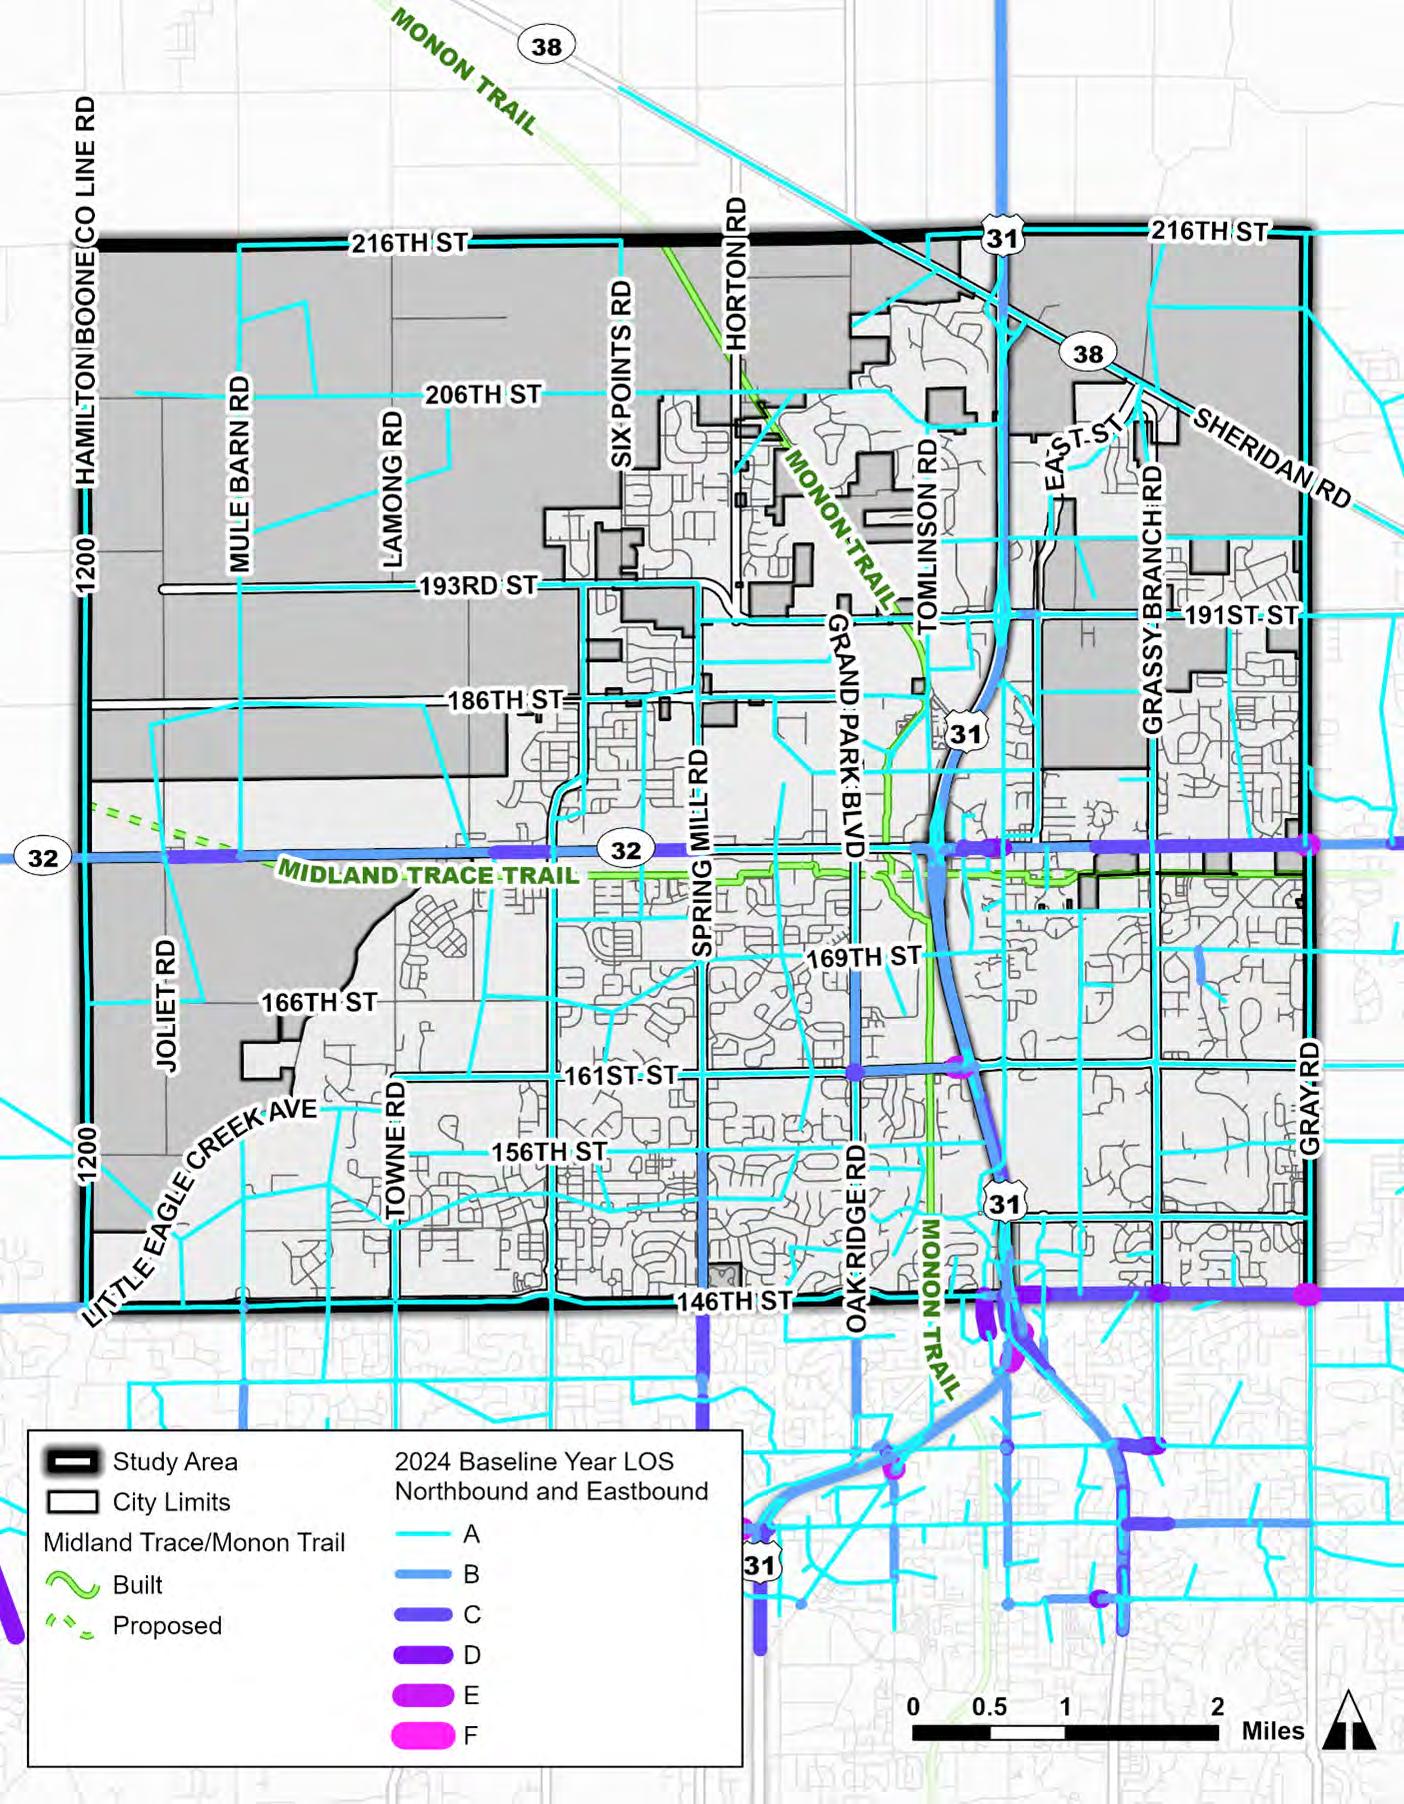
Westfield has constructed both single and multi-lane roundabouts, similar to nearby municipalities in the Indianapolis Metropolitan Area. Roundabouts have increasingly been utilized in the region as effective intersection treatments for both safety improvements and traffic operational improvements by various agencies. In addition to roundabouts already in operation, there are three roundabouts either in the construction or design phases. These future roundabouts are located at 151st Street and Towne Road, 161st Street and Springmill Road, and 181st Road and Wheeler Road.
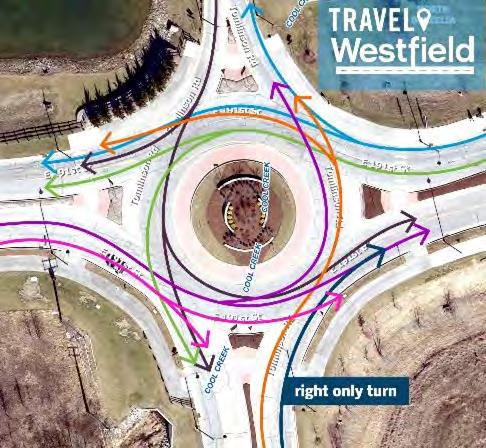
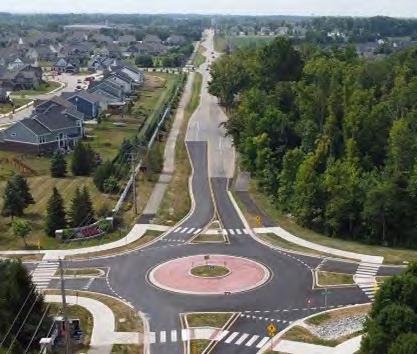
Crash data was provided by INDOT for 2019 through 2023. The data provided includes only fatal and incapacitating injury crashes. The crash analysis uses only crashes that occurred within the city limits of Westfield.
Fatal and serious injury crashes, or “incapacitating injury” crashes in the case of Indiana, are often categorized together and referred to as killed or serious injury (KSI) crashes. This section examines only fatal injury crashes and incapacity injury crashes, as defined by INDOT. INDOT crash severity ratings are listed and defined as:
• Fatal: Any injury that results in death within a 30-day period after the crash occurred.
• Incapacitating Injury: A non-fatal injury that prevents the injured person from walking, driving or normally continuing the activities the person could perform before the injury occurred. Hospitalization is usually required.
KSI crashes are mapped on the next page.
1. Severe lacerations
2. Broken limbs
3. Skull fracture 4. Crushed chest 5. Internal injuries, etc.
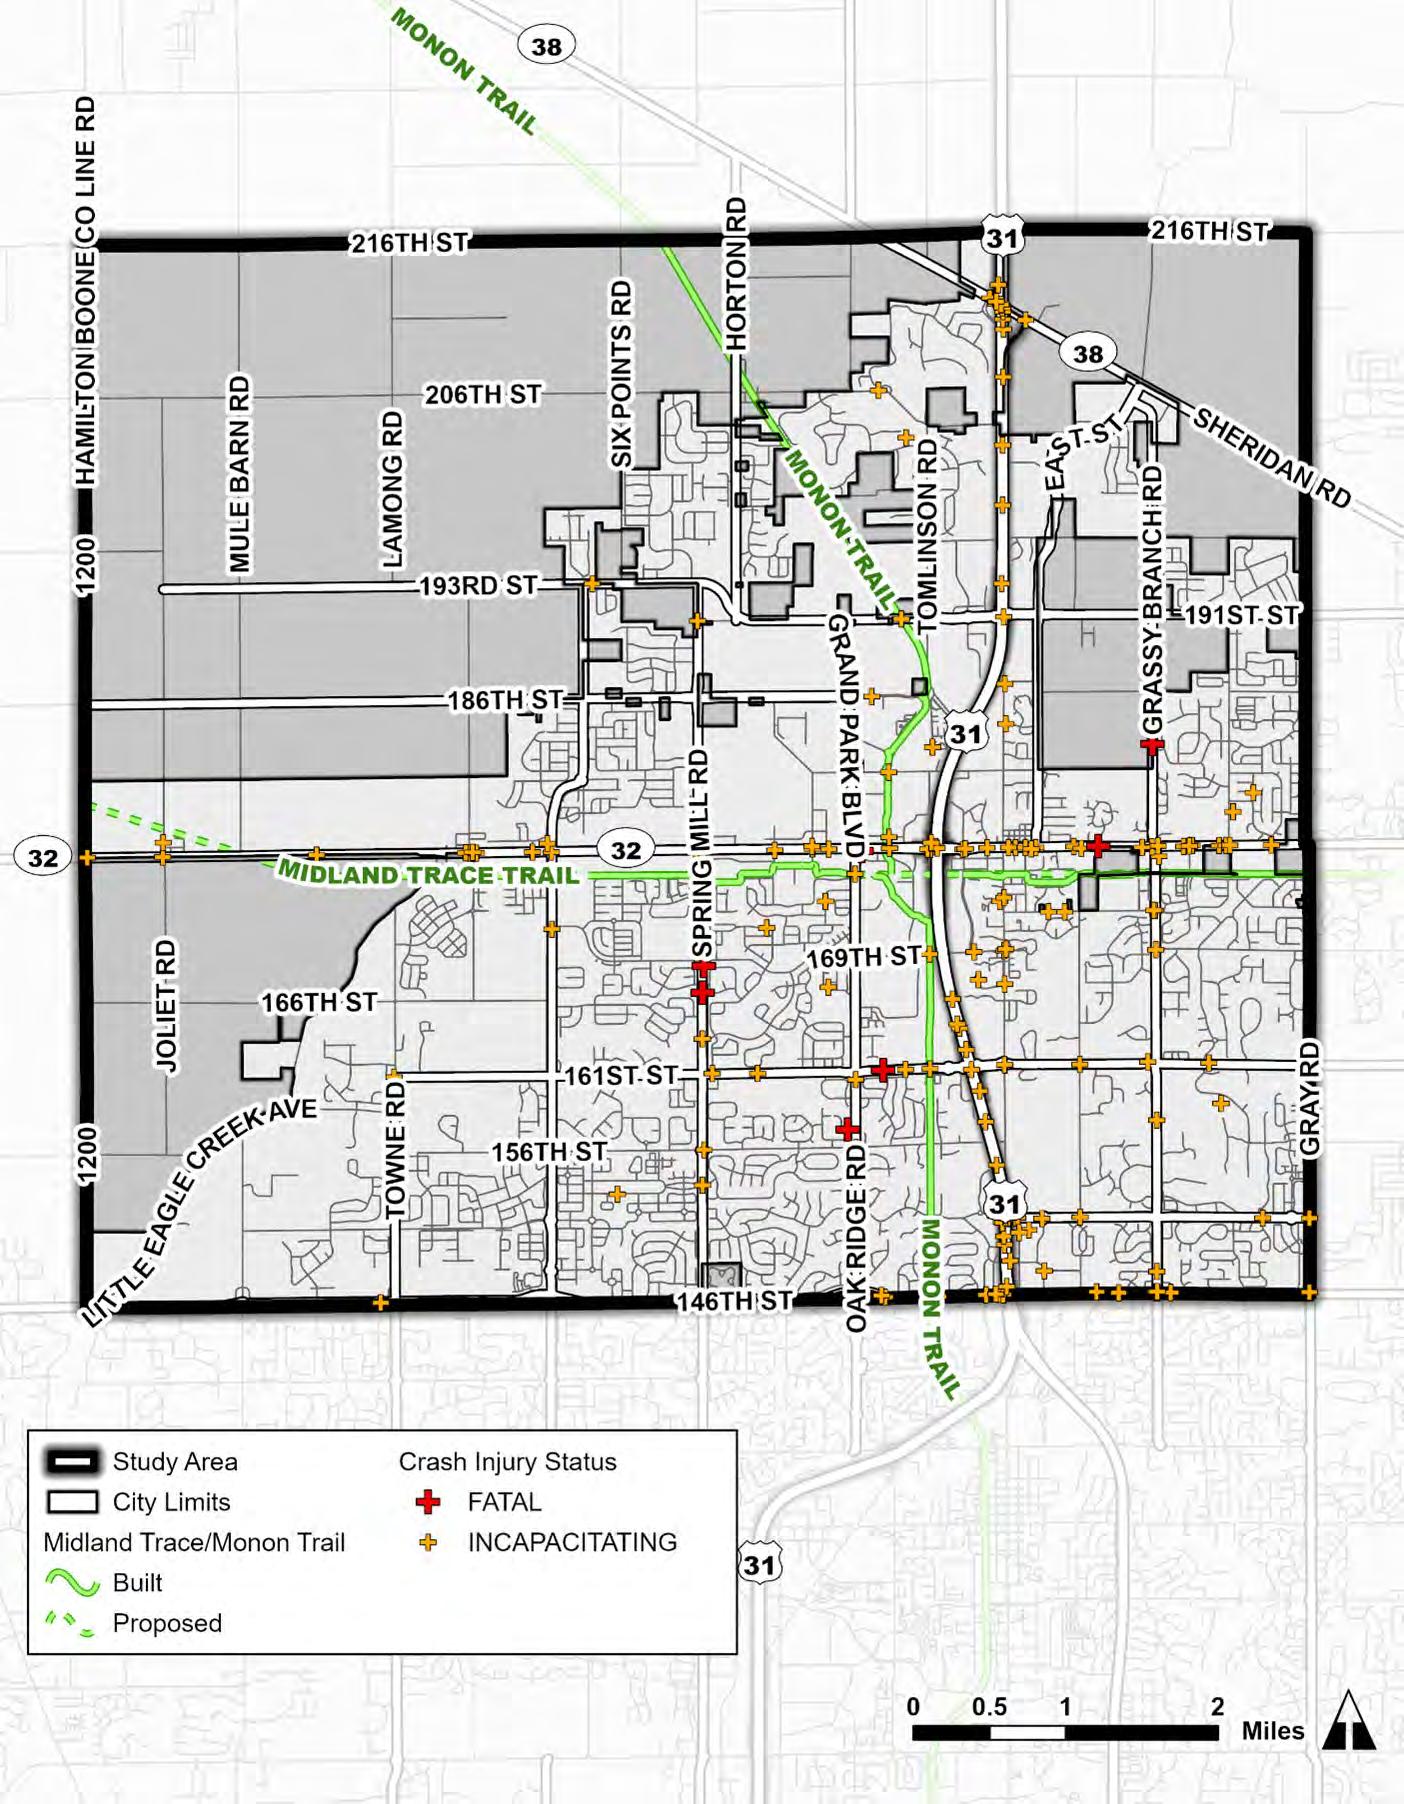
There were 204 fatal and incapacitating injury crashes in the City of Westfield from 2019 through 2023, averaging 41 crashes per year. The table below shows the severity of all crashes by year. The total number of fatal and incapacitating crashes reached a low in 2020 after peaking in 2019. It should be noted that no fatal crashes occurred in 2020, 2021, or 2022.
The manner of collision for KSI crashes are shown in the table to the right. The top three collision types were ran-off-road crashes, rear-end crashes, and right-angle crashes, and account for over 60 percent of KSI crashes.
The next three most common collision types – other crashes, head-on crashes, and left-turn crashes – make up over 26 percent of KSI crashes.
The table below contains all KSI crashes by crash type and crash severity. Bicycle and pedestrian crashes are 9.8 percent of all KSI crashes but constitute 28.6 percent of fatal crashes.
The manner of collision for KSI crashes are shown in the table to the right. The top three collision types were ran-off-road crashes, rear-end crashes, and right-angle crashes, and account for over 60 percent of KSI crashes.
The next three most common collision types – other crashes, head-on crashes, and left-turn crashes – make up over 26 percent of KSI crashes.
The map displays the location of bicycle and pedestrian KSI crashes that occurred in Westfield between 2019 and 2023. In the five-year crash analysis period, there were five bicycle crashes and 15 pedestrian crashes. Notably, four of the five bicycle crashes took place along the Monon Trial. The pedestrian crashes are scattered across the city, but are more prevalent near major roads, the Monon Trail, and Midland Trace Trail. These trends can be explained by the increased number of pedestrians and bicyclists utilizing the trail facilities.
Bicycle and Pedestrian Crashes, 2019-2023
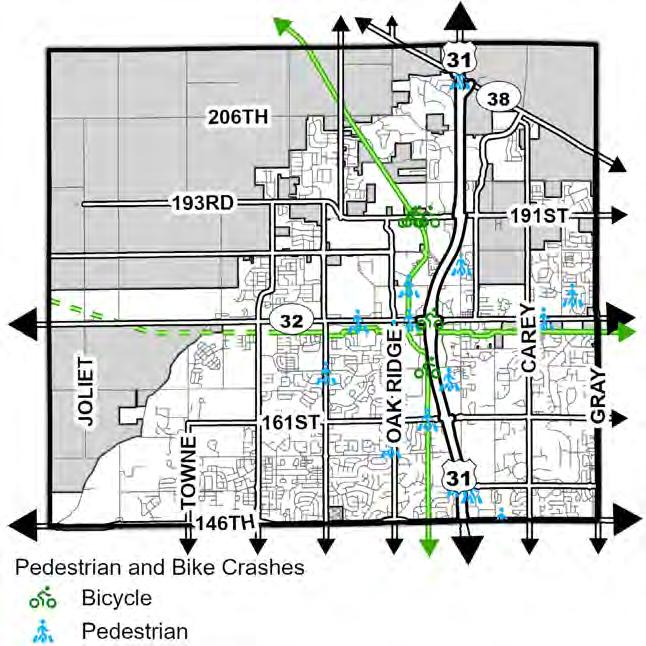
The City of Westfield does not operate a fixed-route public transit system. In place, Janus operates an affordable, on demand public transit system for Hamilton County. The Hamilton County Express is a demand-response, origin-to-destination service available to all members of the public in Hamilton County. Riders call in advance to schedule a ride. Vehicles are handicapped-accessible with wheelchair lifts. Service is available from 6 a.m. to 6 p.m. Monday through Friday, Saturdays 7 a.m. to 3 p.m. It is unavailable on Sundays and major Holidays.
Sidewalks, trails, and on-street bikeways (e.g. bicycle lanes and signed bicycle routes) are integral components of the transportation network. These facilities are necessary to create a robust multimodal transportation system. Existing pedestrian and bicycle facilities are summarized below.
The pedestrian network includes upwards of 278 miles of public and private sidewalk per spatial data provided by the City of Westfield Public Works Department. Approximately 242 miles of sidewalk is owned by the City of Westfield. The location and ownership of sidewalks in Westfield are shown below. Note that not all sidewalks in the city are included in the spatial data provided.
Source: janus-inc.org/hamilton-county-express
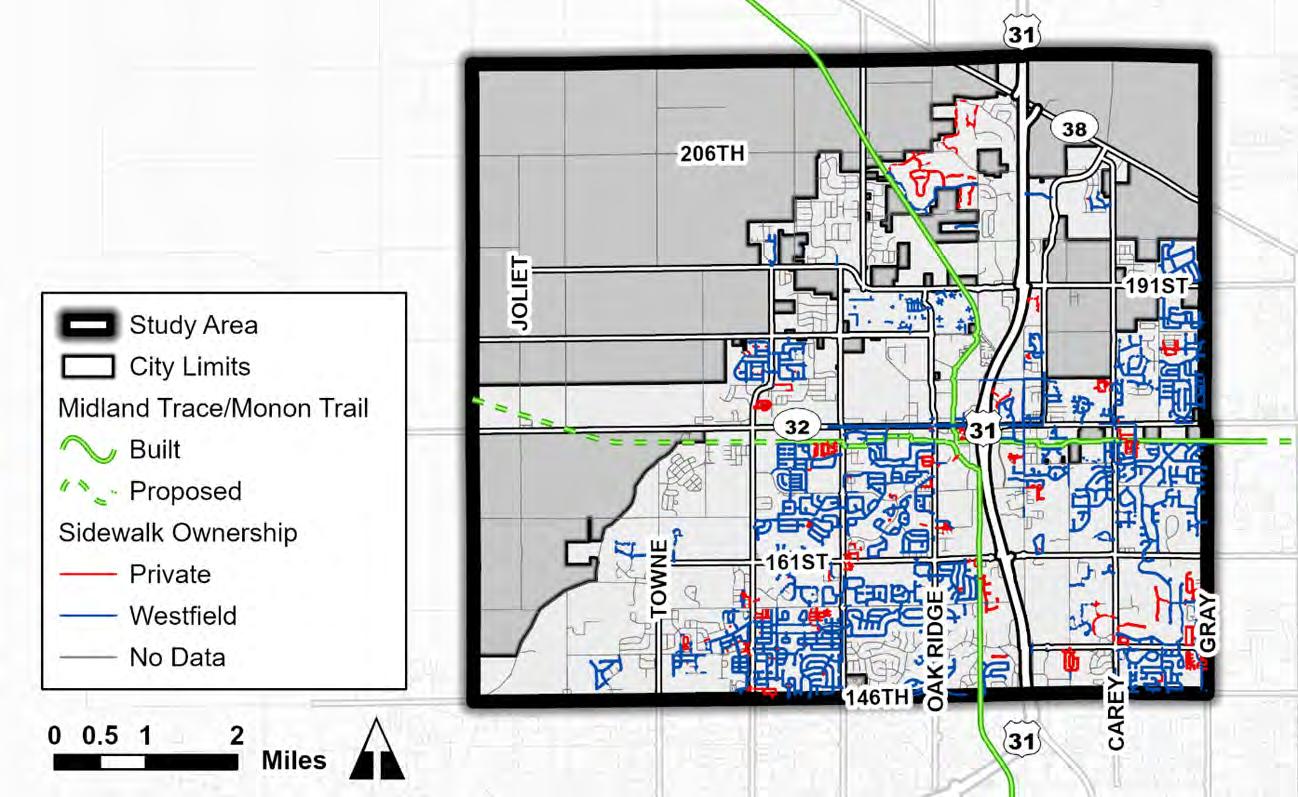
Most bike facilities in Westfield are separated shared use paths and trails with limited on-street facilities. On-street bike lanes do exist on 186th Street from Kinsey Road to Tomilson Road, however the facilities are unprotected, and markings are faded. Unprotected bike lanes are marked on John Dippel Boulevard from Grand Park Boulevard to the roundabout at Wheeler Road where the bike lanes end and share-the-road markings begin. Share-the-road pavement markings are marked on Wheeler Road from the roundabout at John Dippel Boulevard to 181st Street. These onstreet facilities are made redundant by the existing trails and trails under construction.
The trail system in Westfield includes over 80 miles of trails owned by the City of Westfield. Notably, the Westfield portion of the Monon Trail runs north-south through the center of the city, connecting Westfield to downtown Indianapolis. The Midland Trace Trail runs east-west through the city, providing access to Noblesville. Existing trails owned by the City of Westfield are shown below.
Trails Map
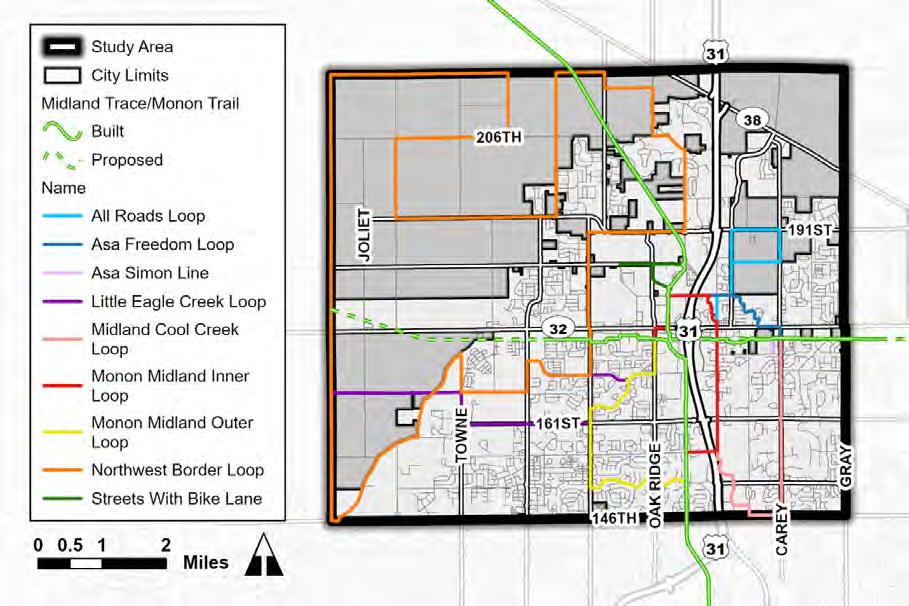
The City of Westfield does not have a municipal airport. Air travel for the public is supported by the Indianapolis International Airport located southwest of the city. Additionally, the Indianapolis Executive Airport is located west of the city and provides charter services and private hangar facilities.
The City of Westfield adopted the most recent zoning ordinance, the “Westfield-Washington Township Unified Development Ordinance” (UDO), in August 2023. Pertinent specifications for transportation in the UDO include block length and connectivity requirements.
• The maximum length of a block in a single-family residential Subdivision shall not exceed one thousand two hundred and fifty (1,250) feet; except where an Internal Street or Frontage Road parallels an Expressway or Arterial.
• Streets should align and connect with existing or planned streets and provide connections with adjacent property. Proposed streets, where appropriate, shall be extended to the boundary line of the tract to be developed to provide for normal circulation of traffic within the vicinity.
In addition to the above, the UDO discourages cul-de-sacs, permits only temporary dead-end streets for future connections, and includes provisions for pedestrian connections between cul-de-sacs for likely pedestrian destinations. The UDO requires that sidewalks and pedestrian paths and trails for new developments be constructed in accordance with the Thoroughfare Plan.
The Westfield Thoroughfare Plan was adopted in 2007. The most recent amendment to the Thoroughfare Plan was made in 2013. The amendment designated proposed cycle corridor routes within the Thoroughfare Plan, which are shown on the map below. The Monon Trail is also a designed cycle corridor route.
The cycle corridor routes are intended to facilitate designated travel facilities for cyclists and are a part of the city’s efforts to implement the adopted complete streets policy.
Cycle Corridor Routes Identified in the Thoroughfare Plan Amendment, 2013
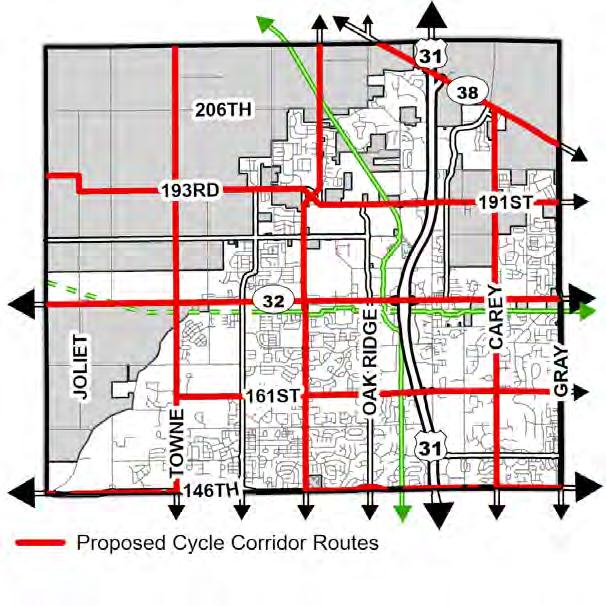
The Downtown Westfield Plan, “A Vision for Downtown” was completed in November 2022 by the Downtown Westfield Association. It envisions what downtown Westfield could be by outlining what responsible growth looks like, while improving walkability and properly planning for current and future traffic congestion. Potential improvements include various new connections including possible extensions on Shamrock Boulevard, Hoover Street, Westfield Boulevard, North Street, Penn Street, Maple Street, 171st Street, Jersey Street, Walnut Street, Oak Road, and Jersey Street.
The downtown redevelopment plan is a vision for the growth of downtown Westfield over the next two decades. It establishes a vision that downtown will…
• Be a walkable community that connects memorable places
• Capitalize on the green investments and amenities
• Shift the center of development to create identity, places, and experiences.
The plan creates core opportunities from challenges that include a walkable community, attachment to place, a unique downtown identity, capitalizing on the green investment, connecting ‘here’ to ‘there,’ and shifting the center of development. It addresses walkability, in part, though a downtown loop of linked multi-use trails that act as a bicycle and pedestrian ring road around downtown. Development plan areas include the downtown core, Main Street, residential/general infill, Creekside residential, and the legacy and historic core. The plan proposes catalyst projects of the Carnegie Plaza block, the bank block, parking garage integration, and public space enhancements. It establishes design guidelines for downtown development.
Planned and future projects in Westfield are included in the table below. Projects listed were provided by the City of Westfield. The capital projects list includes a total of 39 projects with an estimated total cost of $222M. These projects are categorized into various types: 10 road reconstructions, 2 road extensions, 1 drainage improvement, 2 road improvements, 2 intersection improvements, 6 widening projects, 6 trail projects, 1 bridge reconstruction, and 9 roundabouts. Funding sources for these projects include RIF, INDOT, ARPA, 2022 GO Bond, IMPO, 2024 Budget, and other contributions from developers and local government agencies.
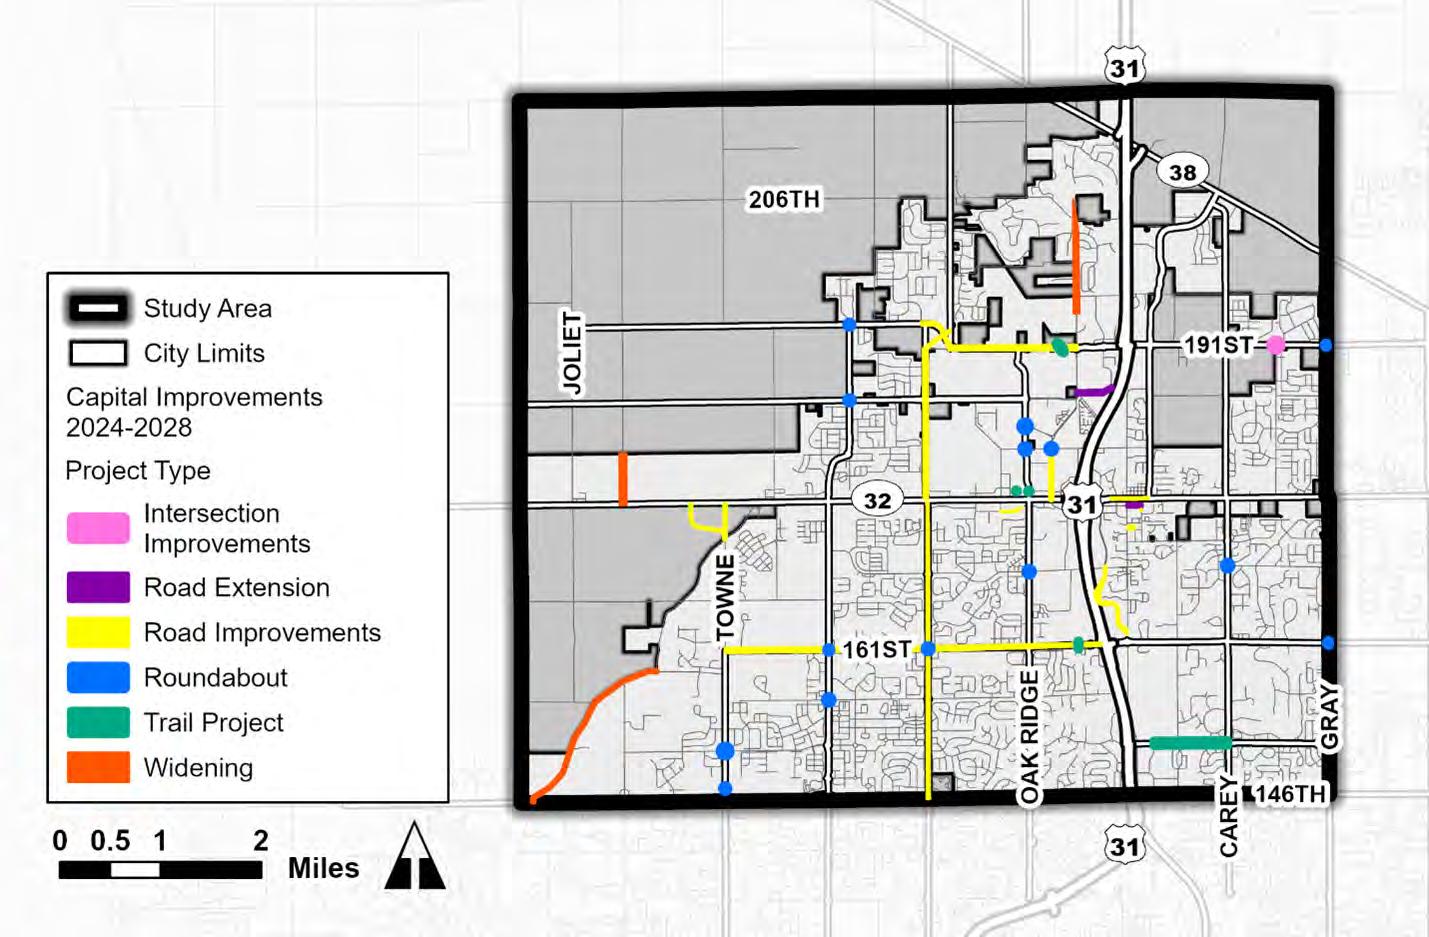
February 10, 2025, March 3, 2025, May 9, 2025, June 5, 2025 and August 22, 2025
Westfield City Services Building
April 17, 2025
Grand Park Events Center
The steering committee was made up of twelve members of the public representing various community groups and interests. Participants completed activities and engaged in guided discussions similar to those completed by the joint focus groups and elected and appointed officials regarding vision and values, placetypes, and areas of concern. The steering committee was also responsible for being a general voice of the public of Westfield and guiding where attention should be focused within the comprehensive plan.
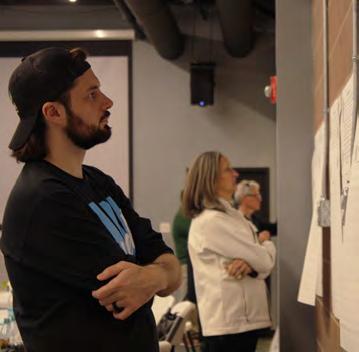
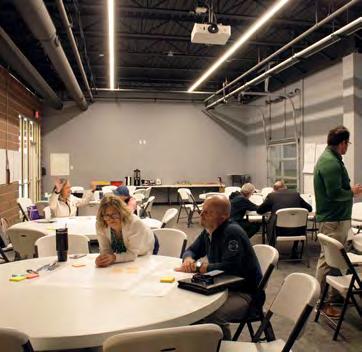
March 31, 2025, April 21, 2025, August 18, 2025
Westfield City Services Building
Several elected and appointed officials completed activities and engaged in guided discussions similar to those completed by the steering committee and joint focus groups regarding vision and values, placetypes, and areas of concern.
December 19, 2024, January 22, 2025, March 10, 2025, March 15, 2025, May 8, 2025, May 22, 2025, June 12, 2025, and July 9, 2025
Westfield City Services Building
Staff members from various departments engaged in discussions with consultant staff on the planning process, action steps, placetype definitions and locations, vision and value statements, areas of focus, and policy recommendations.
January 27, 2025 and July 28, 2025
Westfield City Services Building
Members of the council reviewed and provided insight on common discussion points brought up by the public during the planning process. Their insight also advised what concerns were addressable and which were unfortunately not within the scope of the comprehensive plan.
February 20, 2025, February 25, 2025, February 26, 2025, February 27, 2025, March 21, 2025, March 25, 2025, and April 22, 2025
Westfield City Services Building and Grand Park Event Center
Group Topics:
• Utilities – 14 attendees
• Investors 1 (Local) – 23 attendees
• Investors 2 (Regional) – 17 attendees
• City Staff – 14 attendees
• Business Services – 10 attendees
• Business Employers – 24 attendees
• Community Organizations – 11 attendees
• Residents – 10 attendees
Focus groups members were chosen based on affiliation to various private and community organizations and businesses. Discussions were based around the existing strengths of Westfield and future areas of opportunity that would be beneficial to each of the specific groups.
April 24, 2025 and August 21, 2025 at Westfield Washington Public Library, and July 9, 2025
Oak Trace Elementary School
There were three joint focus groups held over the course of the planning process. Participants completed activities and engaged in guided discussions similar to those completed by the steering committee and elected and appointed officials regarding vision and values, placetypes, and areas of concern.
February 8, 2025 and March 22, 2025
West Fork Whiskey Co.
June 26, 2025
Grand Junction Plaza
The Westfield Farmers Market is held year-round at both indoor and outdoor locations. The consultant attended three, two indoor winter markets, and one outdoor summer market. Abbreviated versions of open house activities and information were displayed for the public. Residents shared a vision for Westfield centered on family-friendly growth, unique local dining, environmental sustainability, and diverse housing options.
April 14, 2025 – April 17, 2025
Grand Park Event Center and Westfield Washington Public Library
The consultant team was in residence at the Grand Park Event Center in Westfield and held several meetings including focus groups, a steering committee, a staff workshop, and two open houses.
April 14, 2025 and April 17, 2025
Westfield Washington Public Library
Open house style boards asked questions about what values Westfield represents currently and what it should represent in the future, favorite locations, areas needing attention and other community issues such as housing preferences and transportation feedback. Residents went through self-guided exercises and gave feedback on the discoveries of the REA team and city staff as well as direction toward important community issues, such as school sizes.
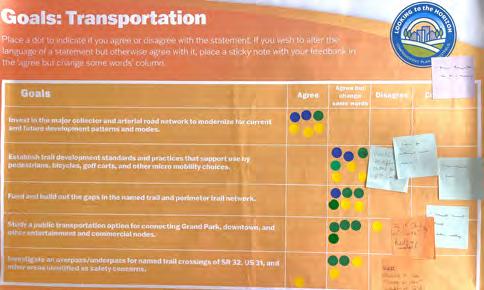
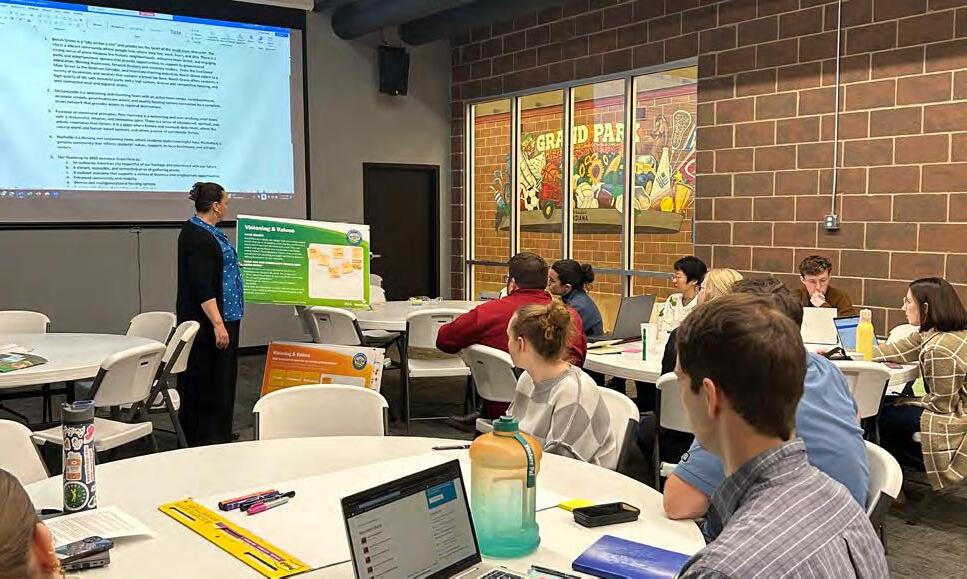
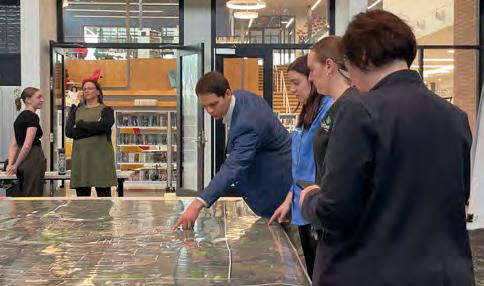
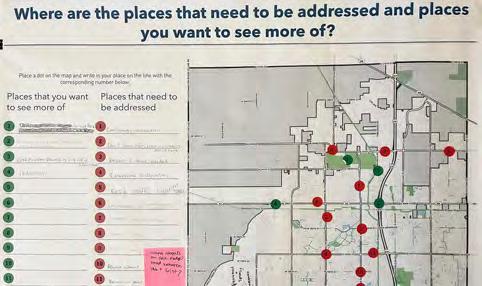
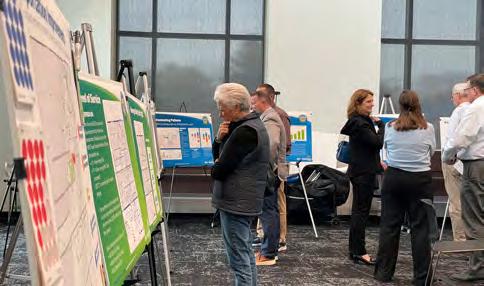
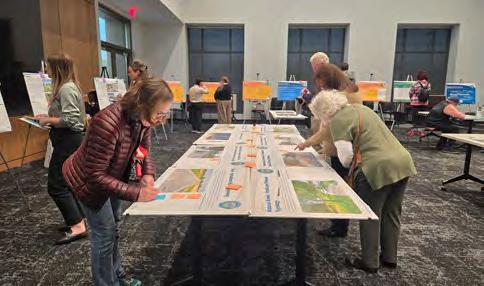
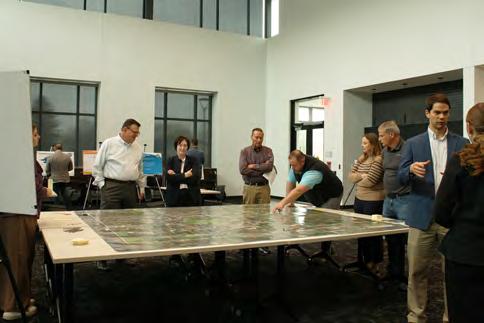
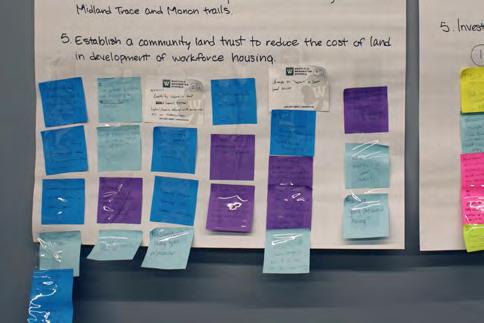
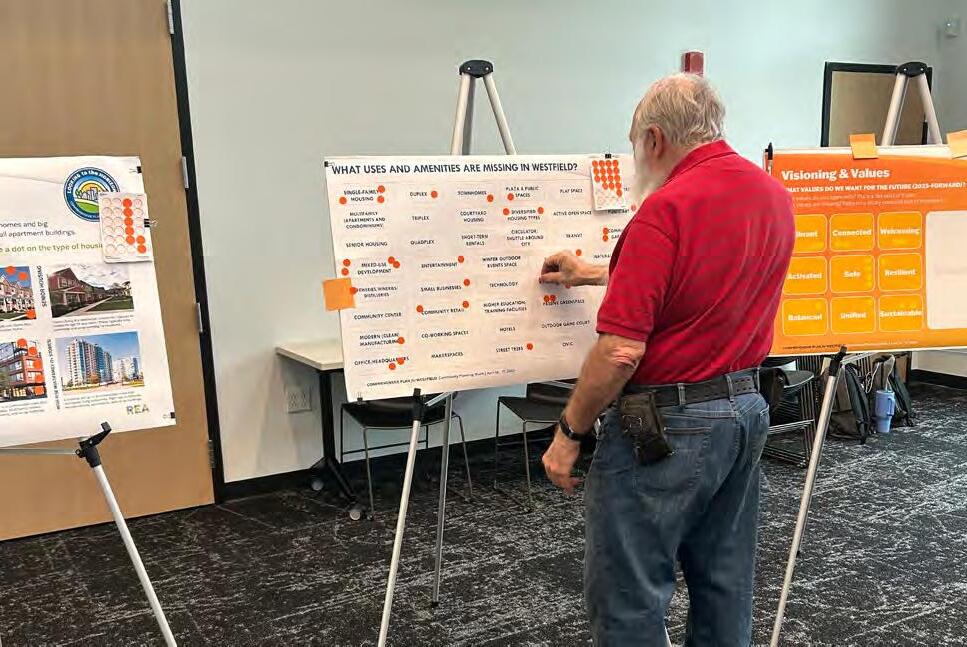
High School Workshop
May 5, 2025
Westfield High School
Young people were able to engage in the planning process through a high school workshop that posed questions specific to the present and future of the youth of Westfield. Engineering students took part in discussions about the planning process and envisioned their futures as Westfield residents.
September 9, 2025
Westfield Washington Public Library
Residents reviewed placetype descriptions and locations and provided feedback on focus area action steps and goals.
September 9, 2025
The Hampton Inn, Westfield
Once a month the Westfield Young Professionals Council meets to discuss various topics. In September 2025 the meeting was hosted by REA and a presentation on the ongoing comprehensive plan process and outcomes. A Q&A was held following the presentation.
March 18, 2025 and April 23, 2025
Planners from the consulting team and the City of Westfield were available to ask questions and have discussions with on topics related to the comprehensive plan and planning process.
April 2025 and September 2025
Available from the Westfield City Services Building
Meeting In a Box was a way to give groups access to similar information to a joint focus group or open house on a more flexible schedule. Boxes could be checked out from the City Services Building and done with youth groups, sports teams, or neighborhood organizations. Responses were then returned with the box to aid in informing the comprehensive plan.
April 2025 – May 2025 westfieldhorizon.com
The contents of public meetings (boards, exercises, etc.) were uploaded to the plan website shortly after each event. Over 200 responses were collected from the plan website providing insight for the comprehensive plan.
A transportation and land use survey and a renter survey were both available online and publicized through various channels to foster engagement.
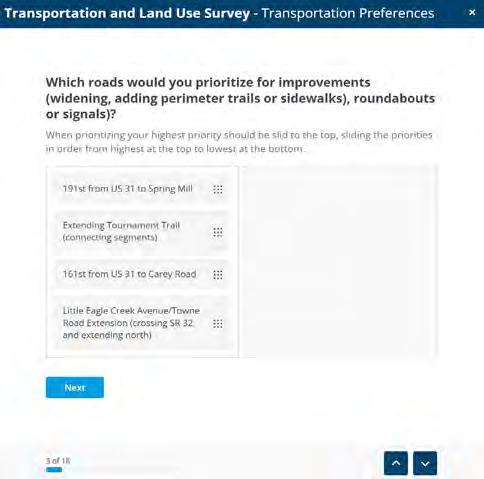
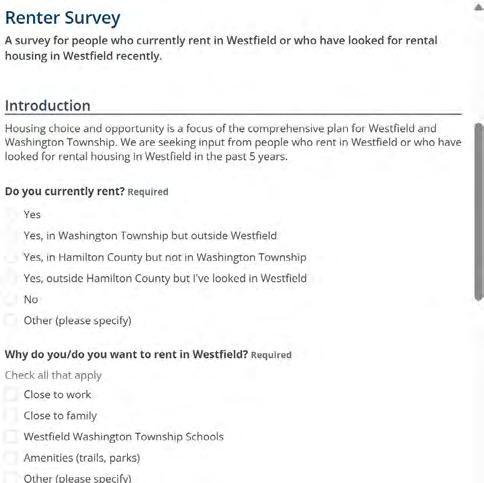
Accessibility: Refers to the ease with which people can reach desired goods, services, activities, and destinations. It also refers to how easily and safely individuals can access essential resources such as public transportation, housing, healthcare, education, and employment opportunities.
Accessory Dwelling Units (ADUs): ADUs are secondary housing units located on the same lot as a primary residence. These units can take the form of separate structures, converted garages, or apartments within the main house. They are typically smaller than the primary residence and are designed to provide additional housing options without significantly altering the character of a neighborhood.
Adaptive Reuse: Refers to the repurposing of existing structures for new uses.
Affordable/Attainable Housing: Refers to housing that is reasonably priced, allowing low- and moderate- income households to live without spending an excessive portion of their income on rent or mortgage payments. Housing is generally considered affordable when a household spends no more than 30% of its income on housing costs.
Agribusiness: Refers to businesses associated with the production, processing, and distribution of agricultural products.
Agri-tourism: Refers to tourism that connects agriculture and travel by inviting visitors to experience life on a working farm or in a rural area.
Chicane: Refers to tight curves or bends in a road, designed to slow down traffic to improve safety.
Covenants: Refers to a legally binding agreement that restricts or mandates specific land uses to manage development and uphold community standards. Covenants typically define permissible activities, preserve environmental quality, and ensure compliance with zoning laws. They often run with the land, meaning they automatically transfer to subsequent owners, ensuring the rules remain in effect regardless of who owns the land.
Crossing Island: Refers to a designated area that helps protect pedestrians who are crossing a road, often referred to as a pedestrian refuge island. They are typically placed in areas with high traffic volumes or where pedestrians may feel exposed at intersections.
Curb Extension: A curb extension is a traffic calming measure which widens the sidewalk, typically into a parking lane, for a short distance. This design element is intended to narrow the roadway, which can enhance pedestrian safety by reducing crossing distances.
Daily Living Uses: Commercial and institutional establishments that provide essential goods and services for everyday residential needs. These are typically small to medium-scale businesses and facilities that serve the local community and support routine daily activities. Examples include grocery stores and markets, gas stations and convenience stores, schools, libraries, coffee shops, and cafes, hair salons, pharmacies, banks, post office, restaurants and eateries, medical and dental offices and personal care services.
Form-Based: Form-Based Code is a land use regulation framework that focuses on the physical form and design of buildings and public spaces rather than solely on their specific uses. Unlike traditional zoning codes that separate land uses into distinct categories (e.g., residential, commercial), form-based codes emphasize the aesthetics and layout of development to achieve desired urban patterns and enhance the public realm.
Geographic Information Systems (GIS): GIS is a computer system that captures, stores, analyzes, and displays geographic information. It integrates various data related to positions on Earth’s surface, allowing users to visualize and understand special patterns and relationships.
Land Trust: Refers to nonprofit organizations that acquire and manage land for conservation, preservation, or community benefit. The primary purpose of a land trust is to protect land from development and ensure it is used in ways that align with public or environmental goals, such as preserving open spaces, natural spaces, natural habitats, agricultural land, or providing affordable housing.
Makerspaces: A makerspace is a collaborative workspace where individuals may gather to create, invent, and use a variety of shared materials and tools. Makerspaces are valuable places for STEM and art-based activities, education, and youth engagement.
Micro-Mobility: Refers to small, lightweight transportation options typically used for short trips, often within urban areas. These vehicles include electric scooters, bicycles (both traditional and electric), skateboards, and other compact, human-powered or electric modes of transport.
Missing Middle Housing: Refers to a range of multi-unit or clustered housing types that are compatible in scale with detached single-family homes, addressing the growing demand for walkable urban living. It includes diverse options such as duplexes, triplexes, quadplexes, and bungalows, which provide affordable housing alternatives.
Mixed Use: Refers to the integration of residential, commercial, cultural, and sometimes industrial spaces within a single development or neighborhood.
Multi-Modal: Refers to the integration of and use of multiple forms of transportation within a system to move people and goods efficiently. This includes a combination of transportation modes such as walking, biking, public transit, cars, and freight systems.
Node: Refers to a centralized hub of activity.
Planned Unit Development (PUD): A PUD is a type of zoning and landuse regulation that allows for a comprehensive and flexible approach to community design. This allows for flexibility in terms of design and land use, allowing for innovative solutions and better adaptation to sitespecific conditions.
Riparian Corridor: Refers to the area adjacent to a river or stream.
Unified Development Ordinance (UDO): A UDO is a kind of land-use planning regulation that combines traditional zoning and subdivision regulations with other desired city regulations, such as design guidelines and water management, into a single document.
Wayfinding: Refers to how infrastructure is employed to assist drivers, bikers, and pedestrians as they navigate their environment. It may include signage, waypoints, print maps, lines and arrows, or digital wayfinding tools.
This page has been intentionally left blank.
FIGURE # IMAGE TITLE
Front Matter
SOURCE/ WEBSITE
ARTICLE TITLE
DATE/ ACCESSED
AUTHOR
URL
Figure 0.1 City of Westfield City Hall IBJ Changes Coming to Westfield, Carmel City Councils April 9, 2026 Daniel Bradley https://www.ibj.com/articles/changes-coming-towestfield-carmel-city-councils
Figure 0.2 191st Street Pedestrian Bridge City of Westfield
Executive Summary
Figure 0.3 Placetype Framework and Future Development Map. REA
Planning Foundation
Figure 1.1 Aerial View of Westfield. City of Westfield
Figure 1.2 Monon bridge over SR 32. City of Westfield
Figure 1.3 Narrow lot single-family residential development.
Vision and Values
Shutterstock Street of new affordable houses February 6, 2012 karamysh #94591600
Figure 2.1 Steering Committee Meeting. REA
Figure 2.2 Community Open House. REA
Figure 2.3 Meeting in a Box Material. REA
Themes and Goals
Figure 3.1 Office Park. REA
Figure 3.2 Housing Construction. City of Westfield
Figure 3.3 Community Festival. City of Westfield
Figure 3.4 Multi-Purpose Recreational Trail. City of Westfield
Figure 3.5 Citizens Water Tower. City of Westfield Placetypes
Figure 4.1 Map Illustrating Land Value Per Acre in Westfield-Washington Township. Urban 3
FIGURE # IMAGE TITLE
Figure 4.2 Examples of Higher Density Mixed Use Development Plaza and Buildings.
Figure 4.3 Examples of a Full Site of Higher Density Mixed Use Development.
Figure 4.4 Map Illustrating Assessed Value Per Acre along the Midland Trace Trail.
Figure 4.5 Map Illustrating Assessed Value Per Acre along the Monon Trail.
Figure 4.6 Assessed Value Per Acre Comparison of the Midland Trace Trail and the Monon Trail.
SOURCE/ WEBSITE ARTICLE TITLE DATE/ ACCESSED
Urban Land Institute
Urban Land Institute
Urban 3
Urban 3
Urban 3
Figure 4.7 Future Placetype Development Map. REA
Figure 4.8 Placetypes / Land Use Matrix. REA
Figure 4.9 Placetypes / Land Use Matrix Cont. REA
Figure 4.10 Mixed Use Development Example Urban Land Institute, NELSON
Figure 4.11 Townhome Development Example Urban Land Institute, Onyx+East
The Key Figures That Define Oklahoma City’s OAK Development
The Key Figures That Define Oklahoma City’s OAK Development
September 16, 2025
September 16, 2025
Ryan McNeill
Ryan McNeill
https://urbanland.uli.org/development-andconstruction/the-key-figures-that-define-oklahomacitys-oak-development
https://urbanland.uli.org/development-andconstruction/the-key-figures-that-define-oklahomacitys-oak-development
Figure 4.12 Community Garden Example. These Green Times, Chickahominy Falls
Figure 4.13 Agrihood / Agriculture / Agribusiness Recommended Land Uses REA
Figure 4.14 Farm Stand Within an Agrihood Placetype Open to the Community.
New York Times, Laura Segall
The Secret to Mixed Use Success? It’s Not the Buildings August 8, 2025
Mark Toro
Product Council Outlook for Residential Development: What lies ahead for the housing market? June 23, 2025 Ron Nyren
https://urbanland.uli.org/the-secret-to-mixed usesuccess-its-not-the-buildings
https://urbanland.uli.org/development-andconstruction/product-council-outlook-for-residentialdevelopment-what-lies-ahead-for-the-housing-market
Moving into the Agrihood March 19, 2024 Kirsten LieNielsen https://thesegreentimes.com/blog/moving-into-theagrihood/
Farm-to-Table Living Takes Root March 11, 2014 Kate Murphy http://www.nytimes.com/2014/03/12/dining/farm-totable-living-takes-root.html
FIGURE # IMAGE TITLE
Figure 4.15 Example of Community Garden in Agrihood Placetype.
Figure 4.16 Example Agrihood Neighborhood Development.
Figure 4.17 Example of Small Retail Center in Agrihood Placetype.
Figure 4.18 Example of Agrihood Development with Market and Gardens in the Forefront and Housing Off to the Sides.
SOURCE/ WEBSITE
Metro Development Group
ACCESSED
Angeline March 17, 2026
Plaid Zebra Agrihoods Combine Suburban Life with Rural Benefits
September 14, 2015
Indigo Community The Filling Station March 17, 2026
Freehold Capital Management
Figure 4.19 Agrihood / Agriculture / Agribusiness Placetype Characteristics. REA
Putting Down Roots: Agrihoods help you commune with nature and like-minded neighbors
July 27, 2022
Swikar Oli
https://metrodevelopmentgroup.com/communities/ angeline/
https://theplaidzebra.com/agrihoods-combinesuburban-life-with-rural-benefits/
https://www.indigocommunity.com/general-store-cafe
Sarah Sekula for USA Today
https://freeholdcm.com/putting-down-rootsagrihoods-help-you-commune-with-nature-and-likeminded-neighbors/
Figure 4.20 Estate Rural and Equestrian Home Example. Adobe Stock home with lawn and garden
Figure 4.21 Estate Rural and Equestrian Recommended Land Use. REA
Figure 4.22 Example of Homestead. Blue Heron Realty Co Virginia Eastern Shore & Farmettes For Sale March 18, 2026
Figure 4.23 Example of Residential Dwelling with Horse Farm. Zillow S49W34082 Moraine Hills Dr, Dousman, WI 53118 March 18, 2026
Figure 4.24 Estate Residential. farmbuy Six Of The Most Impressive Rural Properties For Sale VIC March 18, 2026
Figure 4.25 Agricultural Operations. Indiana Capital Chronicle, Randolph County, IN.gov
Bill to limit foreign “adversaries” from buying Indiana farmland advances in House January 30, 2024 Casey Smith
Figure 4.26 Commercial Horse Stables. King Barns Storybrook Farm March 18, 2026
Figure 4.27 Estate Rural and Equestrian Placetype Characteristics. REA
https://blueheronva.com/eastern-shore-homes-forsale/farms-farmettes/
https://www.zillow.com/homedetails/S49W34082Moraine-Hills-Dr-Dousman-WI-53118/119549722_ zpid/?msockid=343b77bc807c64482a536160814965b1
https://farmbuy.com/post/luxurious-rural-propertiesfor-sale-vic
https://indianacapitalchronicle.com/2024/01/30/ bill-to-limit-foreign-adversaries-from-buying-indianafarmland-advances-in-house/
https://www.kingbarns.com/projects/storybookfarm-2/
FIGURE # IMAGE TITLE SOURCE/ WEBSITE
Figure 4.28 Traditional Single-Family Dwelling Detached Example. REA
Figure 4.29 Traditional Residential Recommended Land Uses REA
Figure 4.30 Traditional Single-Family Dwelling Detached Example 1. REA
Figure 4.31 Traditional Single-Family Dwelling Detached Example 2.
Figure 4.32 Bungalow Court Example. Medium, Ross Chapin Architects
Figure 4.33 Traditional Single-Family Dwelling Detached Example 3. REA
Figure 4.34 Traditional Single-Family Dwelling Detached Example 4.
Cottage clusters: Portland’s chance to build community in a new way
November 2, 2017
Michael Andersen
https://medium.com/@pdx4all/cottage-clustersportlands-chance-to-build-community-in-a-new-way7c504c5b260b
Shutterstock Street of residential houses October 7, 2011 Konstantin L #86214664
Figure 4.35 Traditional Residential Placetype Characteristics. REA
Figure 4.36 Traditional Detached Single-Family Neighborhood Street Example.
Carolina Real Estate Forum Cresswind Charleston Celebrates 500th Closing March 18, 2026
Figure 4.37 Master Planned Residential Recommended Land Uses. REA
Figure 4.38 Neighborhood clubhouse and pool amenities are offered in Master Planned Placetypes.
Figure 4.39 Chatham Hills Master Planned Development with golf course and single unit dwelling access.
Coventry Homes
Harvest Green 75’ March 18, 2026
Chatham Hills Championship Course March 18, 2026
https://carolinarealestateforum.com/cresswindcharleston-celebrates-500th-closing-20197/
https://www.coventryhomes.com/new-homes/tx/ richmond/harvest-green-75/
https://www.chathamhills.com/golf/championshipcourse
FIGURE # IMAGE TITLE
Figure 4.40 Master planned developments offer a higher level of amenities. Shown here a single-unit detached dwelling with hanger for a plane and access to the airfield.
Figure 4.41 Bridgewater Clubhouse, Part of an Amenity for the Bridgewater Master Planned Development.
Figure 4.42 Example of Neighborhood Mixed Use Residential, Retail, Restaurant, and Plaza.
SOURCE/ WEBSITE
The Dallas Morning News, Bourland Field Estates
Sigma Builders
Architizer, Rutledge Maul Architects
Figure 4.43 Neighborhood Walkway and Pond. Cresswind Charleston Kolter Homes
Figure 4.44 Mixed Residential Neighborhood. Utah Business, Jeffrey D. Allred, Deseret News
Figure 4.45 Mixed Use Development. Charleston NewHomes Guide
Figure 4.46 Master Planned Residential Placetype Characteristics. REA
Figure 4.47 Traditional Single-Family Dwelling Detached Example. REA
Figure 4.48 Village Neighborhood Recommended Land Uses. REA
Figure 4.49 Example of Townhome Development. Midtown Carmel, Old Town Design Group
Figure 4.50 Neighborhood Retail Shops. Lasky & Kutsovsky
Figure 4.51 Traditional Single-Unit Dwelling Detached on Smaller Lot. REA
ACCESSED
See more of Bourland Field Estates: September 11, 2024
https://www.dallasnews.com/photos/2024/09/11/seemore-of-bourland-field-estates/
Carmel + Fishers, Indiana Top List of 250 Best Places to Live in the U.S.
March 18, 2026
Village center at Harbour Pointe March 18, 2026
Community Photo Gallery March 18, 2026
Why are masterplanned communities taking Utah by storm?
February 7, 2024 Caitlin Delohery
Summers Corner: The Village by Lennar - Neighborhood Photo Gallery March 18, 2026
https://sigmabuildersllc.com/blog/carmel-fishersindiana-top-list-of-250-best-places-to-live-in-the-u-s/
https://architizer.com/projects/village-center-atharbour-pointe/
https://www.kolterhomes.com/new-homes/charlestonsummerville-south-carolina-active-adult-cresswind-atthe-ponds/gallery/the-ponds/#gallery-19
https://www.utahbusiness.com/buildingdevelopment/2024/02/07/why-are-master-plannedcommunities-taking-utah-by-storm/
https://www.newhomesguidecharleston.com/ Neighborhoods/Lennar/Summers-Corner-The-Village/ slideshow-images
Luxury Living in Downtown Carmel March 18, 2026
Our Mission March 18, 2026
https://midtowncarmel.com/#next
https://www.laskykutsovsky.com/
FIGURE #
IMAGE TITLE
Figure 4.52 Example of Two-Story Walkable Mixed Use Development with Townhomes in the Distance.
Figure 4.53 Example of Walkable Single-Family Neighborhood with Greenspace in Front Yards.
SOURCE/ WEBSITE
ACCESSED
behn Gallery The Village of West Clay April 14, 2020 Roben Bellomo
https://www.behngallery.com/blog-post/the-village-ofwest-clay
KelownaNow Media, Kettle Valley Holdings
Figure 4.54 Village Neighborhood Placetype Characteristics. REA
Figure 4.55 Village Center Street Example The Neighborhood Hotel
Figure 4.56 Village Center Recommended Land Uses REA
Kelowna council seeking feedback on final stage of Kettle Valley neighborhood May 16, 2023 Cheyanna Lorraine
https://www.kelownanow.com/watercooler/news/ news/Kelowna/Kelowna_council_seeking_feedback_ on_final_stage_of_Kettle_Valley_neighbourhood
Best Dinner Options in New Buffalo, Michigan March 18, 2026
https://www.theneighborhoodhotel.com/our-top-picksfor-a-night-out-in-new-buffalo-michigan/
Figure 4.57 Example of Walkable, Mixed Use Small-Scale Neighborhood Retail Node. The Walker Collaborative Northport Riverfront & Downtown Plan March 18, 2026
Figure 4.58 One to Two Story Businesses on Main Street in Nashville, IN
https://walkercollaborative.com/northpointalwaterfronts/
Shutterstock Nashville, IndianaJuly 26, 2024: Street scene from historic downtown Nashville Indiana in Brown County with people visible. July 26, 2024 Little Vignettes Photo #2497189715
Figure 4.59 Small-Scale Cluster of Shops and Restaurants City of Westfield
Eagletown Case Studies March 12, 2026 Shelby Alexander
Figure 4.60 Small-Scale Village Retail. Small Town Washington 11 Perfect Things to Do in Pomeroy, Washington March 27, 2021 Lara Dunning https://smalltownwashington.com/things-to-do-inpomeroy-wa/
Figure 4.61 Example of Walkable Mixed Use Street.
Shutterstock Gainesville, Florida, USA downtown at twilight September 15, 2017
Figure 4.62 Example of Retail Node in Neighborhood. Studio CPG Tennyson Street Improvement March 18, 2026
Figure 4.63 Example of Walkable Mixed Use Node. City of Westfield
Figure 4.64 Village Restaurants With Outside Dining City of Westfield
Sean Pavone #716208895
Hortonville Case Studies March 12, 2026 Shelby Alexander
Hortonville Case Studies March 12, 2026 Shelby Alexander
https://studiocpg.com/projects/urban-design/ tennyson-street-improvements/
FIGURE # IMAGE TITLE
SOURCE/ WEBSITE
Figure 4.65 Example of houses Converted into Shops/ Restaurants City of Westfield
Figure 4.66 Traditional Downtown/ Village Node Development City of Westfield
Figure 4.67 Adaptive Reuse of Old Building into Restaurant City of Westfield
ACCESSED
Hortonville Case Studies March 12, 2026 Shelby Alexander
Hortonville Case Study March 12, 2026 Shelby Alexander
Hortonville Case Study March 12, 2026 Shelby Alexander
Figure 4.68 Traditional Neighborhood Street Conversion for Dining REA/CNU Website Setting a Whole New Pattern for Rural Growth March 23, 2026 Robert Steuteville
Figure 4.69 Traditional Neighborhood Development Grinstad & Wagner Architects 12 Street Village March 23, 2026
Figure 4.70 Village Center Placetype Characteristics. REA
Figure 4.71 Single-Family Detached Dwelling Example. REA
Figure 4.72 Master Planned Mixed Use Recommended Land Uses. REA
Figure 4.73 Example of Attached Multi-Unit Development that has characteristics of single-unit development.
https://www.cnu.org/publicsquare/2022/03/03/ setting-new-pattern-rural-growth
http://www.grinstadwagner.com/ Commercial/12thStVillage/12thSt.html
Shutterstock A row of new townhouses or condominiums May 17, 2013 alexmisu #138946367
Figure 4.74 Example of mixed use building with commercial on the first floor and office and residential above. On-street parking and landscaping incorporated into design. REA
Figure 4.75 Example of multi-unit complex.
Shutterstock Attractive apartment building June 11, 2013 LesPalenik #141976228
Figure 4.76 Single unit detached dwelling with garage facing side of lot. Unit sits on REA
Figure 4.77 Master Planned Mixed Use Placetype Characteristics. REA
Figure 4.78 Example of Mixed Use Buildings and a Dedicated Bike Trail.
Multistudio IndyGo TransitOriented Development March 18, 2026
https://www.multi.studio/work/indygo-transit-orienteddevelopment
FIGURE # IMAGE TITLE
SOURCE/ WEBSITE
Figure 4.79 Trail-Oriented Development District Recommended Land Uses. REA
Figure 4.80 Indianapolis Cultural Trail. REA
ACCESSED
Figure 4.81 Mixed Use Buildings and Open Space Example. Zillow Railyard Flats 440 E 8th, Sioux Falls, SD 57103 March 18, 2026
Figure 4.82 Community Gathering Place Example. DCI Engineers Ironworks at Pencoyd Landing March 18, 2026
https://www.zillow.com/apartments/sioux-falls-sd/ railyard-flats/CkBJdZ/?reloadCount=1&subAppName= building-page-sub-app&msockid=343b77bc807c6448 2a536160814965b1
https://www.dci-engineers.com/work/ironworks-atpencoyd-landing
Figure 4.83 The 606 Trail in Chicago. Chicago Tribune, Armando L. Sanchez Aldermen propose 14-month freeze on building, demolition near The 606 ‘so we can slow down and hopefully stop gentrification’ January 3, 2020 Ryan Ori https://www.chicagotribune.com/2020/01/03/ aldermen-propose-14-month-freeze-on-buildingdemolition-near-the-606-so-we-can-slow-down-andhopefully-stop-gentrification/
Figure 4.84 Monon Boulevard Mixed Use Buildings And Open Space. REA Monon Boulevard and Midtown Plaza
Figure 4.85 Trail-Oriented Development District Placetype Characteristics. REA
Figure 4.86 Downtown Plaza Concept. City of Westfield, Browning Day
City of Westfield Downtown Redevelopment Plan, cover page
Figure 4.87 Downtown Master Plan Aerial View. City of Westfield, Browning Day City of Westfield Downtown Redevelopment Plan, page 4
October 7, 2025
https://www.westfieldecdev.com/media/userfiles/ subsite_310/files/projects/24029%20-%20
Westfield%20Downtown%20Redevelopment%20 Plan%20-%20FINAL%20PAGES%20-%202025-1006_v2.pdf
October 7, 2025
https://www.westfieldecdev.com/media/userfiles/ subsite_310/files/projects/24029%20-%20
Westfield%20Downtown%20Redevelopment%20 Plan%20-%20FINAL%20PAGES%20-%202025-1006_v2.pdf
Figure 4.88 Example of Flex Office Building With Walking And Cycling Connections. Rob Paulus Architects Trinity Mixed Use March 18, 2026
Figure 4.89 Innovation District Recommended Land Uses. REA
Figure 4.90 Example of Office Building With Public Open Space, and Walking and Cycling Connections.
REA
Stone Family Center for Health Sciences
https://robpaulus.com/projects/trinity-mixed-use/
FIGURE # IMAGE TITLE
SOURCE/ WEBSITE
Figure 4.91 Office Buildings and Open Space Example. Indianapolis Business Journal, IBJ photo/Mickey Shuey
Figure 4.92 Office Buildings and Public Open Spaces Example. Real Estate New Jersey, Minno & Wasko Architects and Planners, PARQ
Figure 4.93 Mixed Use Office Building and Public Open Space Example. Charlotte Business Journal, Redline Design Group
Figure 4.94 Walkable Tech Campus, with Public Plazas and Landscape, All Part of an Innovation Hub.
Figure 4.95 Example of Innovation District, Pedestrian Scaled Design Elements.
ACCESSED
Central Indiana’s largest office park secures new loan, additional investment October 8, 2024 Mickey Shuey
Developer of 600unit PARQ project in Parsippany eyes start of site work, demolition March 10, 2022 Joshua Burd
Pop The Top Craft Beer Shop lands space at Oakhurst Commons August 23, 2022 Jennifer Thomas
United Master Architects Innovation District Blagoevgrad/Bulgaria March 18, 2026
Gensler The Crossing at University of Kansas Master Plan March 18, 2026
Figure 4.96 Outdoor Public Space for Enjoyment of Employees and Visitors. Visit Gainesville Midpoint Park and Eatery March 18, 2026
Figure 4.97 Example of Innovation District Walkable Campus. City of Wichita Naftzger Park Rentals March 18, 2026
Figure 4.98 Innovation District Placetype Characteristics. REA
Figure 4.99 Diversifying entertainment options will encourage visitors to plan a vacation and stay before or after tournaments. Westfield becomes a destination for local residents.
Chambless King Architects Albertiville leaders reflect on state of the city April 2, 2021 Elizabeth Summers, Sand Mountain Reporter
Figure 4.100 Destination Development Recommended Land Uses. REA
https://www.ibj.com/articles/central-indianas-largestoffice-park-secures-new-loan-additional-investment
https://re-nj.com/developer-of-600-unit-parq-projectin-parsippany-eyes-start-of-site-work-demolition/
https://www.bizjournals.com/charlotte/ news/2022/08/23/pop-the-top-craft-beer-shop-lands. html
https://umasters.bg/work/innovation-district
https://www.gensler.com/projects/the-crossinguniversity-of-kansas-master-plan
https://www.visitgainesville.com/dine/restaurant/ midpoint-park-and-eatery/
https://www.wichita.gov/1255/Rentals
https://www.chamblessking.com/news/2021/4/2/ albertville-leaders-reflect-on-state-of-city
FIGURE # IMAGE TITLE
SOURCE/ WEBSITE
ACCESSED
Figure 4.101 Grand Park Development Concept Plan. City of Westfield, Speck Dempsey, Perkins & Will Grand Park District, page 9 April 2025
Figure 4.102 Design Around Destination Recreation and Public Recreational Space.
Figure 4.103 Example of Destination Oriented Mixed Use Buildings.
Figure 4.104 Example of Destination Recreation of Indoor Skiing.
Kentucky Tourism
McNamara Salvia Structural Engineers
Owensboro March 18, 2026
Legoland and AMC Cineplex at Assembly Row March 18, 2026
Shutterstock DUBAI UAE - APRIL 6: Ski on April 6, 2013 in Dubai. Ski Dubai--is an indoor ski resort with 22,500 square meters of indoor ski area. It is a part of the Mall of the Emirates.
Figure 4.105 Example of Incorporating Kid and Adult Entertainment into Destination Development.
https://www.westfieldin.gov/DocumentCenter/ View/7295/Grand-Park-Master-Plan-April-2025
https://www.kentuckytourism.com/explore/ owensboro-4194
https://www.mcsal.com/legoland-and-amc-cineplex/
October 20, 2013 Sergii Figurnyi #159360443
Tripadvisor The Island in Pigeon Forge March 18, 2026
Figure 4.106 Destination Development Placetype Characteristics REA
Figure 4.107 Restaurant Example. nextloc Key Factors to Consider When Selecting Your Next Restaurant Location February 23, 2023
Figure 4.108 Traditional Commercial Recommended Land Uses. REA
Figure 4.109 Example of Retail and Restaurants with Pedestrian-Oriented Design.
Figure 4.110 Example of Retail and Restaurants with Significant Landscaping to Buffer Spaces.
WZMH Architects Shops at Don Mills March 18, 2026
The Village of Niles Development Projects Golf Mill Town Center March 18, 2026
https://www.tripadvisor.com/Attraction_Reviewg55270-d4412583-Reviews-The_Island_in_Pigeon_ Forge-Pigeon_Forge_Tennessee.html
https://www.nextloc.io/blog/key-factors-toconsider-when-selecting-your-next-restaurantlocation#:~:text=By%20considering%20key%20 factors%20such%20as%20demographics%2C%20 competition%2C,decision%20that%20sets%20 your%20restaurant%20up%20for%20success.
https://www.wzmh.com/projects/shops-at-don-mills
https://www.vniles.com/1443/Development-Projects
FIGURE # IMAGE TITLE
Figure 4.111 Example of Retail and Restaurants in Conventional Commercial Development.
Figure 4.112 Example of Mixed Use Buildings With Street Trees and Set Close to Street.
Figure 4.113 Example of Mixed Use Development Incorporating Restaurants, Retail, Housing, and Plaza Space with Pedestrian-Scaled Design Elements and Features.
SOURCE/ WEBSITE ARTICLE TITLE DATE/ ACCESSED
LoopNet 10420 Louetta Rd Houston, TX 77070 The Vintage Retail Center March 18, 2026
https://www.loopnet.com/Listing/10420-Louetta-RdHouston-TX/15380775/
Adobe Stock Versatile mixed use storefront and office building with ample space. March 18, 2026 Gophotograph #1300662022
bannerman crossings Conference Rooms March 18, 2026
Figure 4.114 Traditional Commercial Placetype Characteristics. REA
Figure 4.115 Warehouse Office Building Example. RGA Office of Architectural Design CleanTech Manufacturing Center March 18, 2026
Figure 4.116 General Industry Recommended Land Uses REA
Figure 4.117 Example of an office building appropriate for General Industrial placetype. M. B. Kahn Advanced Manufacturing Works March 18, 2026
Figure 4.118 IMMI, a local industrial business, is localed in the General Industrial placetype.
Figure 4.119 Example of another mix of office and warehouse for General Industrial placetype.
Figure 4.120 Traditional industrial building with office space appropriate for General Industrial placetype.
IMMI March 18, 2026
https://bannermancrossings.com/shop/conferencerooms/
https://www.rga-architects.com/cleantechmanufacturing-center-1
https://www.mbkahn.com/project/ge-advancedmanufacturing-works/
https://www.imminet.com/
Adobe Stock modern industrial building with sustainable design and zero emission manufacturing March 18, 2026 siraphol #1256919135
indiamart Civil Construction Supervision March 18, 2026
Figure 4.121 General Industry Placetype Characteristics REA
https://www.indiamart.com/proddetail/civilconstruction-supervision-2761091562.html
FIGURE #
IMAGE TITLE
Figure 4.122 Warehouse Office Building Example.
SOURCE/ WEBSITE
ACCESSED
Adobe Stock Sleek Steel Exterior of Modern Warehouse Office Building. Generative ai March 18, 2026 NovaVision #676138842
Figure 4.123 Flex Industrial Recommended Land Uses REA
Figure 4.124 SEP Office Building Example.
Figure 4.125 Westfield Medical Office Building near the Westfield-Washington Township Library.
CSO SEP Corporate Headquarters March 18, 2026
RealNex 17300 Westfield Boulevard March 18, 2026
https://www.csoinc.net/projects/sep-corporateheadquarters/
https://realnex.com/listings/4043261/17300-westfieldblvd
Figure 4.126 Example of Makers Space Example. Charlotte Business Journal, Beauxwright Charlotte-based Copper Builders to move growing staff to new FreeMoreWest office January 25, 2024 Elise Franco https://www.bizjournals.com/charlotte/ news/2024/01/25/copper-builders-west-moreheadoffice-relocation.html
Figure 4.127 Example of Manufacturing Building Example. AZ Big Media Industrial space occupancy thrives in Phoenix despite national decline January 29, 2024 AZRE
Figure 4.128 Example of Office & Lab Space. LoopNet 600 Lindbergh Dr Coraopolis, PA 15108 December 14, 2025
Figure 4.129 Example of Campus Style Layout of Innovation Hub. habitech Segreen Business Park March 18, 2026
Figure 4.130 Example of Industrial / Flex Office Building.
https://azbigmedia.com/real-estate/industrial-spaceoccupancy-thrives-in-phoenix-despite-nationaldecline/
https://www.loopnet.com/Listing/600-Lindbergh-DrCoraopolis-PA/28323656/
https://www.habitech.it/single-portfolio/segreenbusiness-park/
Shutterstock Modern industrial building September 8, 2007 Robyn Mackenzie #5192668
Figure 4.131 Example of Industrial / Flex Office Space. FLEXD FLEXD Keller March 18, 2026
Figure 4.132 Flex Industrial Placetype Characteristics. REA
Figure 4.133 Grand Park District Waterfront Concept. City of Westfield
Figure 4.134 Indoor Sports Facilities, Hotel, Housing for Athletes, and Restaurants. City of Westfield
Grand Park District Master Plan: A Place for People who Love Sports January 13, 2025
Grand Park District Master Plan: A Place for People who Love Sports January 13, 2025
https://flexd.dev/portfolio/portfolio-01/
https://www.westfieldin.gov/m/newsflash/home/ detail/87
https://www.westfieldin.gov/m/newsflash/home/ detail/87
FIGURE # IMAGE TITLE
Figure 4.135 Promotes Walkability and an Integration of Mixed Use Buildings, Restaurants, and Public Spaces.
SOURCE/ WEBSITE
City of Westfield
Figure 4.136 Master plan of Grand Park District. City of Westfield
Figure 4.137 Overall Vision for the Grand Park District - A Mixed Use Development Opportunity. City of Westfield, MKSK
Figure 4.138 Grand Park. City of Westfield
Figure 4.139 Grand Park Sports Campus Recommended Land Uses. REA
Figure 4.140 Grand Park Sports Campus Placetype Characteristics. REA
Figure 4.141 Grand Park Event Center. Current Publishing, William Knox
ACCESSED
Grand Park District Master Plan: A Place for People who Love Sports January 13, 2025
We Partner With Champions, page 7
Grand Park District Master Plan, page 6 January 13, 2025
https://www.westfieldin.gov/m/newsflash/home/ detail/87
A winning partnership: Grand Park expands scope with Research & Development HUB
Figure 4.142 Wrights 360 Movement Academy in the Grand Park District. MapQuest Wright’s 360 Movement AcademyWestfield
Figure 4.143 Grand Park Soccer Fields with Event Center in Background. Visit Indy Droplight Grand Park - The Sports Complex at Westfield
Figure 4.144 Pacers Athletic Center in the Grand Park District. Pacers Athletic Center Facebook
October 19, 2021 Mark Ambrogi
https://www.westfieldecdev.com/media/userfiles/ subsite_310/files/City-of-Westfield-IN.pdf
https://www.westfieldin.gov/DocumentCenter/ View/2450/Grand-Park-District-Master-Plan
March 19, 2026
March 19, 2026
We hope everyone had a fun weekend here at PAC for the Circile City Showcase. Make sure to follow us for upcoming events!
https://www.youarecurrent.com/2021/10/19/a-winningpartnership-grand-park-expands-scope-with-researchdevelopment-hub/
https://www.mapquest.com/us/indiana/wrights-360movement-academy-westfield-427382237
https://www.visitindy.com/directory/droplight-grandpark-the-sports-complex-at-westfield/
June 3, 2025 https://www.facebook.com/pacersac
Figure 4.145 Drone Shot of Grand Park Soccer Fields. Tripadvisor Photo: Grand Park Sports CampusDiamonds March 19, 2026
Figure 4.146 Westfield City Hall. Current Publishing Westfield to conduct forensic audit after discovery of payroll deduction errors
https://www.tripadvisor.com.my/ LocationPhotoDirectLink-g37626-d6592942i405189195-Grand_Park_Sports_Campus-Westfield_ Hamilton_County_Indiana.html
March 10, 2025 Marney Simon https://youarecurrent.com/2025/03/10/westfieldto-conduct-forensic-audit-after-discovery-of-payrolldeduction-errors/
FIGURE #
IMAGE TITLE
SOURCE/ WEBSITE ARTICLE
Figure 4.147 Community Institutional Recommended Land Uses. REA
Figure 4.148 Community Institutional Placetype Characteristics. REA
Figure 4.149 Community Park With Playground Example.
Shutterstock Colourful children playground activities in public park surrounded by green trees at sunset in Houston, Texas. Children run, slide, swing on modern playground. Urban neighborhood childhood concept.
Figure 4.150 Parks, Conservation, and Open Space Recommended Land Uses REA
Figure 4.151 Natural Open Space Example.
Dreamstime People taking a leisure walk on the trail at Stroud Preserve on before sunset in late fall, West Chester, Pennsylvania, USA. Tourists hikinh on the trail at Stroud Preserve on a warm day before sunset in late fall, West Chester, Pennsylvania, USA
ACCESSED
September 7, 2016
Trong Nguyen #480258076
March 19, 2026
Davidshenbo #213128753
Figure 4.152 Public Open Space Example. City of Boise Borah Park March 19, 2026
Figure 4.153 Forest With Public Trail Example. Life in Indy, IndyHub
Figure 4.154 Community Park Example.
Landscape Performance Series, Jonnu Singleton/ SWA Group
Experience nature at Eagle Creek Park, one of the nation’s largest city parks March 19, 2026
Ricardo Lara Linear Park August 2021
Claire Latane, Jose Guadalupe Cutierrez, Jose Luis Reynoso
https://www.cityofboise.org/departments/parks-andrecreation/parks/borah-park/
https://lifeinindy.com/things-to-do/eagle-creek-park/
https://www.landscapeperformance.org/case-studybriefs/ricardo-lara-linear-park
FIGURE # IMAGE TITLE
SOURCE/ WEBSITE
Figure 4.155 Parks, Conservation, and Open Space Placetype Characteristics REA
Thoroughfare Plan
Figure 5.1 2013 Thoroughfare Plan Map. Lochmuller 2013 Thoroughfare Plan
Figure 5.2 Roadway Ownership. Lochmuller
Figure 5.3 Truck Network Map. Lochmuller
Figure 5.4 Traffic Volumes. Lochmuller
Figure 5.5 Level of Service Levels. Lochmuller, Indianapolis Metropolitan Planning Organization
Figure 5.6 2024 Traffic Level of Service. Lochmuller
Figure 5.7 2025 Forecasted Traffic Level of Serviced. Lochmuller
Figure 5.8 Crash Severity. Lochmuller
Figure 5.9 Vehicle Crashes 20192023. Lochmuller
Figure 5.10 Sidewalk Ownership. Lochmuller
Figure 5.11 Cycle Corridors. Lochmuller
Figure 5.12 Westfield Trail System. Lochmuller
ACCESSED
Figure 5.13 Fare Pricing. Janus Hamilton County Express March 19, 2026
Figure 5.14 Westfield Capital Improvements 2024-2028 CIP. Lochmuller
Figure 5.15 Arterial Spacing. Lochmuller
Figure 5.16 2045 Thoroughfare Plan. Lochmuller
Figure 5.17 Potential Intersection Improvement Locations. Lochmuller
Figure 5.18 Intersection Improvement Projects. Lochmuller
Figure 5.19 Bicycle and Pedestrian Gaps. Lochmuller
https://www.janus-inc.org/hamilton-county-express
FIGURE # IMAGE TITLE
SOURCE/ WEBSITE
Figure 5.20 Bicycle Infrastructure Safety Infographic. Lochmuller
Figure 5.21 Bicycle Infrastructure Project Priority –Immediate. Lochmuller
Figure 5.22 Bicycle Infrastructure Project Priority –Secondary. Lochmuller
Figure 5.23 Bicycle Infrastructure Project Priority – Future. Lochmuller
Figure 5.24 Street Types Plan. Lochmuller
Figure 5.25 Street Type by Functional Class. Lochmuller
Figure 5.26 Street Type Characteristics. Lochmuller
Figure 5.27 Street Type Facilities. Lochmuller
Figure 5.28 Bike Path Example. Shutterstock Empty Bicycle for bike, green way, a path at the park November 18, 2017 Jersson Tello #758046934
Figure 5.29 Round-a-bout with Separated Bike Lanes.
Adobe Stock Rondo. Widok z lotu ptaka March 19, 2026 Lukasz #143909932
Figure 5.30 Regional Boulevard Example Cross Section. Lochmuller
Figure 5.31 Crosstown Avenue Streetscape Example. Lochmuller
Figure 5.32 Crosstown Avenue with Separated Bike Lanes.
Shutterstock Protected bike lane between parking lane and sidewalk on city street. Bikers commuting on nice spring day. May 13, 2017 Jorge Salcedo #639686524
Figure 5.33 Crosstown Avenue Typical Example Section. Lochmuller
Figure 5.34 Pedestrian Crossing. Adobe Stock Pedestrian crossing March 19, 2026 Arvind Balaraman #75210320
Figure 5.35 Protected Bike Lane. Adobe Stock Cycling lane painted green stretches through Sarasota city road with moving cars. Florida urban bike-friendly street March 19, 2026 bilanol #1493646867
FIGURE # IMAGE TITLE
SOURCE/ WEBSITE ARTICLE TITLE
ACCESSED
Figure 5.36 On-Street Parking. Adobe Stock Cars parked in the parking lot March 19, 2026 zhukovvvlad #307549086
Figure 5.37 Mixed Use/Low-Density Commercial Connector Example Cross Section. Lochmuller
Figure 5.38 Unprotected Bike Lane. Shutterstock Bike lane in city street March 30, 2014 Jorge Salcedo #184801718
Figure 5.39 Off-Street Bike Path. Timberlake Dental Instagram
Figure 5.40 Neighborhood Avenue Crossing. Lochmuller
Figure 5.41 Neighborhood Avenue Example Cross Section. Lochmuller
Figure 5.42 Agricultural/Industrial Street at Night
Figure 5.43 Agricultural/Industrial Street during Day.
What is Bruxism? https://www. timberlakedental. com/blog/2023/whatis-bruxism/
Adobe Stock road in the industrial zone with modern LED lighting
Adobe Stock Empty rural road with bike land and street markings in Sweden
Figure 5.44 Agricultural/Industrial Example Cross Section. Lochmuller
Connecting It Together
Figure 6.1 Westfield Village 1866. Old Maps, Map of Hamilton Co., Indiana 1866, McClellan & Warner Westfield Village, Washington, Indiana 1866 Old Town Map Custom PrintHamilton Co.
Figure 6.2 Westfield within Hamilton County Context. REA
Figure 6.3 Land Area and Population Growth. REA
Figure 6.4 Grand Park District Vision & Regulating Plan. Speck Dempsey, Perkins & Will
February 7, 2023
https://www.instagram.com/timberlakedental/p/ CoXejAorYBk/
March 19, 2026 Milan Neoga reco #434856707
March 19, 2026 Robert Kneschke #751368853
March 19, 2026 C.S. Warner https://shop.old-maps.com/indiana/towns/hamiltonco-in-1866-town/westfield-village-washington-indiana1866-old-town-map-custom-print-hamilton-co/
Grand Park District Master Plan, page 10 January 13, 2025
Figure 6.5 A Vision for Downtown Development: Master Plan. Browning Day Downtown Redevelopment Plan, page 2
October 7, 2025
https://www.westfieldin.gov/DocumentCenter/ View/2450/Grand-Park-District-Master-Plan
https://www.westfieldecdev.com/media/userfiles/ subsite_310/files/projects/24029%20-%20 Westfield%20Downtown%20Redevelopment%20 Plan%20-%20FINAL%20PAGES%20-%202025-1006_v2.pdf
FIGURE #
IMAGE TITLE
Figure 6.6 Public Open Space is a Critical Part of the Success of Destination Development.
Figure 6.7 Typical Single-Family Detached Dwelling.
SOURCE/ WEBSITE ARTICLE TITLE
ACCESSED
Tripadvisor Pearl Brewery March 19, 2026
https://www.tripadvisor.com/Attraction_Reviewg60956-d2702433-Reviews-Pearl_Brewery-San_ Antonio_Texas.html
Adobe Stock Modern suburban house with clean lines, bathed insoft afternoon light. Minimalist elegance in residential architecture. March 19, 2026 wang #1520697798
Figure 6.8 Housing Affordability Relative to Income. REA
Figure 6.9 Parks and Trails in Westfield. REA
Figure 6.10 Shared-Use Trail. City of Westfield
Figure 6.11 Restaurant With Outdoor Seating. City of Westfield
Figure 6.12 Planter Boxes.
EPA Types of Green Infrastructure June 2, 2025
Figure 6.13 Riparian Corridor. Lochmuller
Figure 6.14 Environmental Benefits of Green Infrastructure.
https://www.epa.gov/green-infrastructure/types-greeninfrastructure#tns1-item0
Medium Reimagining Urban Spaces: How Green Infrastructure Can Traansform Cities for a Sustainable Future. November 20, 2024 Shoaib Ahmad https://medium.com/@shabbybahi123/reimaginingurban-spaces-how-green-infrastructure-cantransform-cities-for-a-sustainable-future76b72a521d05
https://www.epa.gov/green-infrastructure/ environmental-benefits-green-infrastructure
Figure 6.15 Social Benefits of Green Infrastructure.
Figure 6.16 Economic Benefits of Green Infrastructure.
EPA Social Benefits of Green Infrastructure March 20, 2026
EPA Economic Benefits of Green Infrastructure March 20, 2026
Figure 6.17 Public Plaza Example. City of Westfield
Implementation
Figure 7.1 Construction Work Example.
https://www.epa.gov/green-infrastructure/socialbenefits-green-infrastructure
https://www.epa.gov/green-infrastructure/economicbenefits-green-infrastructure
Shutterstock A backhoe, tracked excavator and crew dig a utility trench for water and other utilities at a new commercial road development. June 8, 2015 TFoxFoto #285552518
FIGURE # IMAGE TITLE
SOURCE/ WEBSITE
Figure 7.2 Overarching Action Steps Matrix. REA
Figure 7.3 Economic Development Matrix. REA
Figure 7.4 Economic Development Matrix continued. REA
Figure 7.5 Housing Matrix. REA
Figure 7.6 Housing Matrix continued. REA
Figure 7.7 Quality of Place Matrix. REA
Figure 7.8 Quality of Place Matrix continued. REA
Figure 7.9 Transportation Matrix. REA
Figure 7.10 Transportation Matrix continued. REA
Figure 7.11 Utilities Matrix. REA
Figure 7.12 Utilities Matrix continued. REA
ACCESSED


Looking to the Horizon
COMPREHENSIVE PLAN for WESTFIELD