
16 minute read
ECONOMY: EXISTING CONDITIONS

by REA site

Retail Trade Analysis
This retail analysis captures a snapshot of downtown Frankfort’s economy as it stands in early 2016, including types of stores and services provided, along with the spending habits of customers and general earnings of local businesses.
Advertisement
Gaining an understanding of the existing retail outlets and preferences of consumers is the first step toward crafting an effective plan for economic revitalization. This information can then be leveraged to repurpose existing structures and attract new business. The following steps are needed for a retail trade analysis:
1. Define a retail trade area
2. Analyze demographic and traffic patterns inside the area
3. Perform a market analysis
4. Define local customers
Defining The Retail Trade Area
The map below shows the retail trade area around Frankfort. These imaginary circles divide the local population between groups that are likely to do their shopping in Frankfort and those who will probably go elsewhere. As shown from the map below, the trade area is broken into three sections based on the distance from the center of town: 1 mile, 10 miles and 15 miles.
Individuals living within 10 miles of town are considered to be Frankfort’s core customers. These are the individuals who are most likely to purchase goods and services from local businesses or visit downtown routinely.
Consumers within the 15-mile radius are still fairly likely to shop in Frankfort, especially if Frankfort businesses offer better deals than neighboring competitors or products that are not readily available closer to home. The population beyond the 15-mile radius is increasingly less likely to drive into town for daily errands, but might be drawn to unique businesses or well-known restaurants.
The trade area boundaries serve as a reference point for the average consumer, but there are certainly exceptions. In the cases where Frankfort can differentiate itself, the city has an opportunity to draw from a wider pool of consumers. However, for daily activities the boundaries provide a broad overview.
Source: Nielsen Solution Center
Demographics
The following table includes information about the population within the Frankfort trade area based on the three concentric rings (up to a 15-mile radius). Frankfort’s population is slowly increasing, with about a 0.83 percent projected increase by 2021.
The information shows that within reasonable driving distance to
ECONOMY: EXISTING CONDITIONS
downtown Frankfort there are over 51,000 people, which is a goodsized base for attracting customers, and that the population’s median household income is $54,914.
Table 1: 15-Mile Radius Demographic Profile
only $16.9 million. Thus, $19.4 million dollars leaked out of the local economy. Understanding where this leakage occurs is an important step toward creating a retail strategy. SDG uses a national company called Nielsen Holdings N.V. for the following data on consumer spending.
Understanding Frankfort’s economy begins with two questions:
1. How much do local people spend on food, clothes, etc.?
2. How much do local businesses earn on food, clothes, etc.?
Ideally, local business would receive nearly all of the dollars spent by the local population. In reality, this rarely occurs because of the accessibility of Internet sales and shoppers’ willingness to travel to obtain specific items.
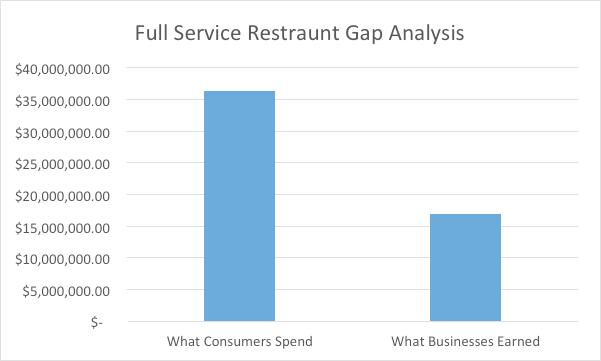
Money is said to “leak” from downtown if residents spend more for goods and services than local businesses earn. In a hypothetical example, the chart below shows that local shoppers in an area spent $36.3 million on full service restaurants, but local restaurants earned
Source: Nielsen Solution Center
Marketing firms perform opportunity gap analysis in two ways. One method is by type of retail store (hardware store, book store, etc.). The second method is by the kind of merchandise. For example, someone could buy a hat at a clothing store, hardware store, grocery store, etc.
Local entrepreneurs can sift through both lists (the complete information can be found in the appendix) to look for opportunities among underserved markets.
Gap Analysis: Retail Store Spending
This section focuses on opportunity gap analysis by retail store. For
ECONOMY: EXISTING CONDITIONS
instance, the following table shows that people within a 10-mile radius of downtown spent $5.7 million at jewelry stores, but local businesses within that circle earned only $946,124. Could a small shop recapture some of that money?
In another example, people within 10 miles of downtown (the core customers) spent about $1.7 million dollars at hobby, toy and games stores, but local stores in that category only receive about 4 percent of that spending.
Table 2 lists stores where less than 50 percent of consumer demand is being met within the 10-mile Frankfort area, and how much money is being lost.
The following lists highlight types of stores in the 10- and 15-mile trade areas that either leak or have surpluses in consumer spending in specific types of businesses.
10-Mile Trade Area (leak amount): -
• Automotive Dealers ($43.6 million)
• Clothing & Clothing Accessories Stores ($15.3 million)
• Furniture & Home Furnishings Stores ($3.4 million)
• Pharmacies & Drug Stores ($14.6 million)
10-Mile Trade Area (surplus amount):
• Gasoline Stations with Convenience Stores ($11 million)
• Building Material, Garden Equipment Stores ($13 million)
• Outdoor Power Equipment Stores ($8.8 million)
• Nursery & Garden Centers ($22.6 million)
15-Mile Trade Area (leak amount):
• Automotive Dealers ($109.7 million)
• Health & Personal Care Stores ($32.3million)
• Jewelry, Luggage, Leather Goods Stores ($11.9 million)
• Limited-Service Eating Places ($18.2 million)
15-Mile Trade Area (surplus amount):
• Building Material, Garden Equipment Stores ($98.1 million)
• Outdoor Power Equipment Stores ($99.7 million)
• Specialty Food Stores ($5.4 million)
• Gasoline Stations ($13.3 million)
Local entrepreneurs will also be encouraged to note that Frankfort doesn’t just “leak” money, it can also capture a “surplus,” which is when people who live outside the trade area buy things locally. For instance, building material/garden equipment stores within 10 miles made about $57.3 million, but local people in that same area only spent $44 million. Outsiders provided the additional $13.2 million to the local economy.
The complete list of Retail Store Spending can be found in the Appendix.
Gap Analysis: Merchandise Spending
The following data focuses on types of merchandise consumers bought, regardless of the type of store. Table 3 below lists goods being purchased inside and outside the 10-mile Frankfort area.
ECONOMY: EXISTING CONDITIONS
Table 3: Frankfort – 10-Mile Radius Opportunity
15-Mile Trade Area (surplus amount):
• Groceries & Other Foods ($57 million)
• Drugs, Health Aids & Beauty Aids ($175 million)
• Women’s, Juniors’, & Misses’ Wear ($3.4 million)
• Automotive Fuels ($122.6 million)
The complete list of Merchandise Spending can be found in the Appendix.
Cautionary Note
It is important to note that none of the supply and demand numbers for the trade area are entirely accurate.
The following lists show stores in the 10- and 15-mile trade areas that either leak or have surpluses in consumer spending on particular merchandise.
10-Mile Trade Area (leak amount):
• Footwear ($3.2 million)
• Toys, Hobby Goods & Games ($2.1 million)
• Drugs, Health Aids & Beauty Aids ($24.6 million)
• Sporting Goods ($1.6 million)
10-Mile Trade Area (surplus amount):
• Automotive Fuels ($23.4 million)
• Lawn/Garden/Farm Equipment/Supplies ($6.5 million)
• Alcoholic Drinks ($252,617)
15-Mile Trade Area (leak amount):
• Meals & Snacks ($35.8 million)
• Cars, Trucks, Other Powered Transportation ($107.7 million)
• Furniture & Sleep Equipment ($7.6 million)
• Hardware, Tools, Plumbing, Electrical ($8.9 million)
Several national firms gather and process retail data. SDG uses a firm called Nielsen. All of their final numbers are estimates based on a formula which includes information from sources such as the U.S. Department of Labor’s Consumer Expenditure Survey.
Because they are estimates, it is likely that any one figure, such as retail clothing stores, is not entirely accurate.
Then why use the data?
The numbers are not meant to be viewed as accurate accounts of individual stores, but, taken as a whole, they provide reasonable estimates of expenditures and sales. Equally important, this type of data is reviewed by national chains when deciding whether to move into a new area. It is important to Frankfort’s retail market to see itself as others do.
ECONOMY: EXISTING CONDITIONS
Market Categories
Shops and services provide one side of a business transaction; customers provide the other. When a national chain is looking for a new location for a store or restaurant, they examine consumer characteristics of the local population. This information is contained in a psychographic profile which includes earnings, lifestyle characteristics and habits of the general population.
To obtain this data SDG uses the services of Nielsen, which collects information on the lifestyles of Americans and then breaks down local populations into individual market categories. These market categories have a specific name and the members of each segment share certain traits that characterize their consumption habits. Table 4, found below, provides information about Frankfort’s local population as consumers.
Consumer expenditure data is drawn from Consumer Buying Power, Nielsen’s database of estimated expenditures based on the Bureau of Labor Statistics’ Consumer Expenditure Survey. Business data comes from Business-Facts, Nielsen’s database of over twelve million businesses and professional records. Nielsen’s partner, infoUSA, collects the base Business-Facts data which Nielsen enhances with additional information.
Table 4: 10-Mile Trade Area: Top Consumer Categories
Source: Nielsen Solution Center
Note that the top three categories in the above table comprise about 26 percent of the population. Two of those categories are for youngerto middle-aged adults and two out of three are upper-mid income levels.
ECONOMY: EXISTING CONDITIONS
Mayberry-ville Upper Mid Older w/o Kids
Like the old Andy Griffith Show set in a quaint picturesque burg, Mayberry-ville harks back to an old-fashioned way of life. In these small towns, upper- middle-class couples like to fish and hunt during the day, and stay home and watch TV at night. With lucrative blue-collar jobs and moderately priced housing, residents use their discretionary cash to purchase boats, campers, motorcycles, and pickup trucks.
Big Sky Families: Upper Mid Younger w/ Kids
Scattered in placid towns across the American heartland, Big Sky Families is a segment of middle-aged rural families who have turned high school educations and blue-collar jobs into busy, upper-middle-class lifestyles. Residents enjoy baseball, basketball, and volleyball, as well as fishing, hunting, and horseback riding. To entertain their sprawling families, they buy virtually every piece of sporting equipment on the market.
Lifestyle Traits: Demographic Traits:
Income: Upper Mid
Lifestyle Traits: Demographic Traits: Has Discretionary Cash
Lives in Moderately Priced Housing
Age Ranges: 45-64
Hunts Presence of Kids: Household without Kids
Watch Nightime
TV Homeownership: Mostly Owners
Employment Levels: Blue-Collar Jobs
Ethnic Diversity: Mostly White
Upper-MiddleClass Lifestyles
Blue-Collar Jobs
Income: Upper Mid
Age Ranges: 25-44
Enjoys Sports Presence of Kids: Households with Kids
Large buyers of sporting equipment
Education Level: Mostly High School Educations
Ethnic Diversity: Mostly White
ECONOMY: EXISTING CONDITIONS
Bedrock America: Low Income Younger w/ Kids
Bedrock America consists of economically challenged families in small, isolated towns located throughout the nation’s heartland. With modest educations, sprawling families, and service jobs, many of these residents struggle to make ends meet. One in five live in mobile homes. One in four haven’t finished high school. Rich in scenery, Bedrock America is a haven for fishing, hunting, hiking, and camping.
Lifestyle Traits: Demographic Traits:
Rural Lifestyle Income: Low
Enjoys Outdoor Activities Ethnicity: White, Black, Hispanic Mix
Modest Educations Age Ranges: 25-44
Service Jobs Presence of Kids: HH w/ Kids
Simple Lifestyle Homeownership: Mostly Renters
The traits of middle-to-low income and education continue through the next few most common segments in the 10-mile radius: Kid Country, USA and Crossroads Villagers.
These customer segments lead to a discussion about price points, which focus on what a business can charge for a product in a given market. Put simply, business owners can’t charge more for their pizza, sporting goods or jewelry than local people are willing to pay – they must either lower their prices, change merchandise or close shop. These restrictions are particularly confining in areas with a small or declining population and relatively lower incomes.
New business owners, reviewing this data, must either work hard to capture the smaller percentage of high-income shoppers or somehow attract more affluent visitors from elsewhere.
Business Climate
The previous section described the current state of downtown Frankfort’s customer base and inventory of businesses. This section explains the basic principles that guide new growth and outlines the challenges facing revitalization efforts.
At the most basic level, certain “raw materials” are needed to pump new life into a downtown business climate. These building blocks include:
1. An inventory of available buildings (and some cooperating business owners).
2. An acceptable amount of pedestrian and automobile traffic.
3. A belief by at least some local business people that revitalization is possible.
4. The political will to plan for – and invest in – downtown.
Getting right to the point, Frankfort scores high in all of these categories.
The courthouse square and surrounding blocks meet the first standard; there is large stock of available downtown buildings and infill space for new creations. Some buildings need remodeling, but many others are ready to go. In fact, the market for downtown buildings seems to be heating up, with many structures changing hands during the course of this planning process.
As for the second point, the Indiana Department of Transportation counted about 14,000 vehicles daily at U.S. 421 and Jackson Street, just two blocks from the square. Another promising statistic is the 39,000 or so vehicles daily passing nearby at the I-65/SR 28 exit.
ECONOMY: EXISTING CONDITIONS
Regarding the third point, there have been encouraging signs, such as a local couple buying the old cigar factory. However, most of the recent investment has been led by the public sector. City hall has acquired several downtown properties (and is renovating Old Stoney) and the Clinton County Chamber of Commerce has restored a key building downtown and converted it to several uses, includeing a new co-work space.
The fourth point gets the highest marks. The city’s current administration is clearly leading the charge in downtown revitalization. City government has acquired buildings and lots, is working with county government and has unusually strong relationships with most stakeholder groups (the chamber, business owners, Main Street, etc.). These tight affiliations greatly increase the chances of steady downtown progress.
Downtown Revitalization Principles
SDG uses revitalization principles to provide a framework for understanding how projects usually unfold. They are a blend of history and current trends that underlie much of the work being done to restore central business districts across America. The following section briefly describes these national trends and then compares them against Frankfort’s current market.
Local Investment
Business owners can’t be expected to pour their livelihoods into a struggling downtown unless they see that the town is backing them up. Are the streets clean and policed? Is the city doing anything about empty, crumbling buildings? Is the city’s own property well maintained?
As a general rule, public investment must come before private investment.
In Frankfort: As mentioned, the city is investing considerable resources in downtown. Having “put its money where its mouth is,” local leaders will be in a much stronger position to recruit and steer new private sector growth in the central business district.
LOCAL MONEY VS. OUT-OF-TOWN MONEY
When recruiting new businesses, a key decision is knowing who the new business will serve: local residents or out-of-town visitors? Will the new enterprise make life easier for residents by providing the goods and services they now leave town for, or will it lure tourists with specialty stores or regional attractions?
If a business serves mostly residents, it means that dollars are just circulating from local business owner to business owner; there is little outside money enriching the community.
On the other hand, there are many examples where a small restaurant or specialty store attracts loyal customers from far away. It is great to have money come into town from outside the community, of course, but a downtown must make sure it has something for out-of-towners to spend their money on.
In Frankfort: The city is the county seat, and – as the marketing study showed – it does attract shoppers from outside its boundaries. However, aside from special events and festivals, it does not yet have the density of unique stores and services to attract a steady tourism trade.
Baiting The Hook
Many businesses have been launched after an entrepreneur glanced out the windshield at a beautiful streetscape and thought, “What a nice looking little town. You know, this is just the kind of place I’ve always dreamed about starting a business in.”
Baiting the hook can include landscaping (that hasn’t become withered), banners and storefront lighting even for buildings that are empty.
In Frankfort: There are signs that downtown is ready for a greater concentration of private investment. Several people in town bought one or more downtown buildings with the expressed desire to launch new local businesses.
ECONOMY: EXISTING CONDITIONS
Risk And Experimentation
The decline of America’s small downtowns happened over many years and was not an unforeseeable accident. Changes in consumer shopping and commuting patterns – and the business community’s adaptation to them – will not be reversed in the immediate future. In other words, waiting for the good old days to return is not a productive strategy.
Instead, some boldness is required, and boldness requires risk. What’s at risk is not only money and time, but morale. It can be discouraging to see the community launch a new business only to see it fail. Too many of these unsuccessful launches can lead to paralysis; where business owners grow increasingly reluctant to take a chance and residents don’t give them much encouragement.
A community can break this cycle in one of two ways. They can get lucky; someone with all the right skills and resources starts a business at just the right time in just the right place and is smashingly successful.
If that seems like a long-shot, a community must create an atmosphere of experimentation in the recruiting and support of new businesses.
In Frankfort: As described in the Economic Development Tools section of this chapter, the city has all the partners and services needed to offer comprehensive assistance to business start-ups. As an additional benefit, many of the services are collected under one roof – the Clinton County Chamber of Commerce. Frankfort Main Street is the other key partner.
While the low-interest loans and various other services are already available, local leaders should take the next big step and actively recruit both new entrepreneurs and existing business owners looking to expand. The goal is to create a seamless system for providing everything from help with the business plan to low-interest loans to marketing. As a starting test case, the couple who bought the cigar factory have asked for assistance.
Locally Grown
National chains will show interest in a community when – and only when – all the correct variables are in place. These factors include population density and spending patterns. National chains don’t all have the same requirements, but few vary from their patterns. For example, have you ever seen a Cracker Barrel any place except off a busy interstate or a Dollar Store at a thriving urban mall?
Because their requirements are so exact, these chains use their own researchers to determine when and where to put their next store. This means it is very difficult to recruit them.
That leaves smaller regional chains, independent business owners and entrepreneurs as the prime candidates for recruitment. Generally speaking, regional chains are the hardest to attract because they have the biggest investments to protect. Independent business owners, in order to move, would have to increase the size of their business or relocate the whole operation to the new location. Entrepreneurs can be the most flexible and ready to go but often carry the risk of having unproven business skills.
In Frankfort: Until it builds its capacity to support more regionaldrawing businesses, Frankfort should concentrate on independent business owners and entrepreneurs. Committing to this decision can help focus marketing efforts. As these efforts lead to increased pedestrian traffic, the likelihood of attracting regional draws will grow.
The Lone Pioneer Syndrome
After a long dry spell a community may rejoice when a new business, such as a restaurant or coffee shop, finally opens. In their excitement, the new owner may decide to be the only business downtown that’s open evenings or on Saturday.
Sometimes the owner can make it work, but more often they find themselves stranded. There is not enough supporting business to buffer them. If other businesses don’t follow along, the pioneer may have to cut back on hours or days. Some businesses survive the
ECONOMY: PROPOSED IMPROVEMENTS
scale-back and some don’t. Any new business in a fragile economy needs a support system.
Individual businesses left entirely to the mercy of market forces is one reason that many downtowns struggle like they do.
In Frankfort: Restaurants are one of the first types of businesses that can lead to downtown revitalization, and Frankfort is fortunate to have several successful ones already on the square. In that sense, they have paved the way for other new ventures.
Sweeten The Pot
The free market is already at work in Indiana’s towns – it’s done everything it wants to do. If your downtown does not have all the businesses you want, you must change the economics in order to lure new investment.
Offering subsidized buildings, rents, tax abatements or other support can minimize risk and lead to new growth.
In Frankfort: Through building and land acquisition, the city administration is already positioning itself to have a hand in directing downtown development.
Expectation Management
It took decades for most downtowns to sink into underutilization and it will take years to even partially restore them. In some cases it may not be possible at all. An additional miserable thought is the current economy, where frozen credit and the aftermath of a national recession make it even harder for new businesses to launch.
It is important, though, to coldly study these conditions in order to not be discouraged. Simply realizing that it’s a long, steep hill – with guaranteed setbacks - can help the community settle in for the long haul.
PROPOSED IMPROVEMENTS Primary Challenges
As this chapter has shown, many exciting things are happening in Frankfort, but the downtown hasn’t reached that tipping point of sustained revitalization – yet. Here are the main reasons why:
• Competition from Lafayette and other communities. Even steering committee members admitted they do most of their weekend shopping and big nights out in Lafayette, West Lafayette or Indianapolis. Frankfort won’t be able to match those metropolitan areas for selection
• Lack of regional shopping and tourism destinations. Even small towns can compete for visitors if they offer a unique experience or a density of specific shops. For instance, Nashville, IN, is nationally known for its quaint art galleries. In a more recent example close to home, Kirklin is reinventing itself as a regional destination for antiques. So far, Frankfort has not put itself on the “must see” tourism map.
• Capturing the local workforce. About 4,420 people – 21 percent of the county’s workforce – leaves Clinton County each day after work. Additionally, many of those workers – about 36 percent of the county workforce – have manufacturing jobs, which are relatively high paying. That’s a huge loss of people living and raising their families outside Frankfort.
• Chicken vs. Egg: Where to start. People won’t come downtown in large numbers until there is a greater variety of offerings, but shop owners are hesitant to open new businesses until downtown pedestrian traffic picks up. Breaking this deadlock takes a strategic, long-term plan.


