Tom Cohen REALTOR®, CRS, GRI
2425 Canyon Boulevard, Suite 110 Boulder, CO 80302
303.829.6787 TCCohen@BoulderCo.com www.EastBoulderHomes.com
Each Office Independently Owned and Operated
Connect with me on:
Prepared Especially for Jonathan-Thomas and Angela-Marie Williams
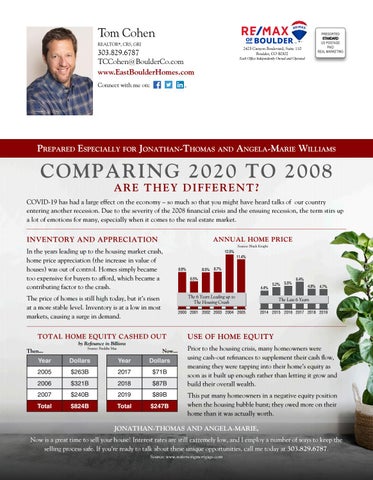
COMPARING 2020 TO 2008 ARE THEY DIFFERENT?
COVID-19 has had a large effect on the economy – so much so that you might have heard talks of our country entering another recession. Due to the severity of the 2008 financial crisis and the ensuing recession, the term stirs up a lot of emotions for many, especially when it comes to the real estate market.
INVENTORY AND APPRECIATION
ANNUAL HOME PRICE
In the years leading up to the housing market crash, home price appreciation (the increase in value of houses) was out of control. Homes simply became too expensive for buyers to afford, which became a contributing factor to the crash. The price of homes is still high today, but it’s risen at a more stable level. Inventory is at a low in most markets, causing a surge in demand. TOTAL HOME EQUITY CASHED OUT by Refinance in Billions
Then...
Source: Freddie Mac
Now...
Year
Dollars
Year
Dollars
2005
$263B
2017
$71B
2006
$321B
2018
$87B
2007
$240B
2019
$89B
Total
$824B
Total
$247B
Source: Black Knight
12.5%
11.4%
8.5% 8.7%
8.6% 6.5%
4.4%
5.2% 5.5%
6.4% 4.8% 4.7%
The 6 Years Leading up to The Housing Crash
The Last 6 Years
2000 2001 2002 2003 2004 2005
2014 2015 2016 2017 2018 2019
USE OF HOME EQUITY Prior to the housing crisis, many homeowners were using cash-out refinances to supplement their cash flow, meaning they were tapping into their home’s equity as soon as it built up enough rather than letting it grow and build their overall wealth. This put many homeowners in a negative equity position when the housing bubble burst; they owed more on their home than it was actually worth.
JONATHAN-THOMAS AND ANGELA-MARIE, Now is a great time to sell your house! Interest rates are still extremely low, and I employ a number of ways to keep the selling process safe. If you’re ready to talk about these unique opportunities, call me today at 303.829.6787. Source: www.watersongmortgage.com
E ast Boulder www.EastBoulderHomes.com
REAL ESTATE MARKET REPORT
SEPTEMBER 2020
If you are thinking of selling, call me at 303.829.6787 for a free, no obligation home assessment.
East Boulder Homes Currently Listed List Status
Street Name
Beds
Total Baths
Estimated Square Feet*
List Price
Active Active
55th Street
4
2
1,800
$774,500
Scenic View Court
3
2
1,400
$800,000
Active
Gallatin Place
5
3
3,500
$1,049,000
Active
Cascade Place
5
4
3,600
$1,250,000
East Boulder Homes Currently Pending List Status
Street Name
Beds
Total Baths
Estimated Square Feet*
List Price
Pending
Waite Drive
4
3
2,400
$899,900
Pending
Hancock Drive
3
3
2,500
$920,000
Pending
Lee Circle
5
5
3,800
$925,000
Pending
Racquet Lane
4
4
3,700
$939,000
Pending
Patton Drive
4
4
3,800
$947,500
Pending
Meadow Glen Drive
3
3
3,000
$950,000
Pending
Lodge Lane
4
3
3,400
$979,000
Pending
Gallatin Place
4
4
3,800
$1,150,000
Pending
Sycamore Avenue
3
3
2,200
$1,150,000
Pending
Euclid Avenue
3
3
2,100
$1,299,000
East Boulder Homes Sold in the Last 60 Days List Status Street Name
Beds
Total Baths
Estimated Square Feet*
List Price
Sold Price
Closing Date
Sold
Waite Drive
4
2
2,000
$849,000
$849,000
07/29/20
Sold
Racquet Lane
4
4
3,200
$949,000
$915,000
07/14/20
Sold
Euclid Place
6
4
4,800
$1,950,000
$1,900,000
07/13/20
Sold
Stonewall Place
3
3
3,100
$859,900
$850,000
07/10/20
Sold
Crescent Drive
4
3
2,300
$959,000
$930,000
07/06/20
Sold
Waite Drive
3
3
2,200
$789,000
$769,500
07/02/20
Sold
Lee Circle
5
3
3,300
$975,000
$1,000,000
07/02/20
Sold
Lodge Court
4
4
3,600
$915,000
$980,000
06/30/20
Sold
Gapter Road
3
2
2,000
$850,000
$895,100
06/26/20
Tom Cohen and RE/MAX of Boulder, Inc. are not in any way affiliated with East Boulder Owners Association, nor is this in any way an official advertisement or publication of East Boulder. Š 2020 All rights reserved. This representation is based on sales and data reported by multiple brokers/agents to the Information and Real Estate Services, LLC (IRES MLS) between June 15th, 2020 and August 14th, 2020. Listings and sales may not be those of RE/MAX of Boulder, Inc. The IRES MLS does not guarantee the accuracy of this data, which may not reflect all the real estate activity in the area. E&OE covered. This market report is not intended to solicit properties already listed for sale nor intended to cause a breach of an existing agency relationship. *Estimated square feet rounded down to the nearest hundred.
Presented by Tom Cohen, Your East Boulder Real Estate Specialist Published by REAL Marketing (REM) | www.REALMarketing4You.com | 858.952.4280 | Š2020