RADHI SHAH
RE/MAX DFW Associates 8100 N. Dallas Parkway Ste. 200 Plano, TX 75024
REALTOR®, ABR West Plano Neighbor
West Plano Homes
Each Office Independently Owned and Operated.
214-435-0771 www.MyWestPlanoHome.com radhishahteam@gmail.com
February 2019 Real Estate Market Report
Published by REAL Marketing (REM) | www.REALMarketing4You.com | 858.952.4280 | © 2019
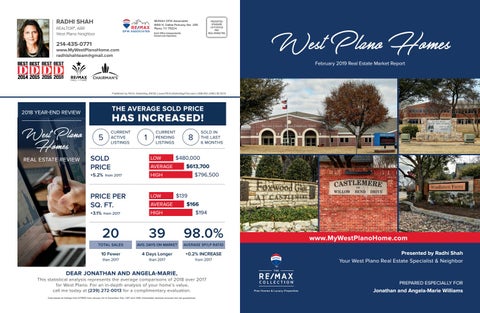
THE AVERAGE SOLD PRICE
2018 YEAR-END REVIEW
West Plano Homes REAL ESTATE REVIEW
HAS INCREASED! 5
CURRENT ACTIVE LISTINGS
1
CURRENT PENDING LISTINGS
SOLD PRICE
LOW
+5.2% from 2017
HIGH
PRICE PER SQ. FT.
LOW
+3.1% from 2017
HIGH
SOLD IN THE LAST 6 MONTHS
8 $480,000
AVERAGE
$613,700 $796,500
$139
AVERAGE
$166 $194
20
39
98.0%
TOTAL SALES
AVG. DAYS ON MARKET
AVERAGE SP/LP RATIO
10 Fewer
4 Days Longer
+0.2% INCREASE
than 2017
than 2017
from 2017
www.MyWestPlanoHome.com Presented by Radhi Shah Your West Plano Real Estate Specialist & Neighbor
DEAR JONATHAN AND ANGELA-MARIE, This statistical analysis represents the average comparisons of 2018 over 2017 for West Plano. For an in-depth analysis of your home’s value, call me today at (239) 272-0013 for a complimentary evaluation. Data based on listings from NTREIS from January 1st to December 31st, 2017 and 2018. Information deemed accurate but not guaranteed.
PREPARED ESPECIALLY FOR
Jonathan and Angela-Marie Williams
RADHI SHAH
DO YOU KNOW YOUR HOME'S TRUE VALUE?
REALTOR , ABR West Plano Neighbor
JONATHAN AND ANGELA-MARIE,
®
Receive the most accurate assessment of your home's value, provided to you as a complimentary service by Radhi, your West Plano real estate specialist.
214-435-0771 radhishahteam@gmail.com www.MyWestPlanoHome.com
Serving the Dallas-Fort Worth Area for Over 18 Years
West Plano Homes
You will not be contacted with any other solicitation.
W W W. M Y W E S T P L A N O H O M E . C O M
Real Estate Market Report
DEAR JONATHAN AND ANGELA-MARIE, This market report was created especially for you. For a more in-depth, comparative market analysis, contact me today at 214-435-0771 or visit www.MyWestPlanoHome.com.
CURRENT MARKET ACTIVITY
Homes Currently Listed in Your Area Status
Street Name
Subdivision
Beds
Total Baths
Estimated Square Feet*
Pool
List Price
Active Active Active Active
Beth Drive Dorset Drive Yeary Road Fossil Ridge Drive
Castlemere Windhaven Windhaven Windhaven
4 5 4 4
3.0 4.0 3.0 4.0
3,100 3,500 3,400 2,900
No No No Yes
$500,000 $500,000 $504,000 $539,999
Active
Masterson Drive
Windhaven
4
4.0
4,000
No
$675,000
Active Pending Sold A visual representation of the data on the left. For more information
There is currently 1 pending home in West Plano. For more information about this or any other listings, please contact me today at 214-435-0771.
or additional statistics, please contact me. ©Google 2019
Homes Sold in the Last 6 Months in Your Area Estimated Total Baths Square Feet*
Status Address
Subdivision
Beds
Pool
List Price
Sold Date
Sold
5629 Hillsborough Drive
Castlemere
4
3.1
3,100
Yes
$589,000
08/03/18
Sold Sold
5928 Henley Drive 5745 River Rock Lane
Huntingdon Green Windhaven
4 4
3.0 3.1
3,100 4,400
No Yes
$499,950 $650,000
10/10/18 01/11/19
Sold Sold
5757 Yeary Road 5817 Farr Oak Drive
Windhaven Windhaven
5 4
4.0 3.0
4,100 3,400
Yes Yes
$635,000 $638,000
12/13/18 09/06/18
Sold Sold Sold
5809 Yeary Road 5804 Ridgehaven Drive 5744 Misted Breeze Drive
Windhaven Windhaven Windhaven
4 5 5
4.0 4.1 4.1
3,900 3,900 3,800
Yes Yes Yes
$585,000 $639,000 $649,900
08/28/18 08/09/18 07/26/18
Homes sold in the last 6 months received an average of 98.1% of their asking price. Radhi Shah, The RE/MAX Collection and RE/MAX DFW Associates are not in any way affiliated with West Plano Owners Association, nor is this in any way an official advertisement or publication of West Plano. © 2019 All rights reserved. This representation is based on sales and data reported by multiple brokers/agents to the NTREIS between July 18th, 2018 and January 18th, 2019. Listings and sales may not be those of RE/MAX DFW Associates. The NTREIS does not guarantee the accuracy of this data, which may not reflect all the real estate activity in the area. E&OE covered. This market report is not intended to solicit properties already listed for sale nor intended to cause a breach of an existing agency relationship. *Square feet rounded down to nearest hundred.
CURRENT MARKET STATISTICS Average Active List Price
Average Sold Price per Square Foot
$543,800 $162
8
98.2%
45
Total Homes Recently Sold
Average Sold Price/List Price Ratio
Average Days on Market (Solds)
Reflects MLS data on left page. Deemed accurate but not guaranteed.