3350 Midtown Place Anchorage, AK 99503 Each office independently owned and operated.
Sara Sturgeon
Michelle Webb
REALTOR ® | ABR
REALTOR ® | CRS, ABR
(907) 317-0685
(907) 242-5252
sturgeonakhomes@gmail.com
webbakhomes@gmail.com
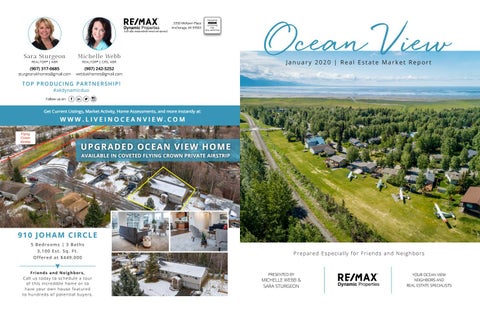
Ocean View January 2020 | Real Estate Market Report
TOP PRODUCING PARTNERSHIP! #akdynamicduo
Follow us on:
Get Current Listings, Market Activity, Home Assessments, and more instantly at:
WWW.LIVEINOCEANVIEW.COM
UPGR AD ED OCEAN VI EW HOM E AVAILABLE IN COVETED FLYING CROWN PRIVATE AIRSTRIP
910 JOHAM CIRCLE 5 Bedrooms | 3 Baths 3,100 Est. Sq. Ft. Offered at $449,000 Friends and Neighbors, Call us today to schedule a tour of this incredible home or to have your own house featured to hundreds of potential buyers.
Prepared Especially for Friends and Neighbors
PRESENTED BY
MICHELLE WEBB & SARA STURGEON
YOUR OCEAN VIEW NEIGHBORS AND REAL ESTATE SPECIALISTS
Ocean View
W H AT I S Y O U R H O M E W O R T H ?
CURRENT MARKET ACTIVITY
Sara Sturgeon
Michelle Webb
REALTOR ® | ABR
REALTOR ® | CRS, ABR
J A N U A RY 2 0 2 0
(907) 317-0685
(907) 242-5252
sturgeonakhomes@gmail.com
webbakhomes@gmail.com
Receive the most accurate assessment of your home’s value, provided to you as a complimentary service by Michelle and Sara, your Ocean View real estate specialists. You will not be contacted with any other solicitation.
www.LiveInOceanView.com
www.LiveInOceanView.com
OCEAN VIEW 2019 MARKET OVERVIEW
6 HOMES LISTED IN OCEAN VIEW Street Name
Bedrooms
Total Baths
Est. Square Feet*
List Price
Active
Nora Drive
3
2.50
1,900
$365,000
Active
Mariner Drive
4
3.00
2,000
$390,000
Active
Galleon Drive
4
2.50
2,500
$409,500
Active
Mariner Drive
3
2.50
2,500
$429,000
Active
Joham Circle
5
3.00
3,100
$449,000
Active
Oomiak Circle
5
3.50
3,500
$598,500
Bedrooms
Total Baths
Est. Square Feet*
AVERAGE SALE PRICE
AVERAGE SALE PPSF*
AVERAGE LIST PRICE
AVERAGE DOM**
0
NA
NA
NA
NA
Q2 2018
3
$371,667
$178
$381,000
11
Q3 2018
11
$427,673
$194
$433,982
29
Q4 2018
10
$381,940
$174
$386,060
77
Sold Date
Q1 2019
4
$336,500
$165
$346,200
36
4
$374,725
$189
$373,475
22
Q1 2018
Sold Price
17 $376,118 $178
Number of Sales Average Sale Price Average Sale PPSF*
# OF SALES
17 HOMES SOLD IN OCEAN VIEW (LAST 12 MONTHS) Address
6 $440,167 $173
2-YEAR MARKET PERFORMANCE QUARTER
0 HOMES PENDING IN OCEAN VIEW
Status
Active Listings Average List Price Average List PPSF*
Sold
12942 Nora Drive
3
3.00
1,800
$324,000
12/17/19
Q2 2019
Sold
13146 Beach Circle
3
3.00
3,600
$505,000
11/15/19
Q3 2019
4
$397,475
$191
$402,200
51
Q4 2019
5
$391,840
$168
$396,980
64
721 Lighthouse Court
3
2.50
2,100
$376,000
11/05/19
Sold
611 High View Drive
3
2.00
2,200
$404,200
11/05/19
Sold
540 High View Drive
4
2.00
2,200
$350,000
11/01/19
Sold
620 Clipper Ship Court
3
2.50
2,600
$414,900
09/04/19
Sold
830 Breakwater Circle
3
2.50
2,000
$405,000
08/26/19
Sold
13000 Nora Drive
4
2.50
2,000
$390,000
08/16/19
Sold
901 Lighthouse Court
3
2.50
1,900
$380,000
07/16/19
Sold
811 Harbor Circle
3
2.50
2,300
$389,900
06/27/19
Sold
220 Galleon Drive
3
2.00
1,600
$338,000
06/18/19
Sold
300 Mariner Drive
3
2.50
2,200
$380,000
05/24/19
Sold
12911 Admiralty Place
4
3.00
2,000
$391,000
05/17/19
Sold
631 High View Drive
3
2.00
1,800
$345,000
03/28/19
Sold
211 High View Drive
4
2.00
2,000
$318,000
03/19/19
Sold
421 Kayak Drive
4
3.00
2,000
$343,000
02/08/19
Sold
371 Oceanview Drive
4
2.00
2,500
$340,000
01/09/19
$450,000
12
$400,000 10 $350,000 $300,000
8
# OF SALES
Sold
$250,000 6 $200,000 $150,000
4
$100,000 2 $50,000 $0
0 Q1 2018
Q2 2018
Q3 2018
Q4 2018 # OF SALES
Michelle Webb, Sara Sturgeon, and RE/MAX Dynamic Properties are not in any way affiliated with Ocean View Owners Association, nor is this in any way an official advertisement or publication of Ocean View. ©2020 All rights reserved. This representation is based on sales and data reported by multiple brokers/agents to the AKMLS from January 8th, 2019 to January 8th, 2020. Listings and sales may not be those of RE/MAX Dynamic Properties. The AKMLS does not guarantee the accuracy of this data, which may not reflect all of the real estate activity in the area. E&OE covered. This market report is not intended to solicit properties already listed for sale nor intended to cause a breach of an existing agency relationship. *Square feet rounded down to nearest hundred.
Q1 2019
Q2 2019
Q3 2019
Q4 2019
AVERAGE SALE PRICE
Data based on listings from AKMLS from January 1st to December 31st, 2018 and 2019. Information deemed accurate but not guaranteed. * PPSF - Price Per Square Foot & **DOM - Days on Market Published by REAL Marketing (REM) | www.REALMarketing4You.com | 858.952.4280 | ©2020
AVERAGE SALE PRICE
Status