2315 Sagramore Place Cape Coral, FL 33914
John J. Milaski LLC Broker Associate
Mobile: 239.314.8016 jmilaski@miloffaubuchonrealty.com capeharbourhomes.com
A W O R D F R O M YO U R RE ALT OR ®
John J. Milaski Hello Cape Harbour Homeowners! As your local real estate expert, I feel that providing you with updated information about the real estate activity in our neighborhood is one of the best services I can provide. You deserve to know what’s happening in the market. This market report will feature current activity, featured listings, sold information, real estate news, and more. When the time comes for
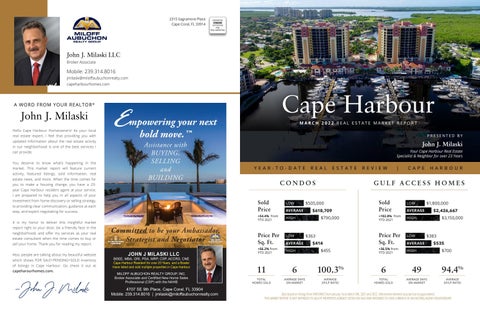
Cape Harbour
Empowering your next
MARCH 2022 REAL ESTATE MARKET REPORT
bold move.™ Assistance with BUYING, SELLING and BUILDING
PRESENTED BY
John J. Milaski Your Cape Harbour Real Estate Specialist & Neighbor for over 23 Years
YEAR-TO-DATE
REAL
ESTATE
CONDOS
you to make a housing change, you have a 23-
REVIEW
|
CAPE
HARBOUR
GULF ACCESS HOMES
year Cape Harbour resident agent at your service. I am prepared to help you in all aspects of your investment from home discovery or selling strategy,
Sold Price
to providing clear communication, guidance at each step, and expert negotiating for success.
+54.4% from YTD 2021
It is my honor to deliver this insightful market report right to your door, be a friendly face in the neighborhood, and offer my services as your real estate consultant when the time comes to buy or sell your home. Thank you for reading my report. Also, people are talking about my beautiful website which shows FOR SALE+PENDING+SOLD inventory of listings in Cape Harbour. Go check it out at capeharourhomes.com.
-John J. Milaski
Committed to be your Ambassador, Strategist and Negotiator JOHN J MILASKI LLC
BSEE, MBA, GRI, PSA, MRP, CSP, ACCRS, CNE Cape Harbour Resident for over 23 Years, and a Boater Have listed and sold multiple properties in Cape Harbour MILOFF AUBUCHON REALTY GROUP, INC. Broker Associate and Certified New Home Sales Professional (CSP) with the NAHB
4707 SE 9th Place, Cape Coral, FL 33904 Mobile: 239.314.8016 | jmilaski@miloffaubuchonrealty.com
Price Per Sq. Ft. +56.2% from YTD 2021
LOW AVERAGE
$505,000 $618,709 $790,000
HIGH
LOW AVERAGE HIGH
$363 $414 $455
Sold Price +102.8% from YTD 2021
Price Per Sq. Ft. +36.5% from YTD 2021
LOW
$1,800,000
AVERAGE
$2,426,667 $3,150,000
HIGH
LOW
$383
AVERAGE HIGH
$535 $700
11
6
100.3%
6
49
94.4%
TOTAL HOMES SOLD
AVERAGE DAYS ON MARKET
AVERAGE SP/LP RATIO
TOTAL HOMES SOLD
AVERAGE DAYS ON MARKET
AVERAGE SP/LP RATIO
Data based on listings from SWFLAMLS from January 1st to March 9th, 2021 and 2022. Information deemed accurate but not guaranteed. THIS MARKET REPORT IS NOT INTENDED TO SOLICIT PROPERTIES ALREADY LISTED FOR SALE NOR INTENDED TO CAISE A BREACH OF AN EXISTING AGENCY RELATIONSHIP.
Cape Harbour
If you would like a FREE, no obligation market analysis for your property, please call me today at 239.314.8016.
MARCH 2022 REAL ESTATE MARKET REPORT
JOHN J. MILASKI | 239.314.8016 | JMILASKI@MILOFFAUBUCHONREALTY.COM | VISIT: CAPEHARBOURHOMES.COM
CONDOS LUXURY CONDOS RECENTLY SOLD
G U L F A C C E S S S I N G L E - F A M I LY H O M E S |
AS OF 03/09/2022
GULF ACCESS HOMES RECENTLY SOLD
MARINA VIEW CONDOS ADD RE S S
B ED S
B A TH S
E S T . S Q. F T .
5706 Cape Harbour Drive #210
2
2.0
1,600
$639,000
5702 Cape Harbour Drive #302
2
2.0
1,600
$635,000
5706 Cape Harbour Drive #410
2
2.0
1,600
5702 Cape Harbour Drive #203
2
2.0
1,600
5706 Cape Harbour Drive #310
2
2.0
5706 Cape Harbour Drive #311
2
2.0
5704 Cape Harbour Drive #106
2
5706 Cape Harbour Drive #112
3
$325
S OL D DA T E
DO M
$399
03/01/22
1
$397
02/22/22
2
$589,000
$368
11/05/21
$560,000
$350
08/31/21
1,600
$615,000
$384
08/04/21
1,600
$590,000
$369
07/13/21
2.0
1,702
$631,000
$371
2.0
2,454
$880,000
$359
$369
$344
S OL D P RIC E P RIC E P E R S Q. F T .
B E DS
B A T HS
E ST . SQ . FT .
2138 El Dorado Parkway W
3
4.1
2,985
$2,015,000
$675
03/09/22
26
5502 Harbour Preserve Circle
6
7.2
7,925
$3,150,000
$397
03/01/22
229
33
1921 Harbour Preserve Circle
3
3.2
3,571
$2,500,000
$700
01/31/22
9
35
5502 Merlyn Lane
5
4.1
4,951
$2,195,000
$443
01/28/22
10
7
2128 El Dorado Parkway W
4
3.2
4,694
$1,800,000
$383
01/14/22
18
5
5522 Harbour Preserve Circle
4
5.1
4,738
$2,900,000
$612
01/04/22
0
06/28/21
3
1928 El Dorado Parkway W
3
3.0
2,397
$1,200,000
$501
12/30/21
93
06/21/21
4
5705 Harbour Preserve Circle
4
3.1
2,982
$1,465,000
$491
11/30/21
5
A DDR E SS
APR
MAY
JUN
JUL
AUG
$0
$0
SEP
OCT
NOV
$0
$0
DEC
JAN
$399
B ED S
B A TH S
E S T . S Q. F T .
5781 Cape Harbour Drive #903
2
2.0
1,276
$549,900
5793 Cape Harbour Drive #713
2
2.0
1,276
$552,000
5781 Cape Harbour Drive #909
3
2.0
1,737
5781 Cape Harbour Drive #703
2
2.0
5793 Cape Harbour Drive #616
2
5781 Cape Harbour Drive #1410 5781 Cape Harbour Drive #1109 5781 Cape Harbour Drive #1509
FEB
MAR
MAR
$296
$343
S OL D DA T E
DO M
$431
03/07/22
8
$433
03/01/22
0
$695,000
$400
02/24/22
7
1,276
$529,900
$415
02/04/22
5
2.0
1,393
$580,000
$416
02/03/22
5
3
2.0
1,544
$699,995
$453
01/31/22
3
3
2.0
1,737
$630,000
$363
01/28/22
2
2
2.0
1,737
$790,000
$455
01/26/22
24
$336
$363
$334
S OL D P RIC E P RIC E P E R S Q. F T .
$338
$340
$413
$417
$411
APR
MAY
JUN
JUL
AUG
OCT
NOV
$531
$587
$587
$558
$498
$536
$535
$501
$0
APR
MAY
JUN
JUL
AUG
SEP
OCT
NOV
DEC
JAN
FEB
MAR
DEC
JAN
FEB
MAR
|
HOMES SOLD
$3,500,000
$1,282,500
$1,107,500 6
$1,495,000
$1,400,000
$1,595,000
$1,917,500
$1,782,500
$2,582,500
$2,347,500 $1,200,000
$0
$0
4 2
2 1
1
1
2
1
2 1
0 Mar-21
SEP
$564
$459
MEDIAN SOLD PRICE
$432
$0 MAR
DOM
DATA BELOW SHOWING ALL SINGLE FAMILY HOMES SOLD BETWEEN 03/01/2021 - 03/09/2022
MONTHLY HISTORY OF AVERAGE PRICE PER SQUARE FOOT BETWEEN 03/01/2021 & 03/09/2022
$278
SOLD DATE
$0
MARINA SOUTH I & II CONDOS ADD RE S S
SO LD PR I CE PR I C E PER SQ. F T.
MONTHLY HISTORY OF AVERAGE PRICE PER SQUARE FOOT BETWEEN 03/01/2021 & 03/09/2022
$412
$0 MAR
$397
$368
$367
AS OF 03/09/2022
GULF ACCESS SINGLE FAMILY HOMES
MONTHLY HISTORY OF AVERAGE PRICE PER SQUARE FOOT BETWEEN 03/01/2021 & 03/09/2022
$285
|
Apr-21
0 May-21
Jun-21
Jul-21
Aug-21
Sep-21
Oct-21
Nov-21
Dec-21
Jan-22
Feb-22
Mar-22
John Milaski and Miloff Aubuchon are not in any way affiliated with Cape Harbour Home Owners Association, nor is this in any way an official advertisement or publication of Cape Harbour. © 2022 All rights reserved. This representation is based on sales and data reported by multiple brokers/agents to the SWFLAMLS as of March 9th, 2022. All listings and sales presented anywhere in this report may not be those of Miloff Aubuchon. The SWFLAMLS does not guarantee the accuracy of this data, which may not reflect all the real estate activity in the area. E&OE covered. This market report is not intended to solicit properties already listed for sale nor intended to cause a breach of an existing agency relationship. Published by REAL Marketing (RM) | www.REALMarketing4You.com | 858.952.4280 | © 2022