CHARLES FISHER
1401 Highland Avenue Manhattan Beach, CA 90266 Each Office Independently Owned and Operated.
REALTOR® | CalBRE# 01731424
INVESTMENT PROPERTY REPORT
310-902-7214
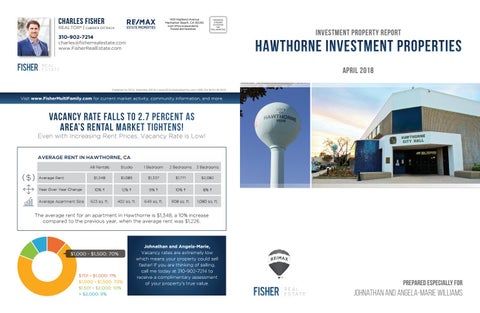
HAWTHORNE INVESTMENT PROPERTIES
charles@fisherrealestate.com www.FisherRealEstate.com
APRIL 2018 Published by REAL Marketing (REM) | www.REALMarketing4You.com | 858.254.9619 | © 2018
Visit www.FisherMultiFamily.com for current market activity, community information, and more.
vacancy rate falls to 2.7 percent as area’s rental market tightens! Even with Increasing Rent Prices, Vacancy Rate is Low!
AVERAGE RENT IN HAWTHORNE, CA All Rentals
Studio
1 Bedroom
2 Bedrooms
3 Bedrooms
Average Rent
$1,348
$1,085
$1,337
$1,771
$2,082
Year Over Year Change
10% h
12% h
9% h
10% h
8% h
Average Apartment Size
623 sq. ft.
402 sq. ft.
649 sq. ft.
908 sq. ft.
1,080 sq. ft.
The average rent for an apartment in Hawthorne is $1,348, a 10% increase compared to the previous year, when the average rent was $1,226.
$1,000 - $1,500: 70%
$701 - $1,000: 11% $1,000 - $1,500: 70% $1,501 - $2,000: 10% > $2,000: 9%
Johnathan and Angela-Marie, Vacancy rates are extremely low which means your property could sell faster! If you are thinking of selling, call me today at 310-902-7214 to receive a complimentary assessment of your property’s true value.
PREPARED ESPECIALLY FOR
Johnathan and Angela-Marie Williams
CHARLES FISHER
HAWTHORNE INVESTMENT PROPERTIES
REALTOR® | CalBRE# 01731424
310-902-7214 charles@fisherrealestate.com www.FisherRealEstate.com
Johnathan and Angela-Marie, Selling an investment property in Hawthorne requires extensive local knowledge, a great marketing plan, and superior negotiation skills. As an experienced agent and Hawthorne Investment Property specialist, I am uniquely qualified to help you receive top dollar for your property. Call me today at 310-902-7214.
BUY - SELL - EXCHANGE INCOME PROPERTY REPORT
Hawthorne Investment Property Market Report
15 INVESTMENT PROPERTIES LISTED IN YOUR AREA
Active Status
Number Of Units Total
Year Built
List Price
List Date
Active Active Active Active Active Active Active Active Active Active Active Active Active Active Active
2 2 2 2 2 4 4 3 4 4 4 3 10 6 10
1954 1965 1944 1941 2016 1947 1984 1940 1952 1953 1962 1988 1986 1961 1990
$539,000 $736,000 $819,900 $820,000 $895,000 $899,000 $919,000 $925,000 $950,000 $1,250,000 $1,449,000 $1,599,000 $1,995,000 $2,250,000 $2,999,000
01/18/18 02/02/18 03/08/18 03/12/18 01/02/18 03/06/18 01/09/18 02/06/18 02/17/17 12/14/17 01/30/18 03/07/18 02/26/18 01/08/18 09/17/17
Pending Sold A visual representation of the MLS data on the left. For more information or additional statistics, call us.
There are currently 12 investment properties pending in your area. For more information on any of these listings, please call me.
5 INVESTMENT PROPERTIES SOLD IN THE LAST 30 DAYS IN YOUR AREA Status
Address
Sold Sold Sold Sold Sold
4494 131st Street 4307 142nd Street 12821 Doty Avenue 11829 Truro Avenue 11823 Truro Avenue
Number Of Units Total
Year Built
List Price
List Date
Close Price
Close Date
3 15 2 4 4
1913 1986 1973 1956 1956
$849,999 $2,995,000 $690,000 $775,000 $775,000
01/18/18 12/18/17 01/23/18 01/05/18 01/05/18
$919,005 $2,900,000 $700,000 $770,000 $770,000
03/15/18 02/28/18 02/27/18 02/16/18 02/16/18
Charles Fisher, and RE/MAX Estate Properties are not in any way affiliated with any Hawthorne Homeowners Associations, nor is this in any way an official advertisement or publication of Hawthorne. © 2018 All rights reserved. This representation is based on data reported from February 11th, 2018 through March 16th, 2018 by multiple brokers/agents to the Combined Los Angeles/Westside MLS (CLAW). This information is not intended to represent any existing listings but is general marketing information based on CLAW data, however, neither RE/MAX Estate Properties, nor the CLAW MLS guarantees the accuracy of this data, which may not reflect all of the real estate activity in the area. E&OE. This market report is not intended to solicit properties already listed for sale nor is it intended to cause or induce a breach of an existing agency agreement.
© 2018 Google
AT A GLANCE PAST 30 DAYS
AVERAGE ACTIVE LIST PRICE $1,269,660
AVERAGE SOLD PRICE $1,211,801
AVERAGE SP/LP RATIO 101%
AVERAGE DAYS ON MARKET (SOLDS) 11